Historical Context of Atlantic Inactivity as Pacific goes bonkers with El Niño

Welcome to 2 New Subscribers to Weather Trader and 2 annual renewals! Our exceptional growth continues, and is picking up as we head into the expected wild El Niño winter. I am excited to show off everything we’ve developed for winter weather, and then create more new/novel/unique/fun maps and interactive data platforms. Upgrade to Founder would be very appreciated to help accelerate my efforts! I will do a blog on Weather Trader forecasting platform in coming days to explain how I am trying to beat the markets with the best forecasts.
2026 North Atlantic Hurricane Season — Climate Atlas
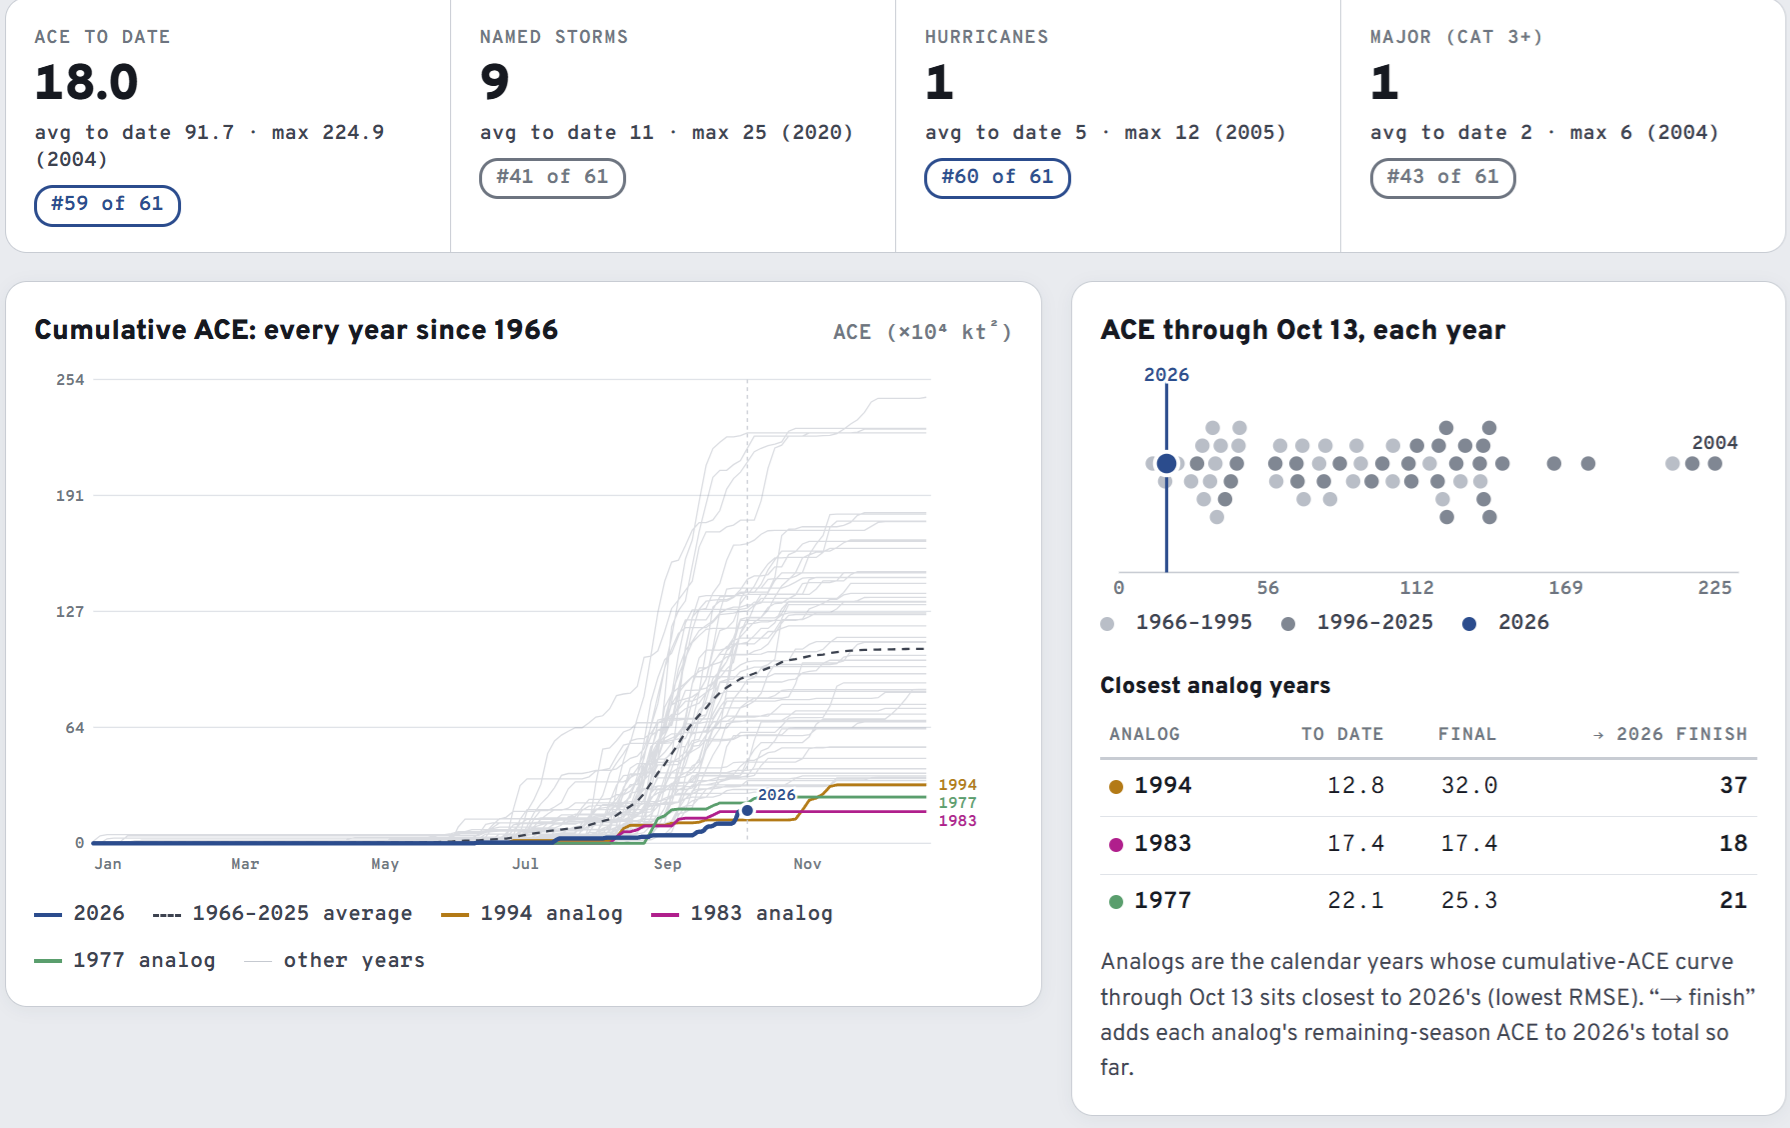
Major Hurricane Isaias made landfall in the Florida panhandle near Destin and proved the point made during every otherwise quiet hurricane season: it only takes one. That’s of course true in busy years as well, which may not feature a major landfall. So, we have a strong El Niño and also a major hurricane landfall in the Gulf in early October — certainly unexpected. And, the hurricane season is not over, of course.
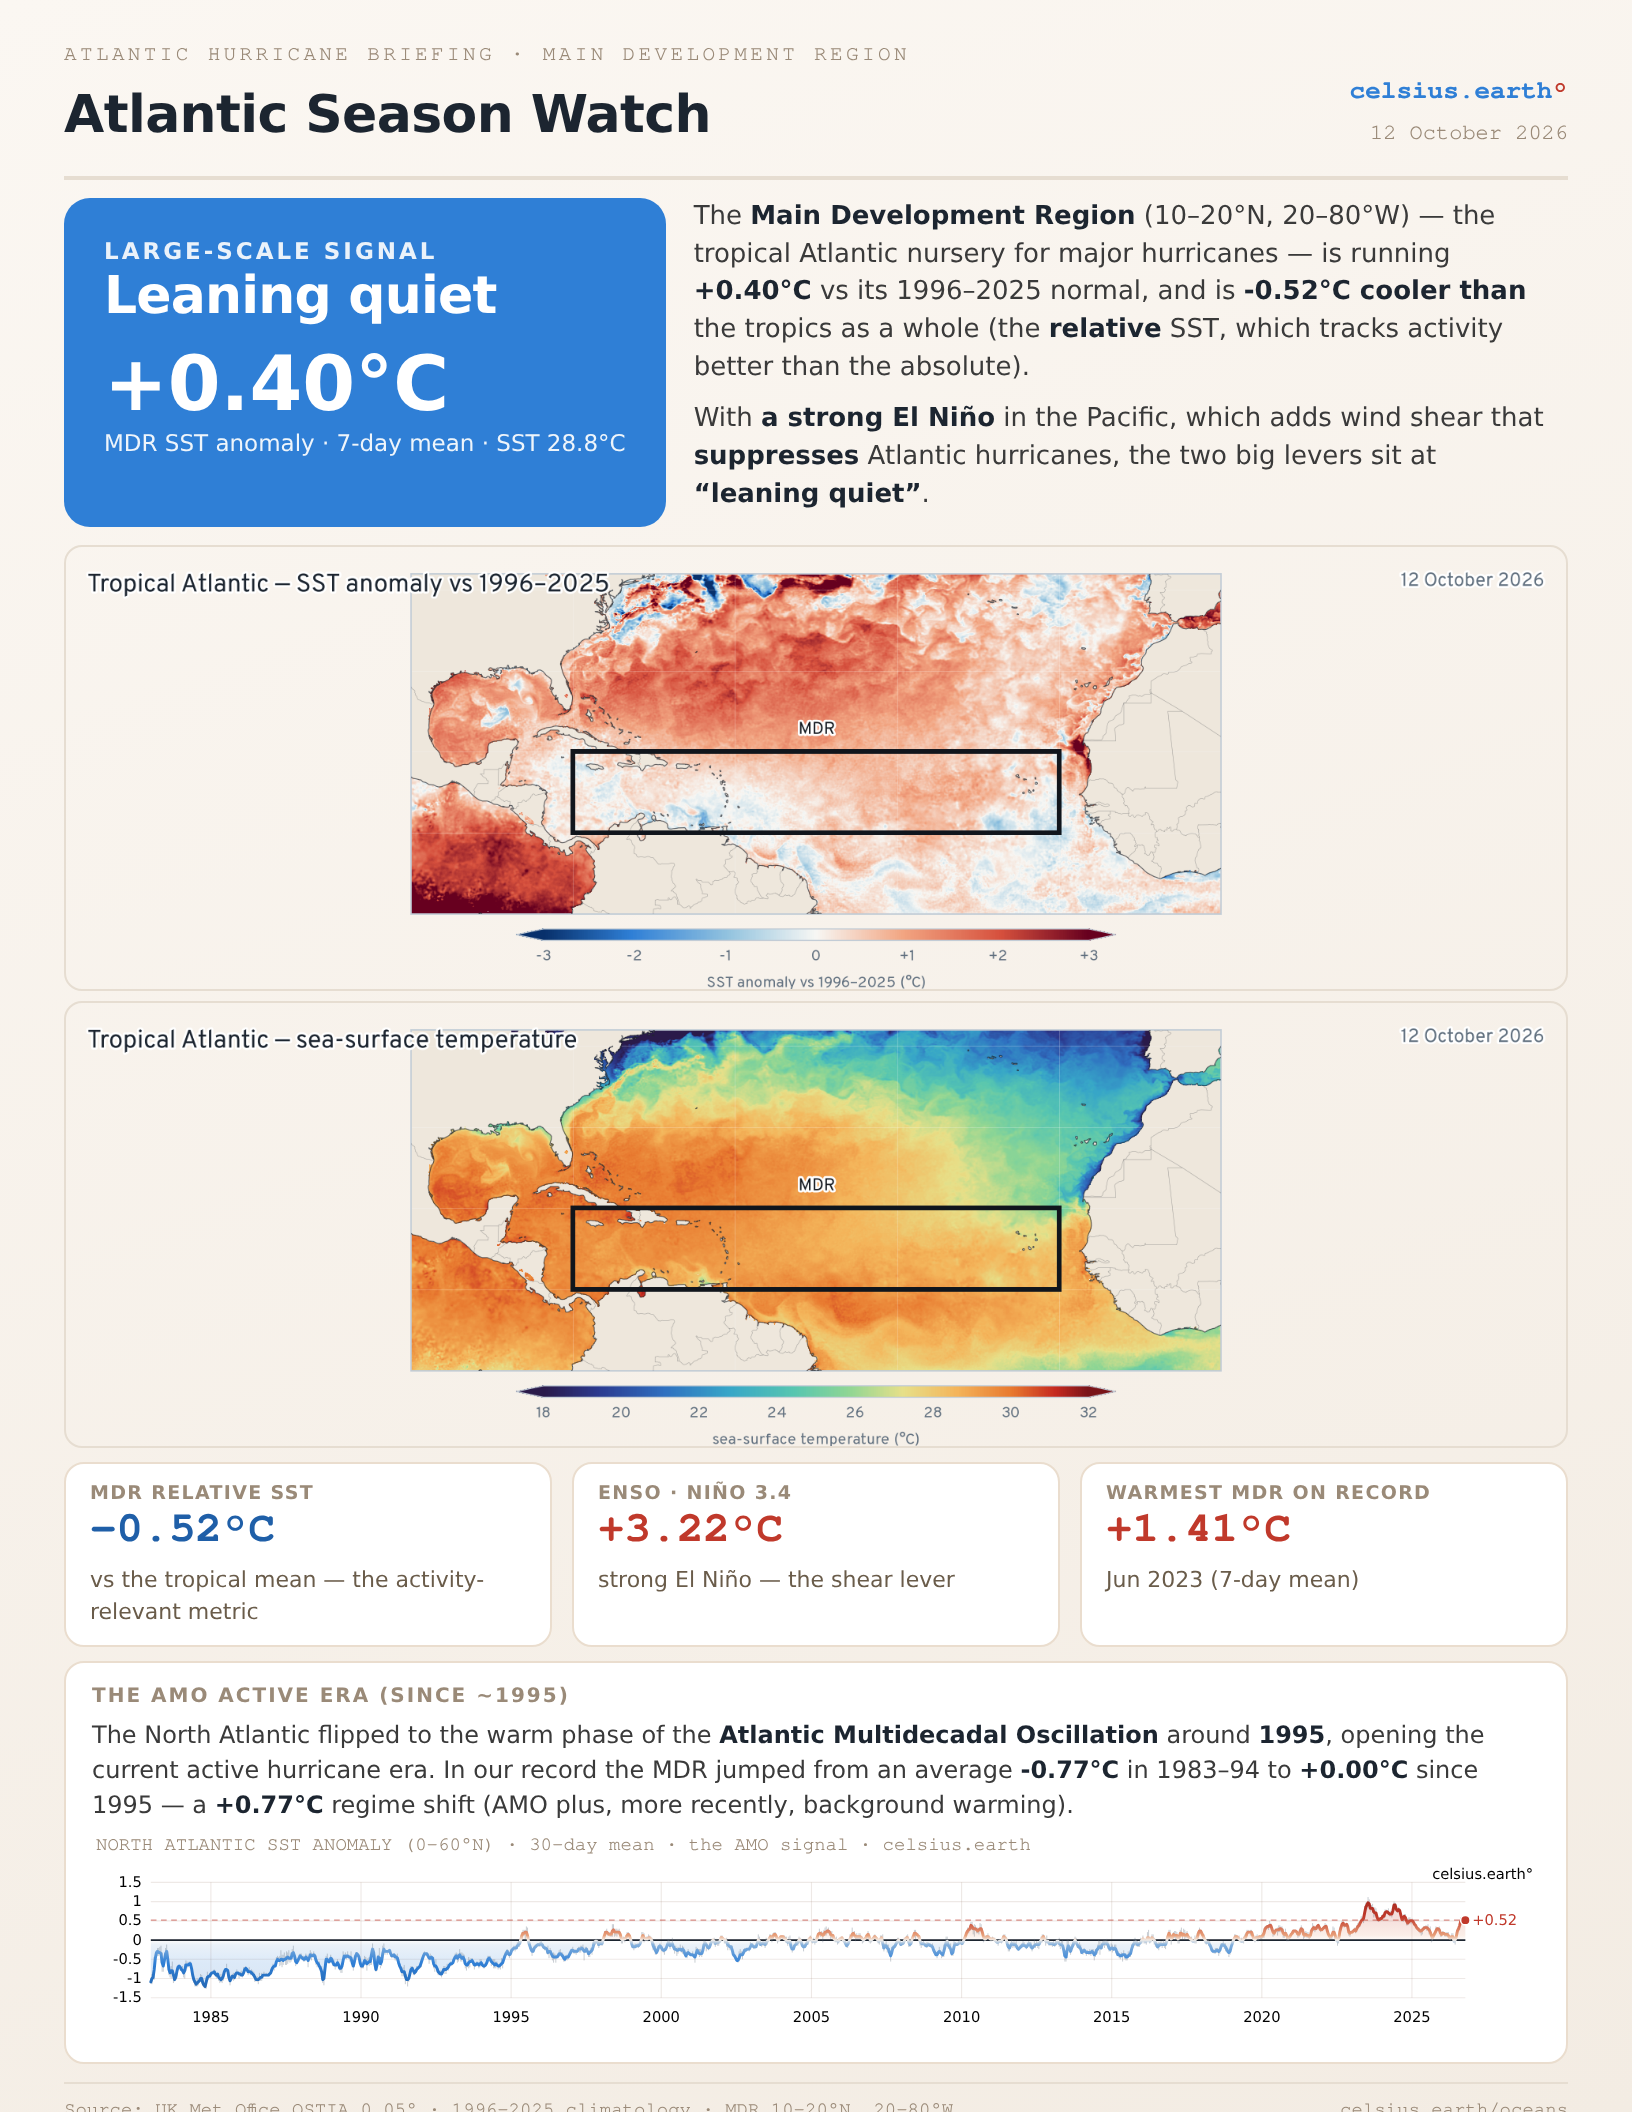
El Niño has reached “super status” or “very strong” well over +3°C on top of the 1996-2025 baseline with astounding warmth to the coast of South America. Briefing from our Celsius Earth Oceans site.
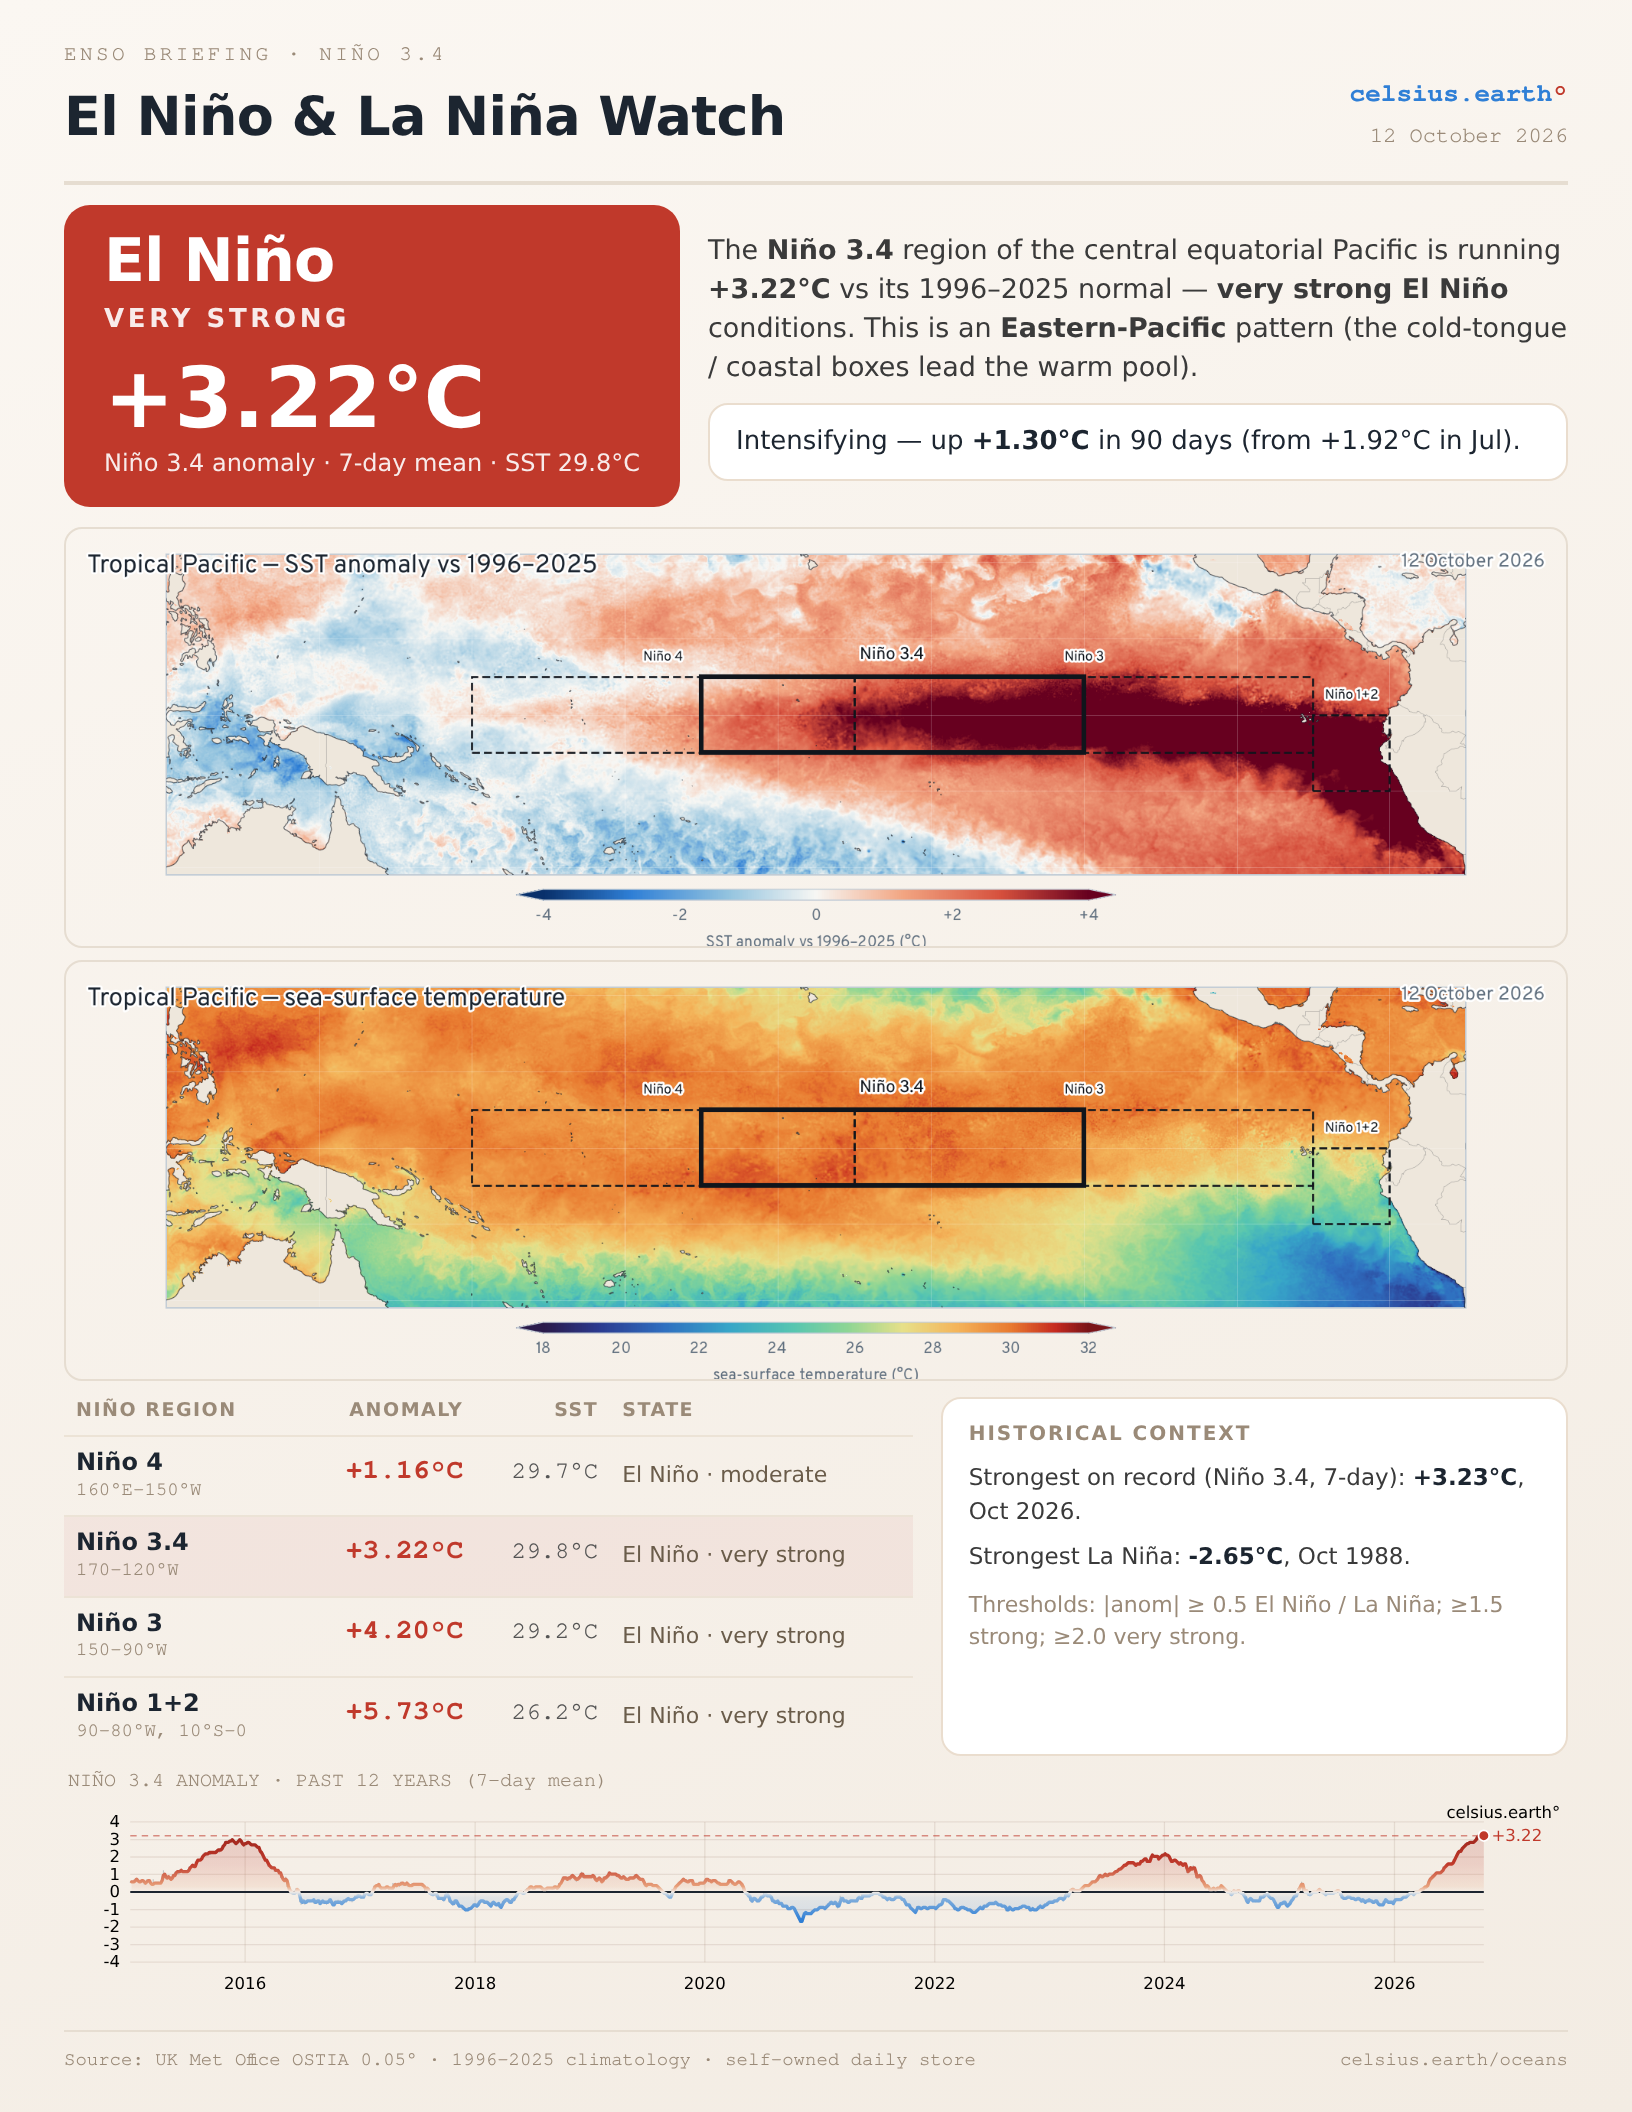
Worth pointing out that the strongest La Niña was -2.65°C (below normal) in October 1988 (against the same 30-year baseline). So, the range of Niño 3.4 is almost 6°C.
Hence, it’s the El Niño Southern Oscillation — and normal may not be the best description of the Pacific equatorial tropics at all. Instead, we have a shifting and sinking/emergency of water like a giant pump. Heading into the Winter of 2026-27, we can expect the Niño to peak in December and then slowly wane, but affect the weather worldwide.
Getting back to the North Atlantic, we can get a first guess about the hurricane season from various El Niño indices … here is NOAA’s ONI (Oceanic Niño Index) which is Niño 3.4 averaged over 3-months vs. the Accumulated Cyclone Energy (ACE) index — my favorite metric of global (and Atlantic) hurricane activity. In the Atlantic, an average/median year is around 100-110 units — calculated by summing the square of the reported wind speed every 6-hours and divided by 10,000.
So, 100 knots = Category 3 = 100*100/10000 * 4 six-hour periods = ACE of 4 units per day. We’re only at 18 for the North Atlantic — while the Eastern Pacific has zoomed past 320 — and goes higher — as I mentioned yesterday.
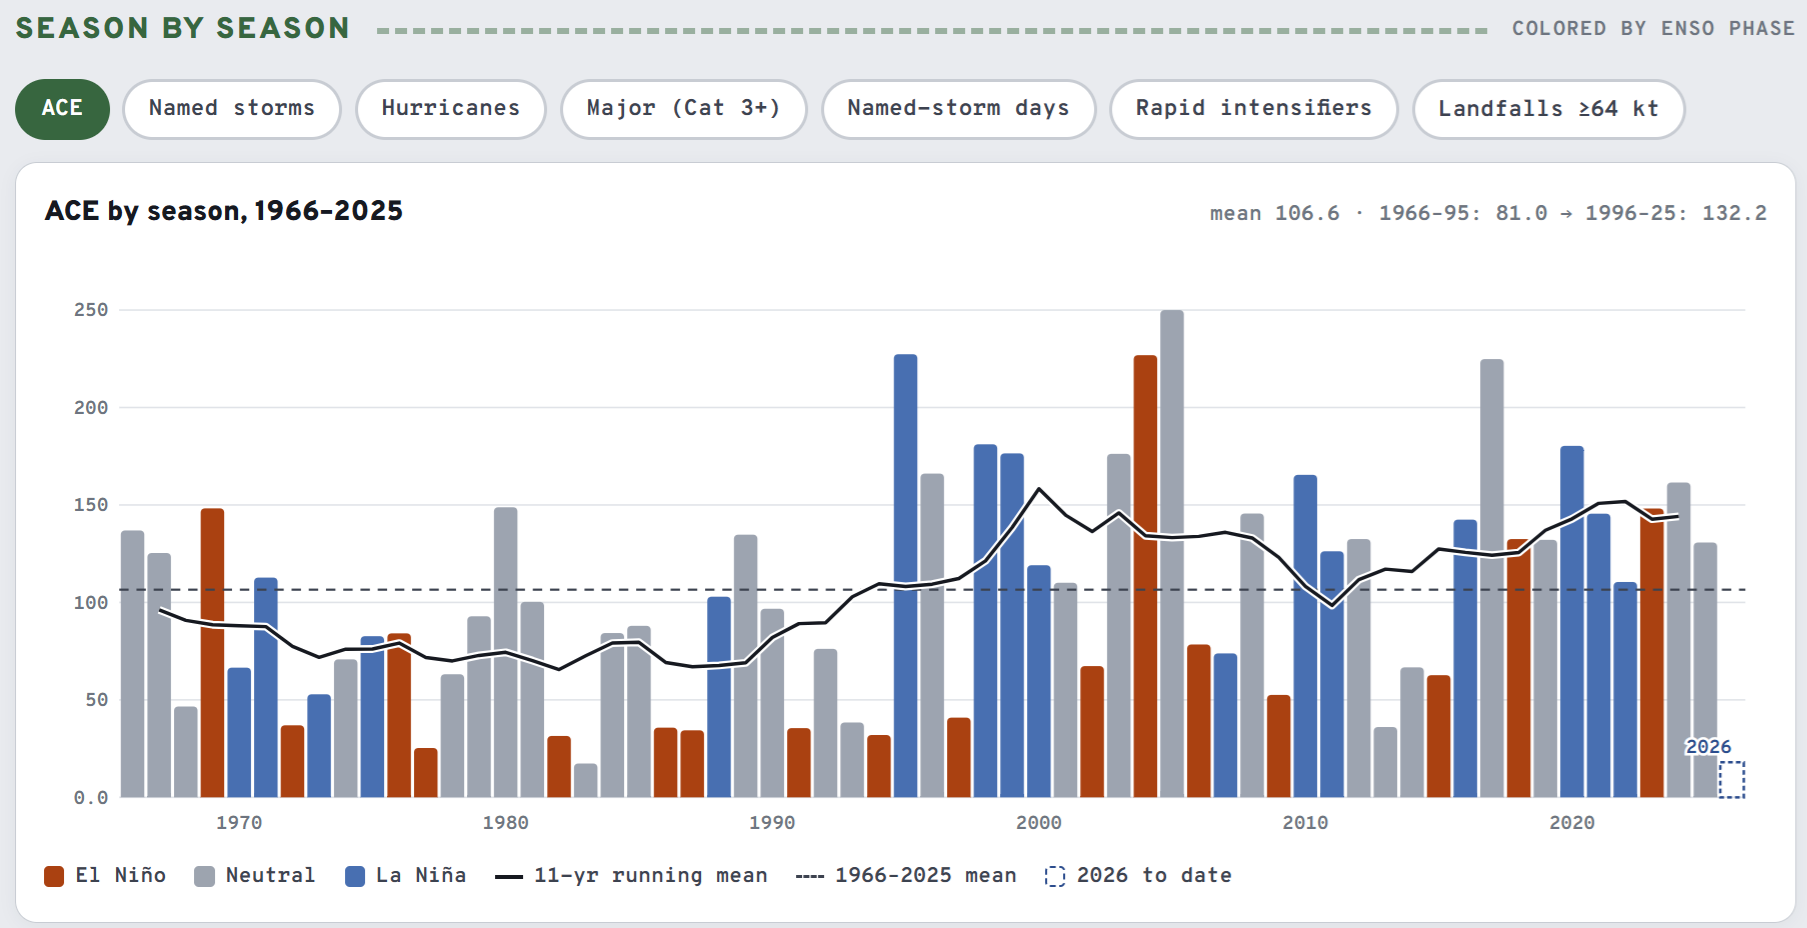
Not every El Niño defined year is dead e.g. 2023, but other things were going on 3-years ago (warm Atlantic, volcano)
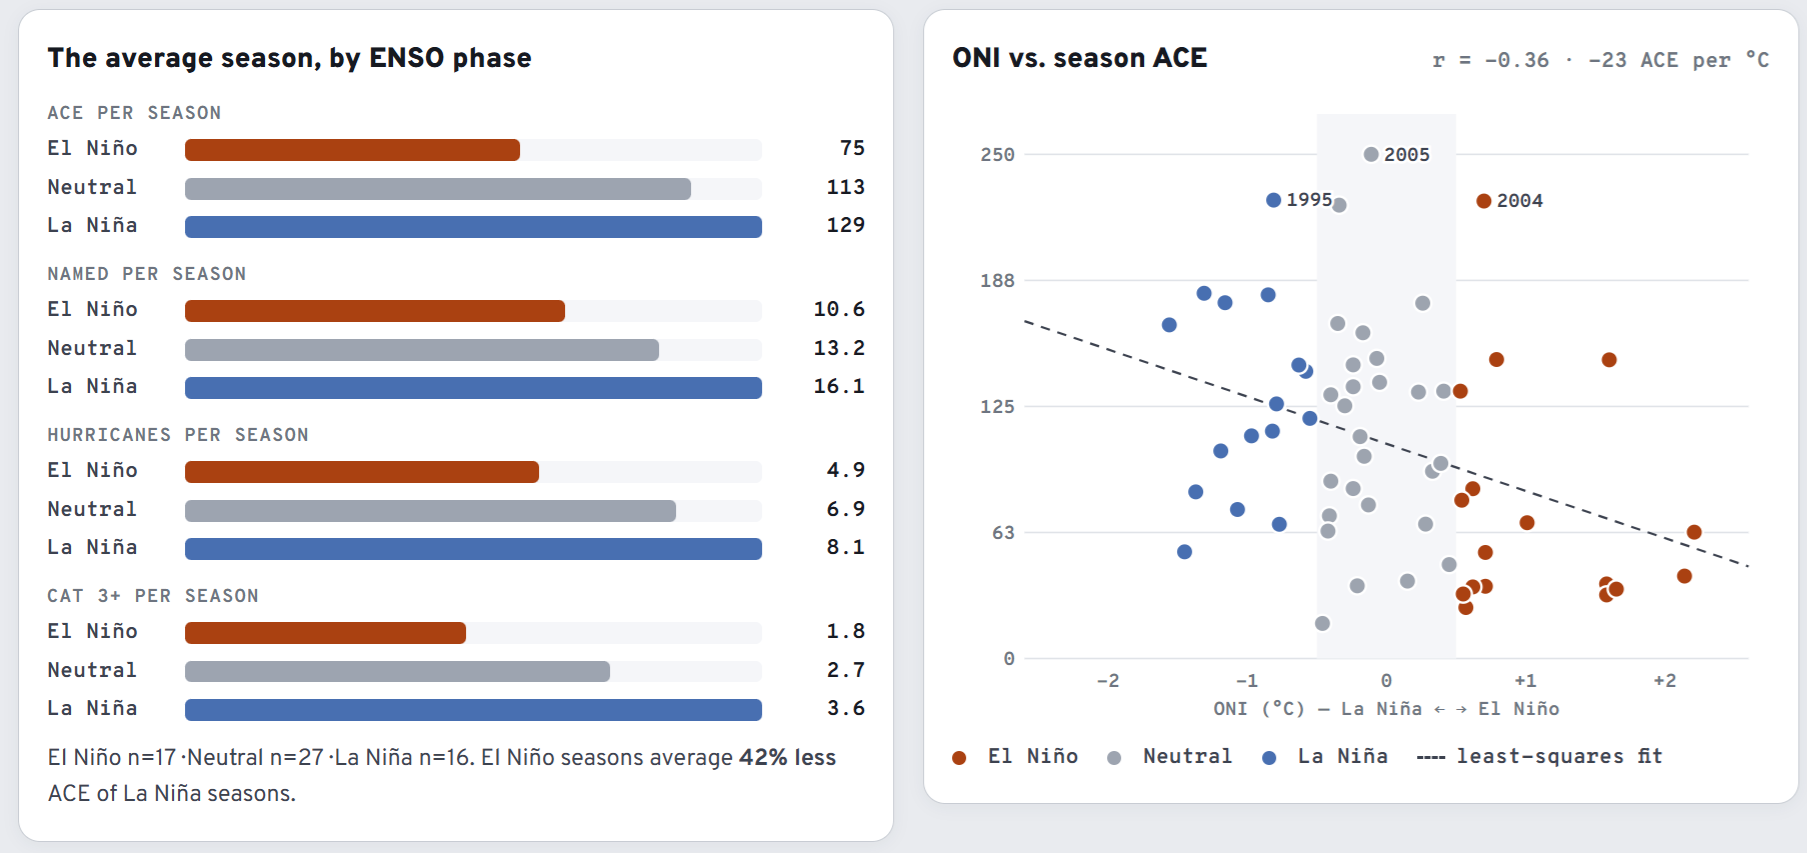
And, of course we have neutral years with the equatorial Pacific in between Niña and Niño.
The giant SST anomaly in the central to eastern Pacific like 2026 (or 1997) is called the canonical El Niño as it is Eastern Pacific based. Strong convection is fired over the Central Pacific equatorial region south of Hawaii, and can spawn hurricanes, typhoons, and potential cyclones in the South Pacific, too.
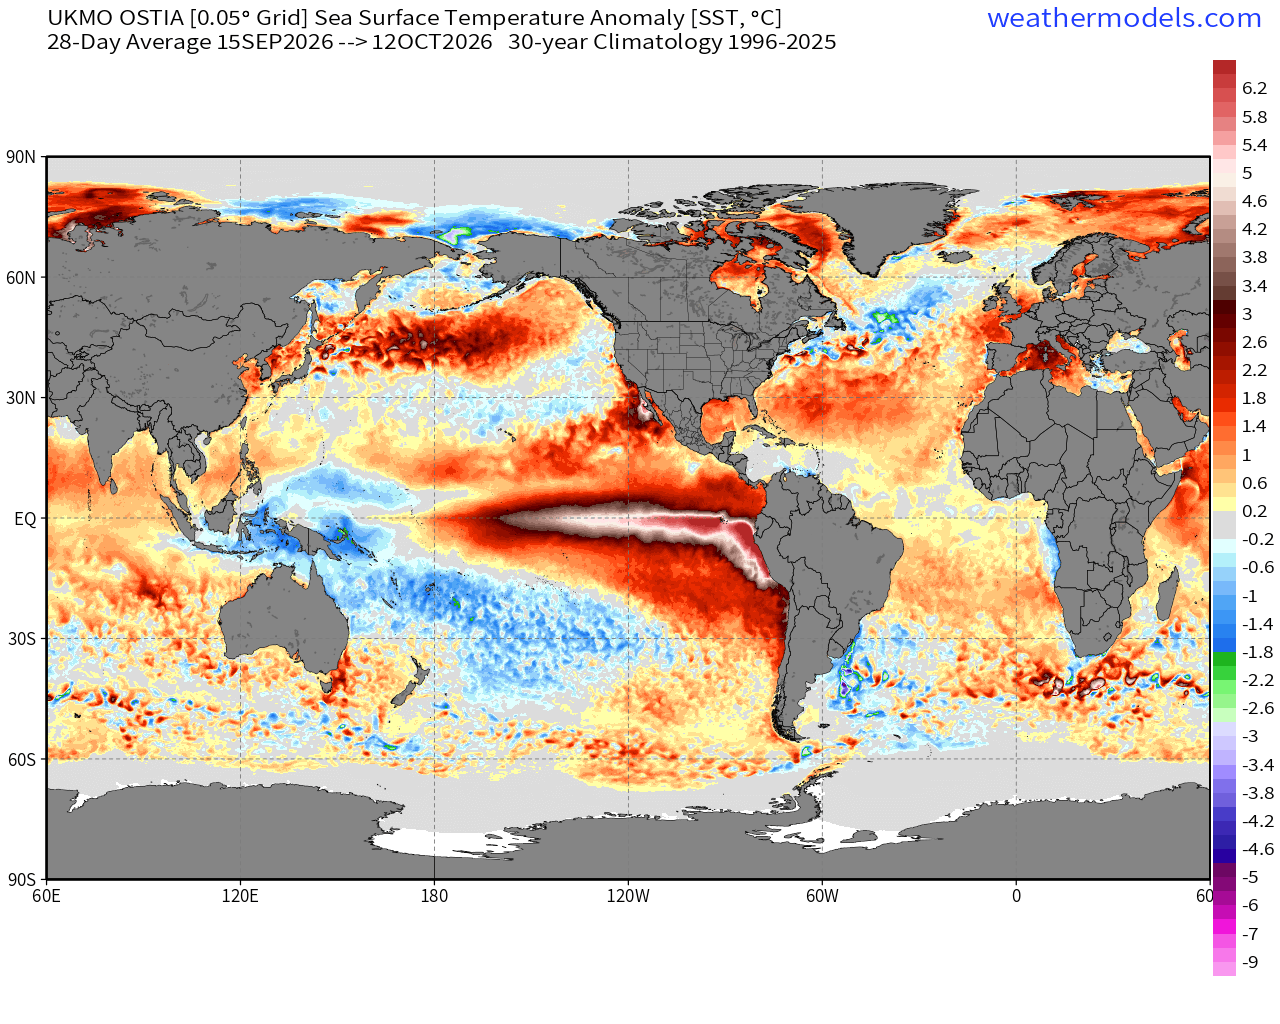
The North Atlantic was quite warm — well above normal in the subtropics, but near normal in the Main Development Region (MDR) — when averaged over the past 4-weeks to smooth out the high frequency weather.
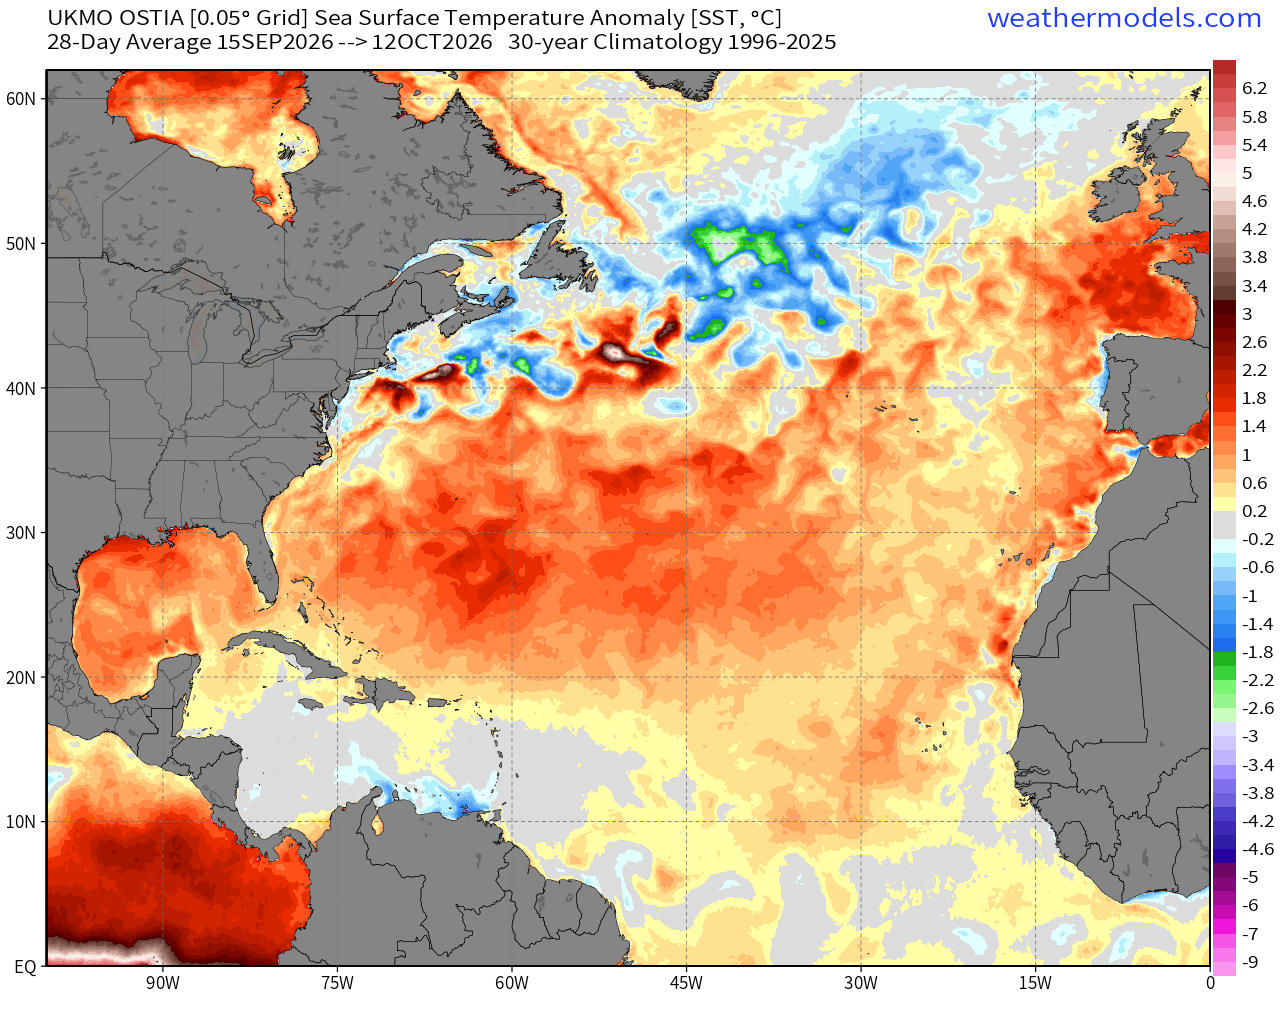
We then use a Relative SST index in the Atlantic tropics to compare to the global tropics in its entirety, and that’s a rather low number -0.52ºC in context … even through the local SST is +0.40°C — and that “leans quiet” especially with the added wind shear on top of higher stability, dust, and other issues during a full-tilt Super El Niño.
Thanks to your continued support over the past several years, we have developed many valuable tools with beautiful maps and charts — to help tell the weather and climate story. I love weather model data, maps, and beautiful dashboards/charts, and enjoy telling the stories behind the data.
Integrated Vapor Transport Next 10-days | AIFS 12z Flagship Model
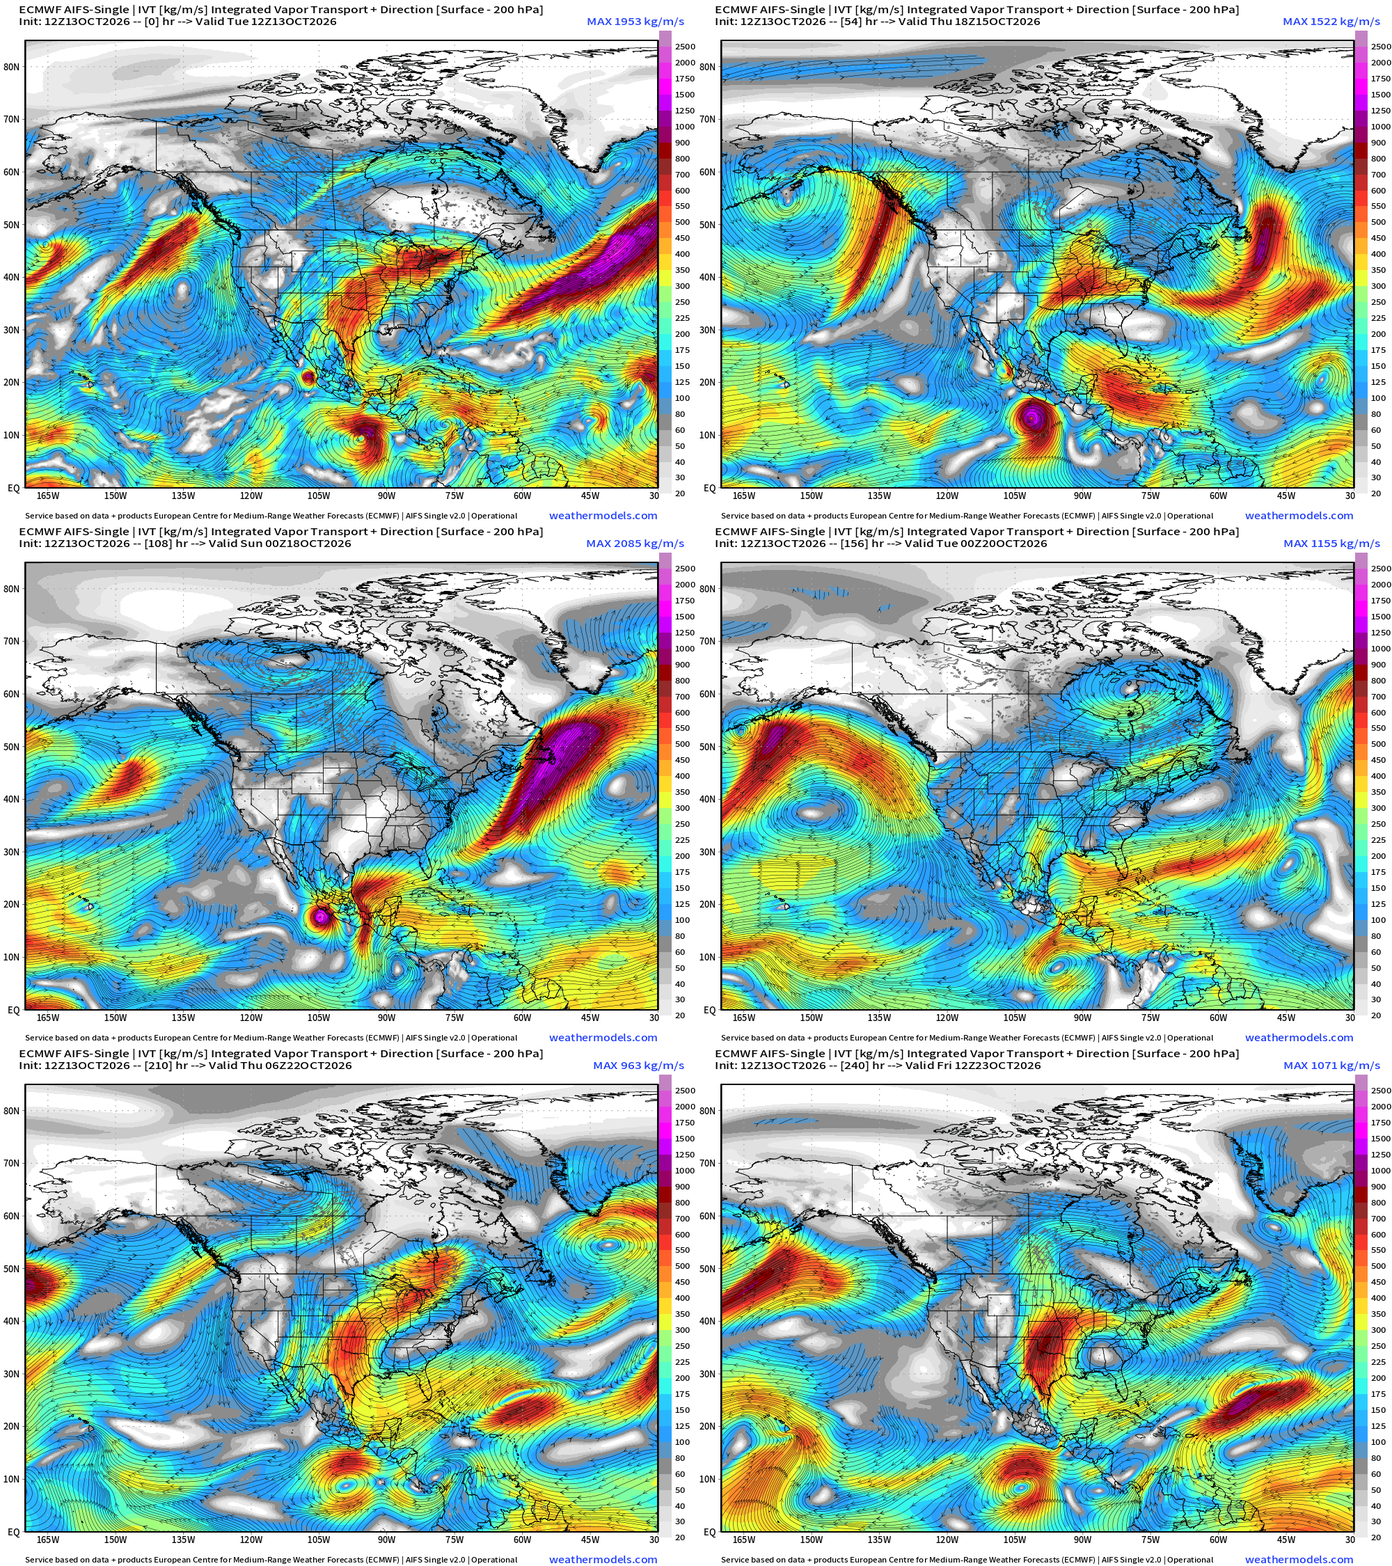
Simon makes landfall — eventually — and then Major Hurricane Trudy follows on a similar course, but has more runway over untapped high ocean heat content along Mexican coast.
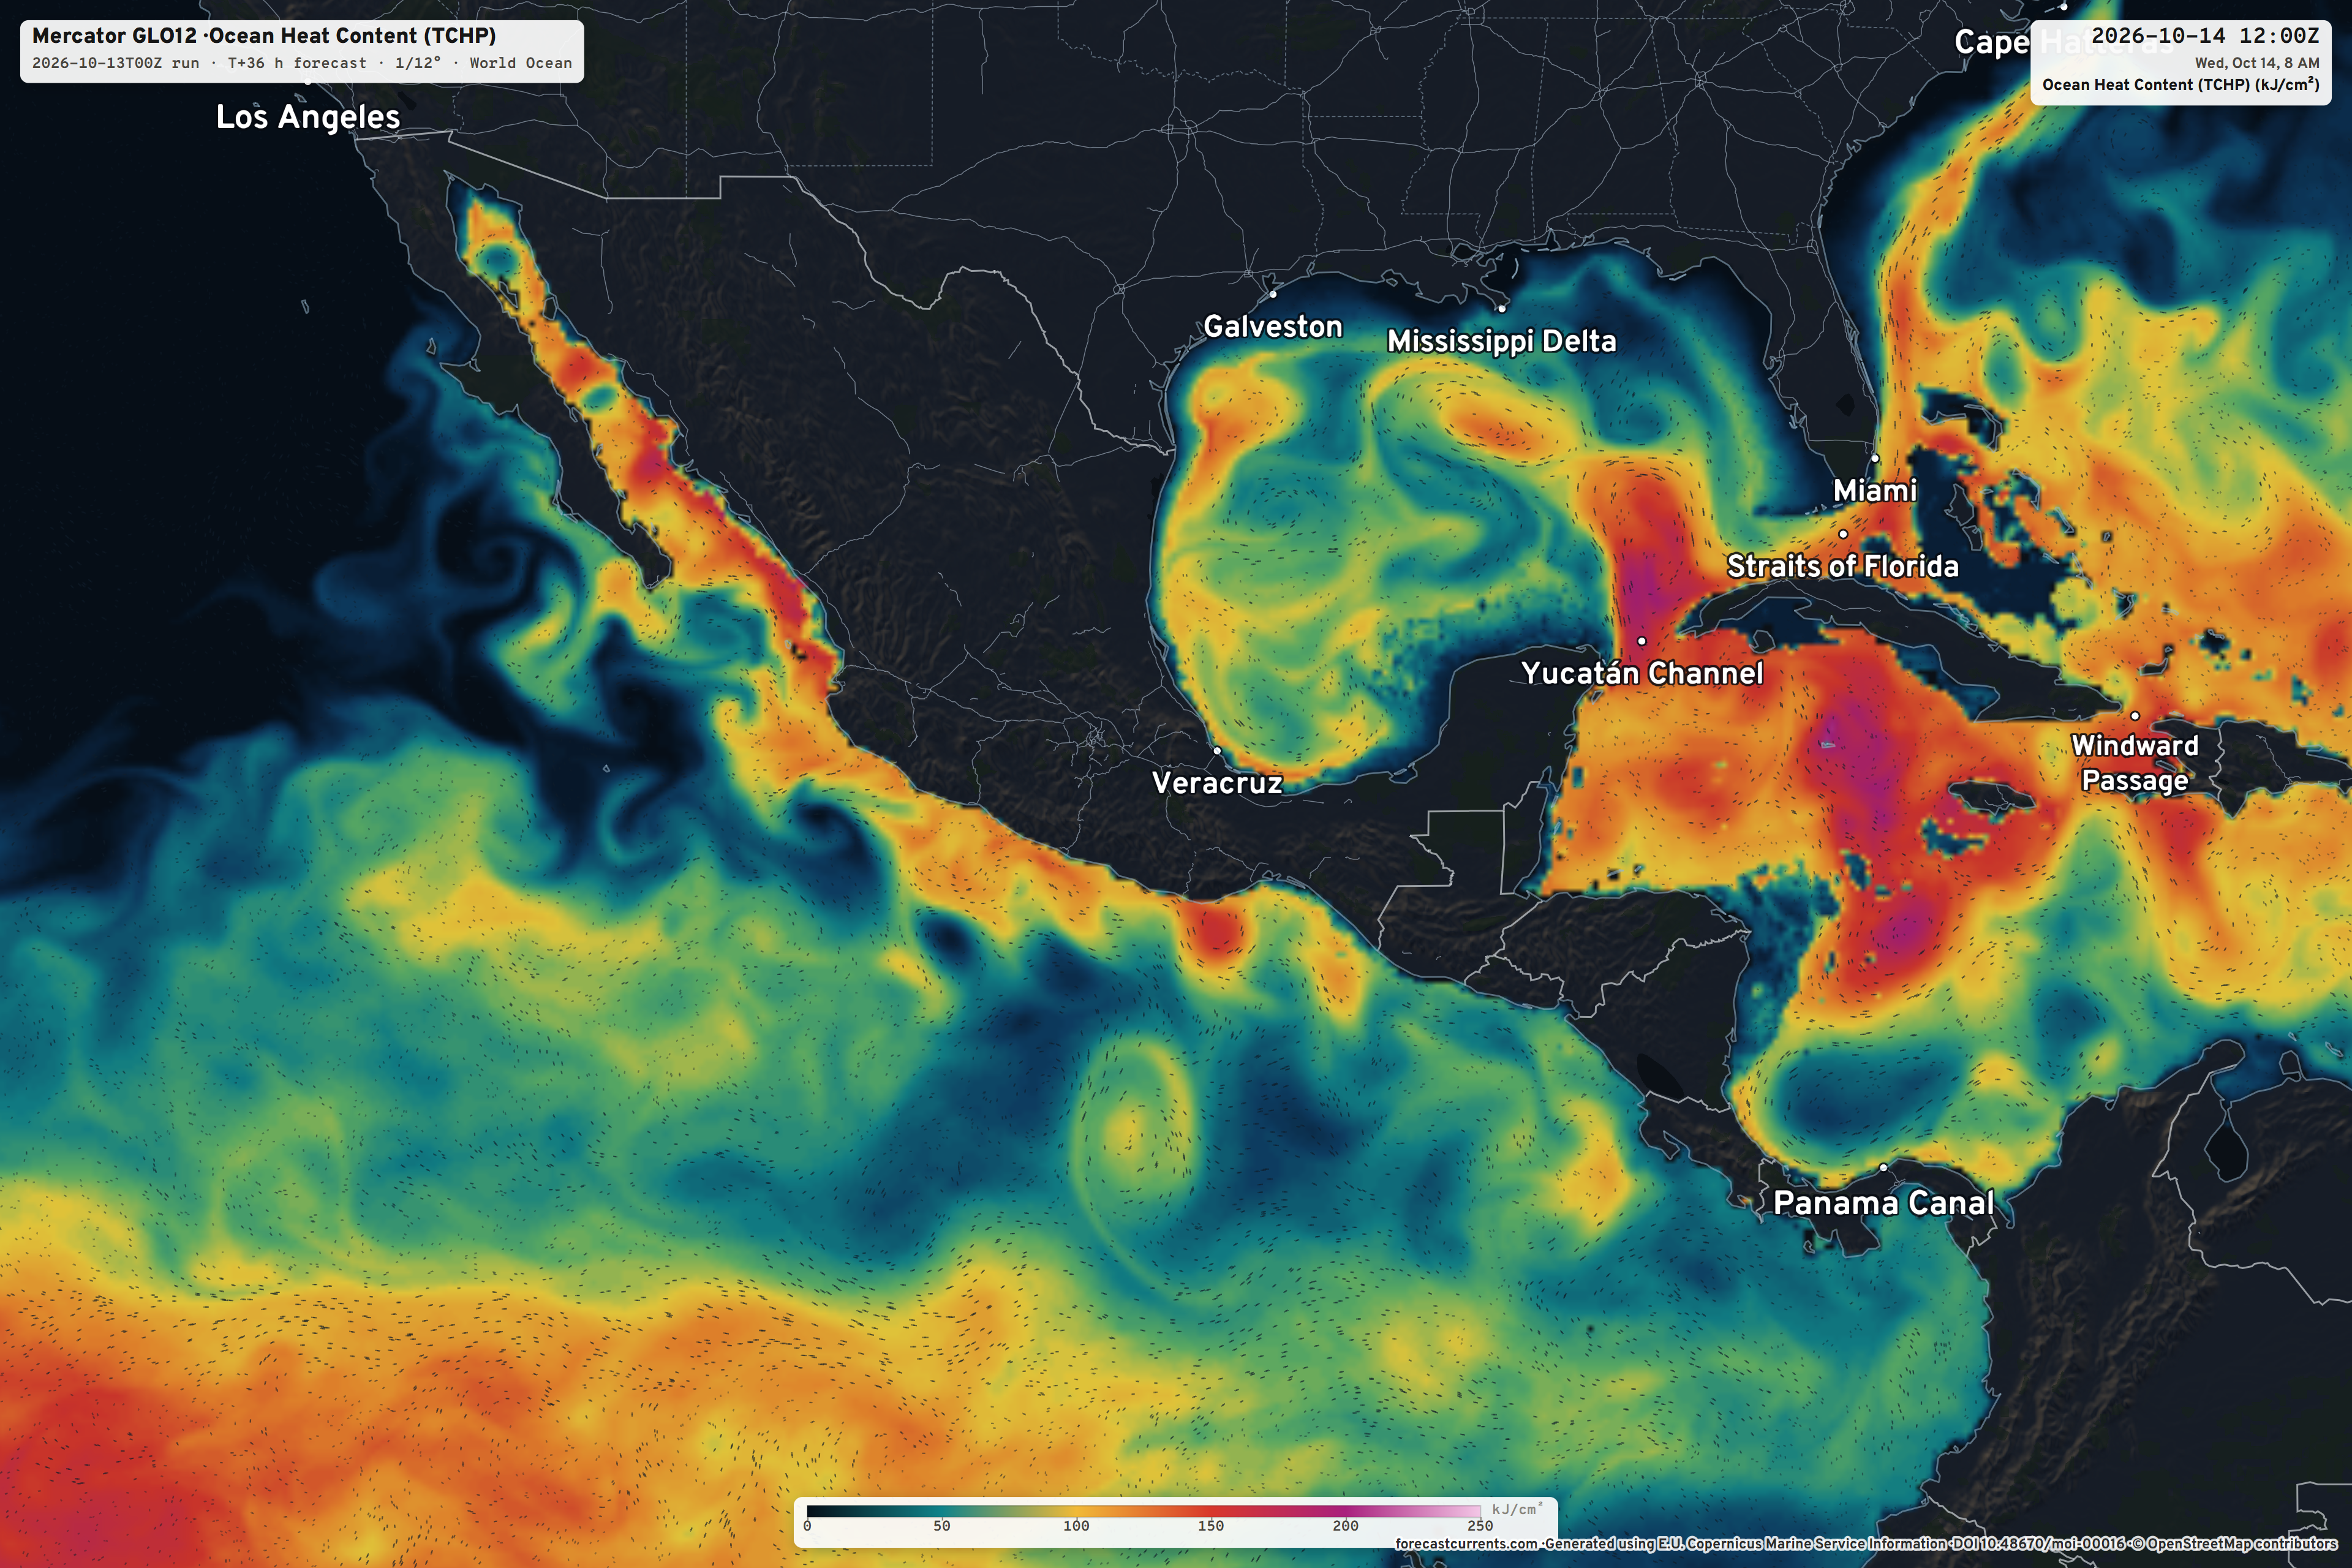
This Ocean Heat Content map is near the top of my favorites list. The color table, details, and the wind currents (animated —> go here) also there is plenty of fuel left in the tank in the Gulf and definitely the Caribbean (fully loaded)
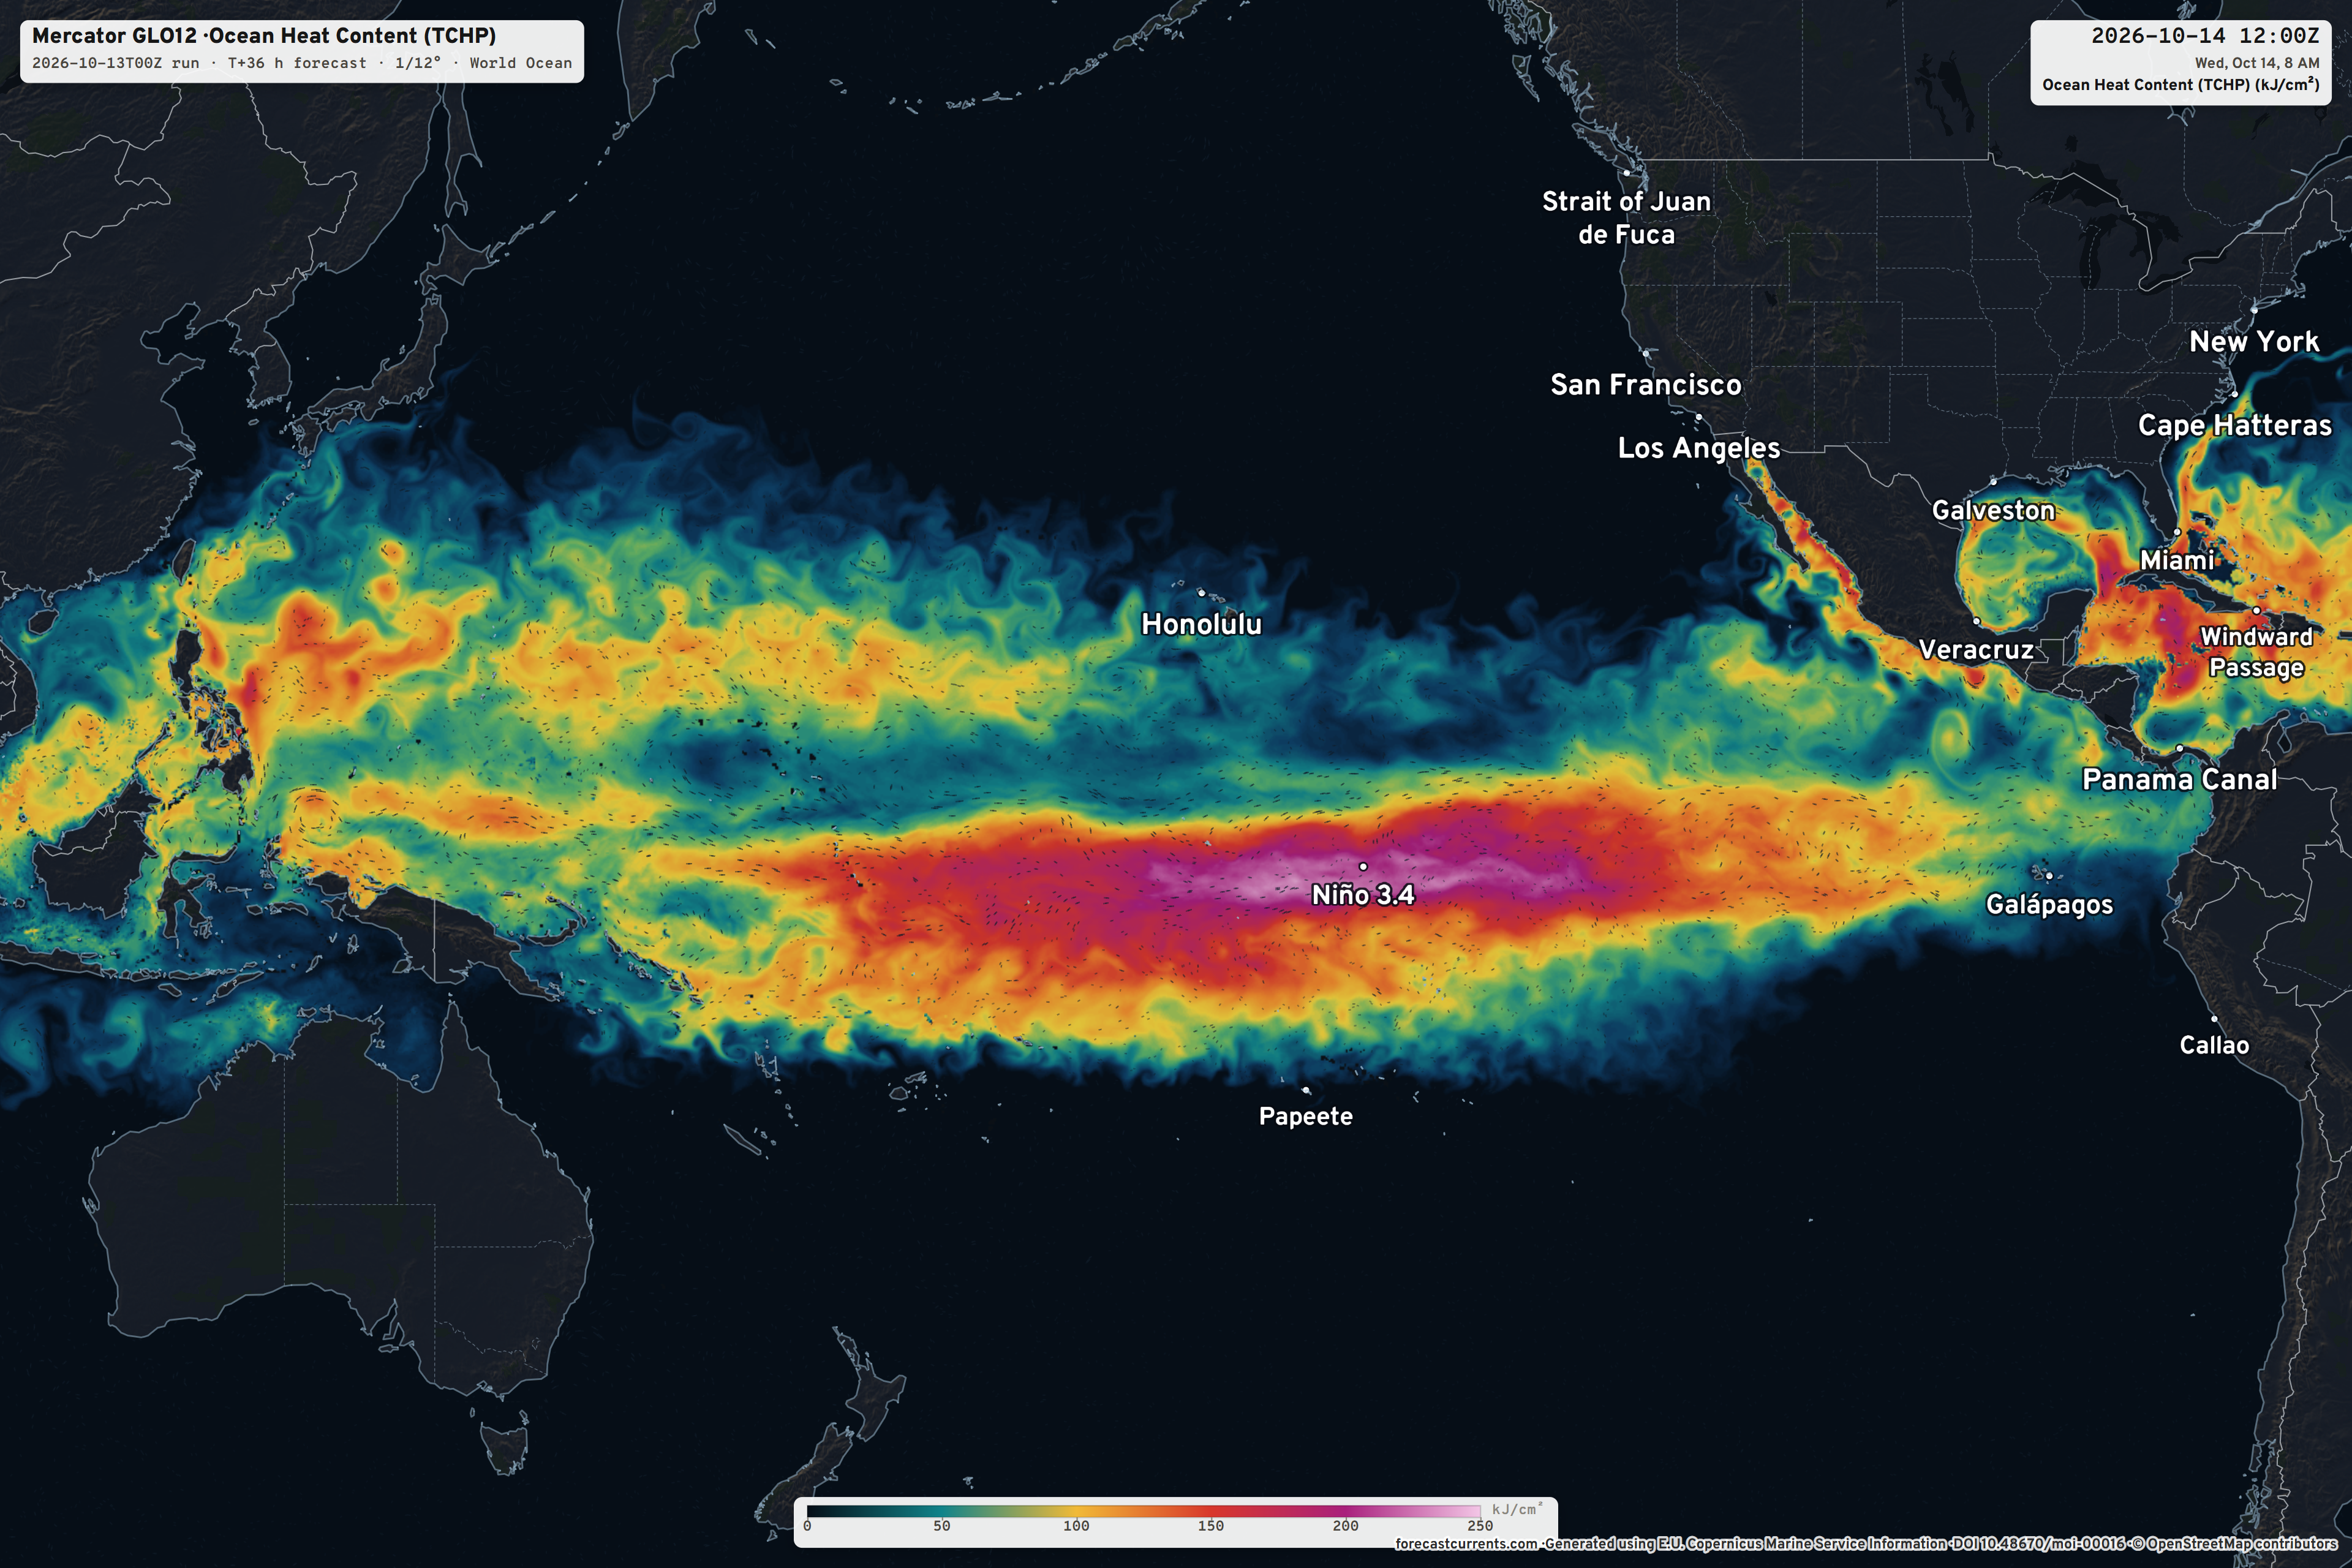
Zooming out to show the massive reservoir of warm water over the Central Pacific equatorial tropics. While tropical cyclones can’t form on/near the equatorial, deep convection can certainly bubble-up and spawn typhoons in the western Pacific at low-latitude — and that’s what we’re going to see with Invest 96W.
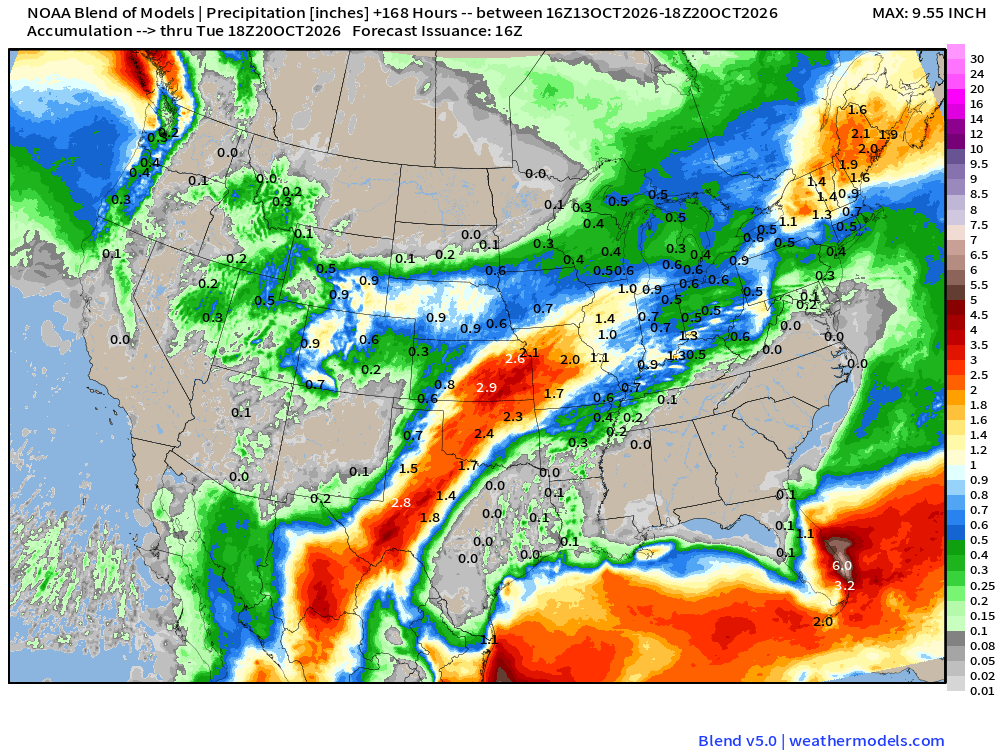
Strong flow from the east across Florida repeats with formation of a ridge over the Southeast … and that completely squelches rainfall — look at the 7-day Blend of Models precipitation map. Instead, moisture out of the Pacific and the Gulf streams into northern Mexico, west Texas into the central Plains with 2-4” from El Paso to Kansas City.
Week 1 Temperature Anomaly | Oct 13 - Oct 19
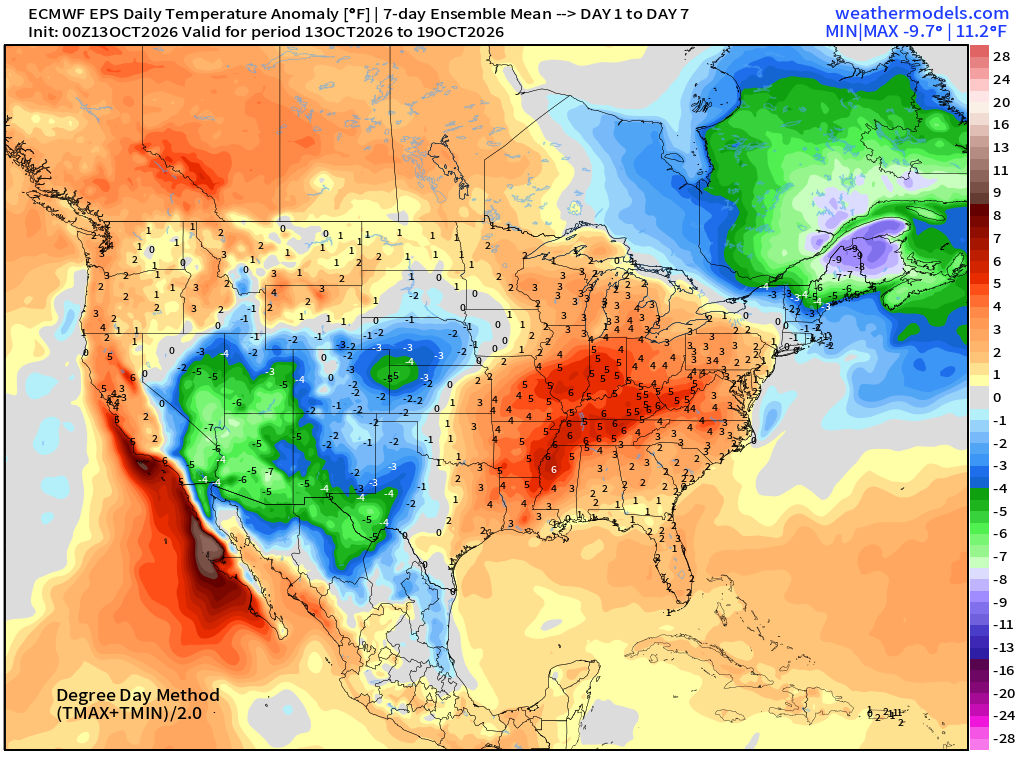
Western Trough —> cool and even snowy in the northern Rockies, very warm in the central and eastern U.S. except for northern New England including Boston gets sideswiped by a strong trough and coastal storm (Nor’easter)
Week 2 Temperature Anomaly | Oct 20 - Oct 26
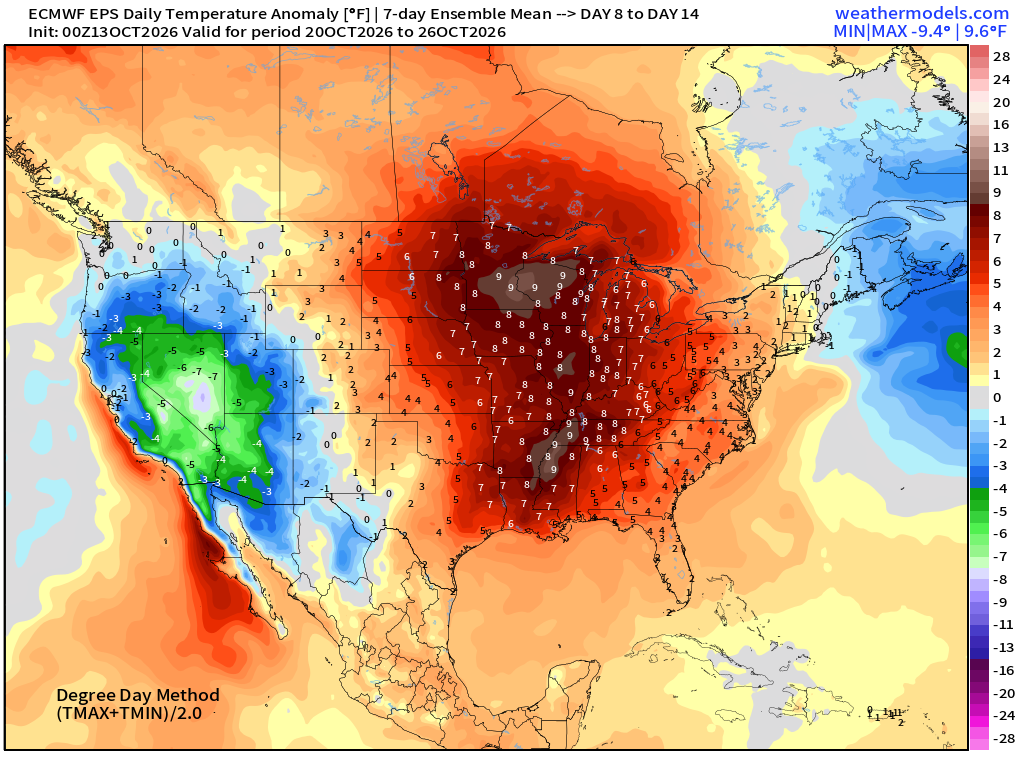
Significantly above normal temperatures continue into final week of October for the eastern half of the Lower 48 w/trough out west
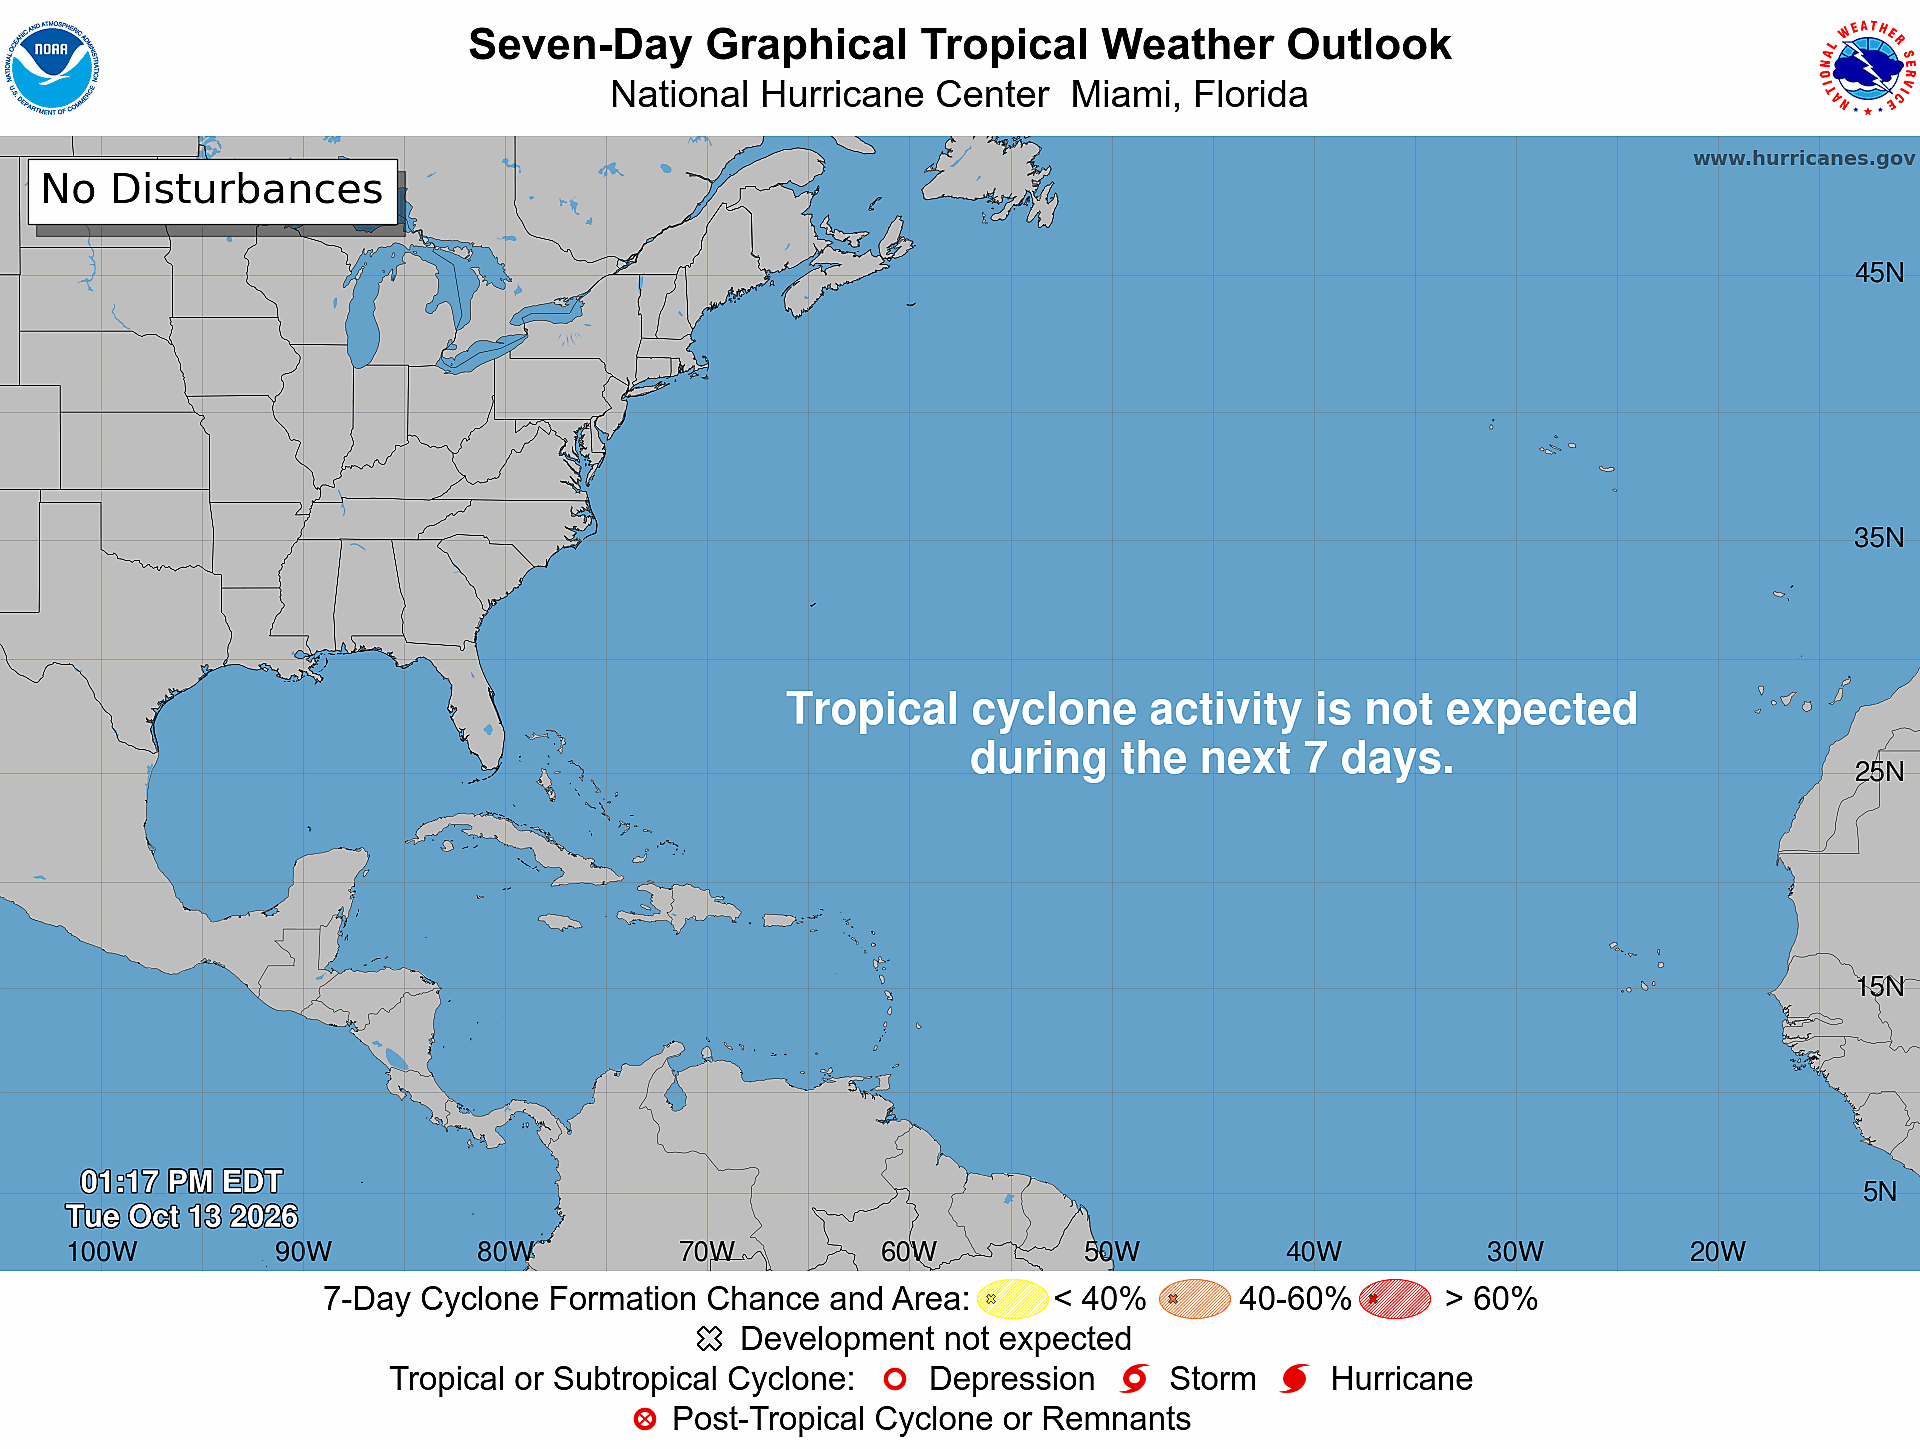
Atlantic Tropical Outlook | Quiet Next 7-days
The tropical wave in the Eastern Pacific has moved northward, and is not in a favorable environment for development — 0%
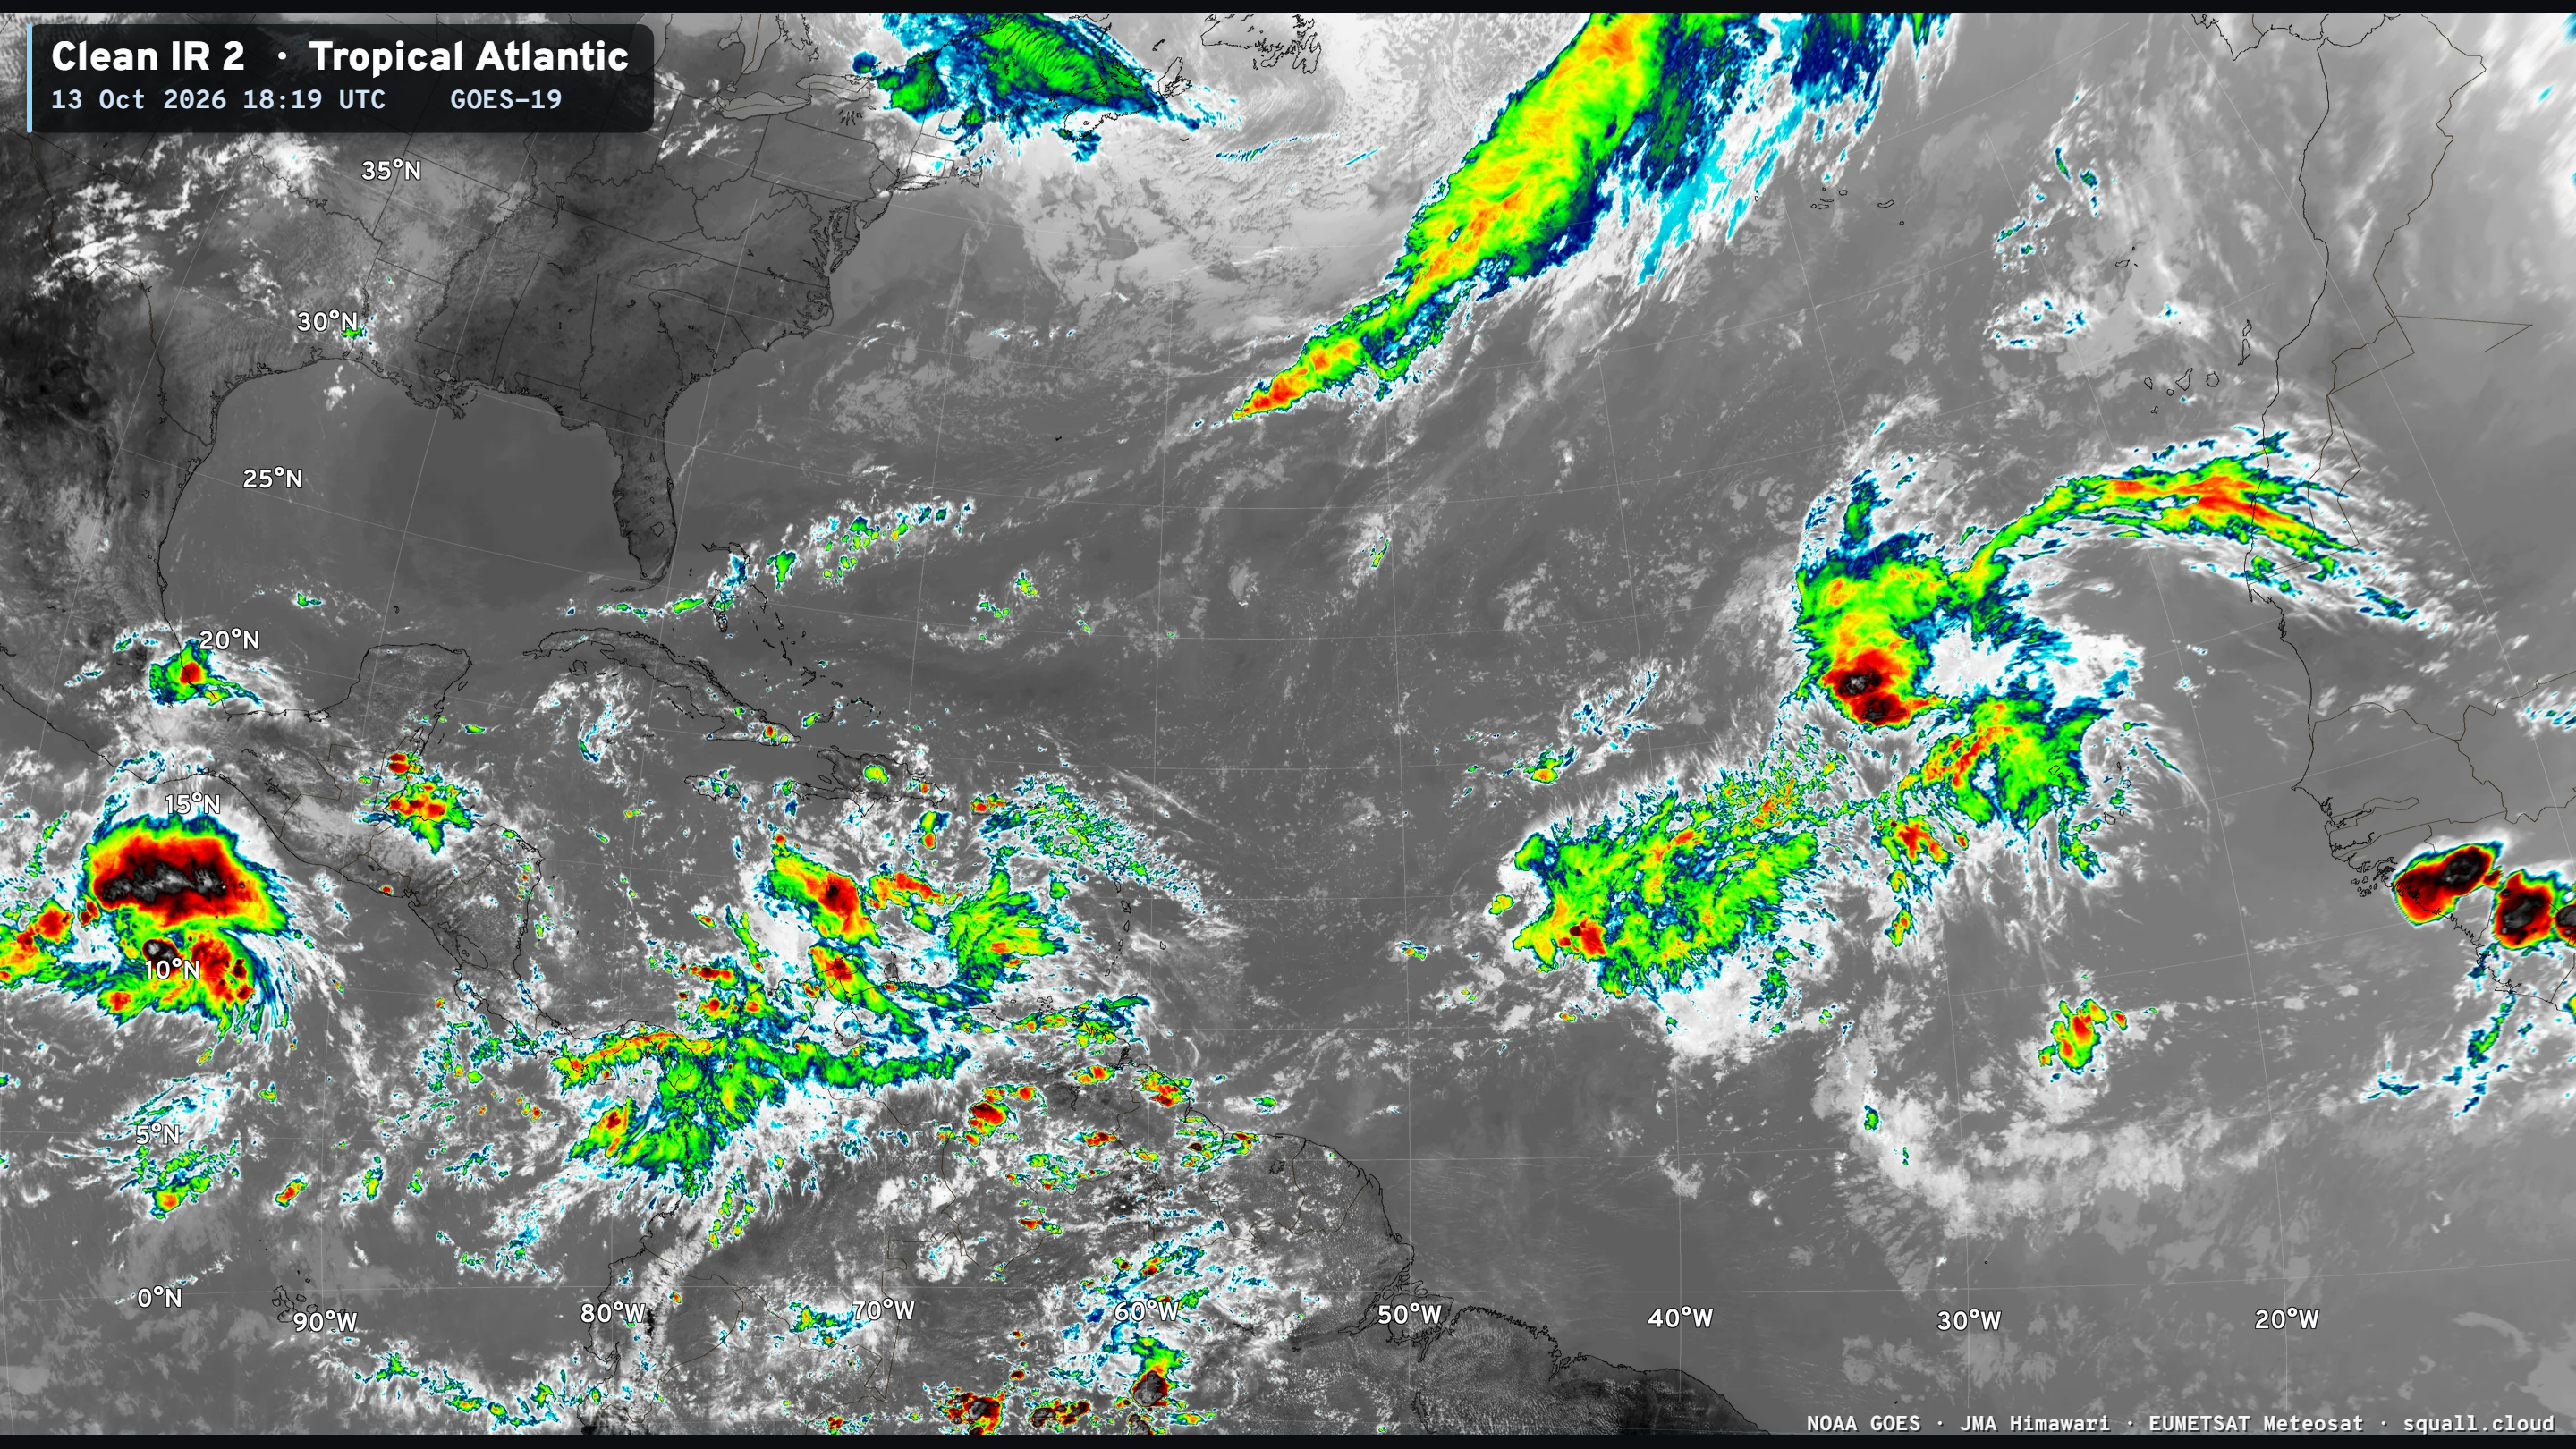
Atlantic Satellite shows the tropical wave — but not much else.
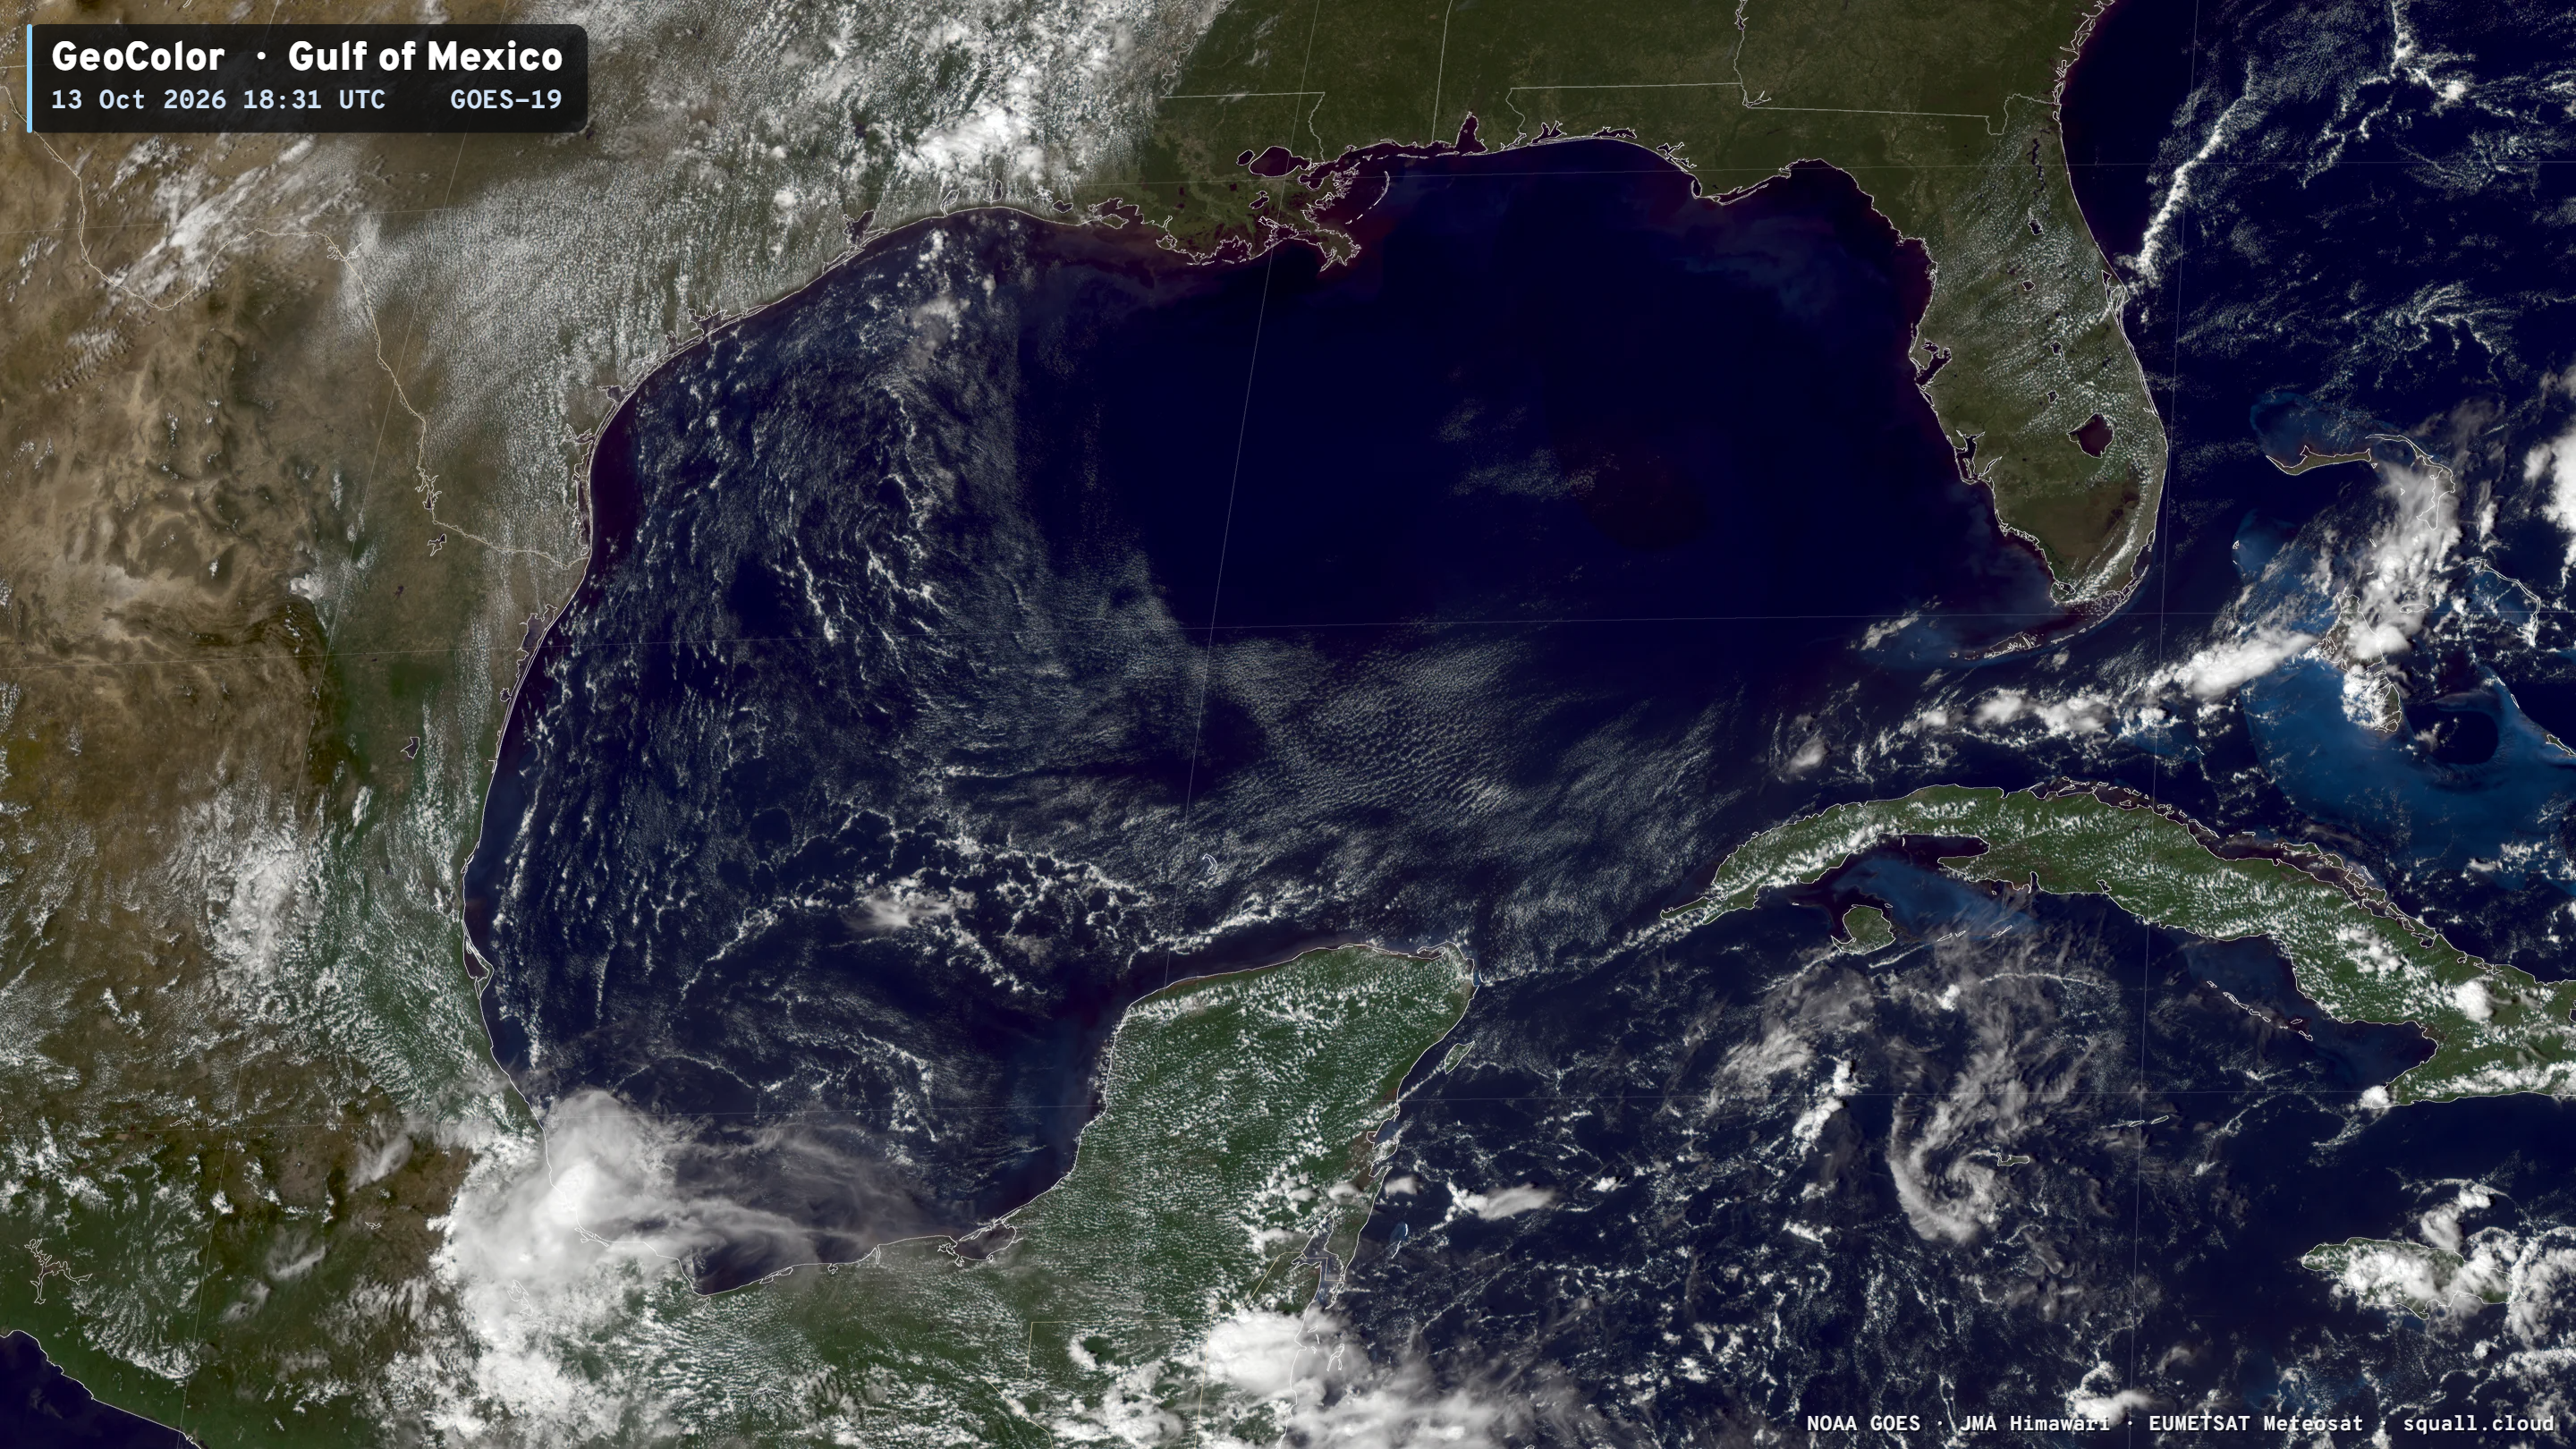
Beautiful and Clear Gulf of Mexico
ECMWF Ensemble 00z full-physics tracks next 15-days
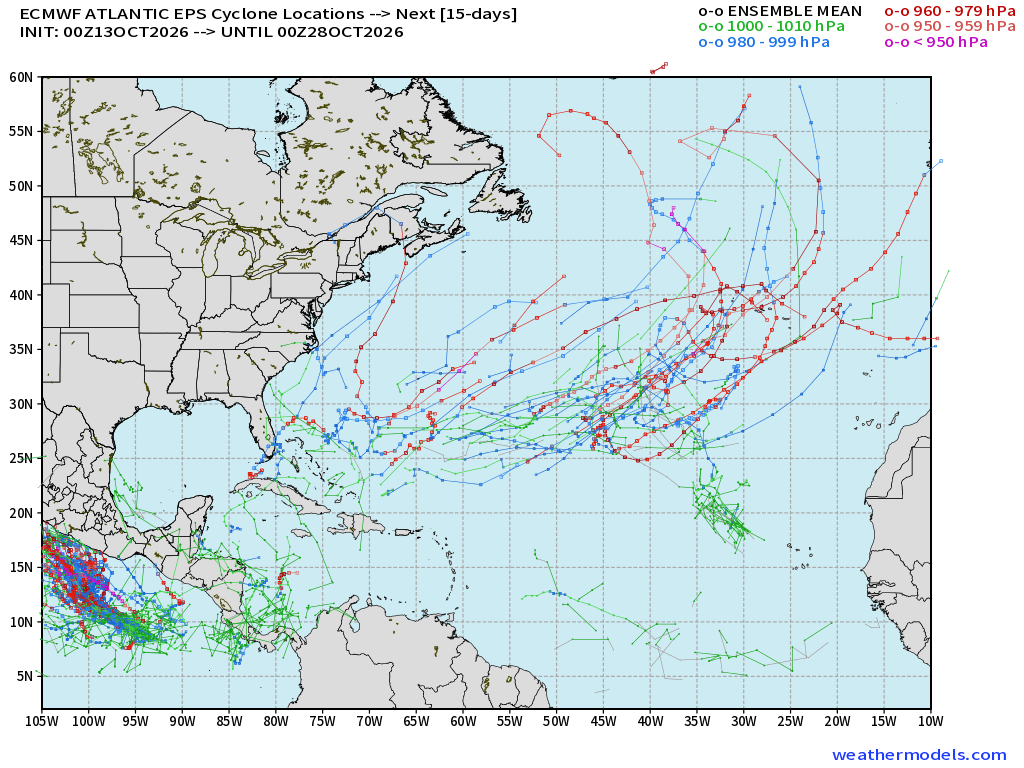
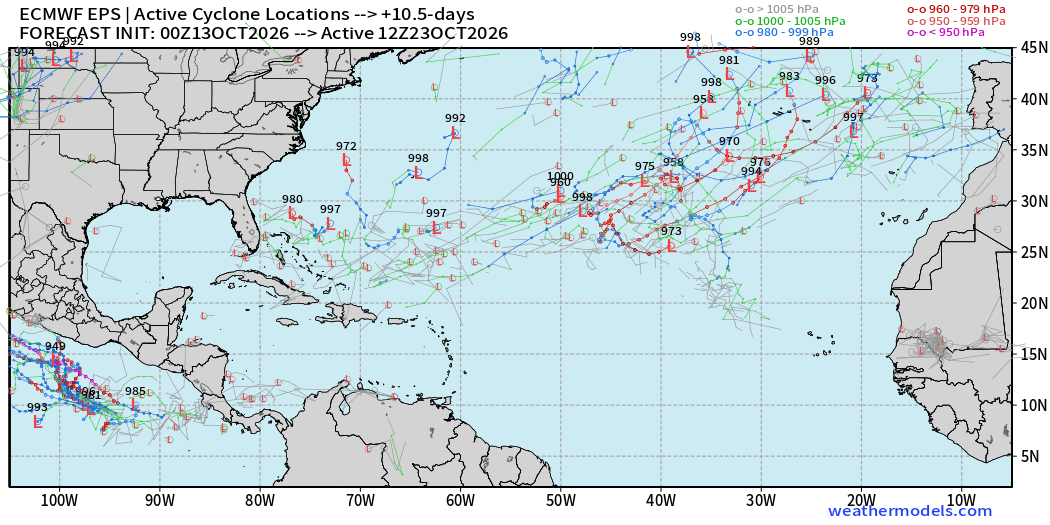
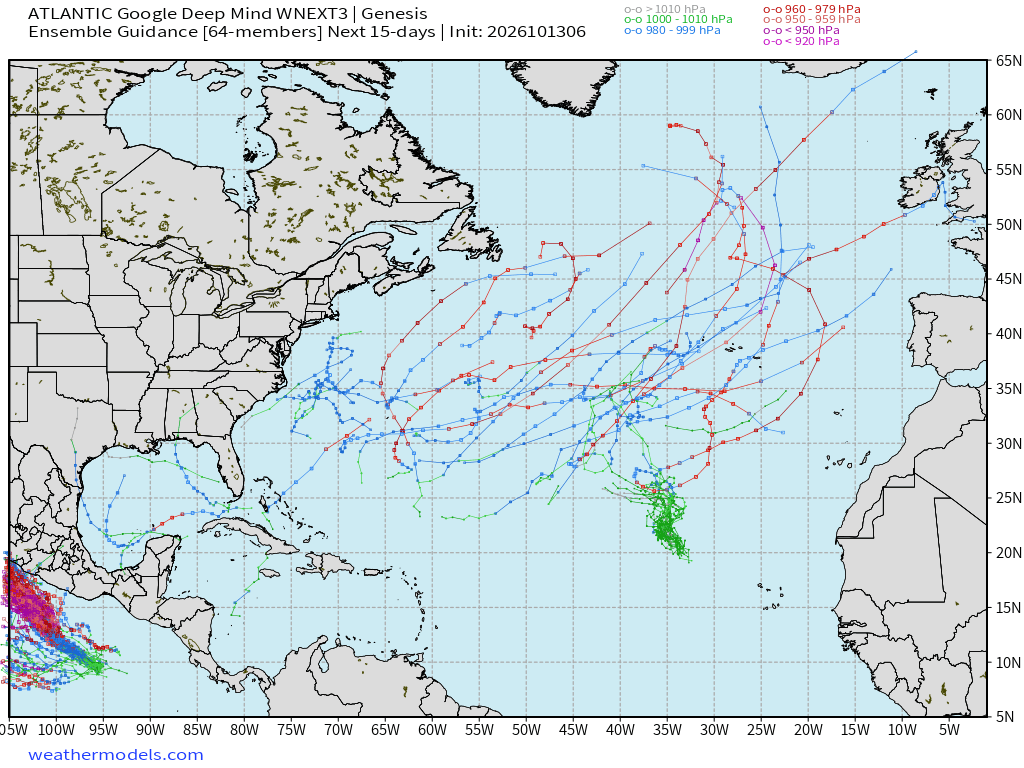
Quite a bit of subtropical activity including many major hurricanes — again showing up in the full-physics system, but the Gulf has entirely cleared out of members showing development in next 15-days. I guess all of that subtropical warmth could be put to use! Day 10.5 snapshot of active Ensemble Tracks (Oct 23)
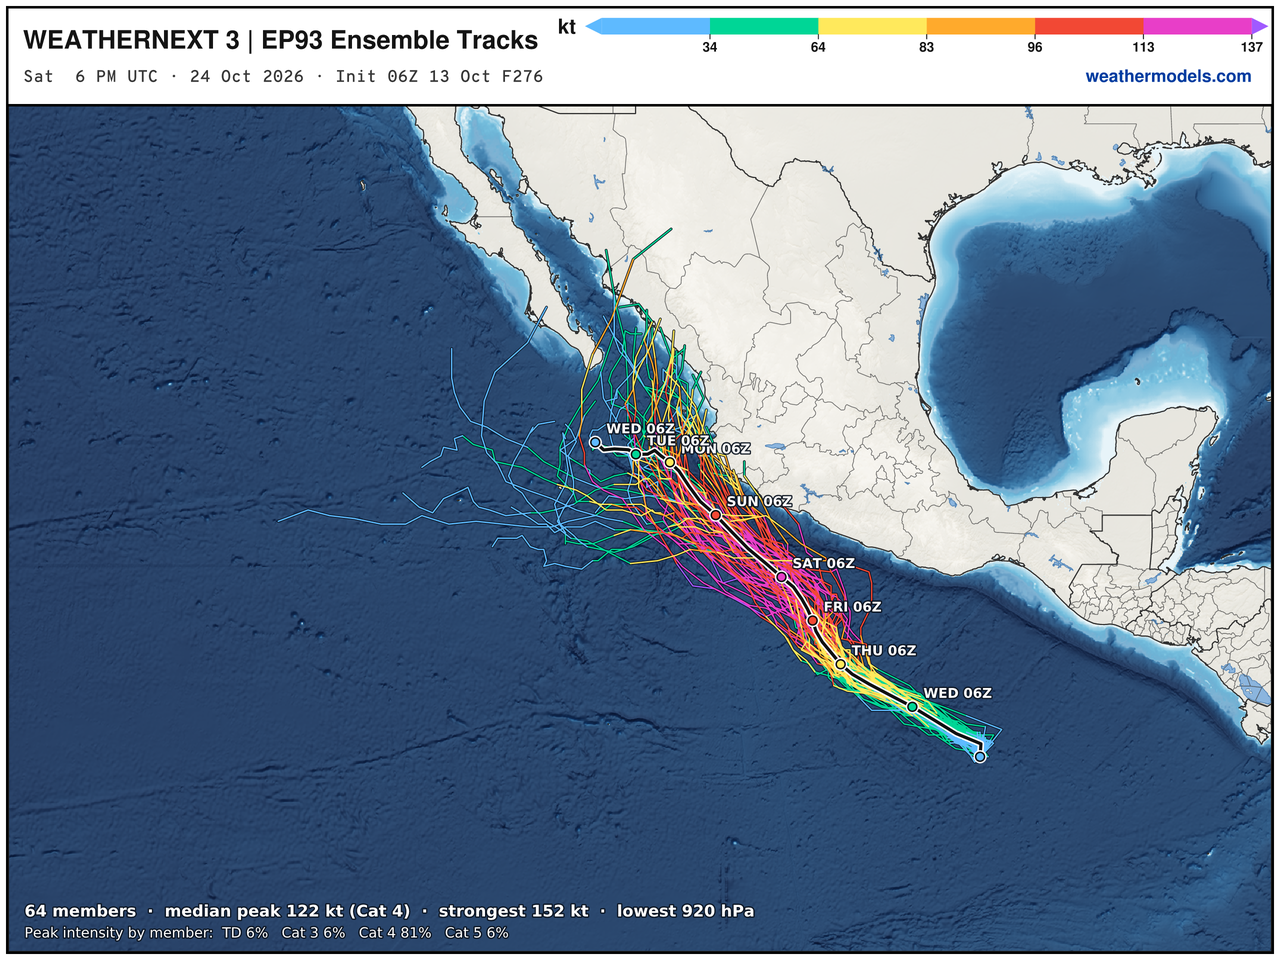
Google Deep Mind | Weather Next 3 | 06z Tracks (64-members)
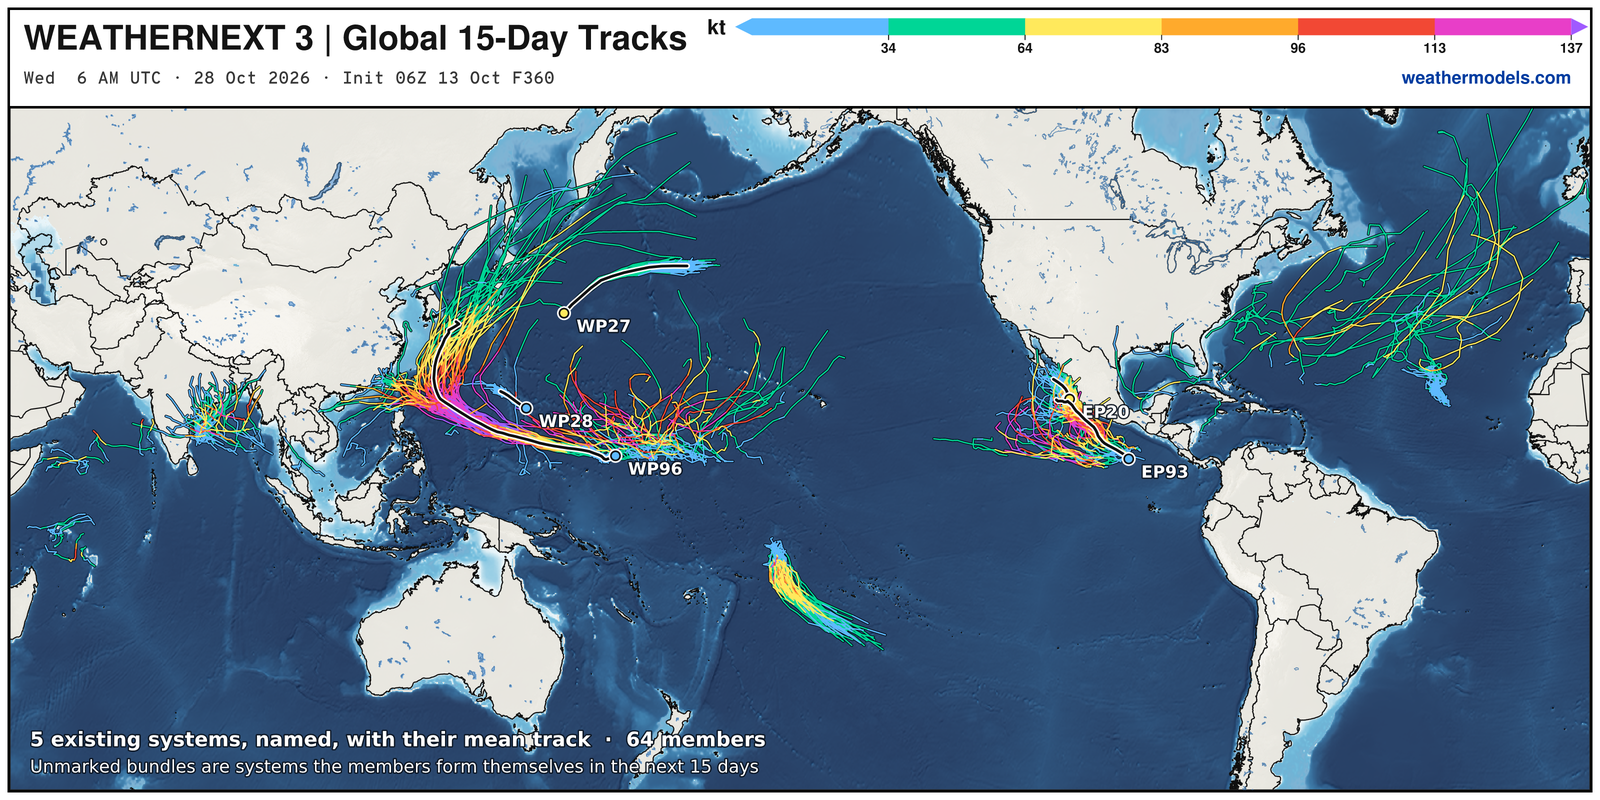
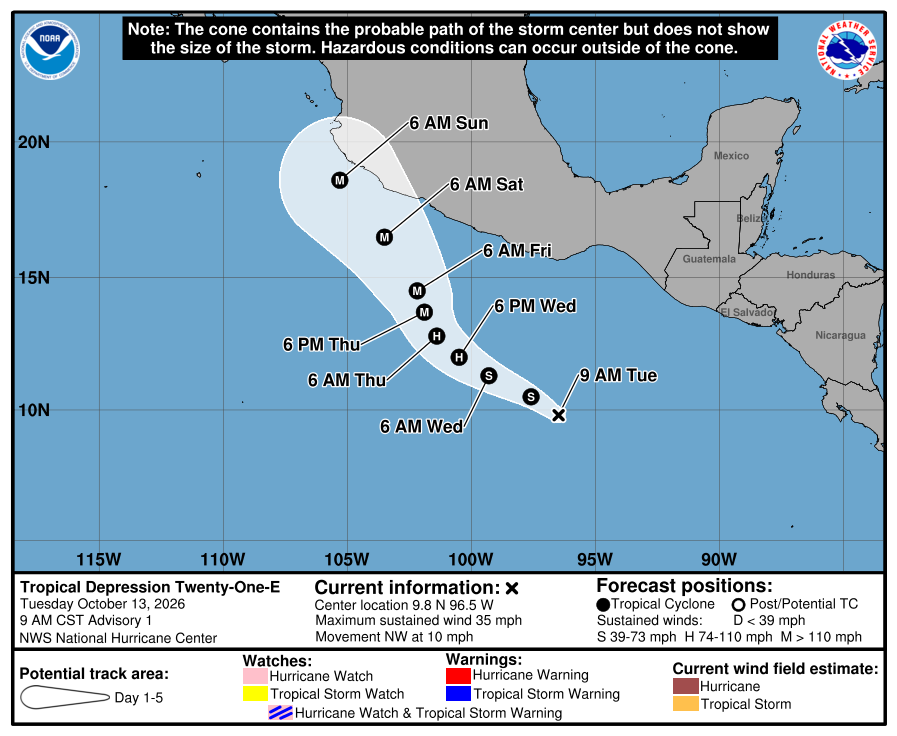
Eastern Pacific Tropics | Simon and soon Trudy (21E)
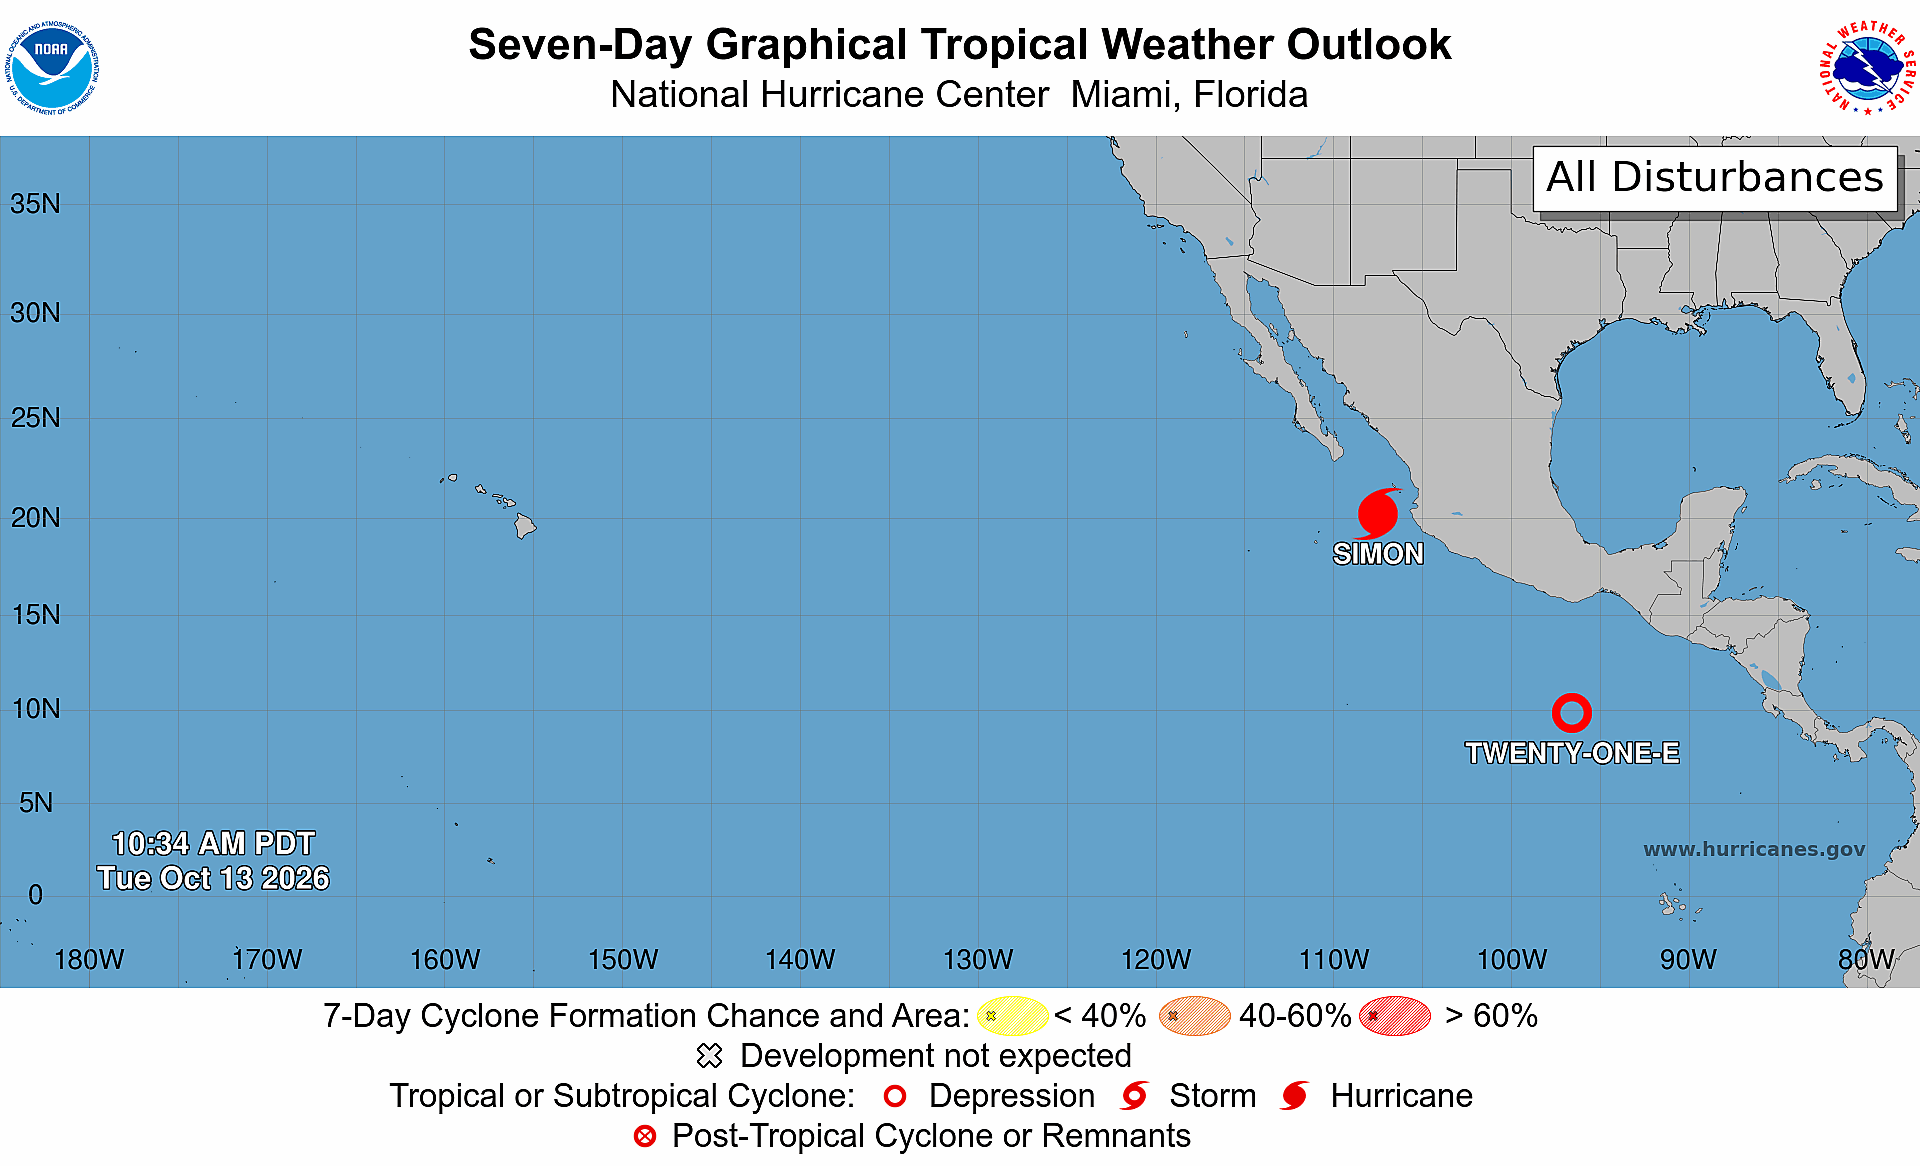
Next storm is Trudy (21E) and it is massive compared to “little dude” Simon
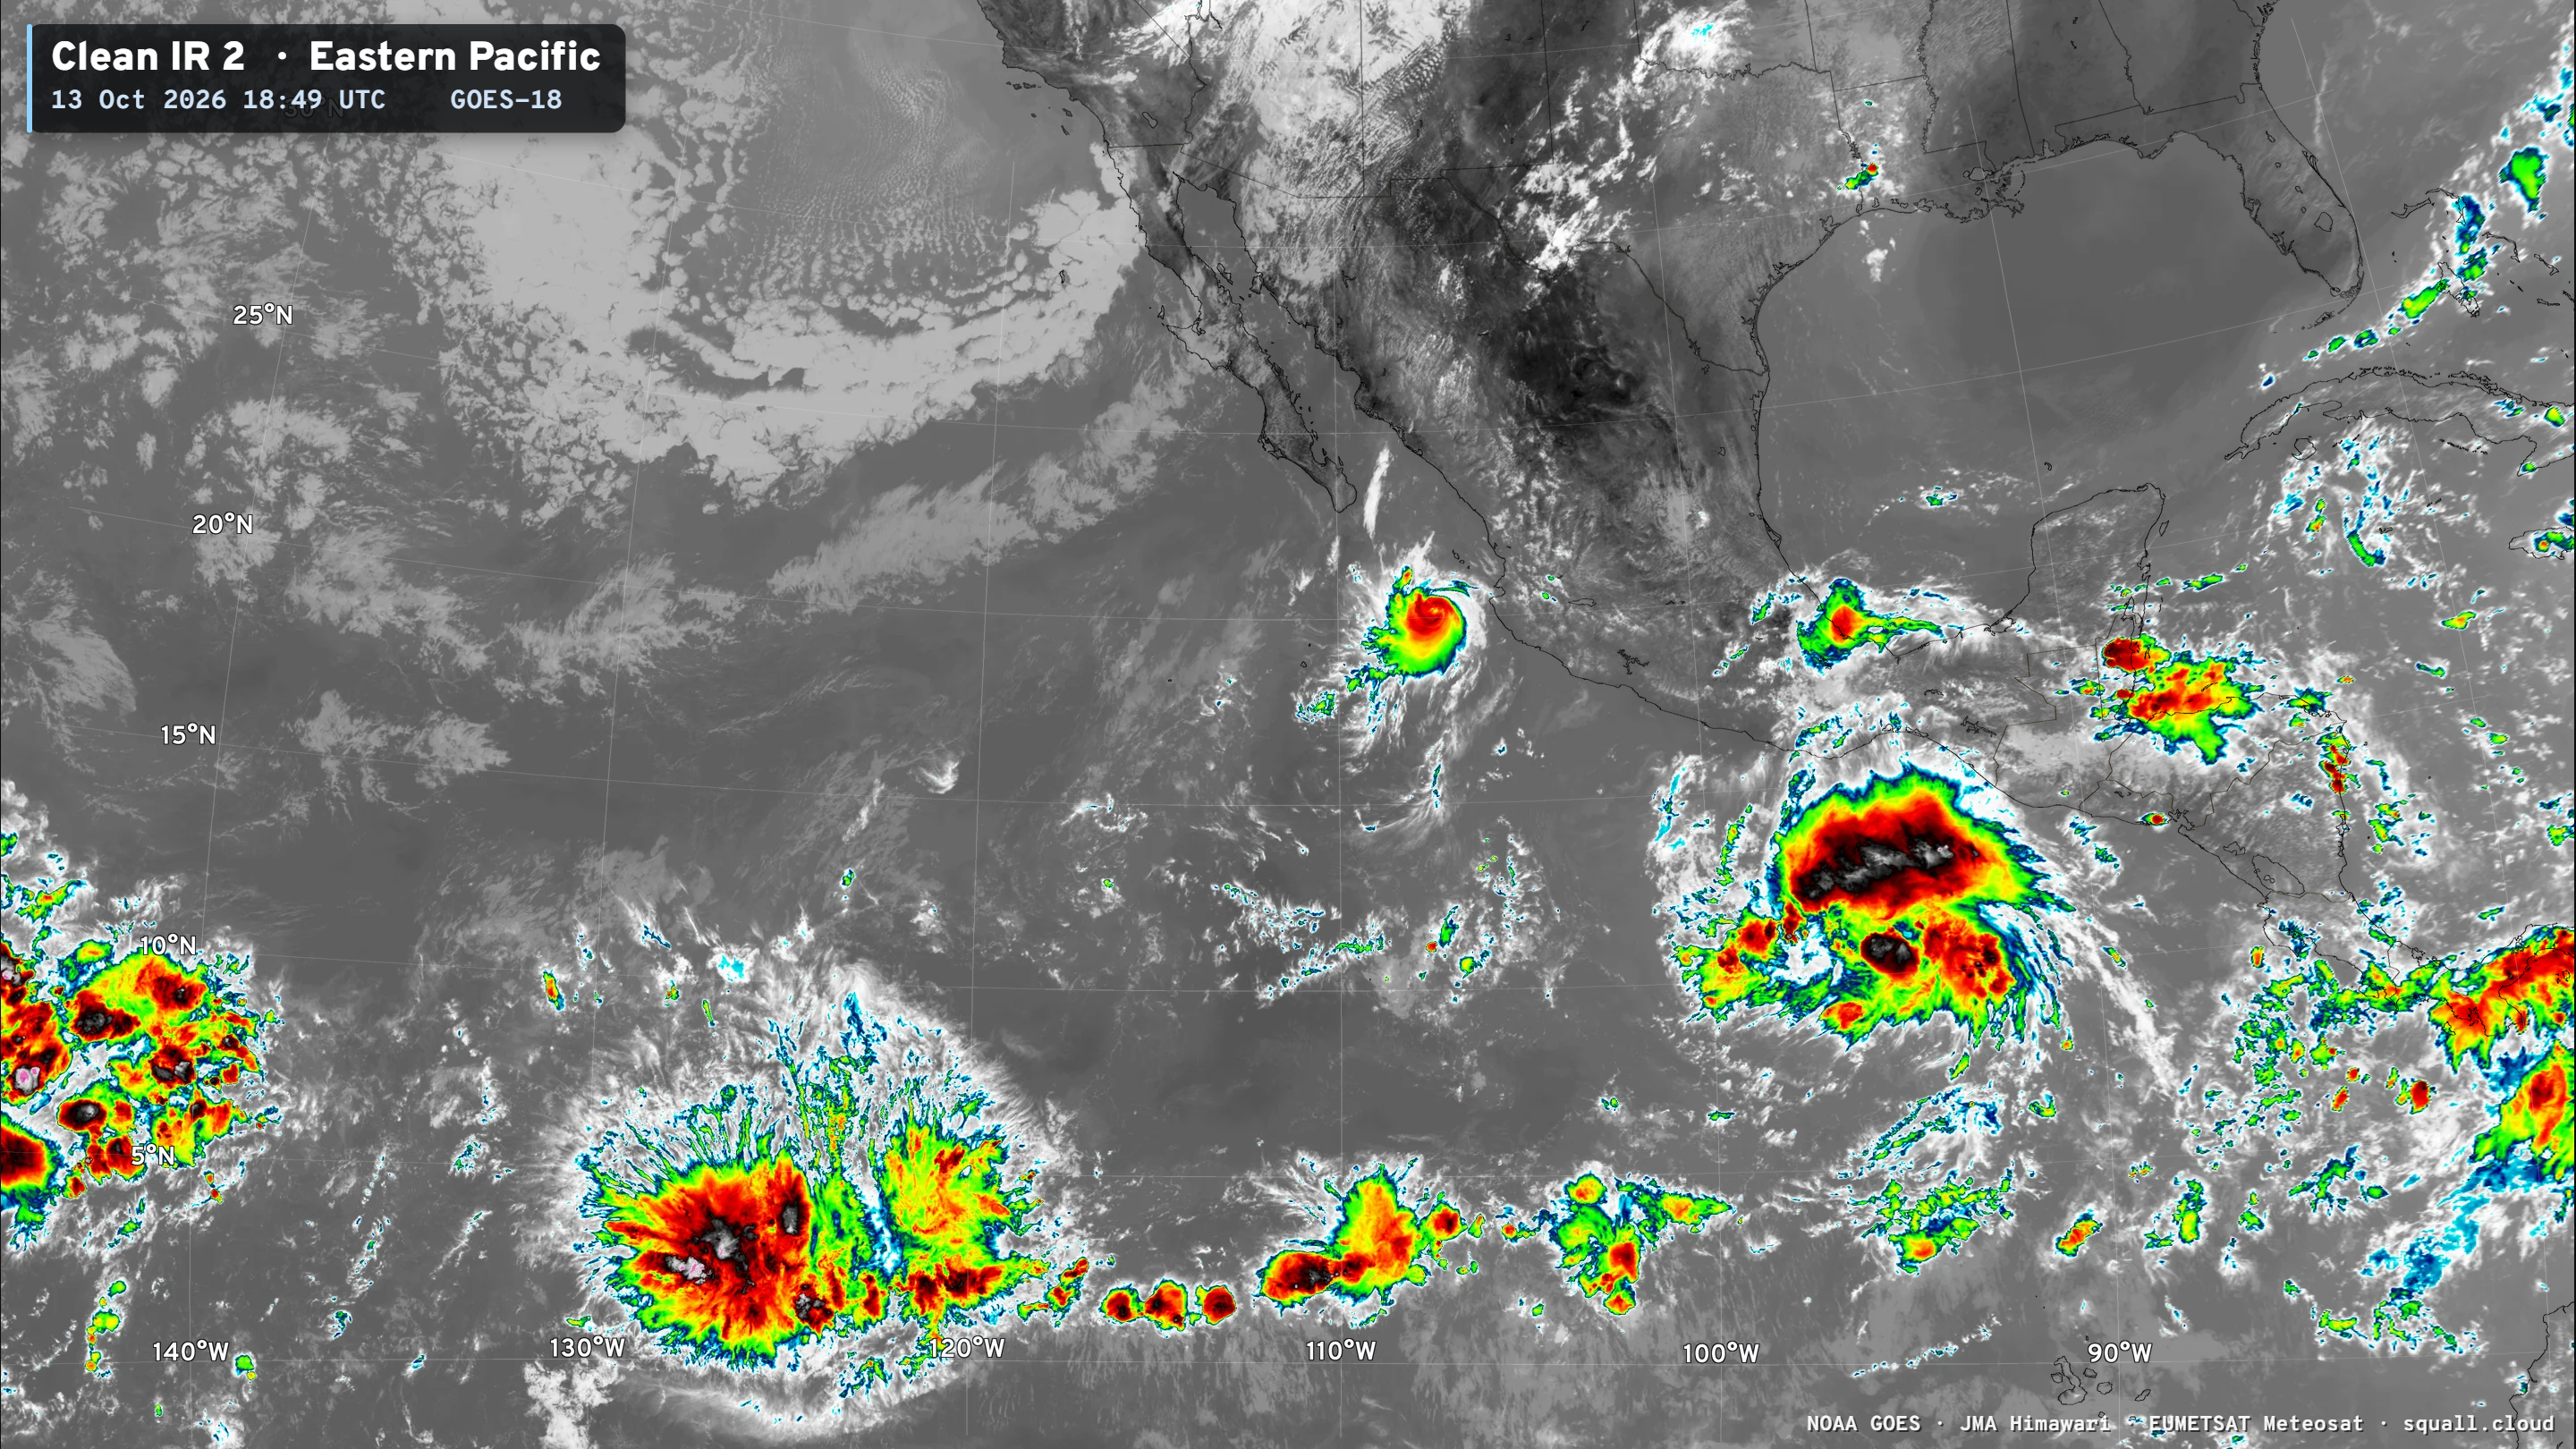
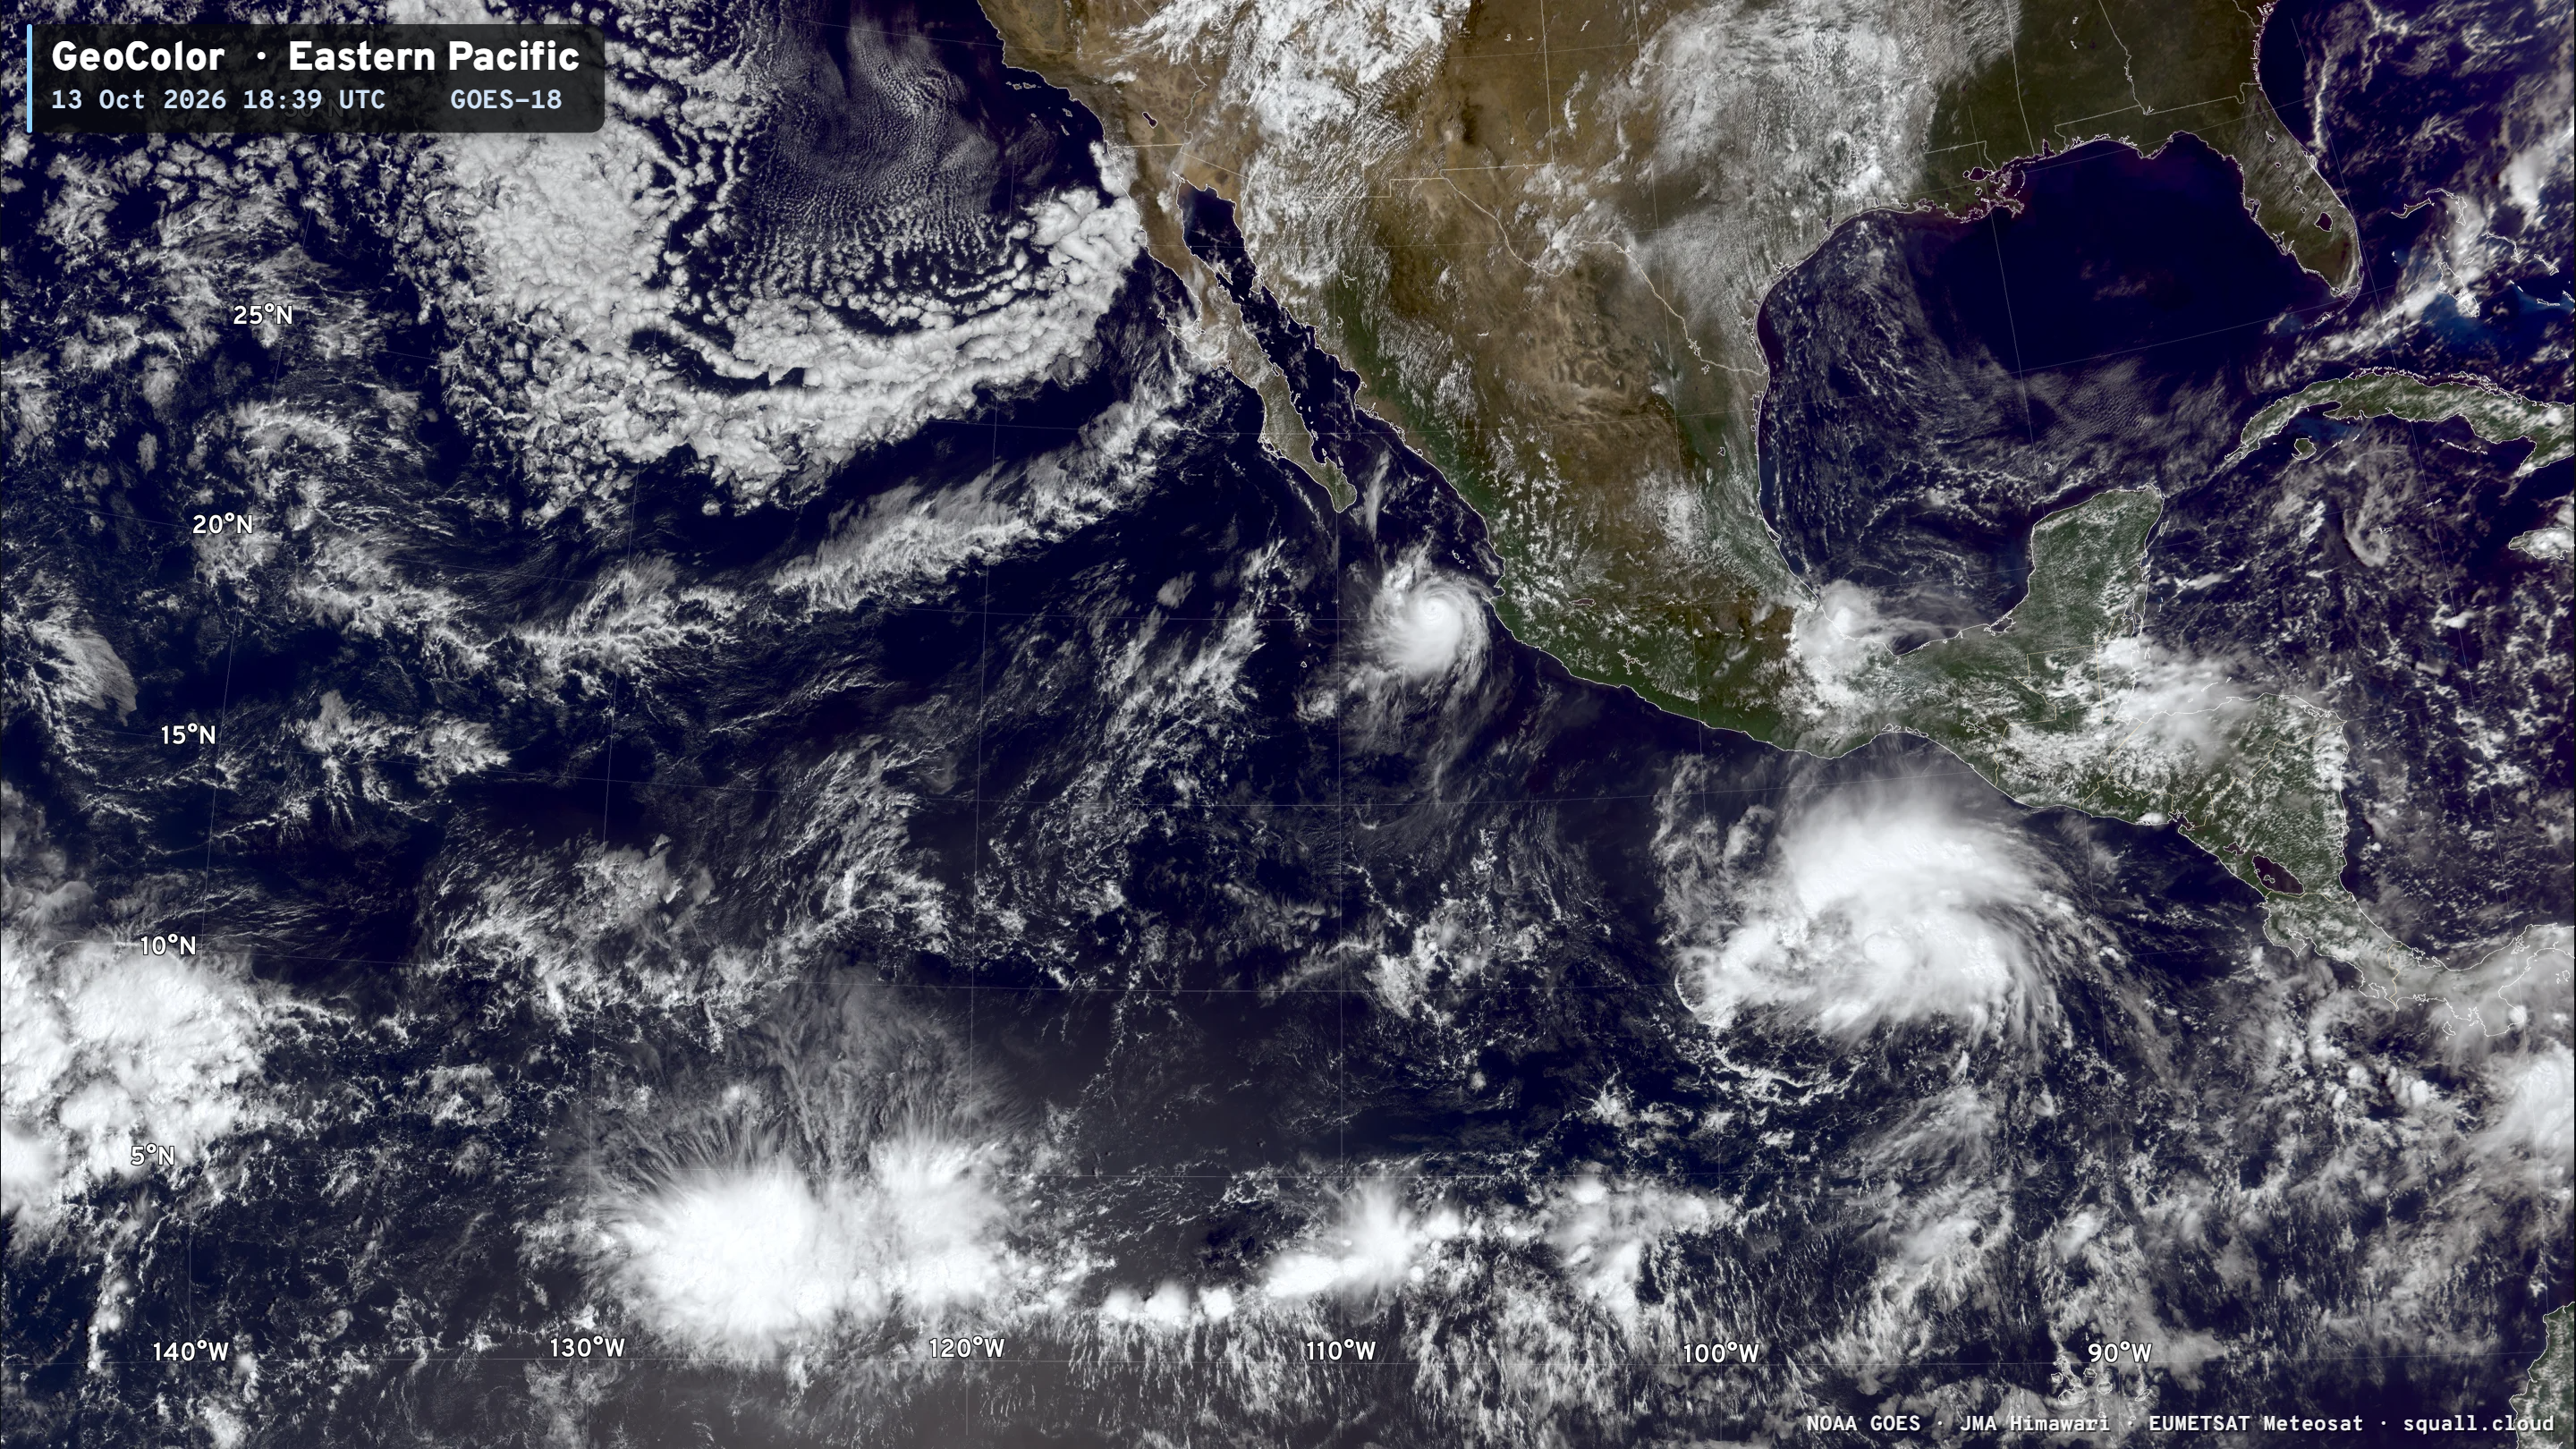
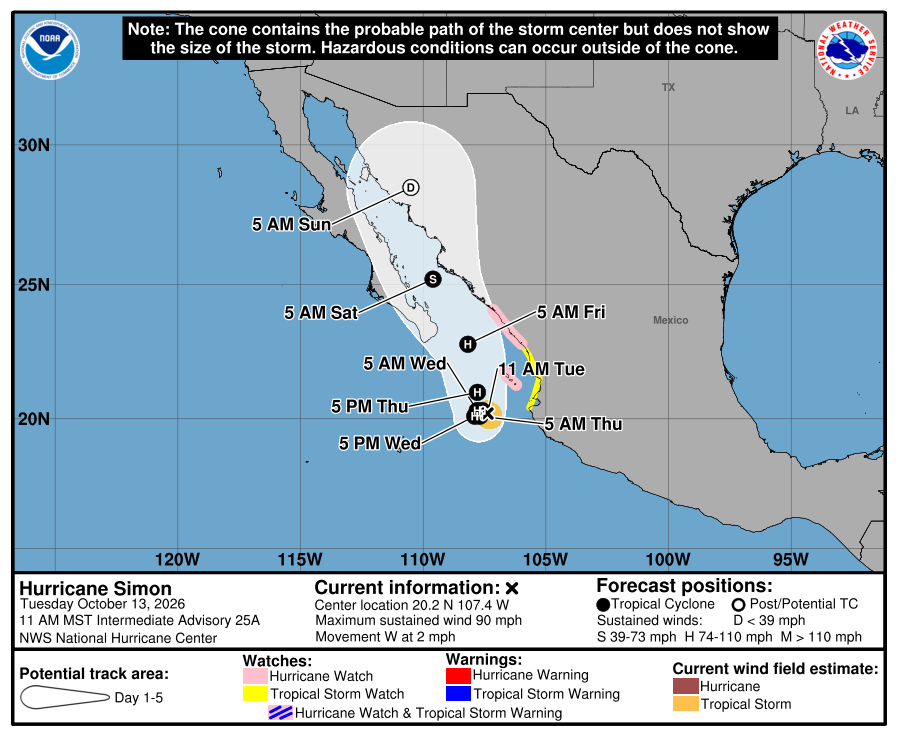
Category 1 Hurricane Simon slowly heading into the narrow Gulf of California for some reason — I guess because he can fit!
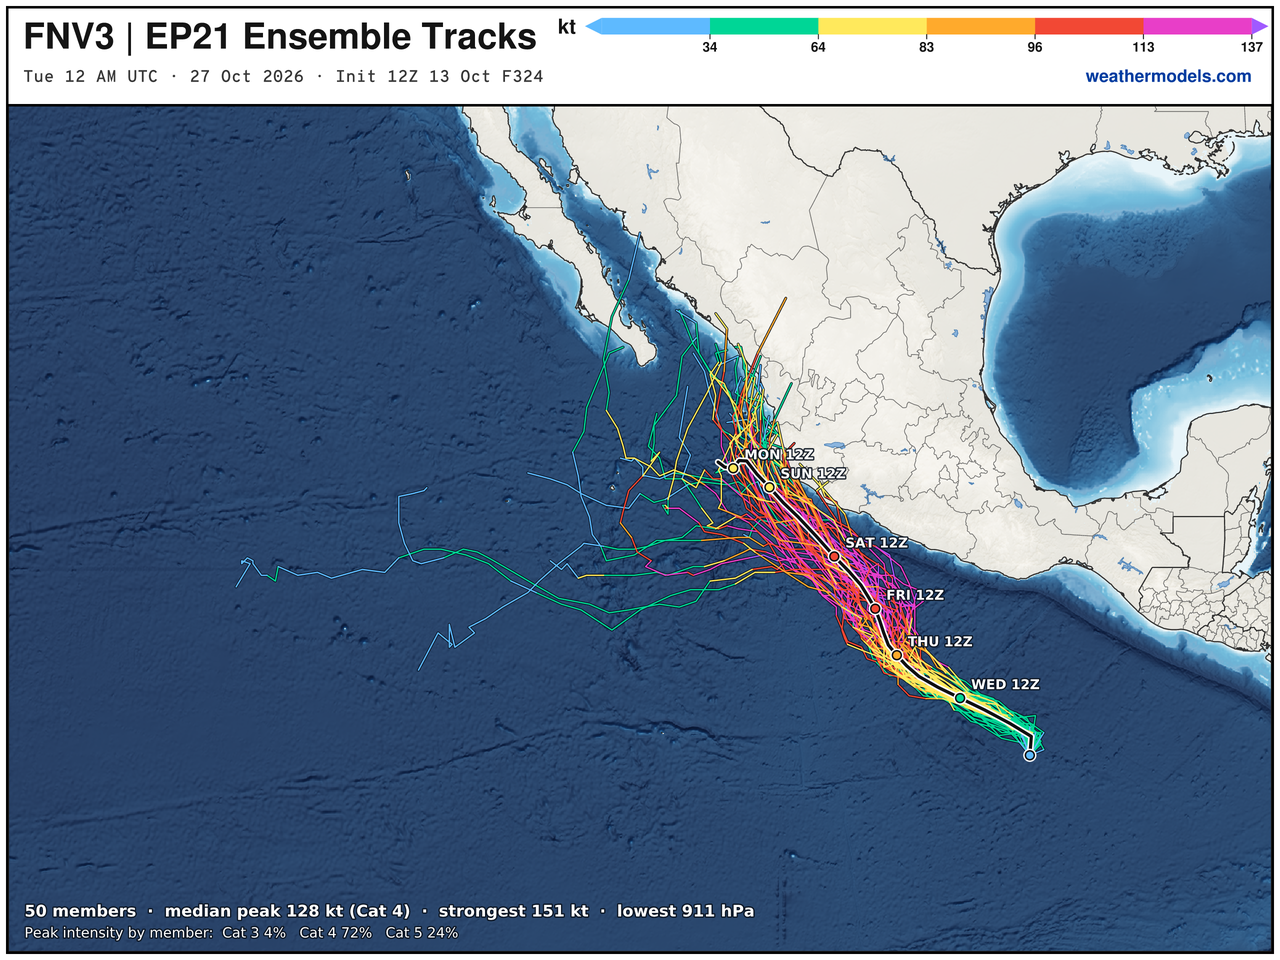
Tropical Depression 21E —> Category 4 Hurricane Trudy on a similar course as Simon in next 7-10 days
Since it’s forming so far south … plenty of very warm water (untapped) in next 5-days, and Trudy will really rack up the ACE points. NHC maximum intensity is 120-knots (Category 4)
FNV3 + Weather Next 3 from Google Deep Mind —> Category 4 or 5 Trudy. Wow!
BTW these maps really turned out well using my own ocean base-map (See my Atlas)
Western Pacific Tropics
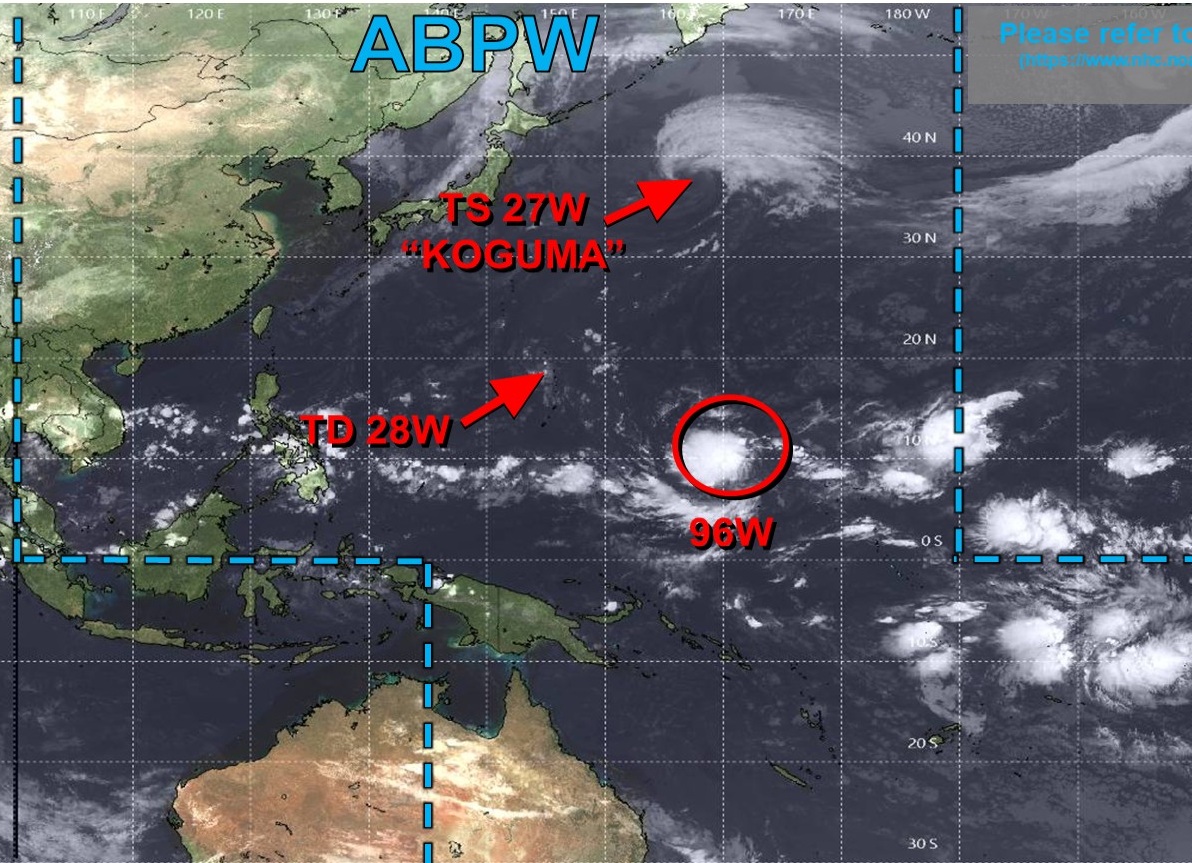
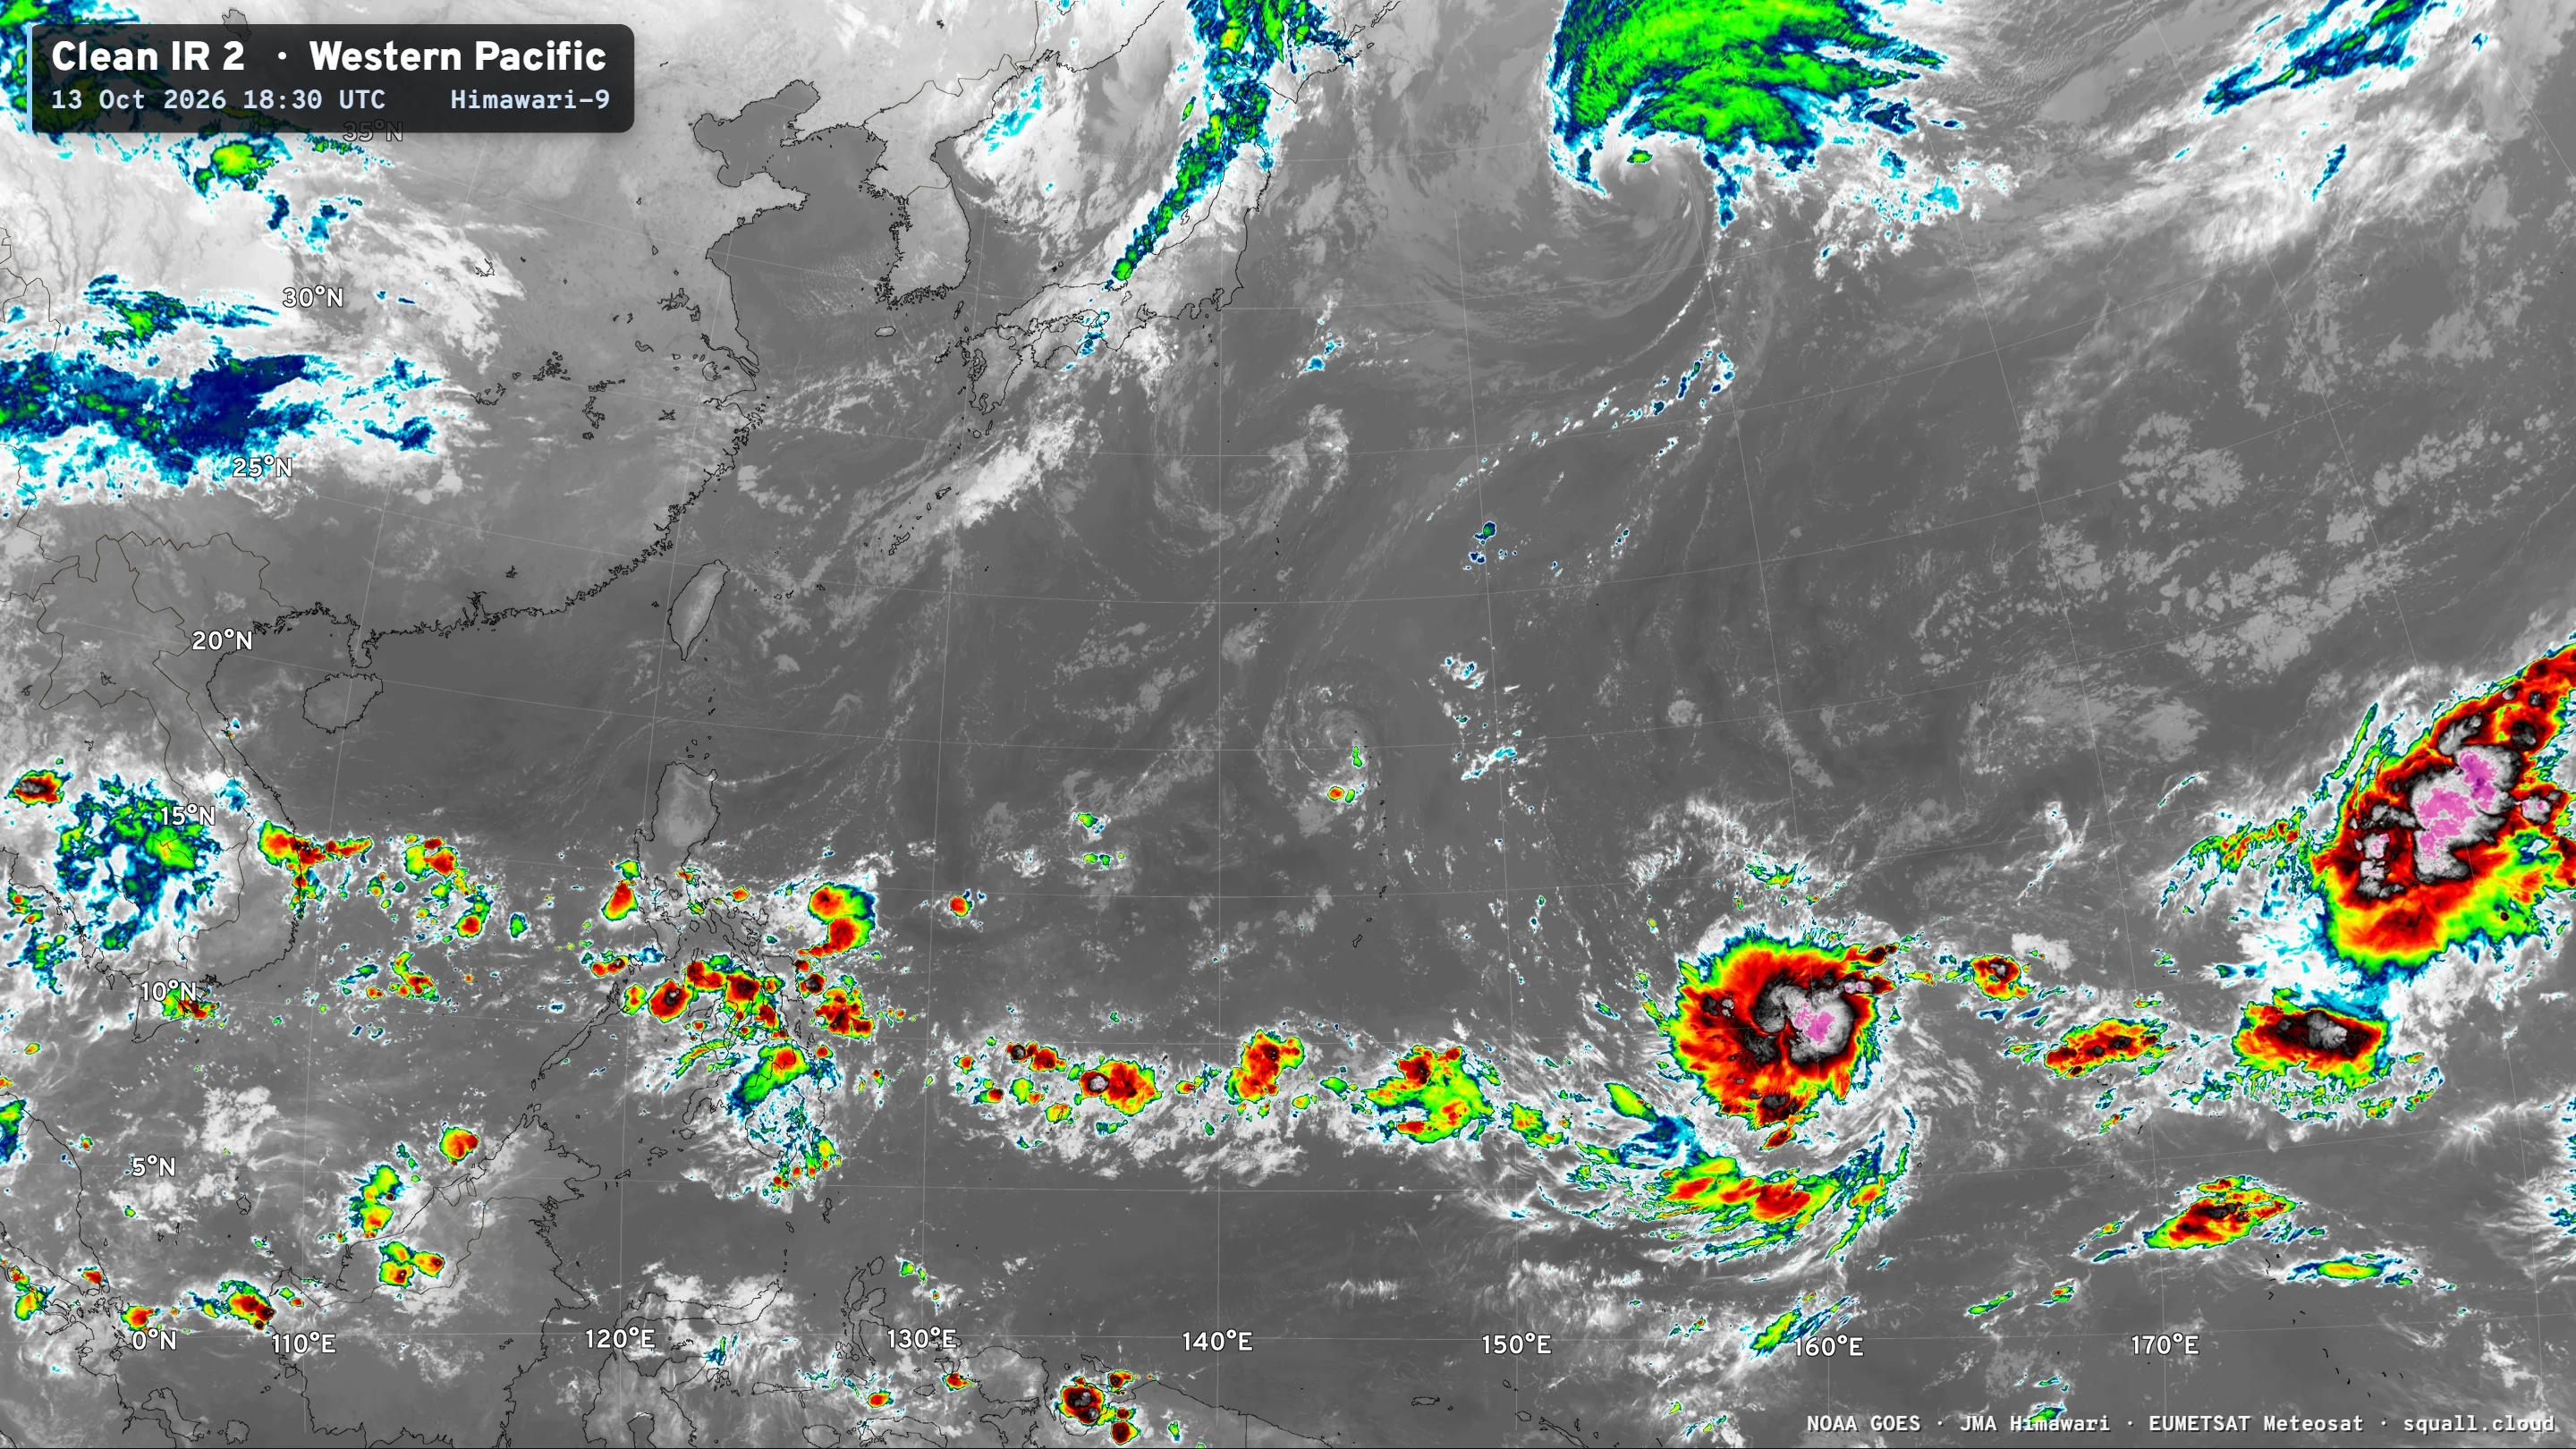
Invest 96W — looks like a tropical storm already — and it will become a Super Typhoon and likely very intense (150-knots / sub-900 mb pressure)
Next name is Champi
And it will be a Champion for sure!
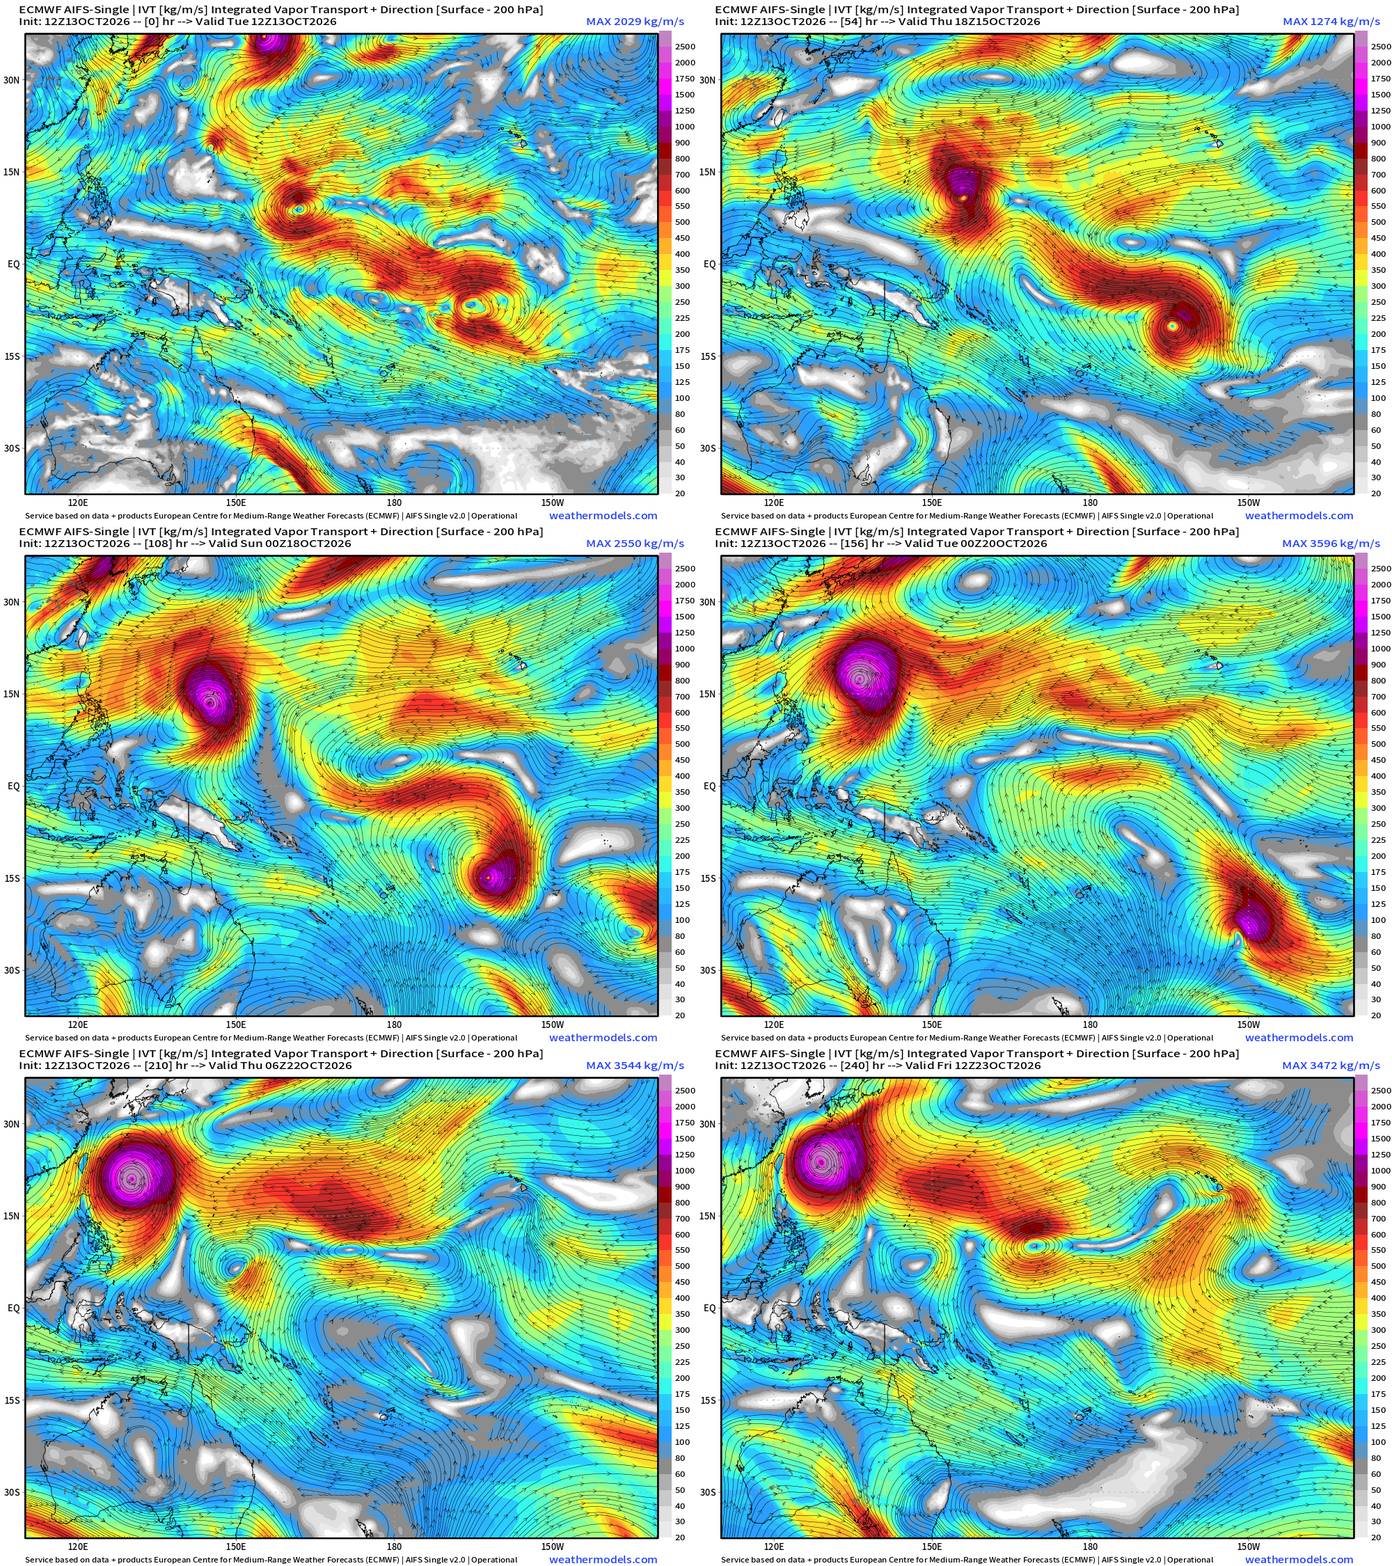
All systems go for a monster Super Typhoon — easily Category 5 heading WNW from the far eastern corner of the WPAC basin. Plenty of warm water, untapped oceanic heat content … expect sub-900 mb pressure. Guam needs to keep an eye out!
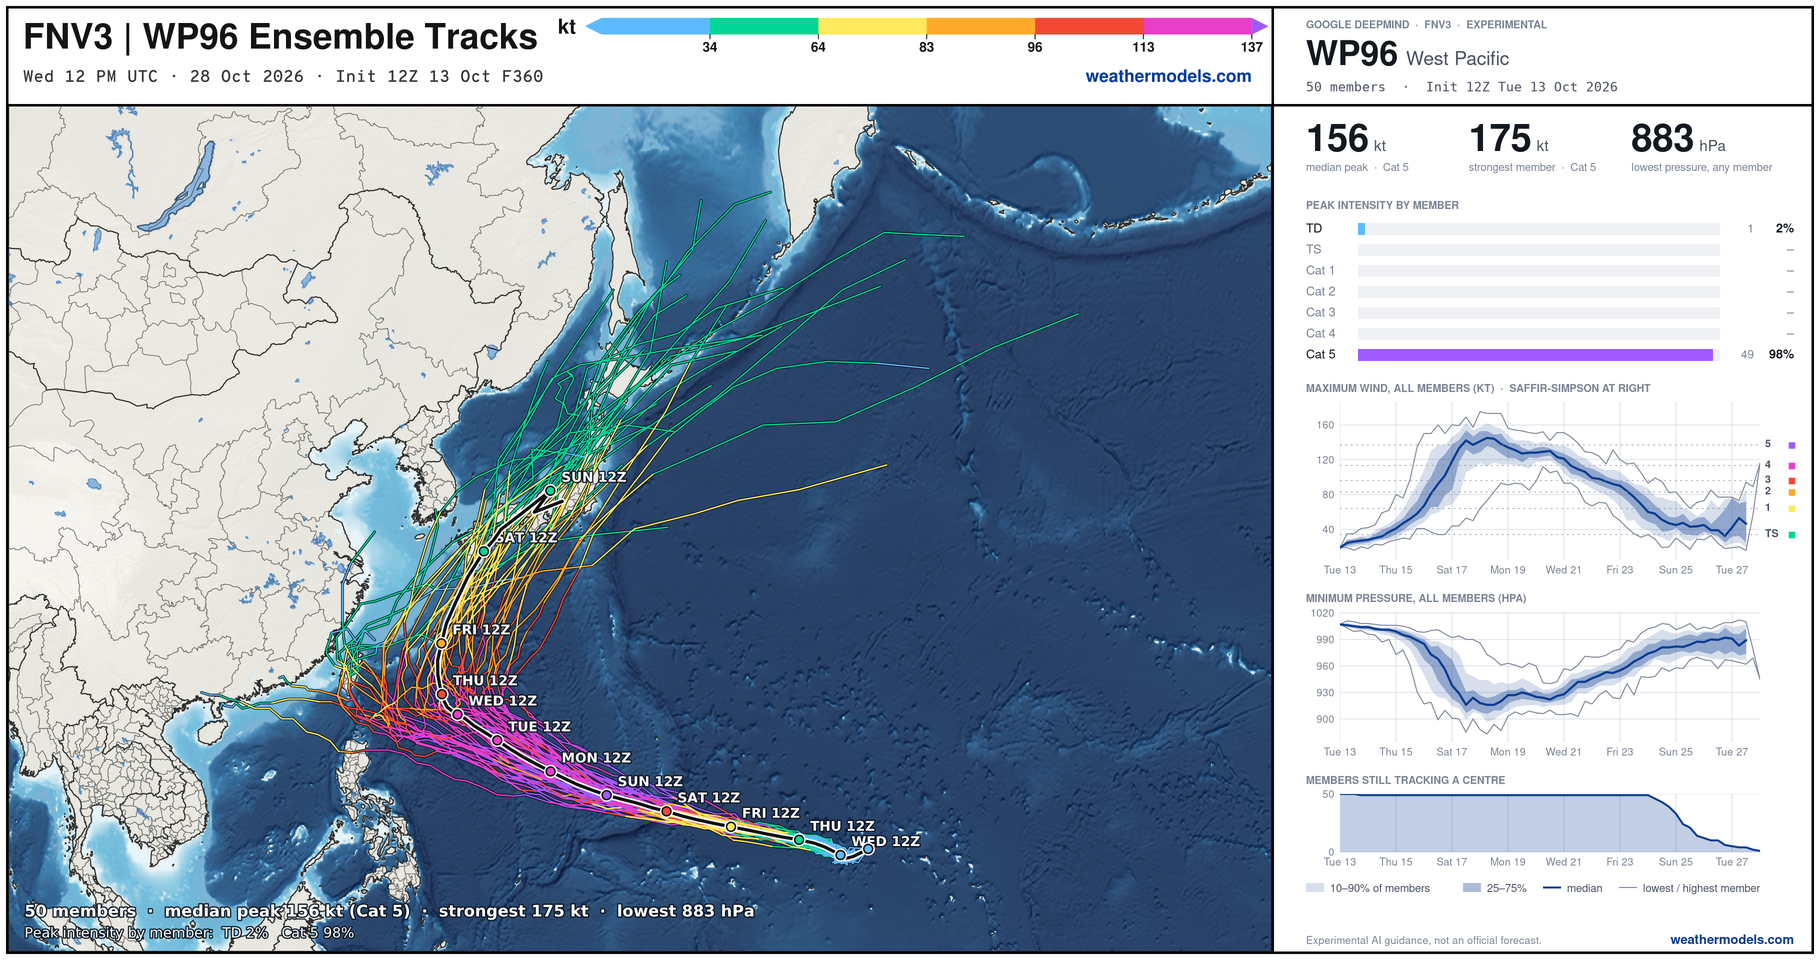
Median ensemble member peak at 156 knots … could go to 175 knots and 883 mb pressure. Insane!
Thank you for visiting / reading — always more to come!
Visit Global Tropical Cyclones for more ACE information, as well as my original climatlas.com/tropical site with much new research including a calibrated “Best Track” and historical tropical cyclone browser with plenty of interesting features like rankings of storms by their IKE (size). ACE up to 816.

Satellite imagery from Squall Cloud. Maps sourced from weathermodels.com designed and innovated by yours truly! Please subscribe there for real-time access to the newest maps, charts from all of the weather models including ECMWF and AIFS, and NOAA GFS/GEFS, HRRR/RRFS and Blend of Models (NBM). NOAA WPC and SPC for fronts/convective outlooks. Our own content is now sourced from hottestsince.com and weather.city and celsius.earth, and squall.cloud and weather.football and global-tropical-cyclones.com and precip.earth and forecastcanada.com
My Atlantic Hurricane Season Forecast (2026)
From April 7, 2026: Atlantic Seasonal Hurricane Forecast: (11/5/2)
9-13 Named Storms (11 most likely)
4-7 Hurricanes (5 or 6 most likely)
1-3 Major Hurricanes (2 most likely)
Accumulated Cyclone Energy: 75-85 (well below normal)
NOAA 2026 Atlantic Hurricane Season Forecast
Previous in this storyline: Atlantic remains quiet this week. The Pacific gearing up for another flurry of El Niño fueled tropical activity (AUG 17)
- Milepost
- 1623 · laid 2026-10-13T19:11:33Z
- Source
- https://weather.substack.com/p/october-13-2026-tuesday-tropical · October 13, 2026 Tuesday Tropical Update
- Tagged
- I-34 El Niño · El Niño / La Niña 2026 · Equatorial Pacific (0, -140) · by rule, at build
- Digest
- 6cc12df28b35ca656e104ce3f8bf78f0036f62c7908d7fd520892b638a863ef4