Weak coastal storm this weekend with mini-cold snap for Eastern US

Something very new and cool that is a game changer.
This is a GPU enable WRF from a startup called Recast Systems (into weather modification) based upon the 4 to 7 day ECMWF HRES IFS forecast. The upper-level pattern is spectrally nudged from the global model to the WRF (which is called WOOF) so it remains faithful. The output is whatever you want — pressure level, surface, isentropic, severe weather parameters, and at whatever frequency e.g. 15-minutes. Here’s the upper-level trough from ECMWF 12z —> WOOF (WRF) using RAP/HRRR physics at 9-km resolution
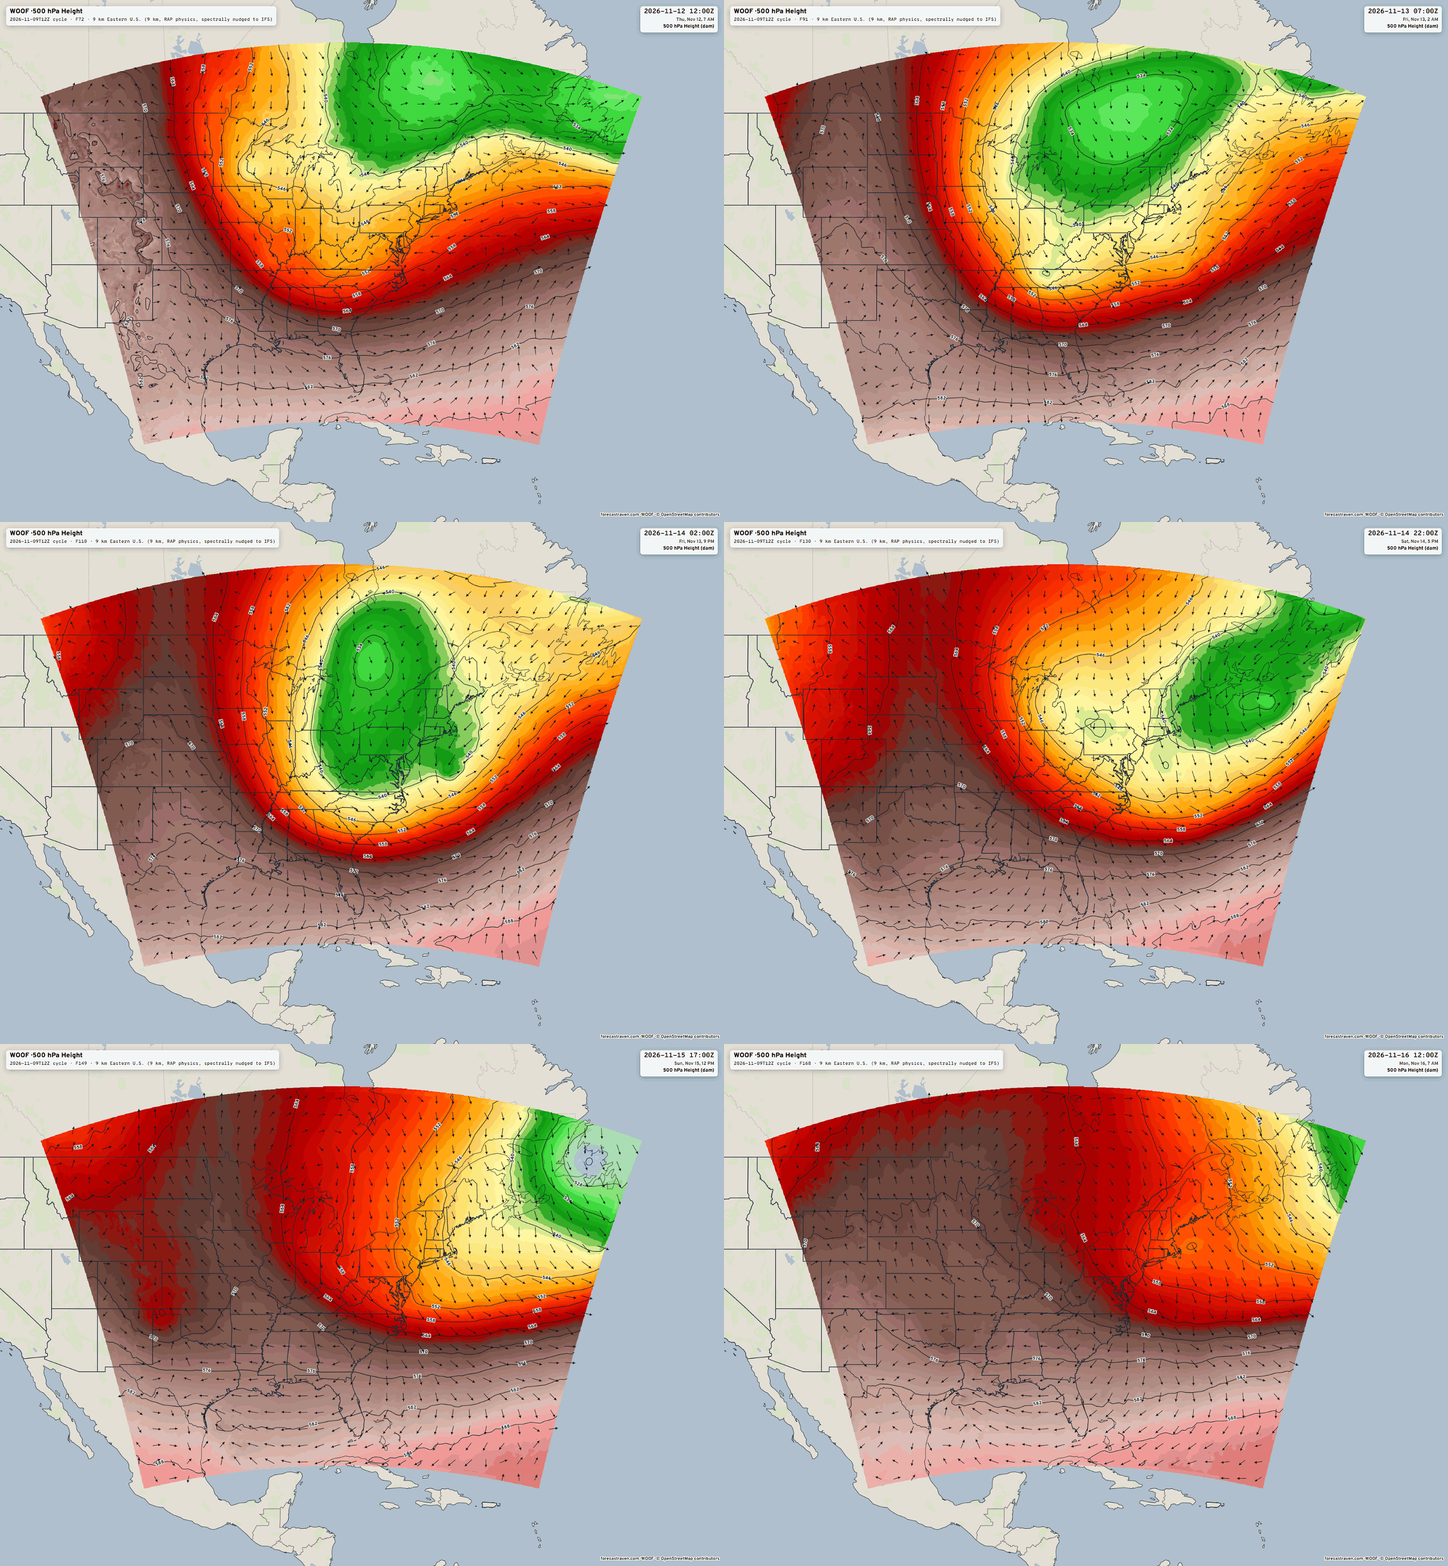
View interactive maps examples on Forecast Raven
Why is this important? The field was (too) rapidly moving to A.I. trained mesoscale models through various techniques to dramatically reduce the computational expense of high resolution e.g. 3 km forecasts like HRRR and RRFS. However, the AI trained systems are not remotely close in quality to the original full-physics models. They are great/fine for global modeling (AIFS proves this!) but at 3 km or 9 km, we actually want the full-physics output in order to generate downstream products like severe weather parameters, terrain following winds for fire weather, snowfall, and precipitation. This example was a 9-km domain but a 3-km nest would be easy to run inside, and only require another 50 cents worth of computing.
I’m going to continue building Forecast Raven, and automate domains around the U.S and world to show off the capabilities, and see how much interest there is in having me handle the underlying data or output. Recast Systems offers a service already, so I don’t need to replicate or compete with them. Of course, I’ll be my own biggest consumer.
We have snowfall coming! Winter arrives this weekend
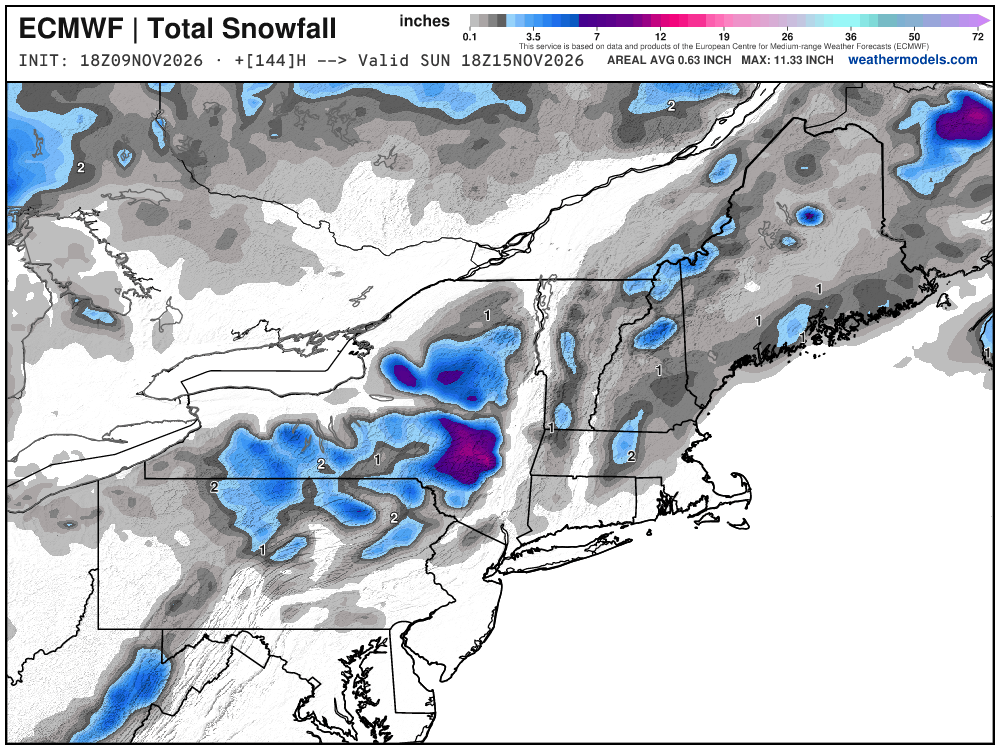
It’s a start — not going to be a major snow storm, but Lake Effect snowfall off Superior could add up to 6”-12” across the Upper Peninsula of Michigan. Maybe 6”+ in New York, and then wider 1” to 3” across New England well away from the coast.
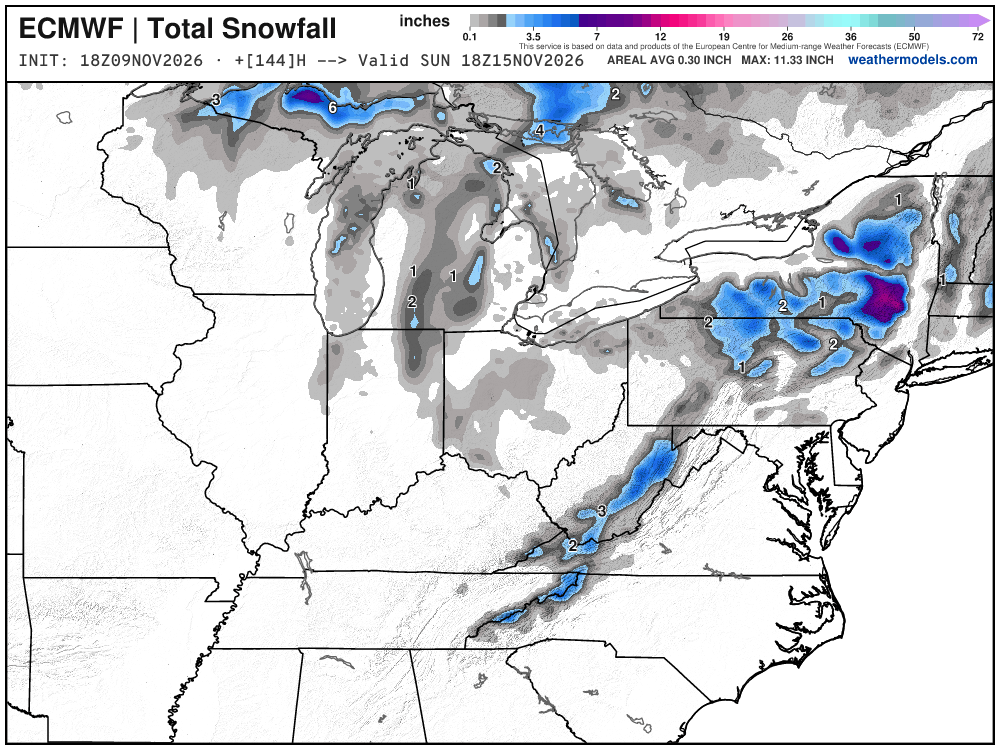
Mountain snowfall perhaps with flurries into North Georgia. Hopefully this trends upward over the next few days !
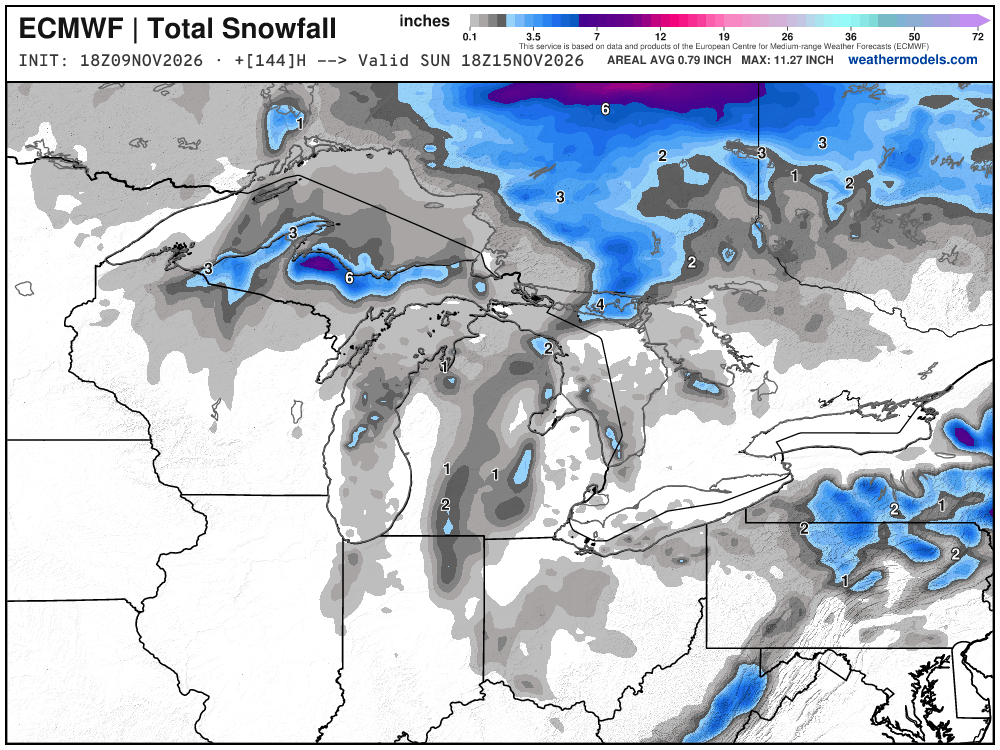
The coastal storm is 990 mb or so — not a bomb cyclone, but a broad area of low pressure within the large upper-level trough. The jet stream isn’t available as much for this type of lifecycle. Note, in mid-December, this circulation would have a lot colder air from Canada to work with — and likely be blustery with snowfall to the coast.
HRRR Simulated Radar through Wednesday 1 PM ET
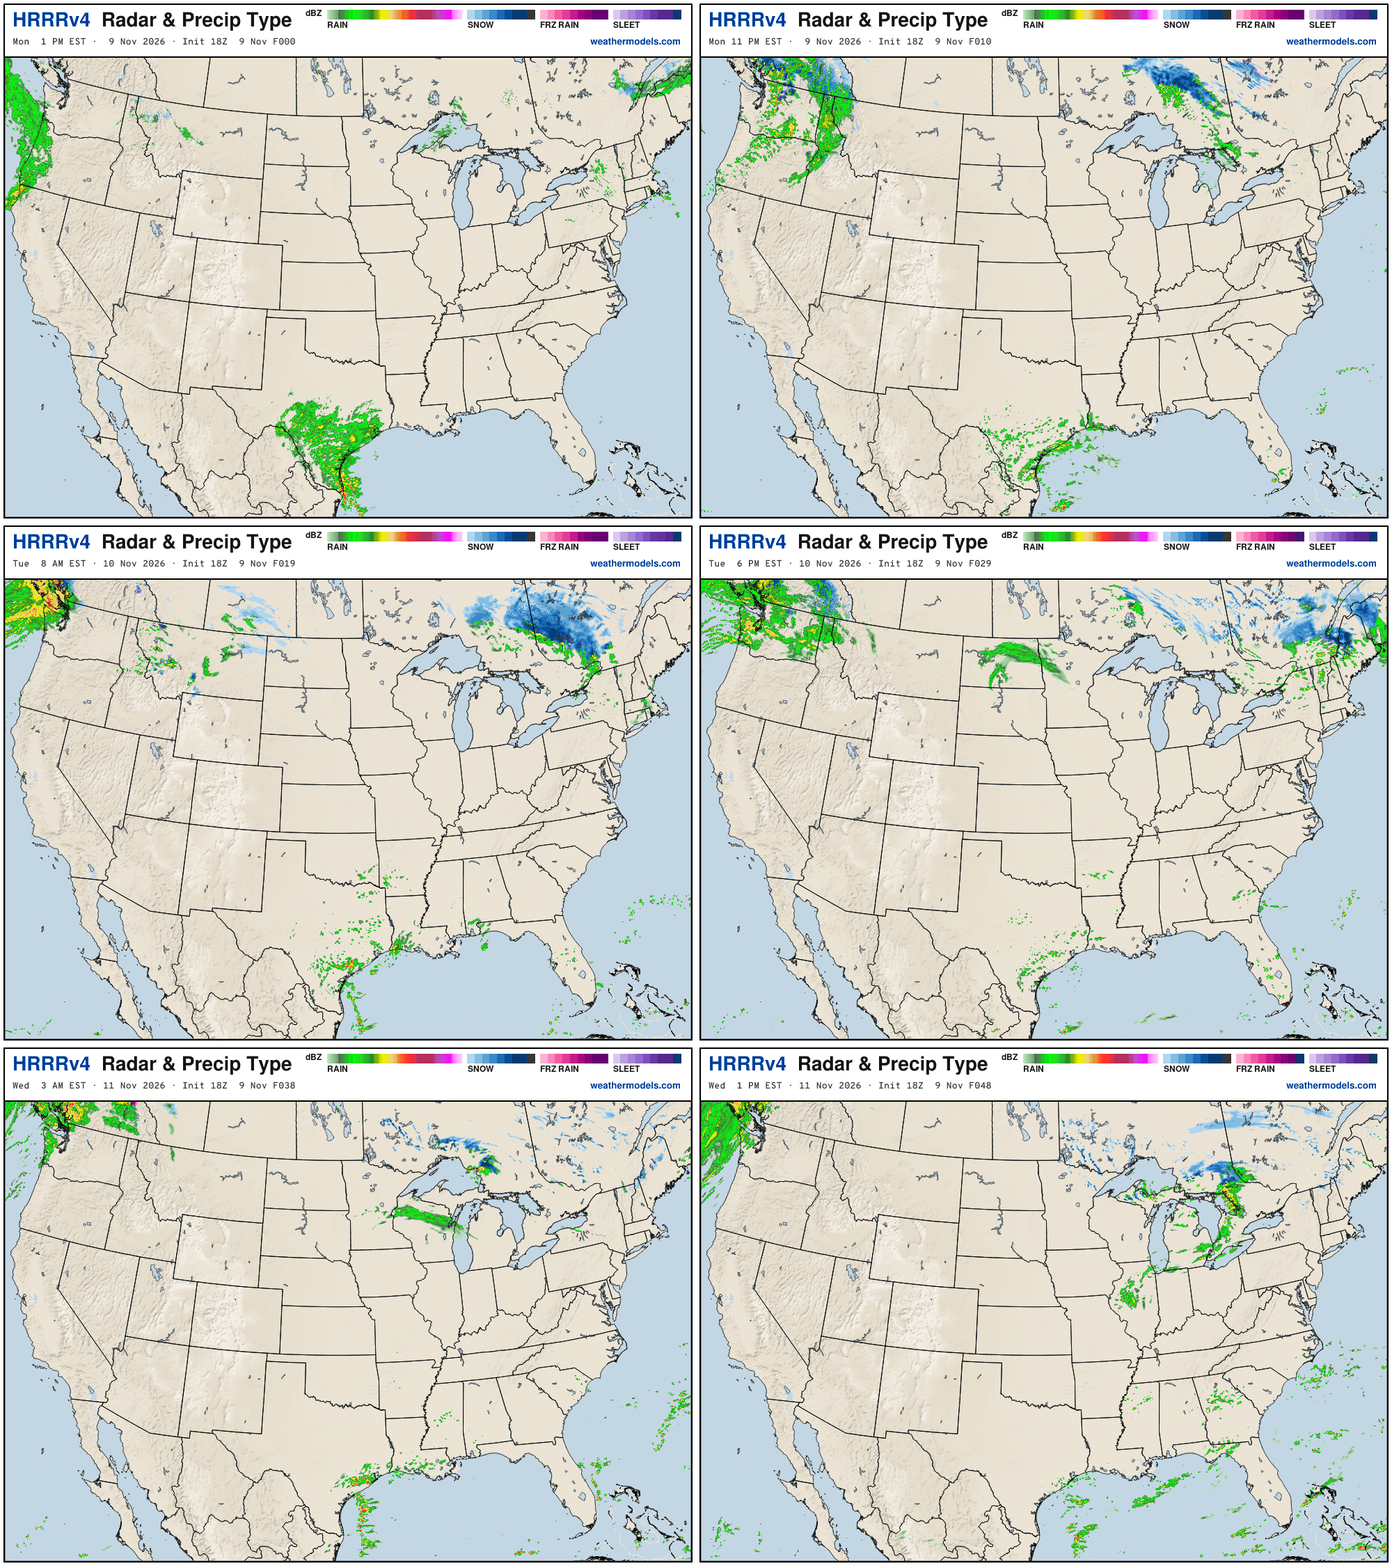
Multiple storm systems continue to bombard the Pacific Northwest — they’re used to that in mid-November. A clipper system in heading through the Great Lakes into New England with some light snowfall for Maine. The heavier rain ends in Texas.
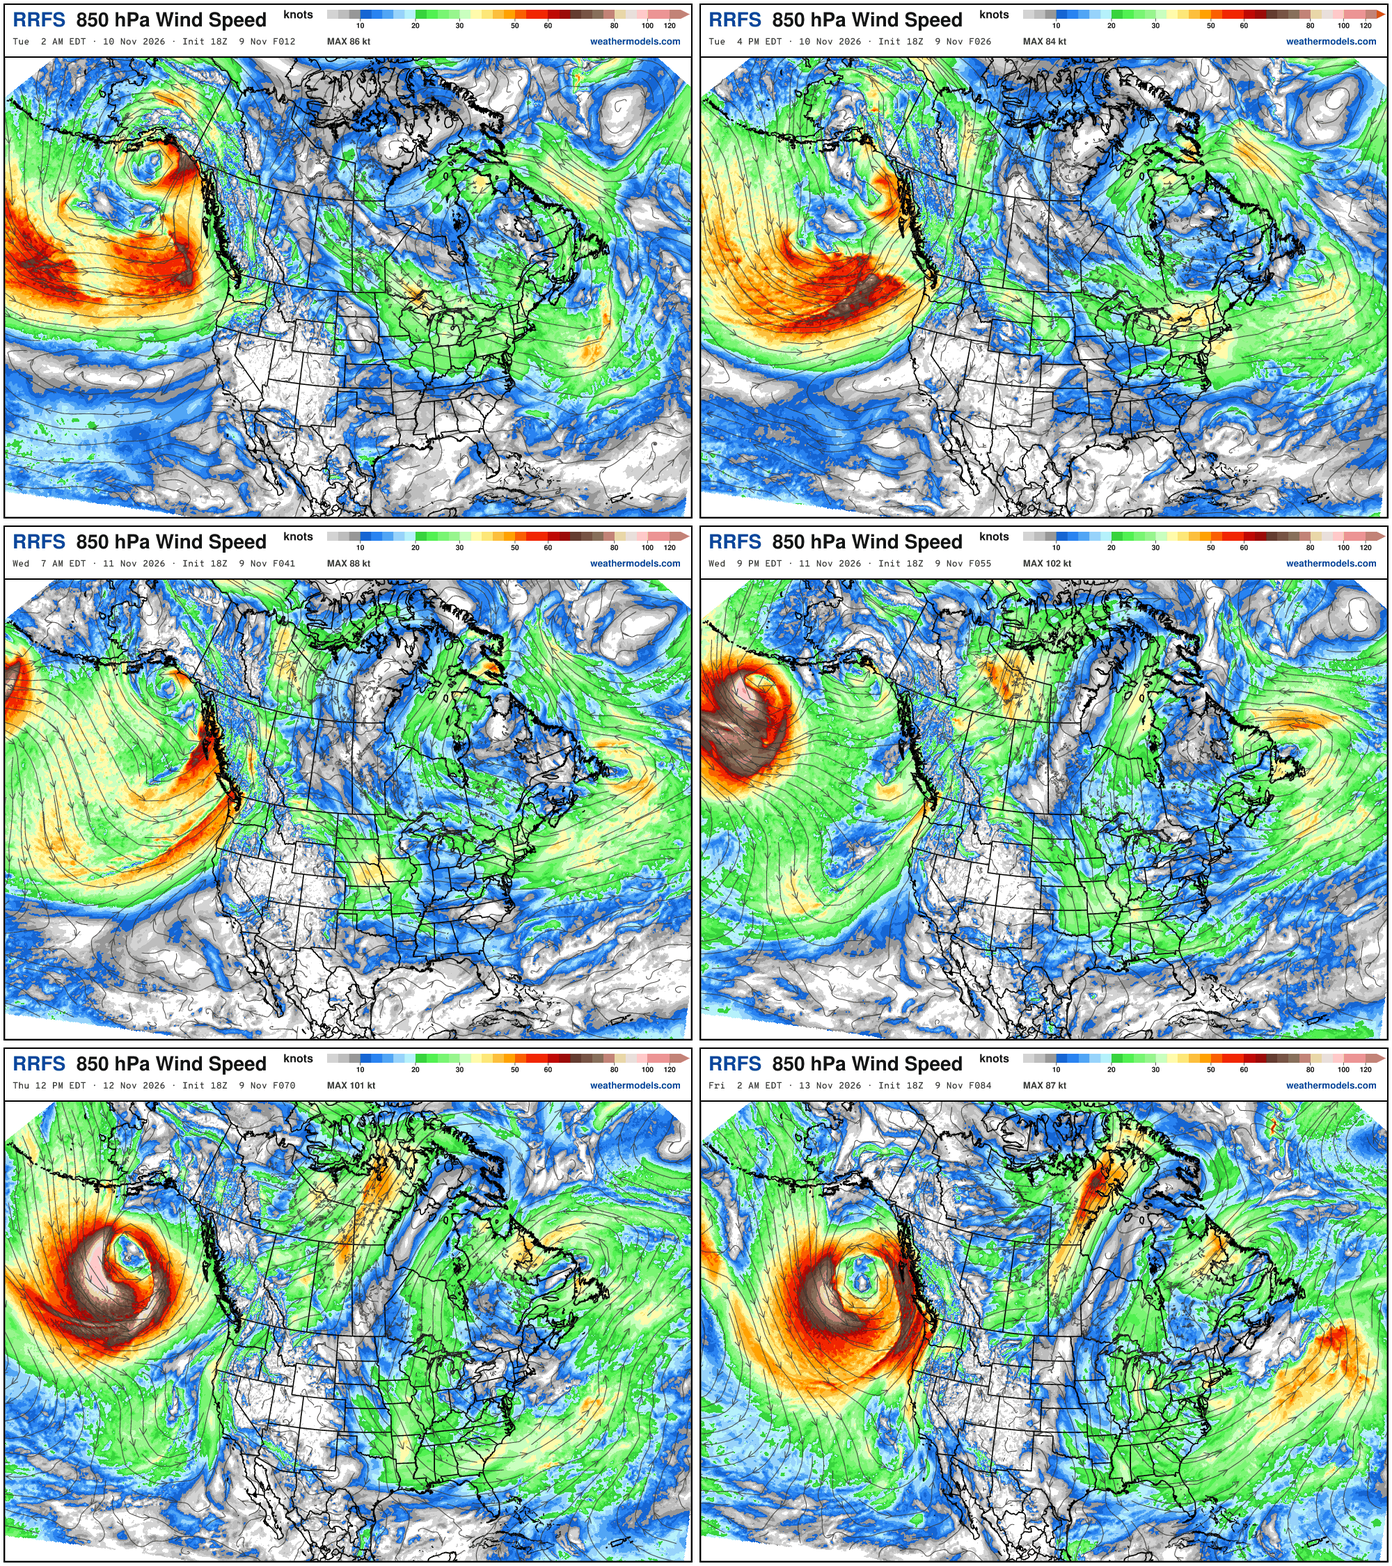
RRFS 850 mb Wind Speed —> Parade of beautiful cyclones mainly crashing into Alaska panhandle and western Canada. Check out that monster coming down the pipeline into this weekend.
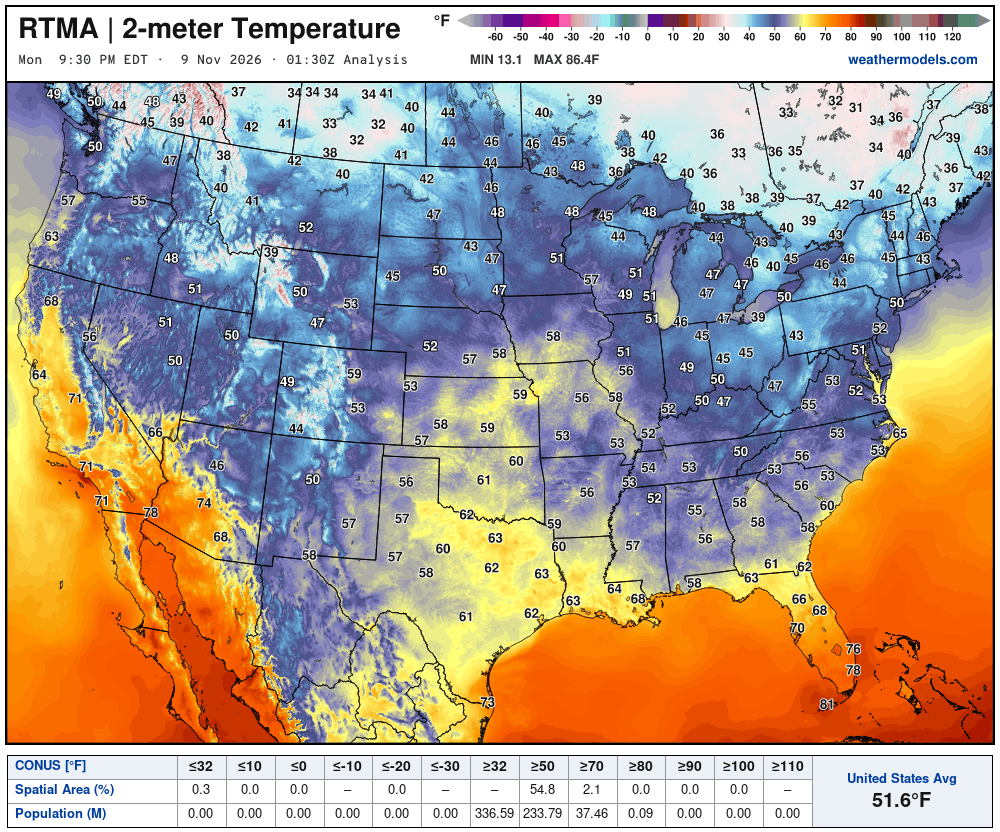
Temperature Analysis Friday at 8:30 PM ET
Temperature Analysis | Anomaly from Normal
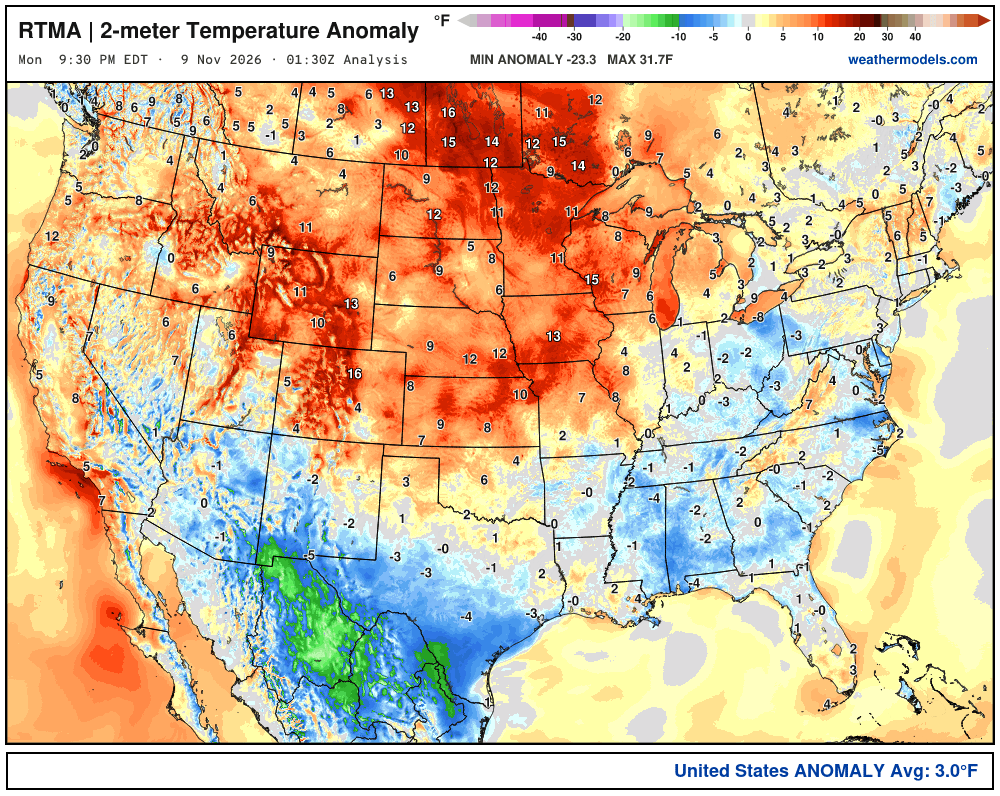
Lower 48 was 3.0ºF above normal
Low Temperatures Tuesday Morning
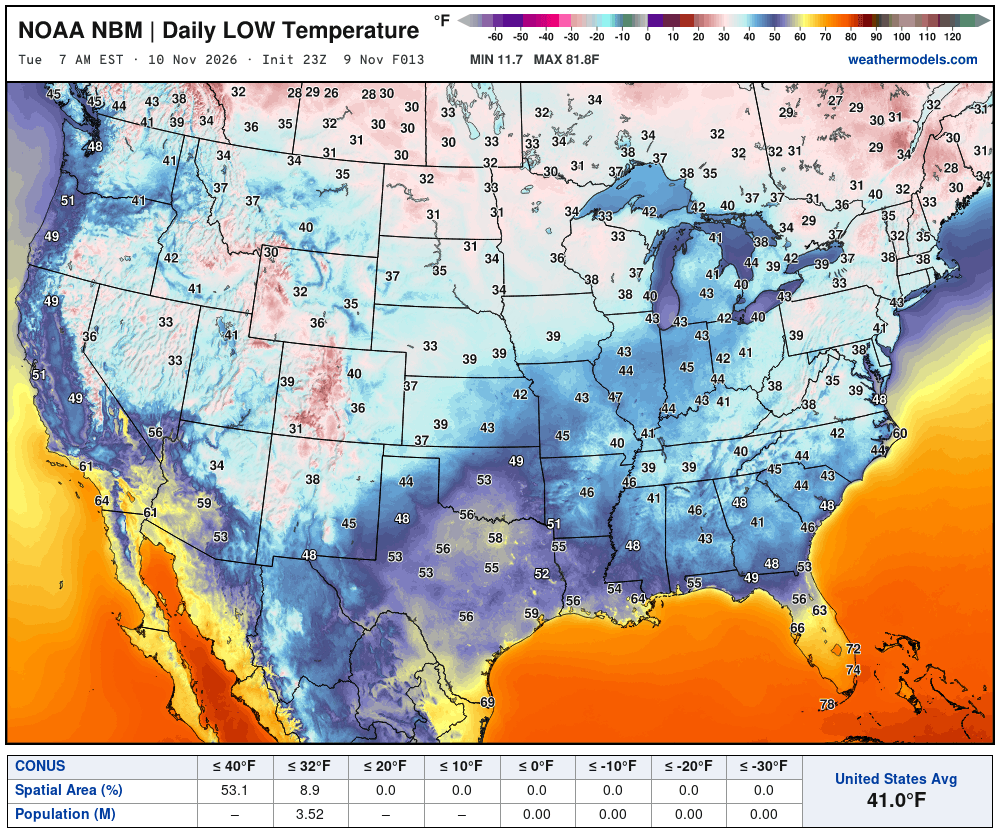
Only 3.5 million below freezing
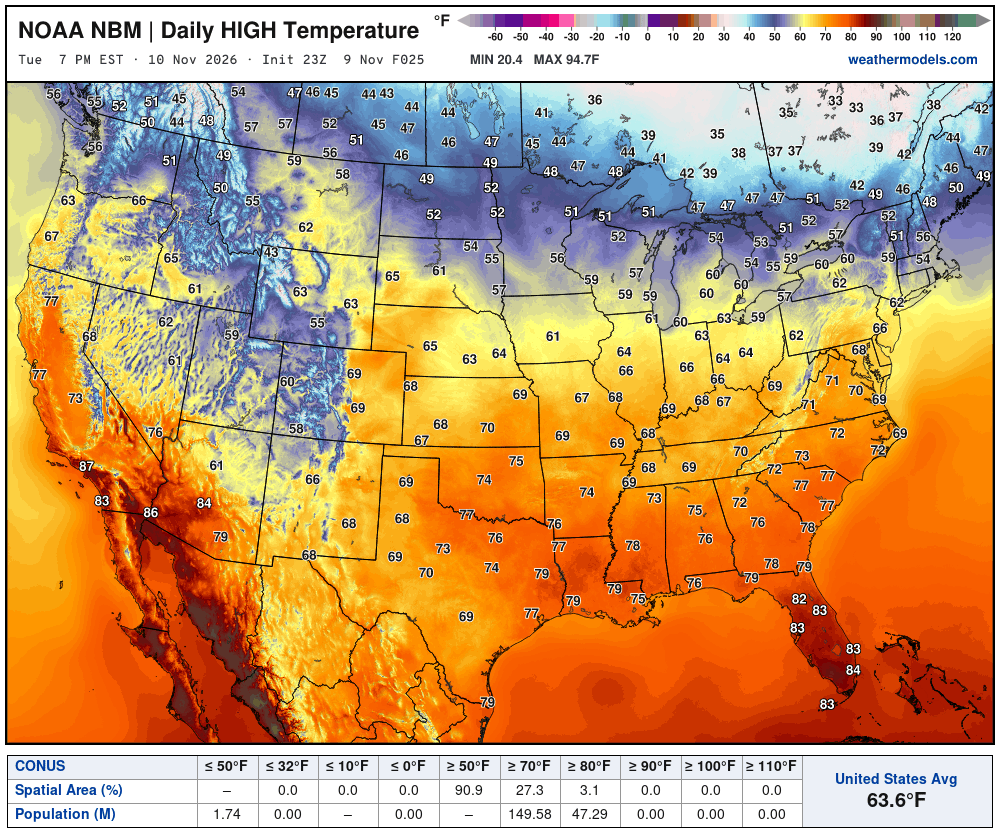
High Temperatures on Tuesday | About 27 million at least 70°F
High Temperatures next 9-Days through November 19th
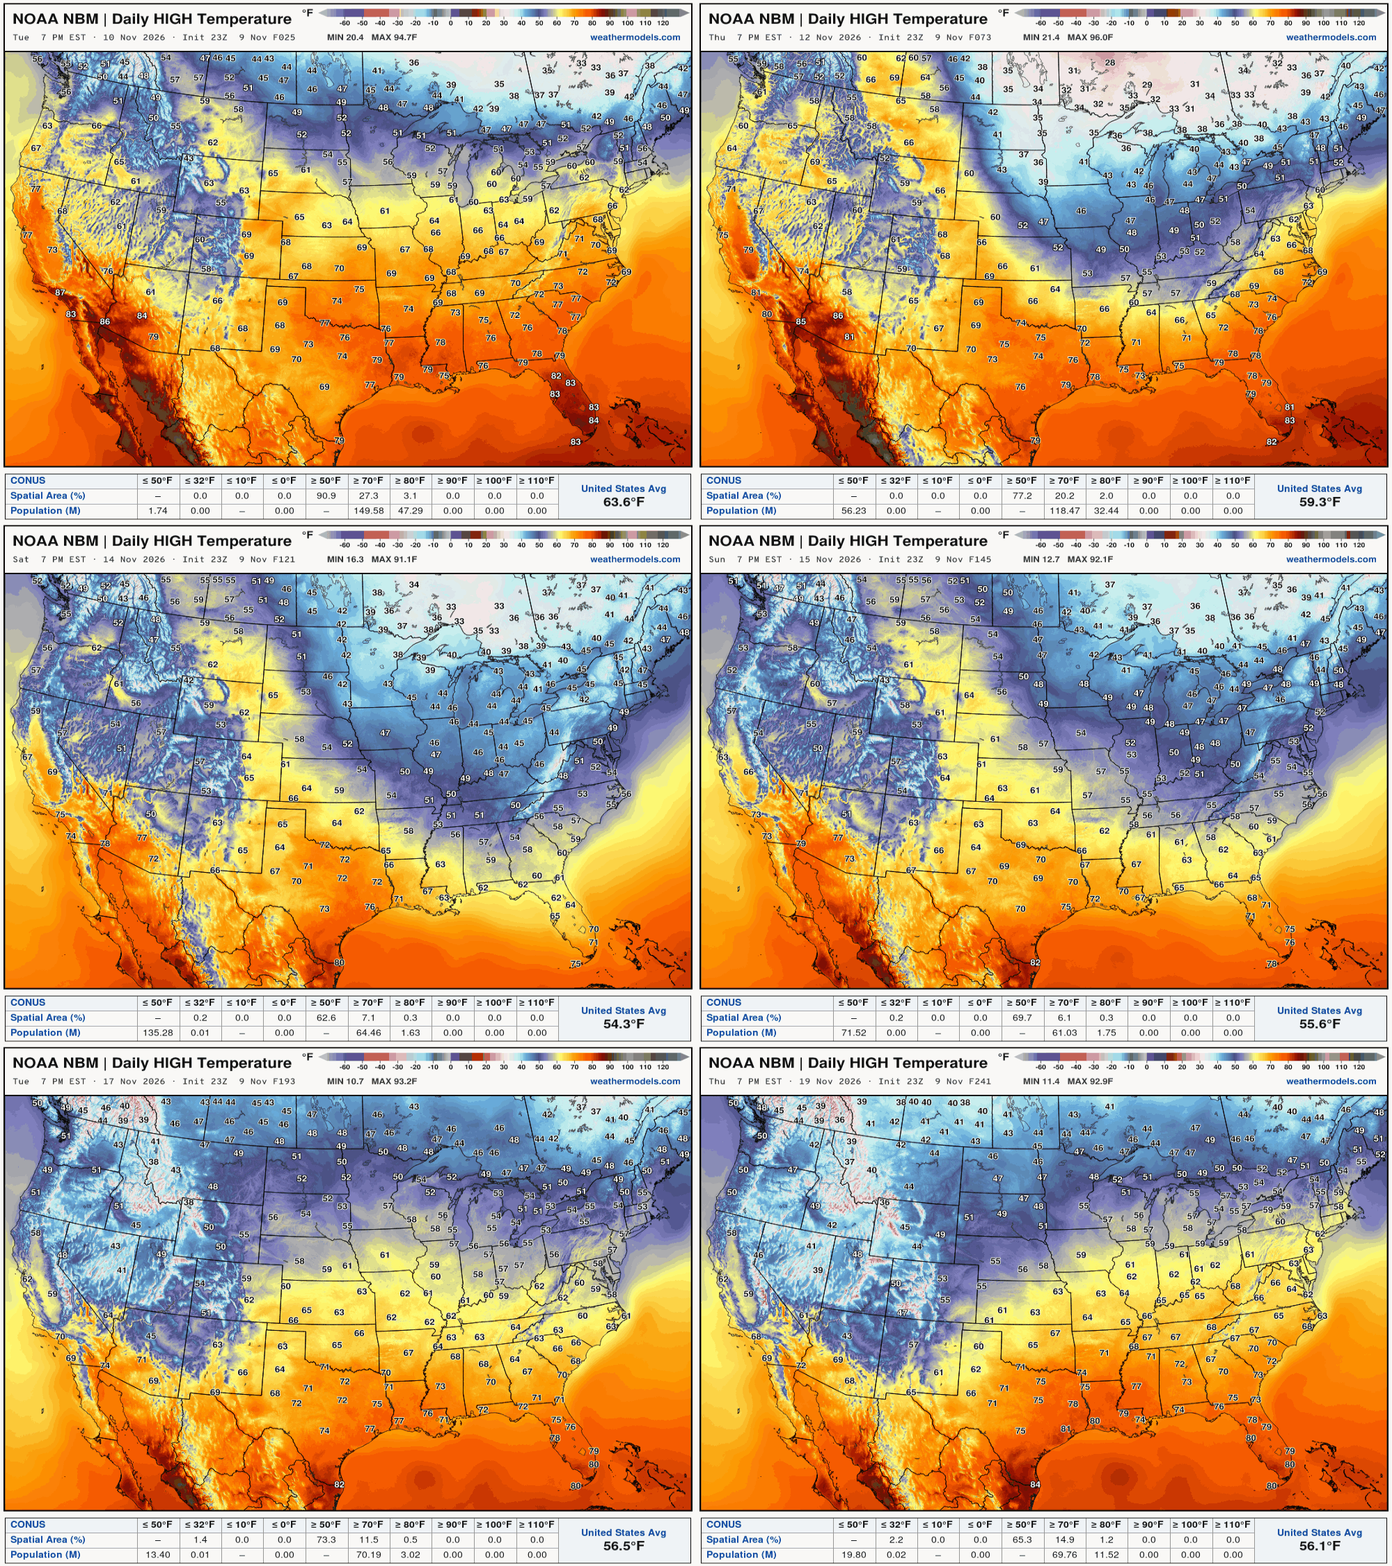
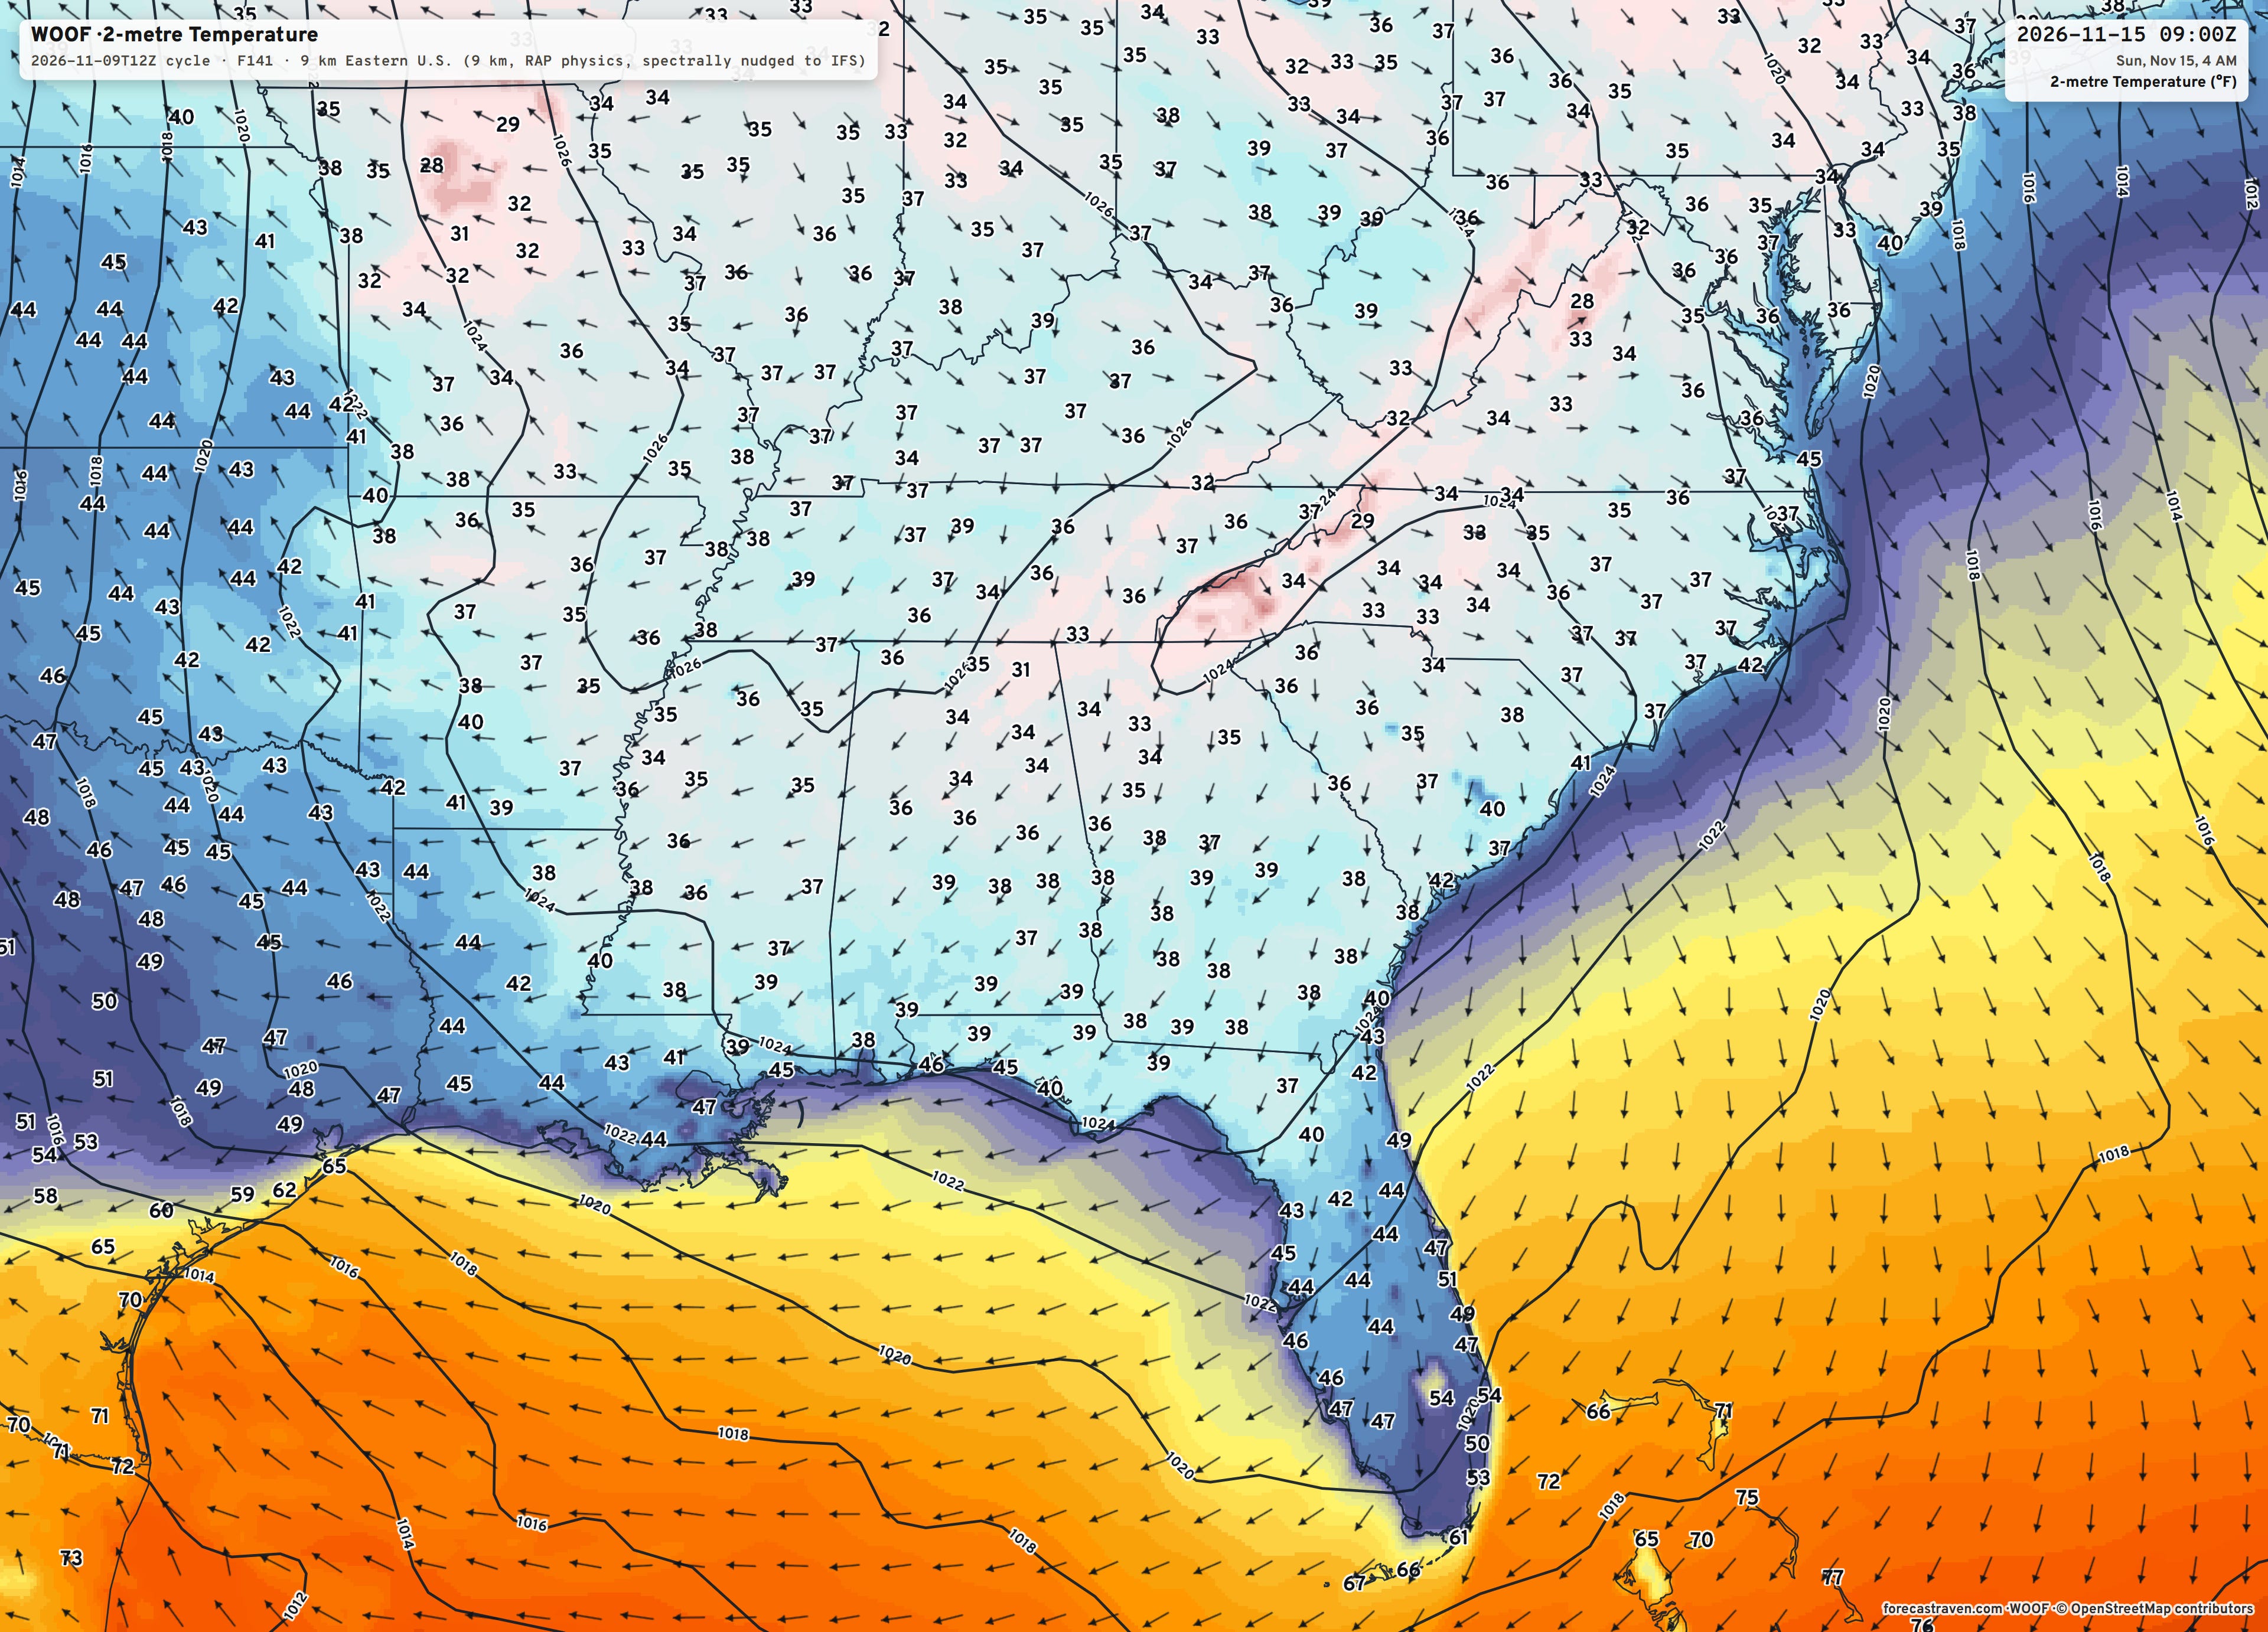
Our brief cold snap — first freeze into the Southeast this weekend.
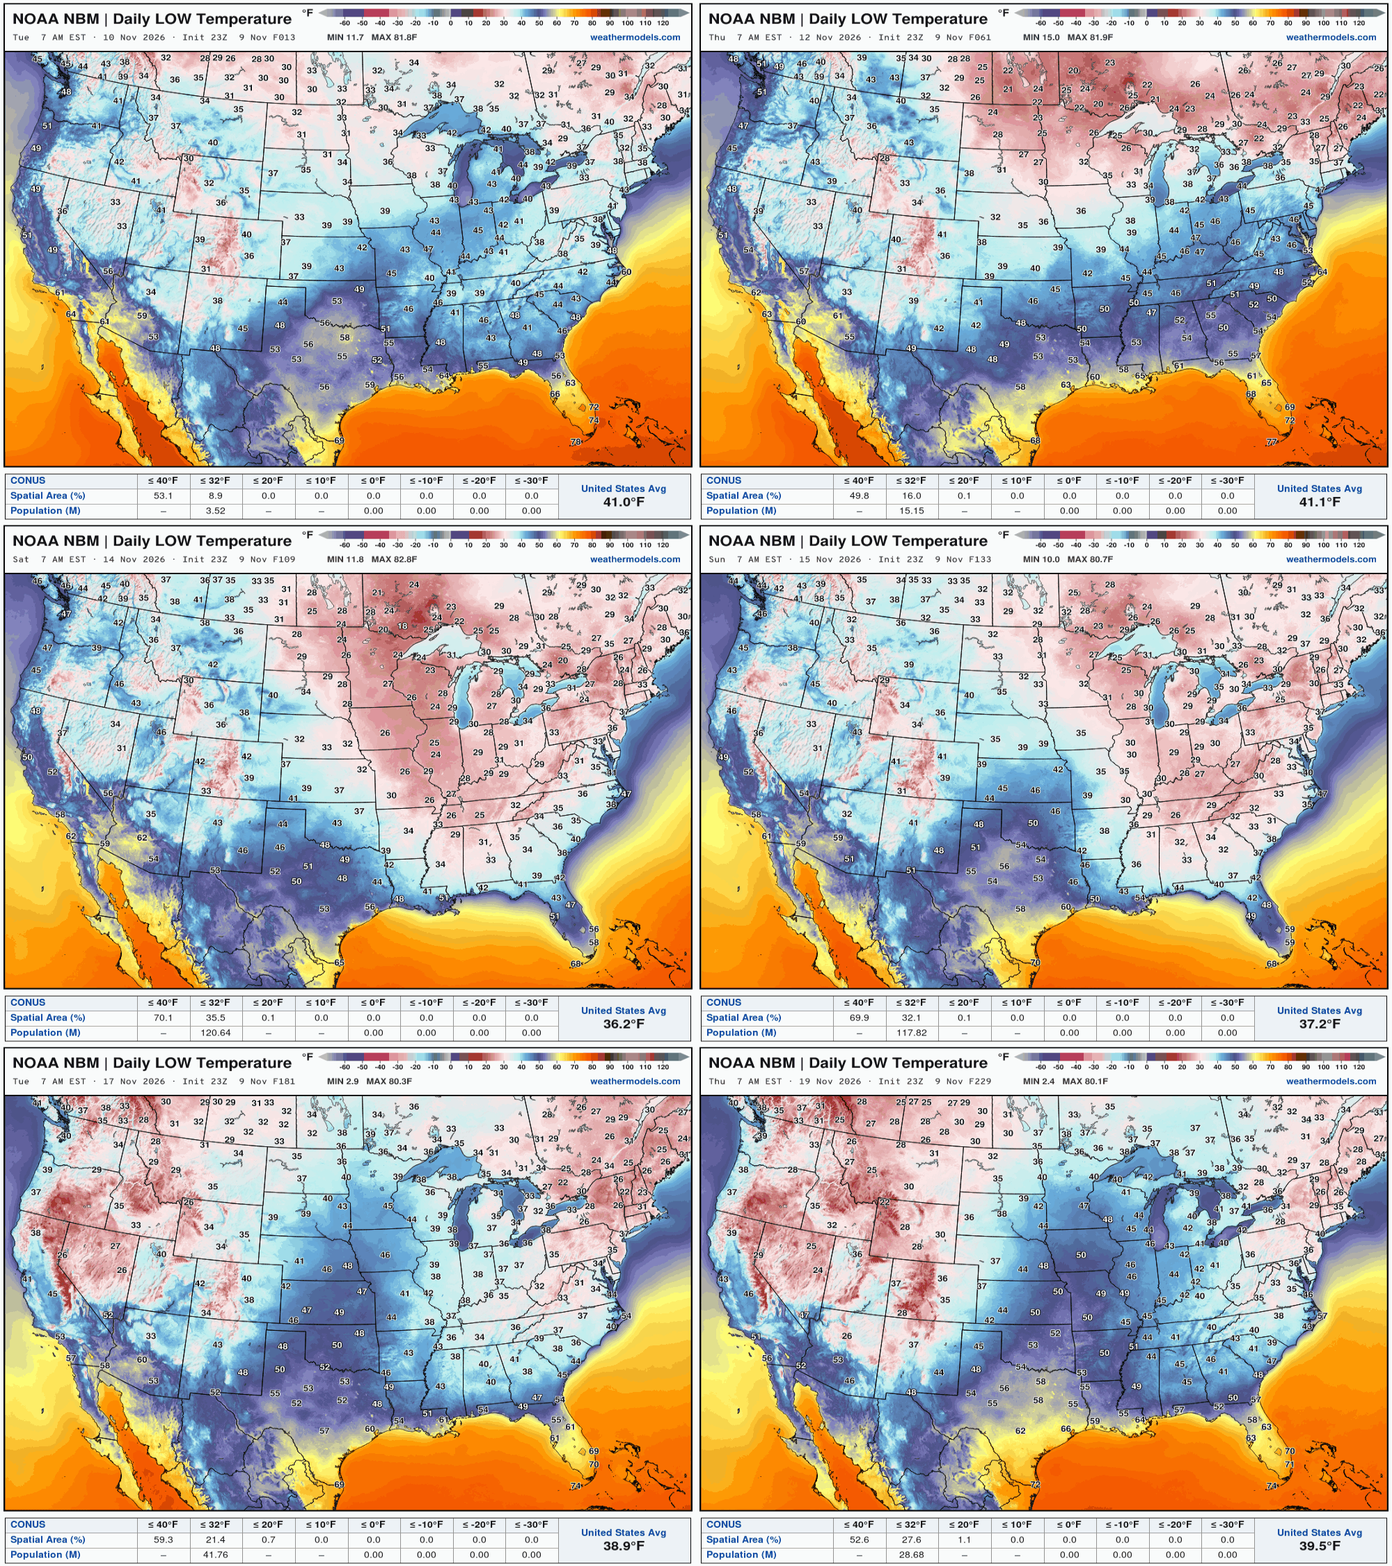
Low Temperatures next 9-Days through November 19th
My favorite parameter — precipitable water | ECMWF 18Z next 6-days
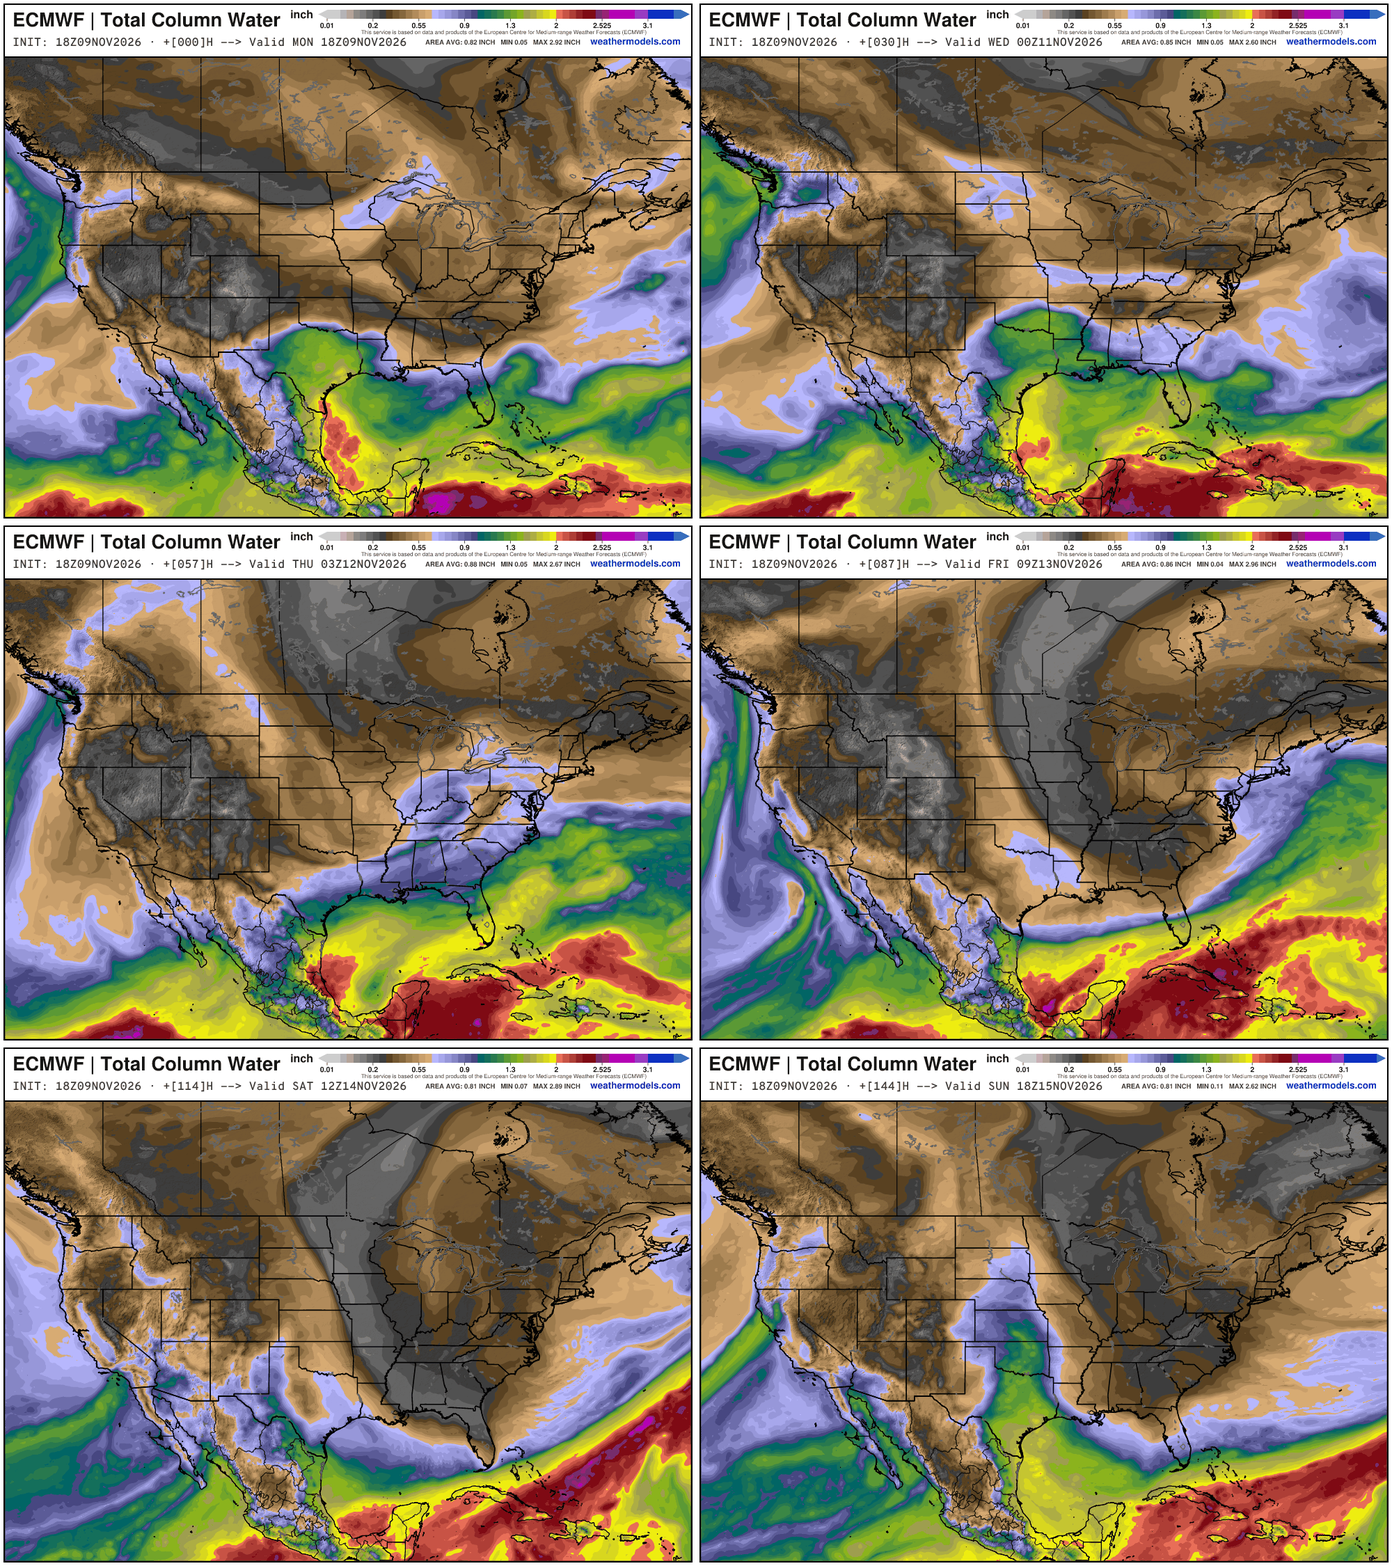
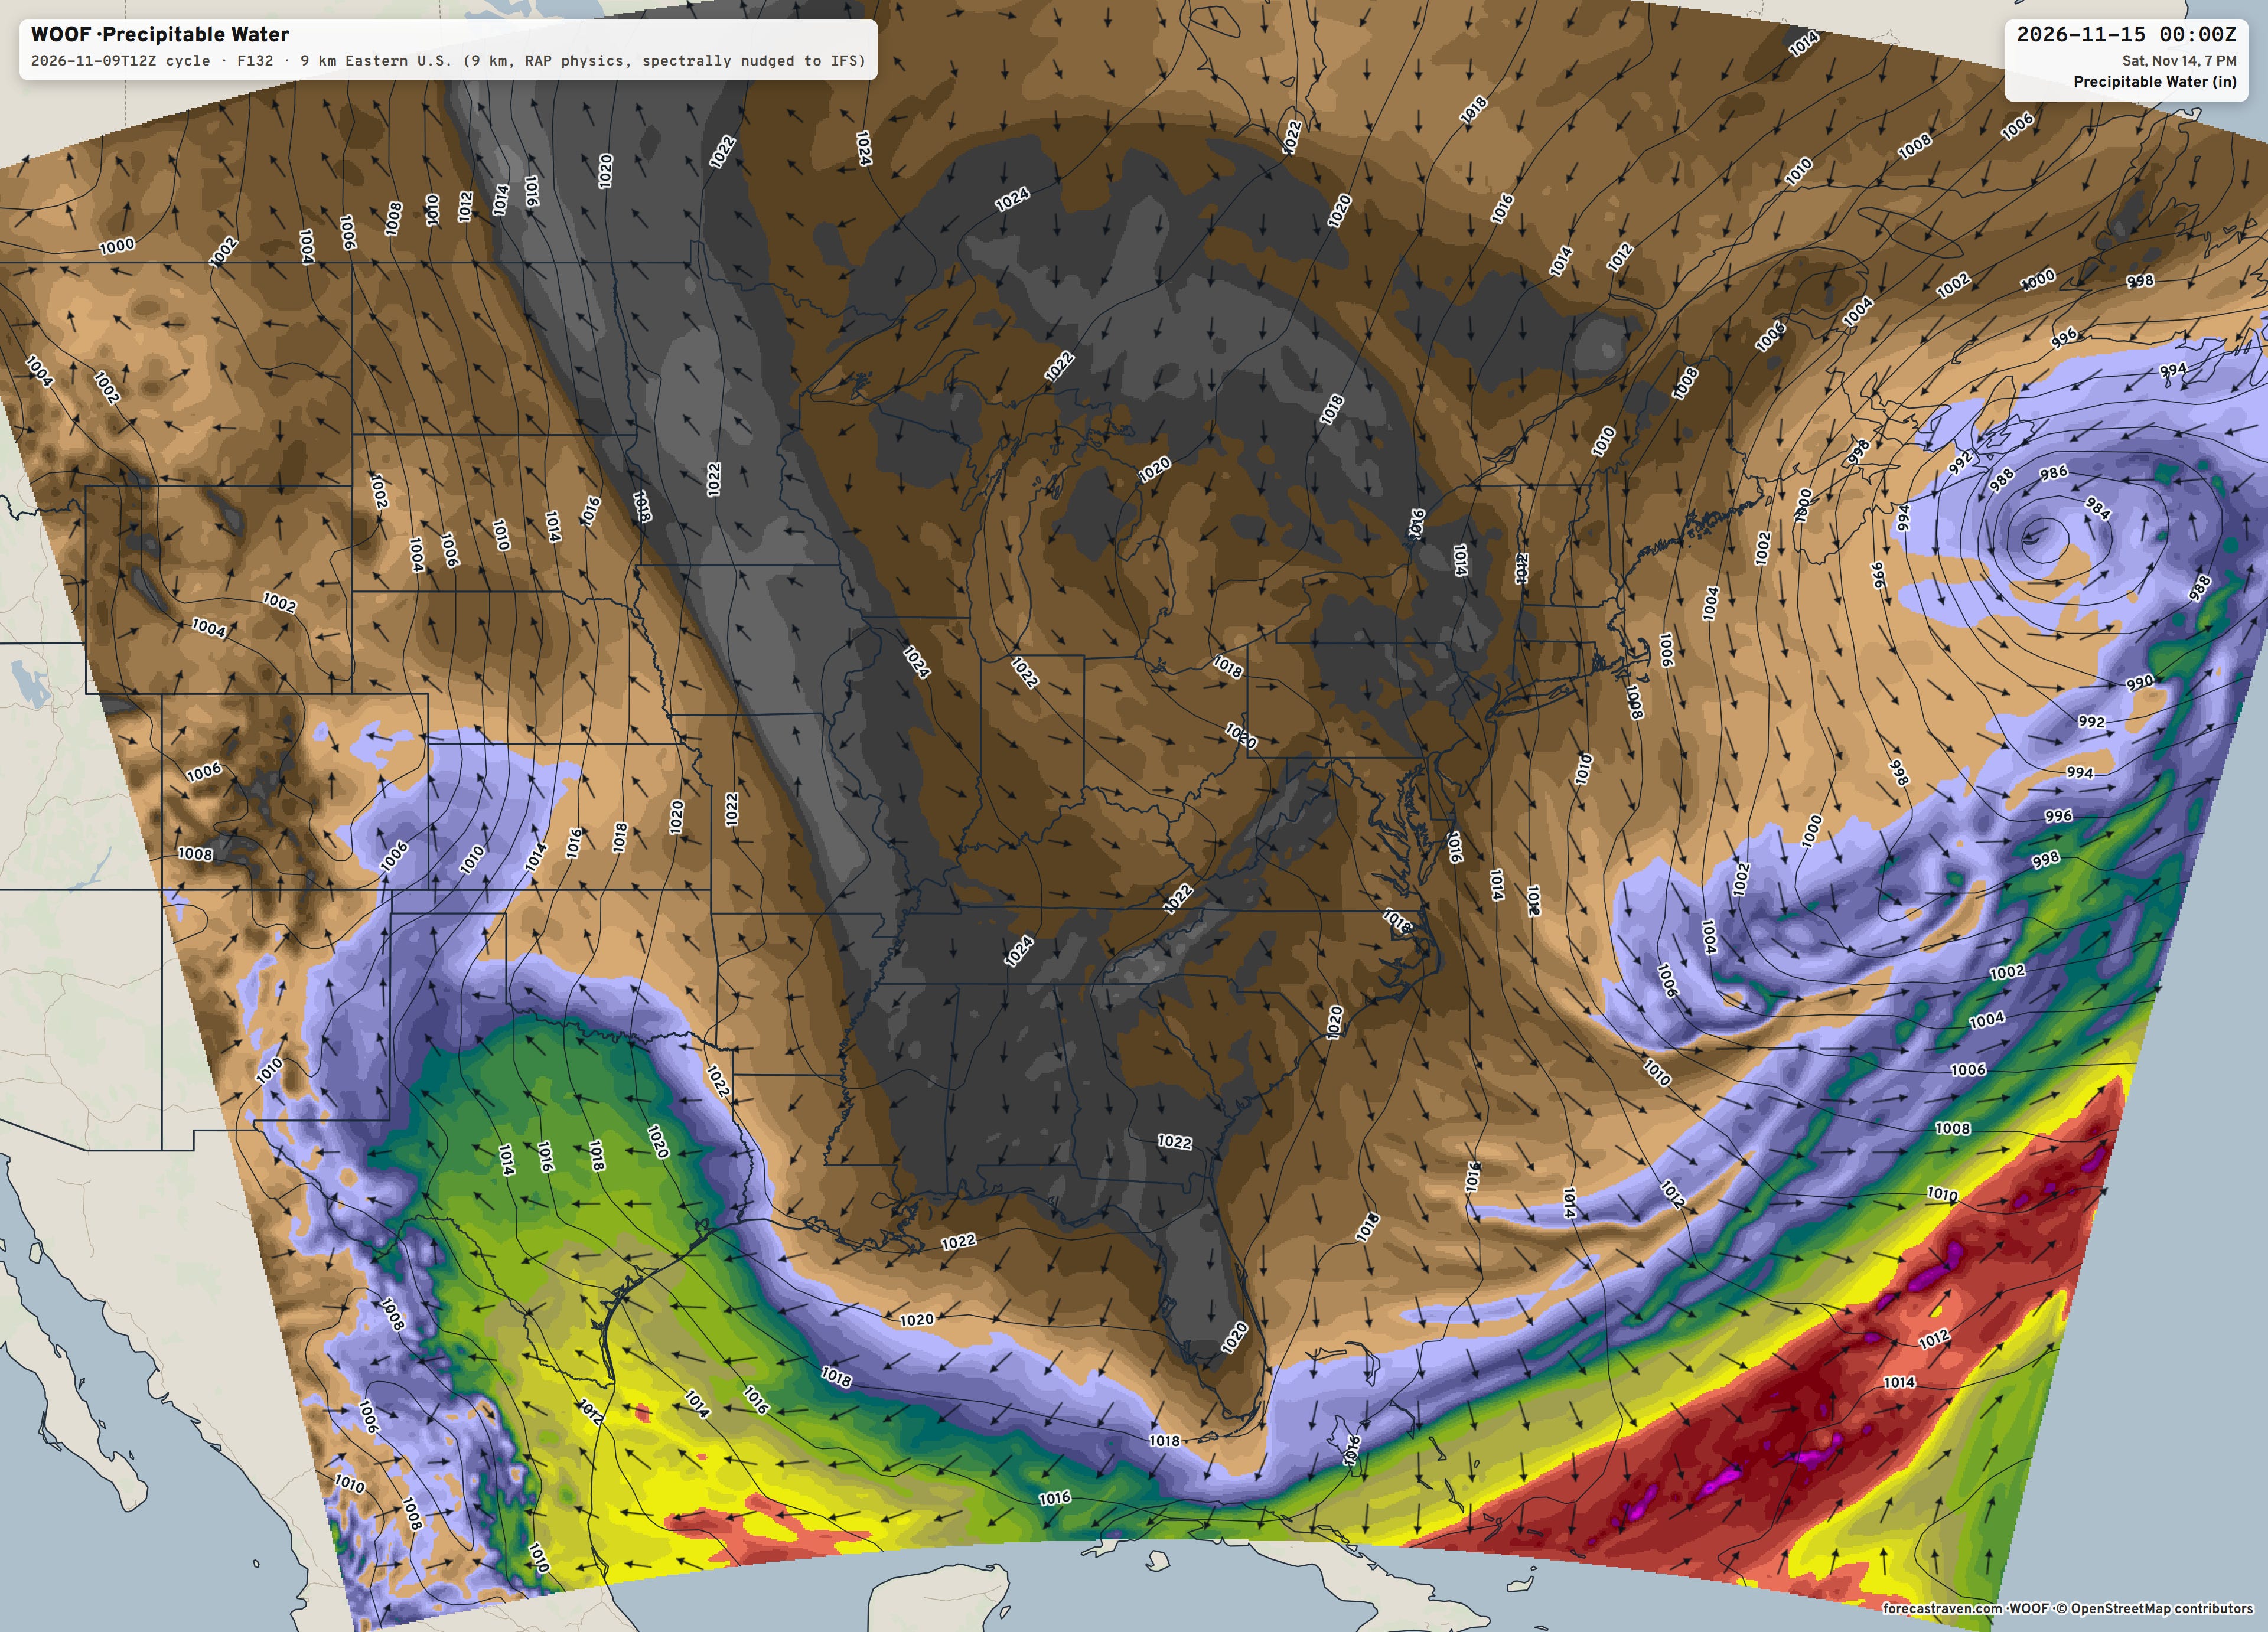
Major trough — with very dry Canadian Arctic air drains out of Canada into the Southeast and even into Florida.
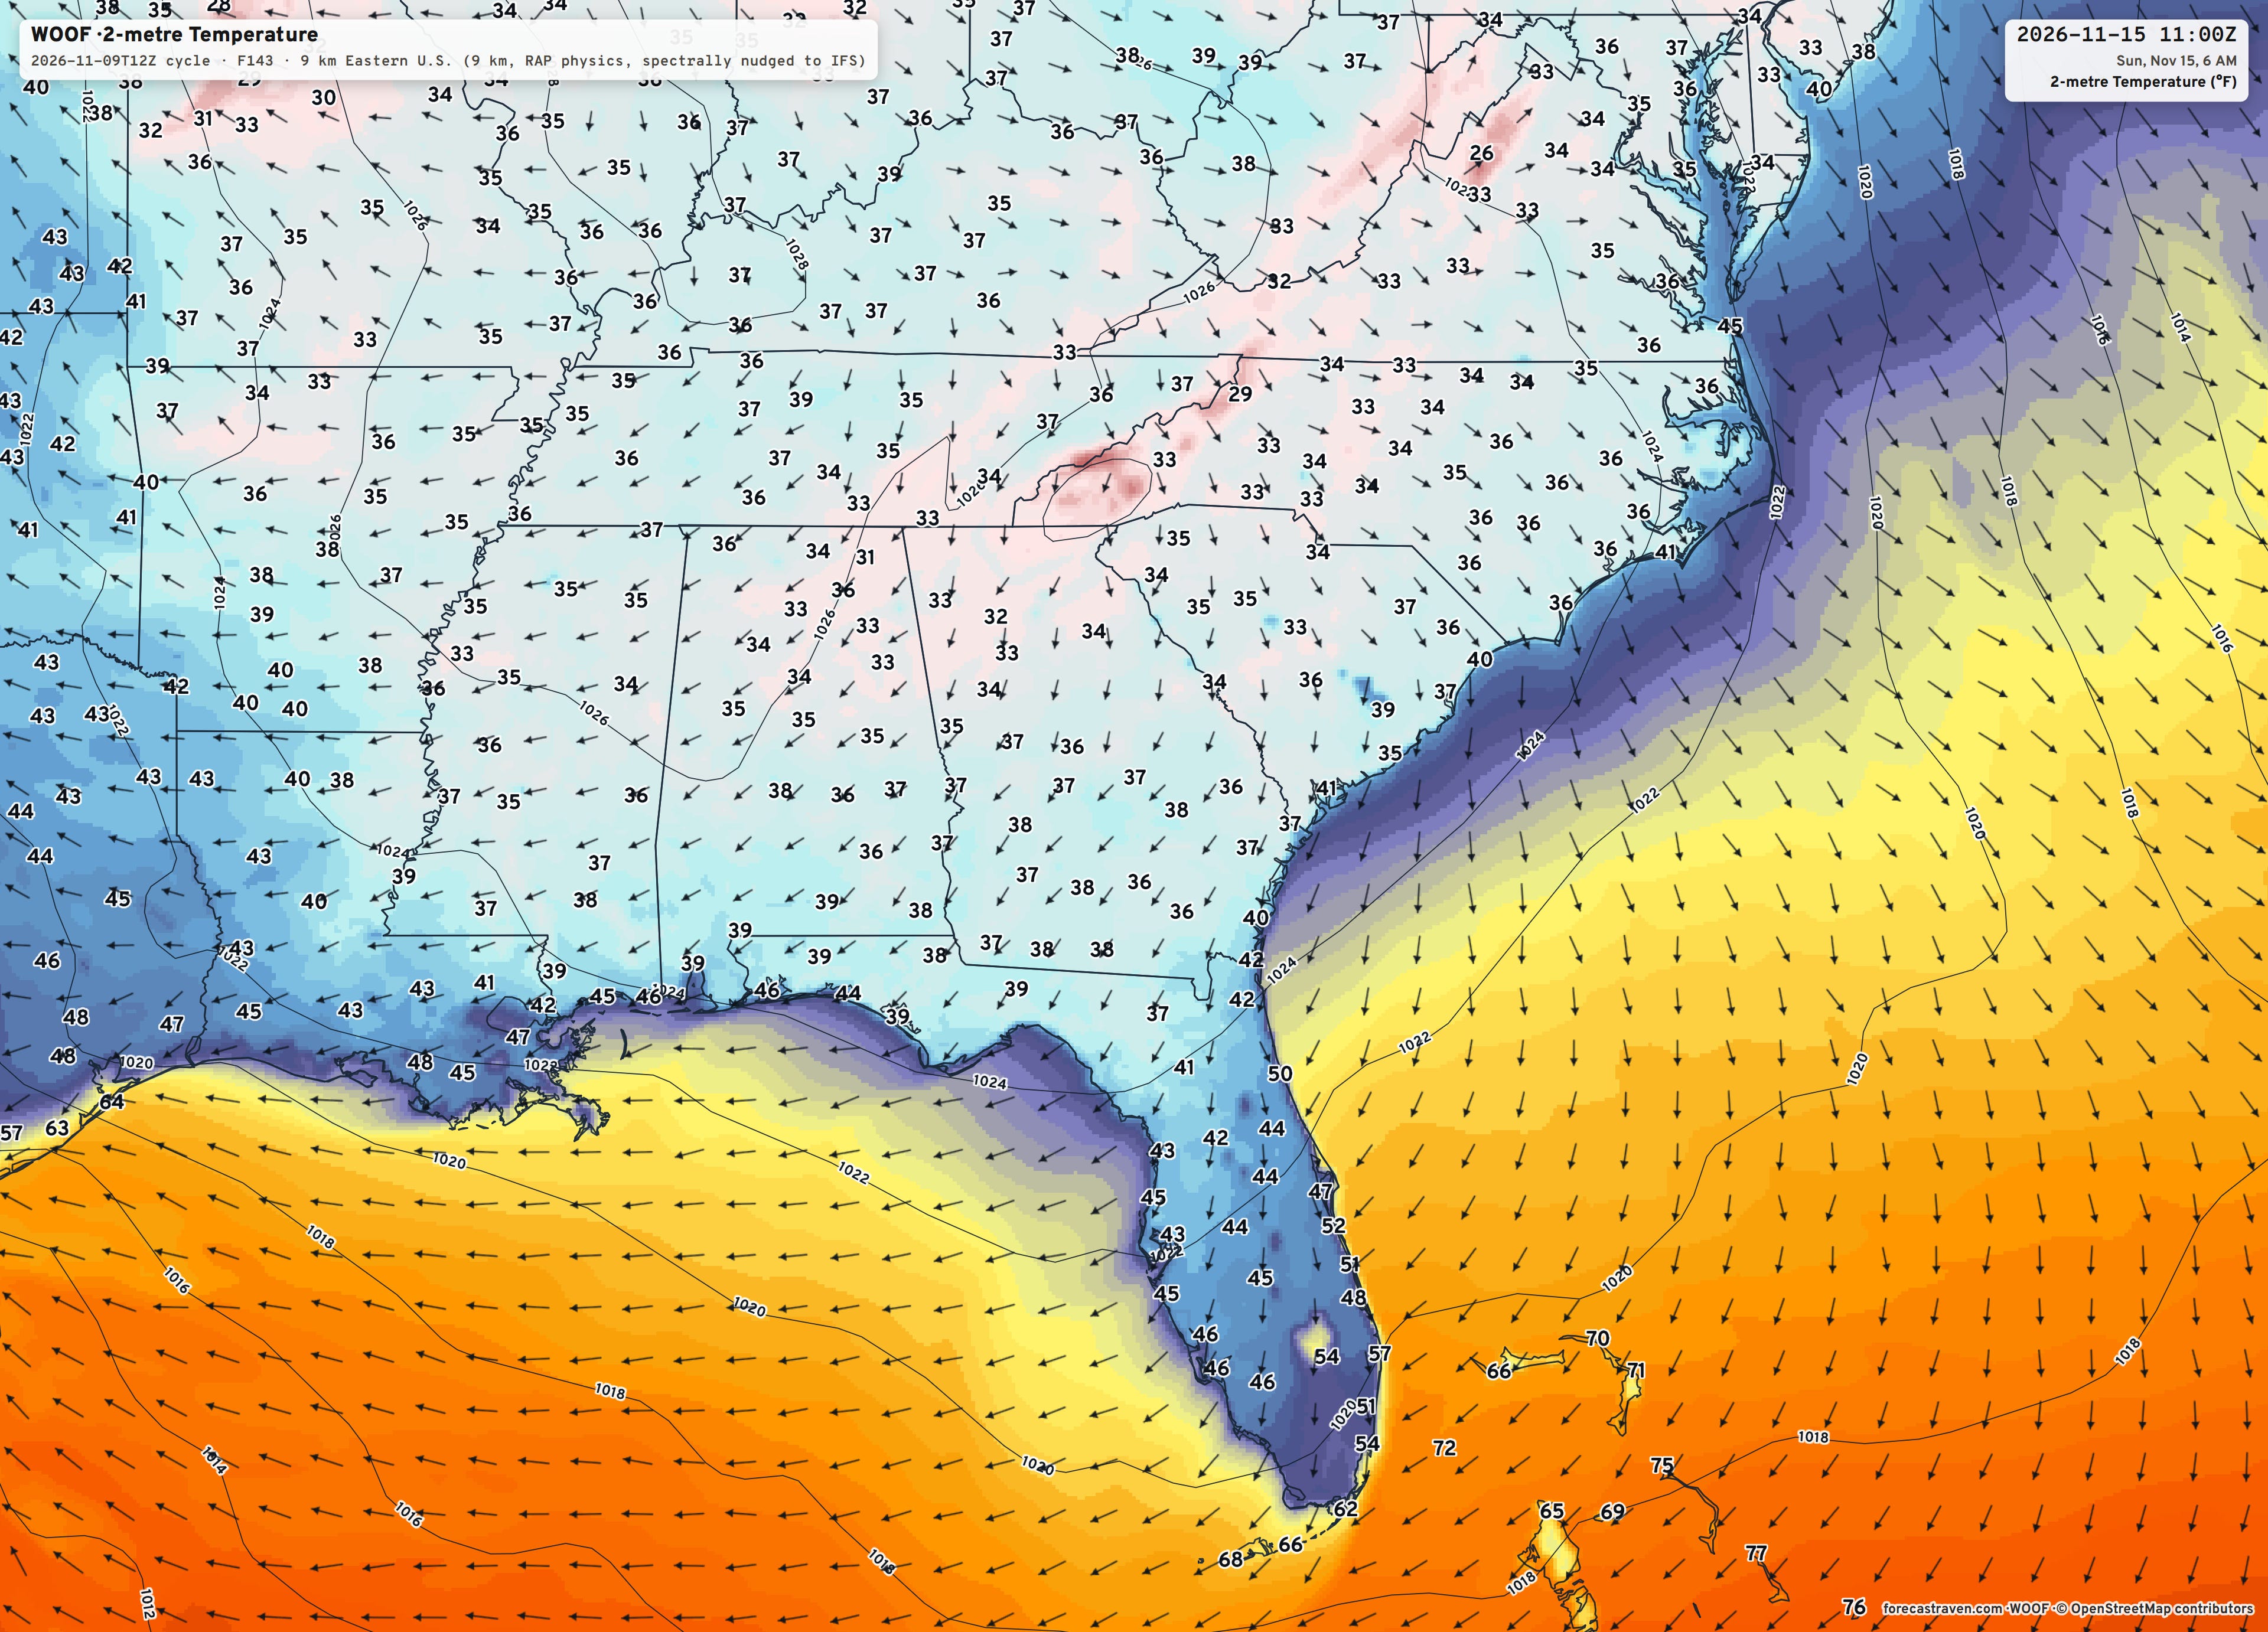
And, my “Forecast Raven” WRF picked up on it, too. Incredible tool.
Into Sunday morning — chilly!
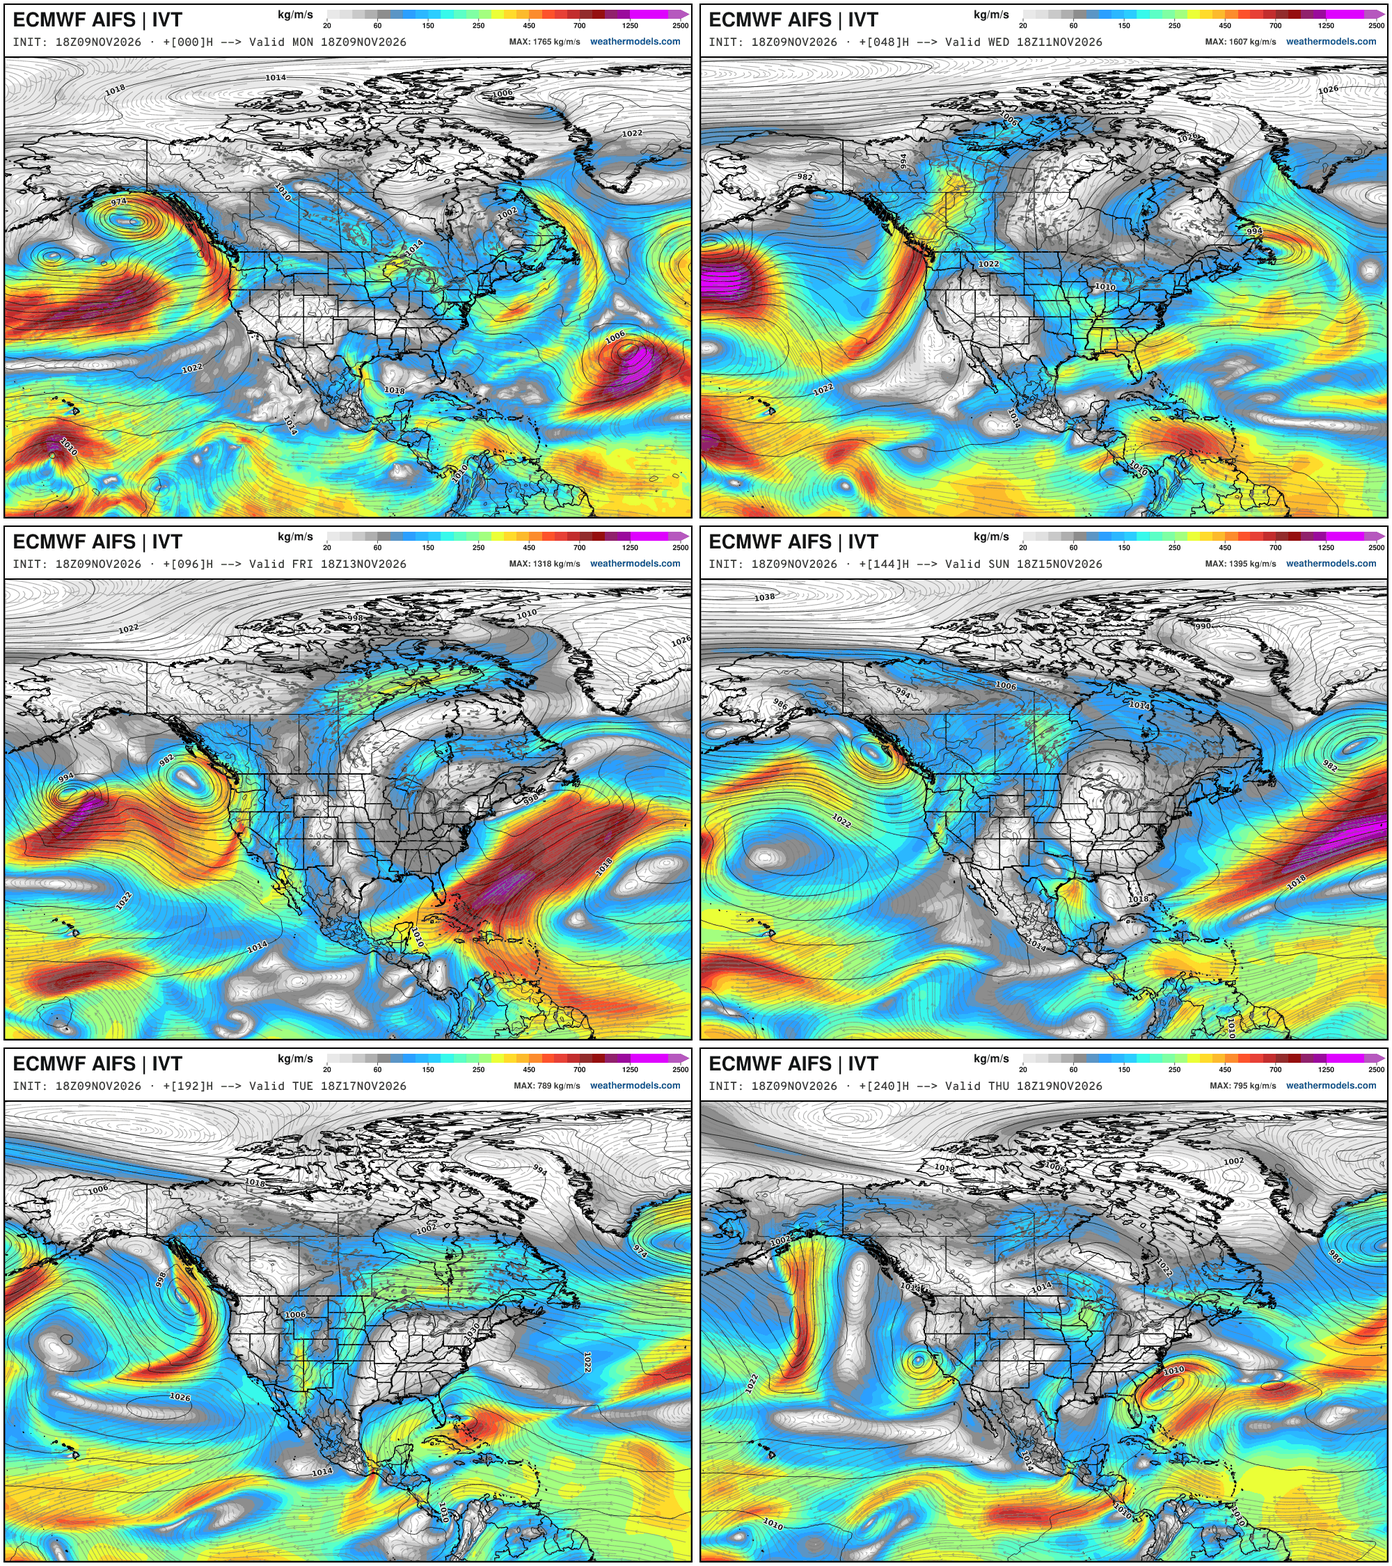
Integrated Vapor Transport Next 10-days | ECMWF AIFS 18z
Height Anomaly Pattern | Next 10-days | AIFS 18z | Flagship model
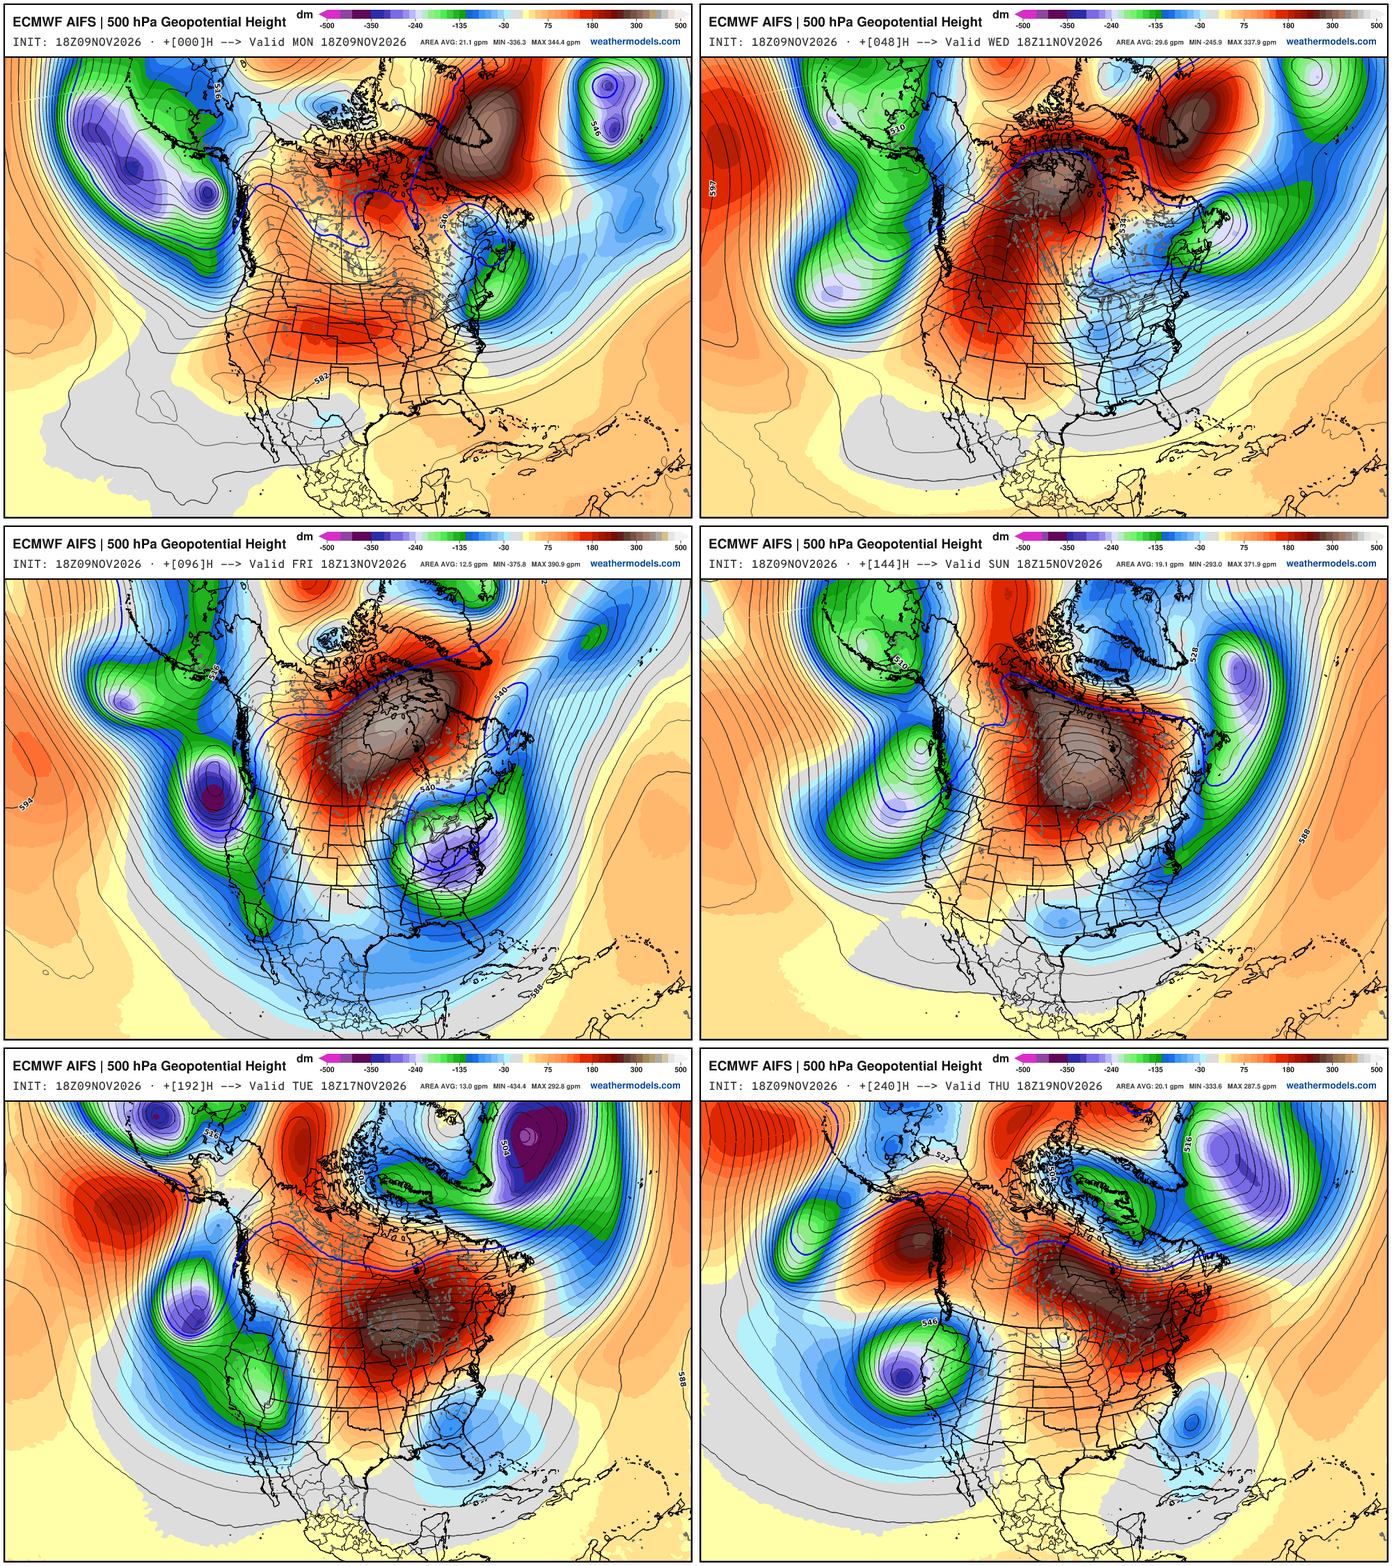
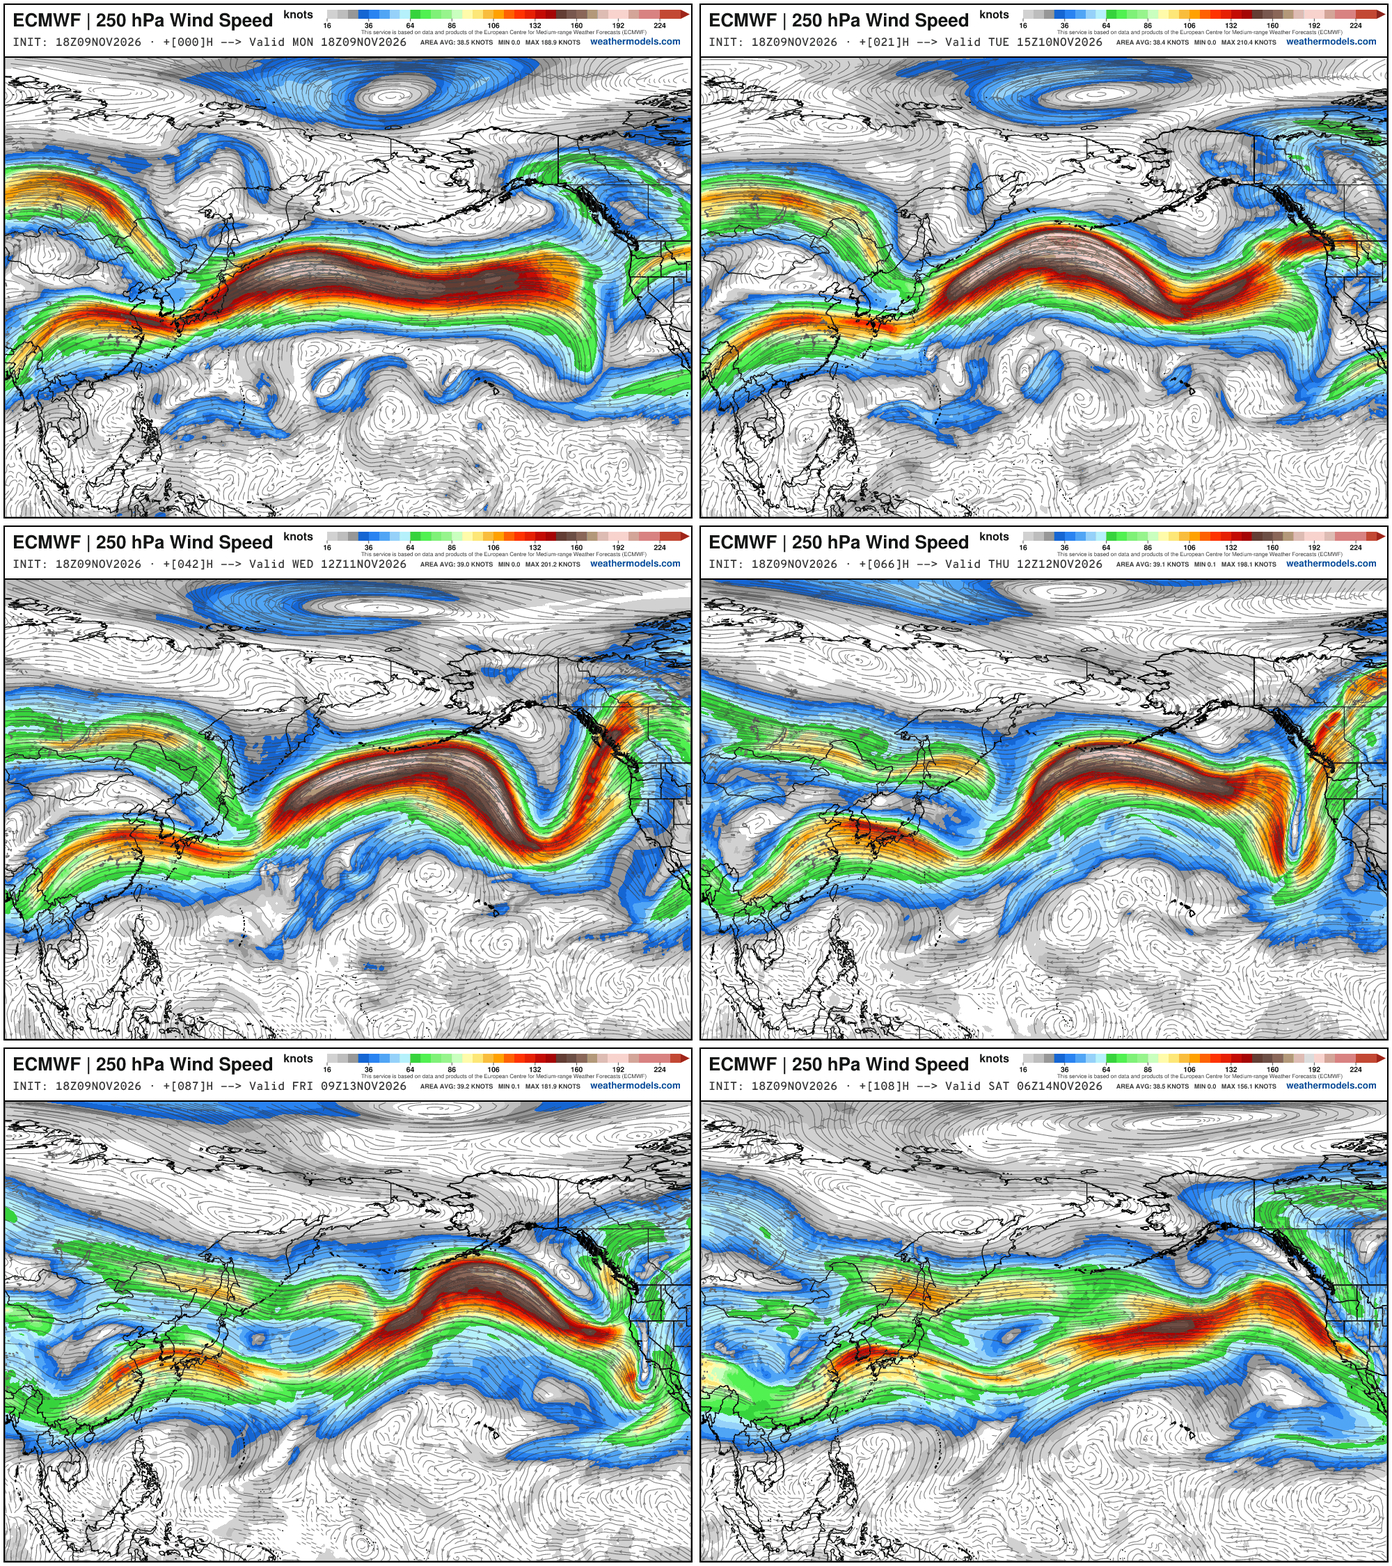
Omega block cannot be broken down … troughs on both sides / Pacific West Coast and Atlantic East Coast are powerful — and we can thank goodness that it is only mid-November + El Niño because this pattern would redirect very cold air from Greenland to the Eastern US. Instead, the Western U.S. is bombarded … multiple powerful troughs with “bomb cyclones” — this is a wild upper-level pattern fueled by a strong Pacific jet stream well over 200-knots.
500 hPa Temperature is the best way to show the “polar vortex” intrusions associated with the cut-off troughs on either side of Omega block.
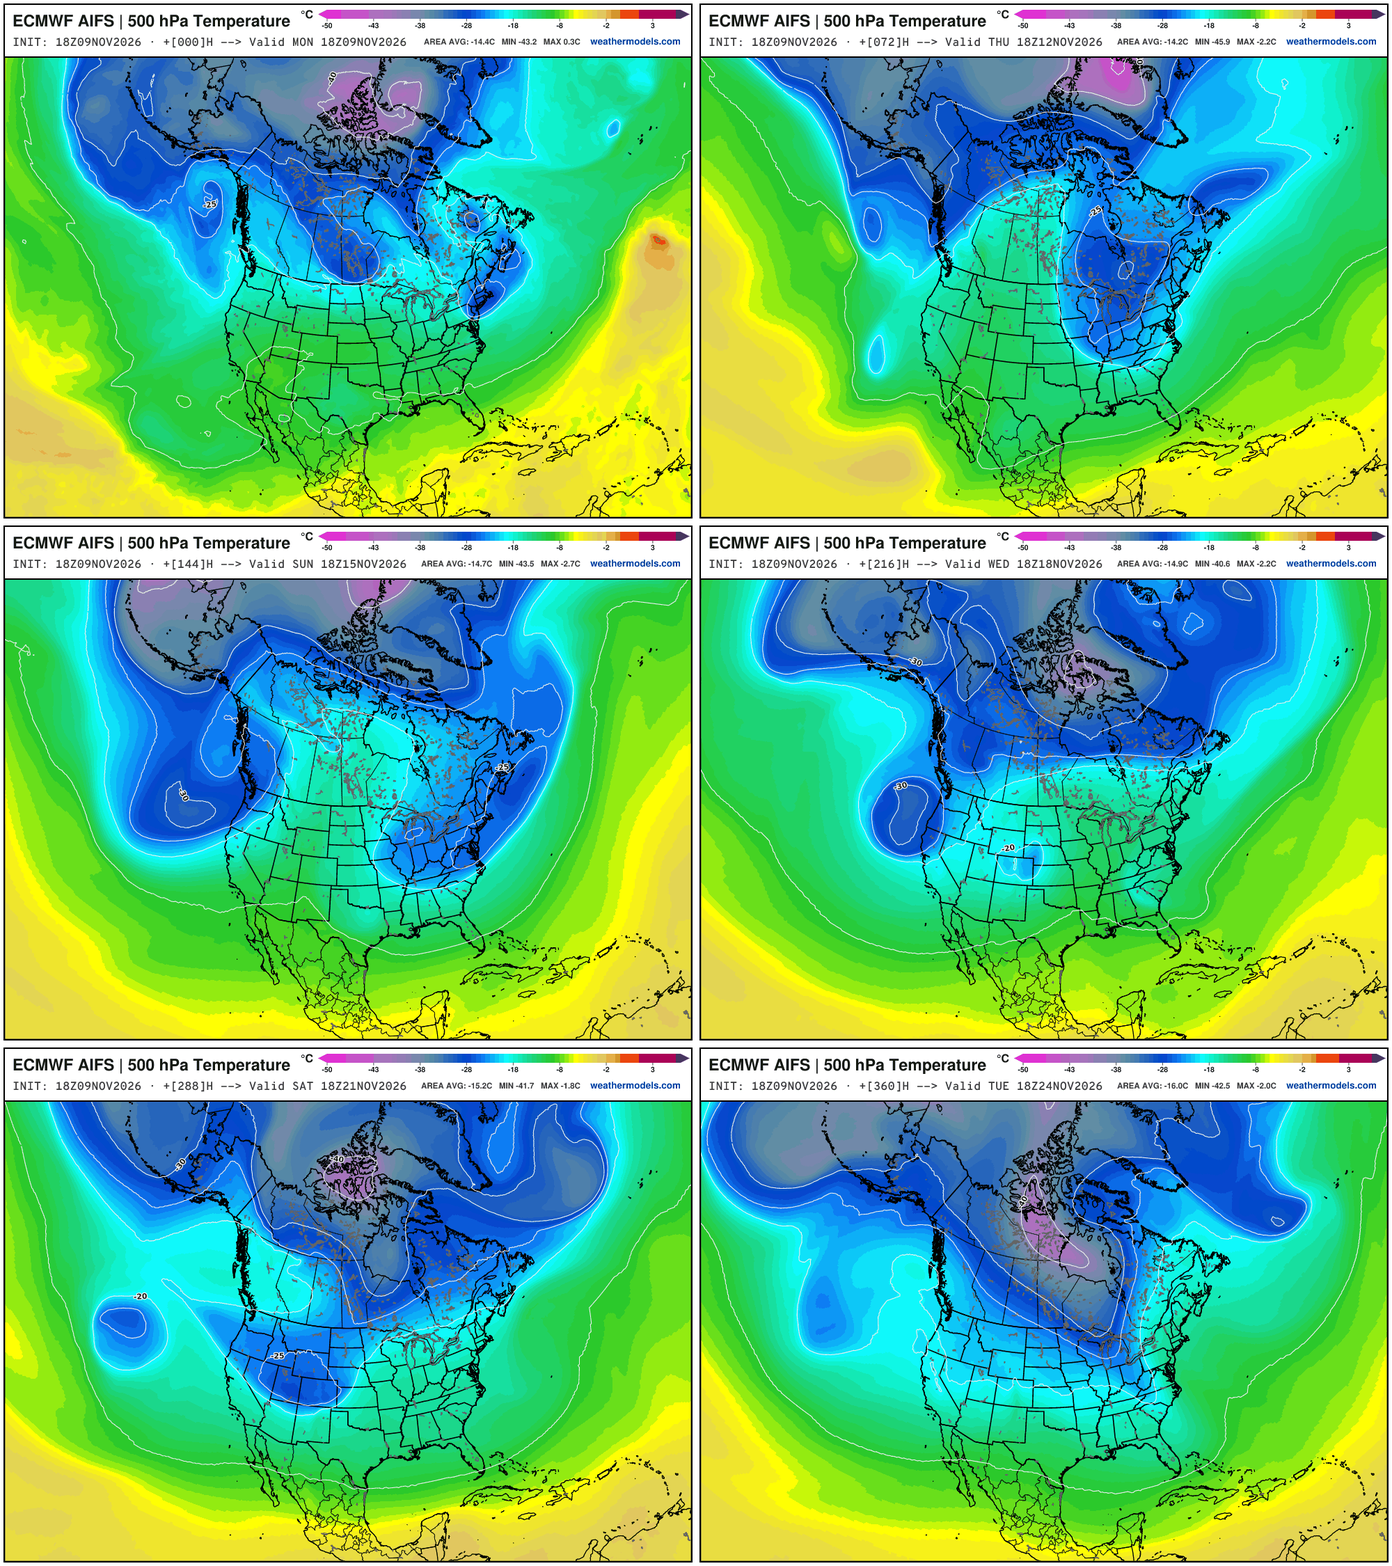
I’m extending this animation out to the entire 15-days to show the development of a “Polar Vortex” centroid over Greenland and then Arctic Canada — with the potential to break loose and “drop the hammer” on the Eastern U.S. into Thanksgiving.
This pattern really has a “look” to it for a major Arctic outbreak — yet still 2-weeks away. While we may not have “cold pool” formation near the surface, the mid-level at 500 mb is plenty cold into late November.
Cold Pool Formation at 850 mb — not impressive — but trying to form over Greenland and Arctic Canada battling the Pacific influenced air
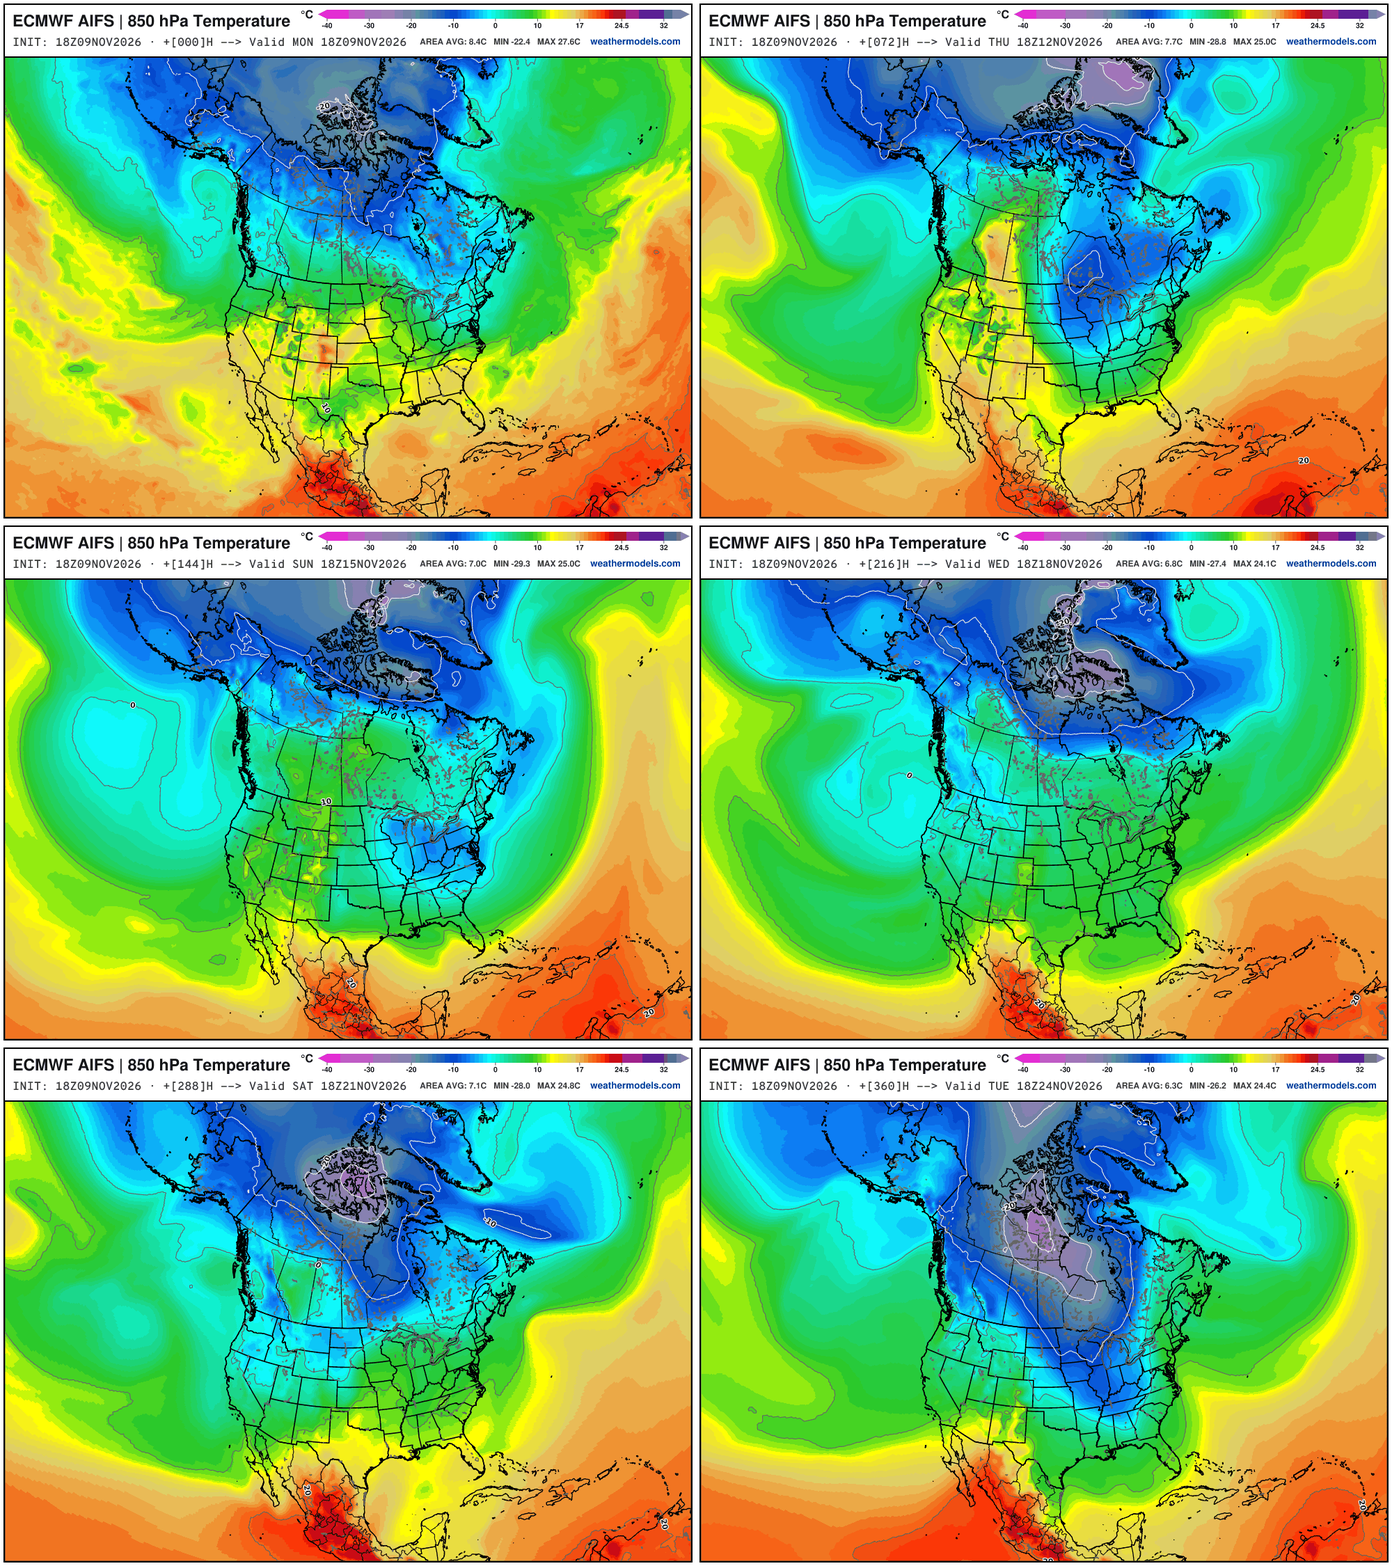
Again, I pushed this out to 15-days to illustrate where the cold air comes from in an El Niño winter — and that yes, indeed, there is some/plenty up there — and it only needs the appropriate trigger to “dump out”
European Weather Patterns
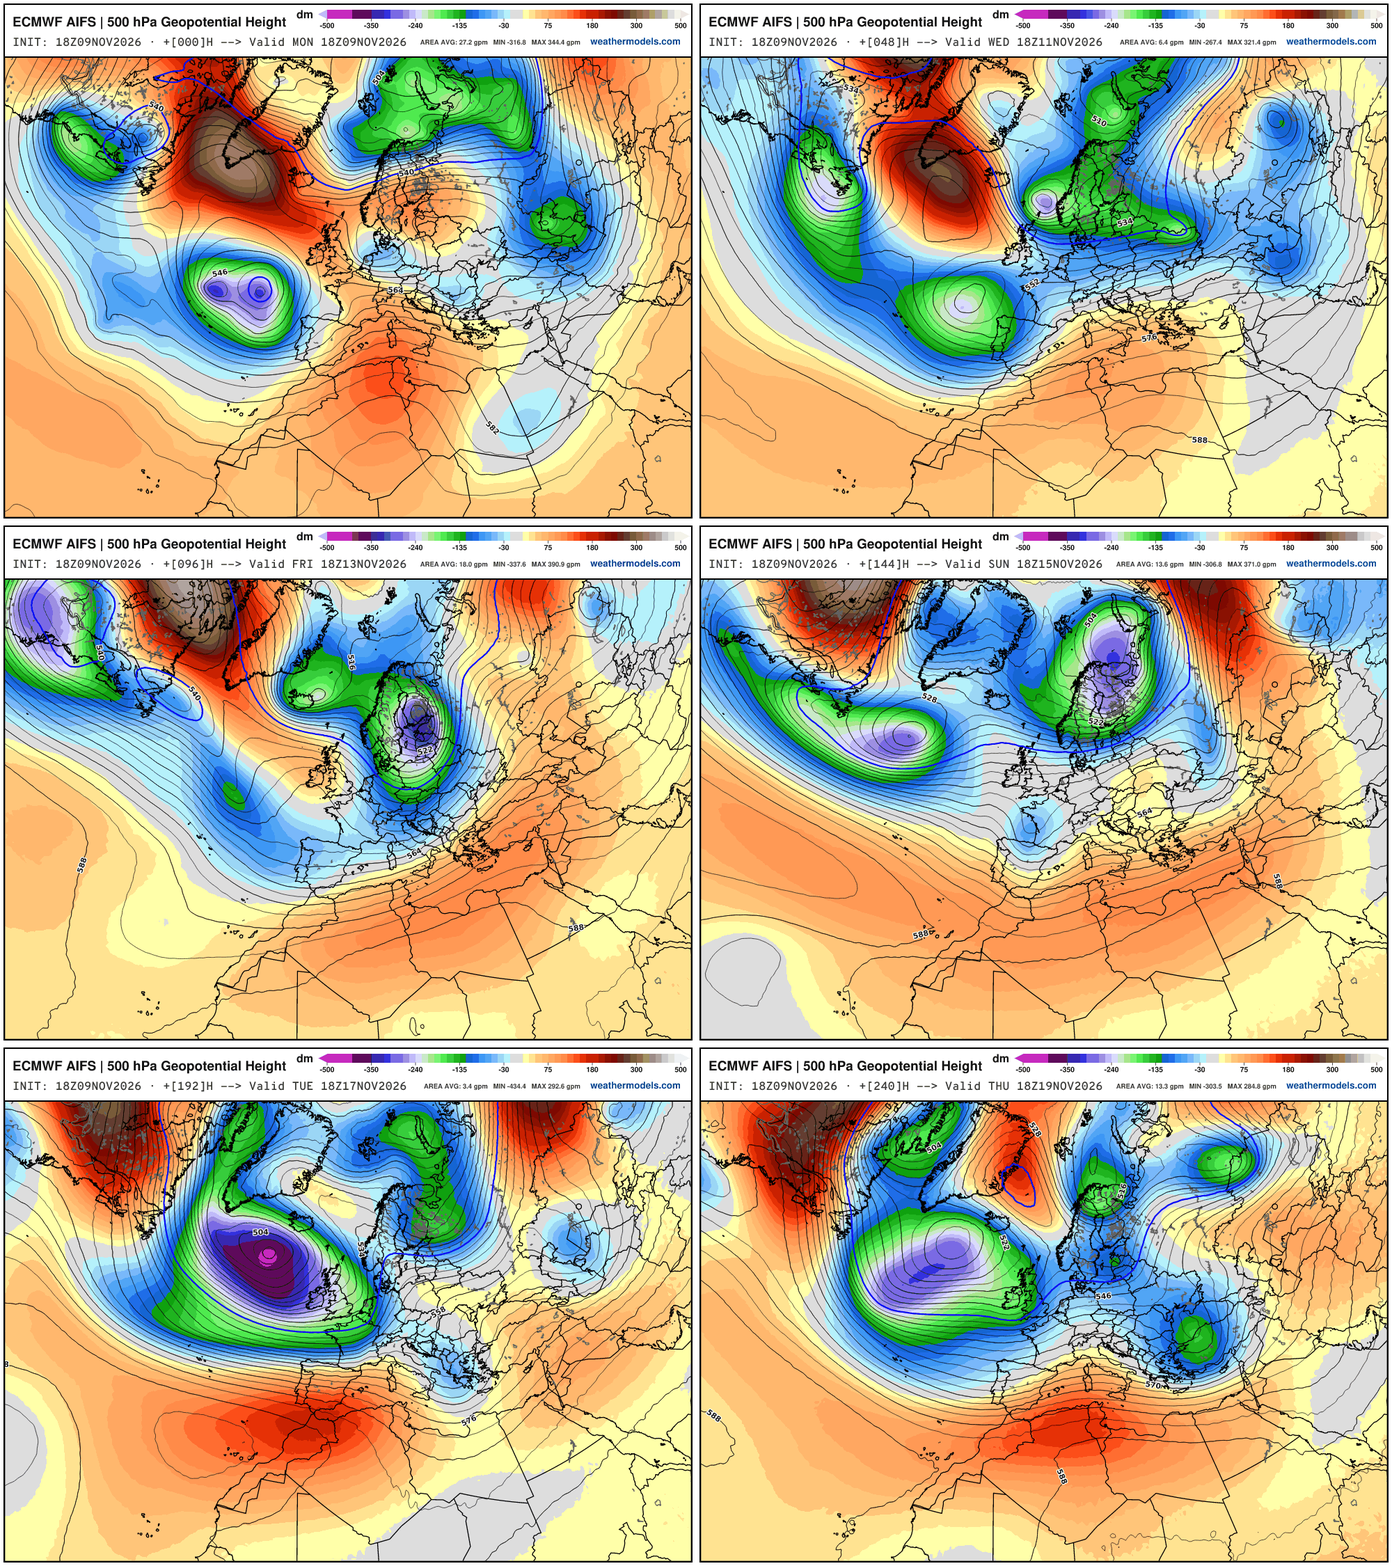
Europe —> powerful troughs downstream of the Canadian block — but they are of Atlantic origin so warmer, marine air — and only brief Arctic blasts can sneak in from Iceland through Scandinavia.
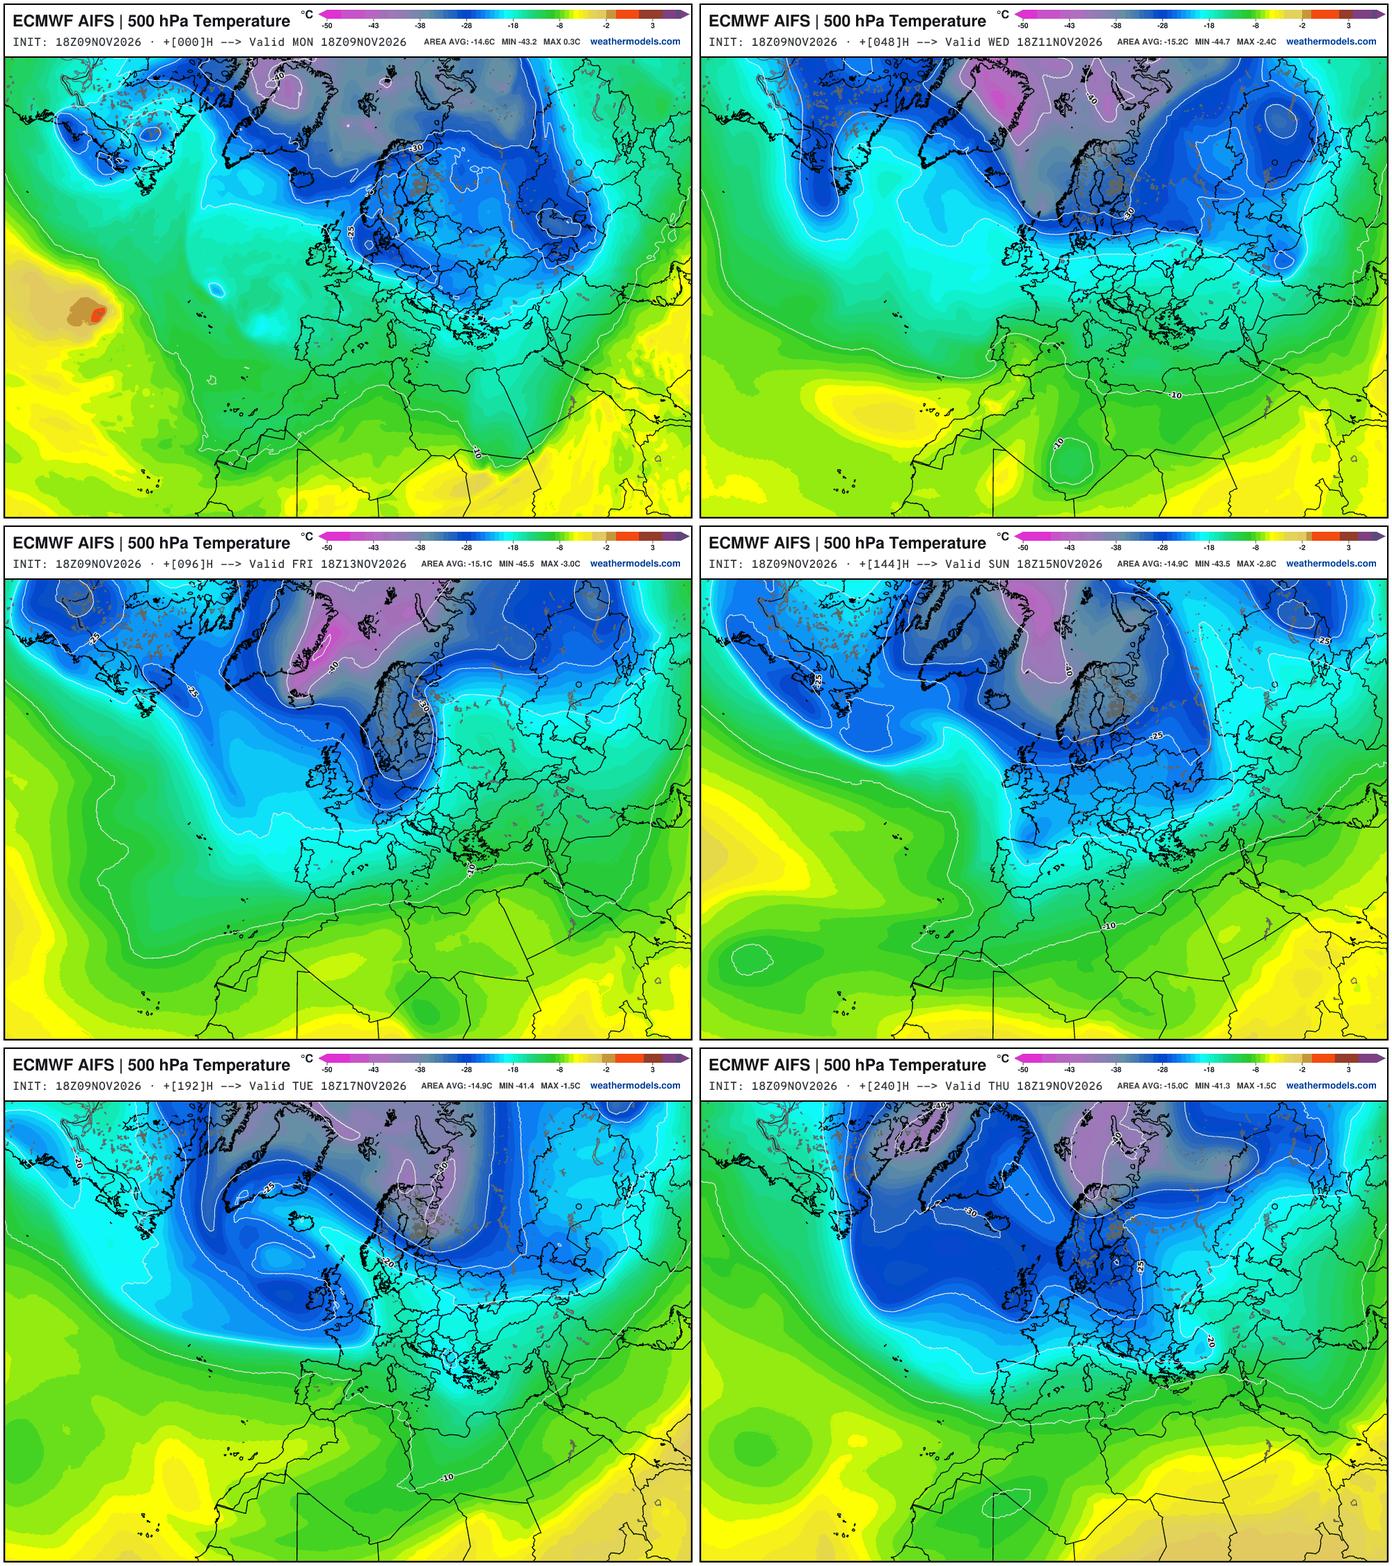
Huge cold dip across Eastern Europe with a lobe of the tropospheric polar vortex and then a general movement of that Greenland created cold toward Scandinavia.
NWS NDFD Next 3-days precipitation
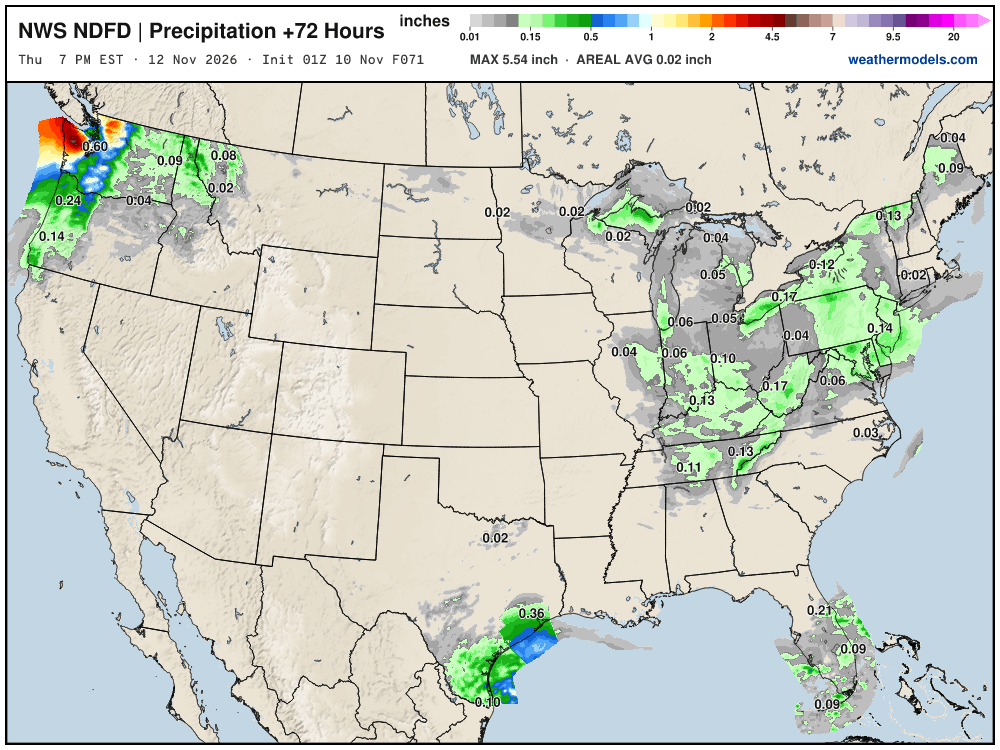
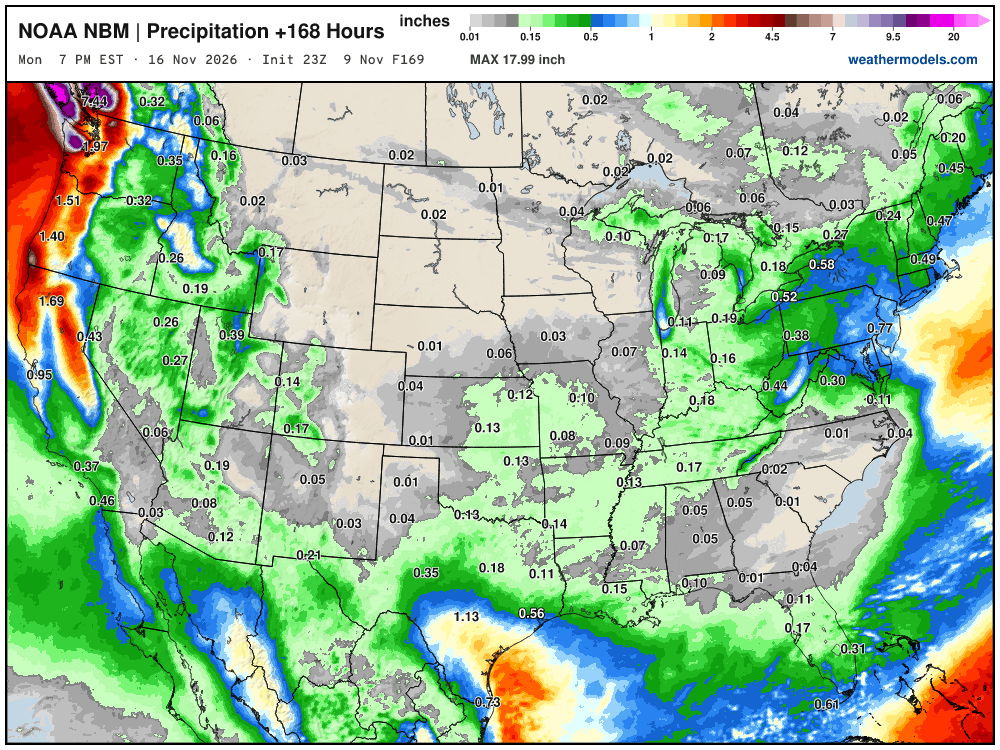
Blend of Models Precipitation Next 7-days
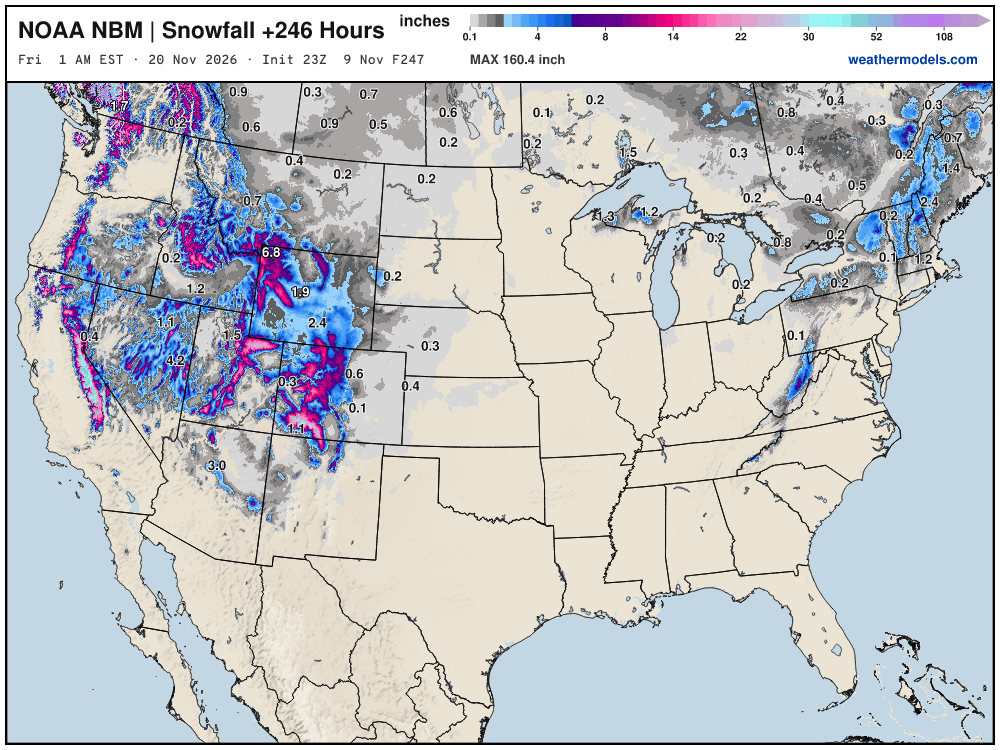
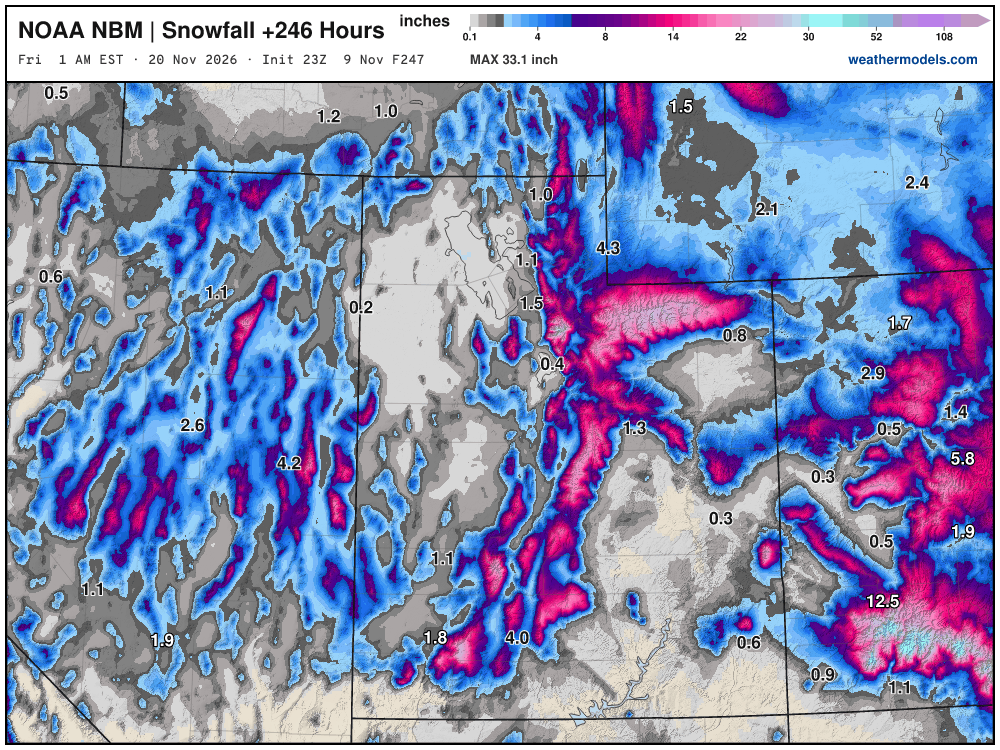
Blend of Models Snowfall Next 10-days | Western U.S. bonanza!
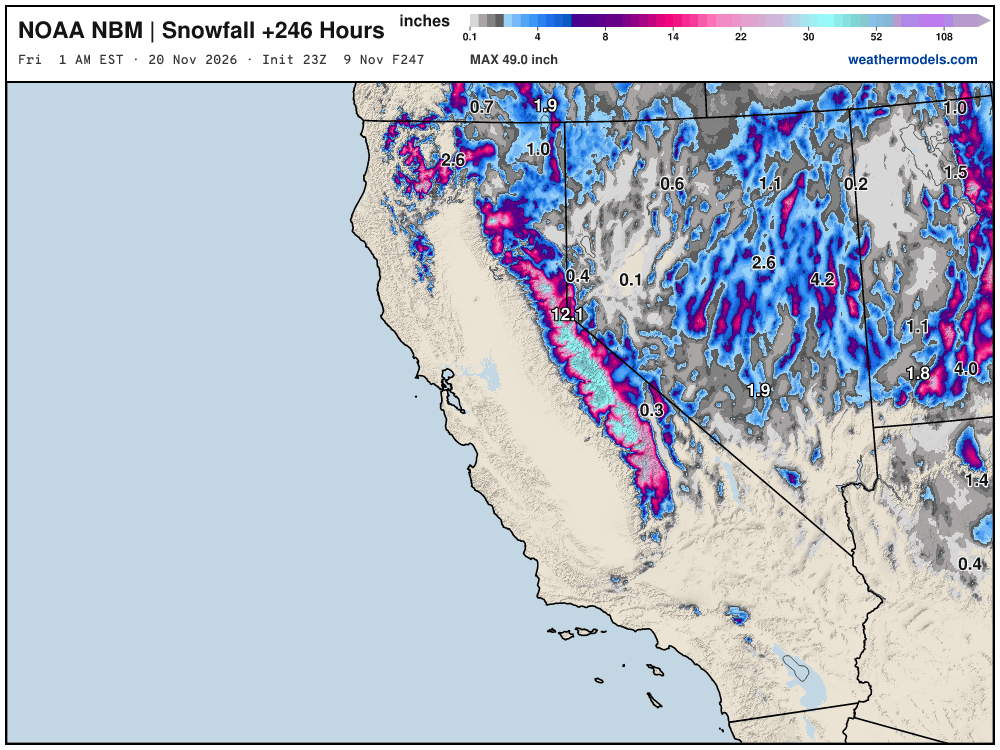
Sierra Nevada up to 49” … very welcome!
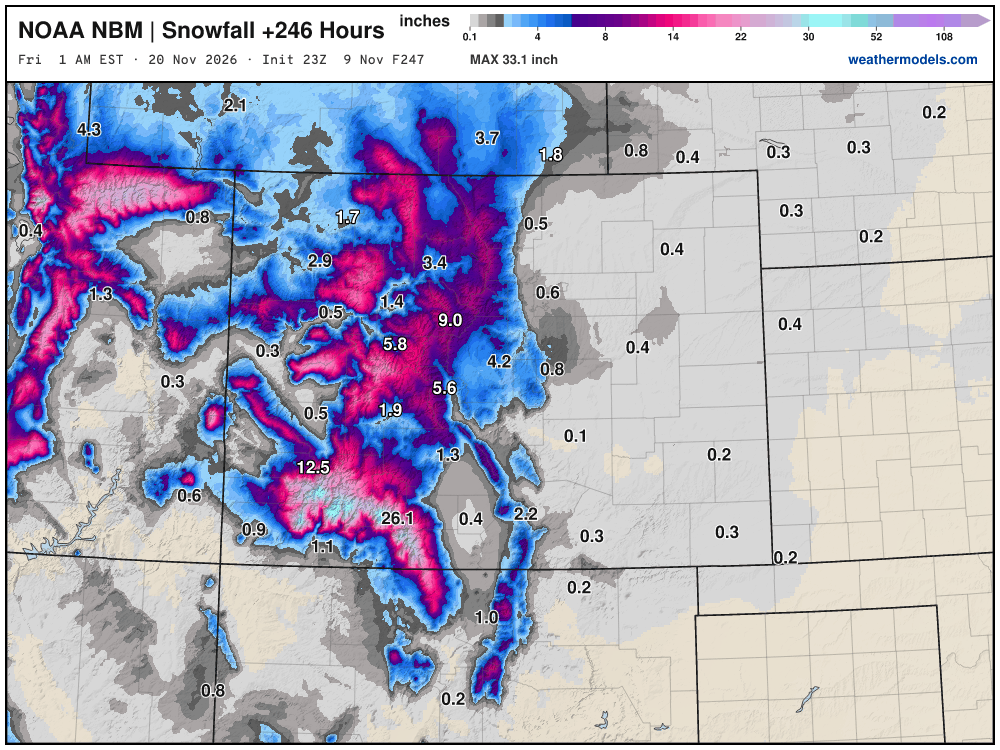
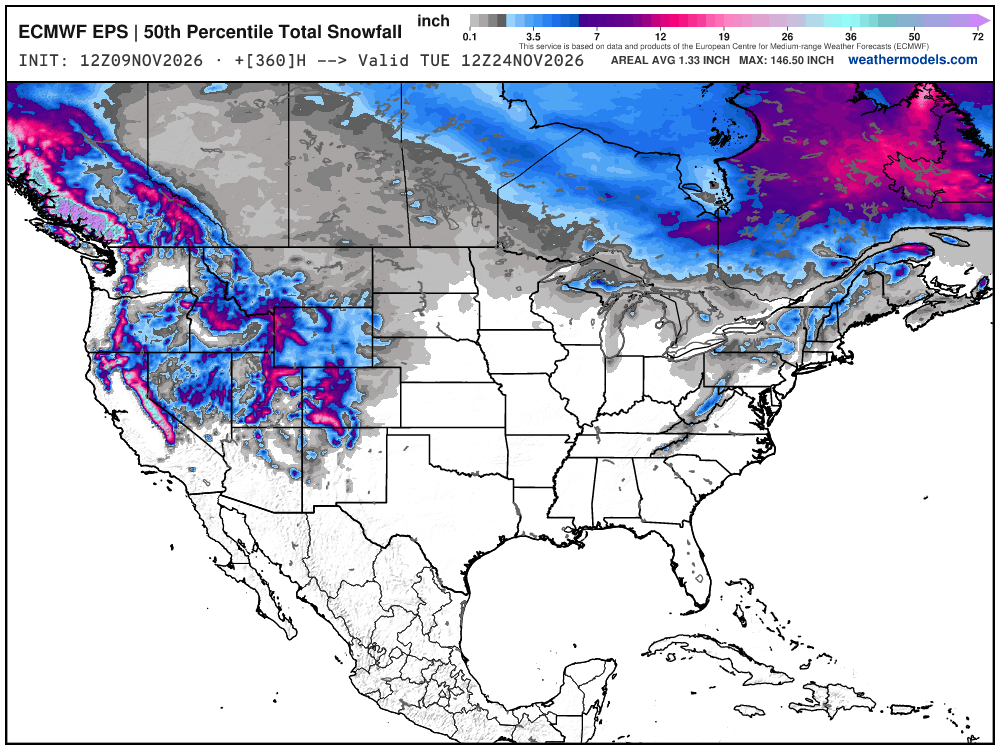
Beautiful snow maps!
Snowfall Next 15-days | ECMWF Ensemble 12z Median
Probability of 1-inch or more of snowfall through November 22th
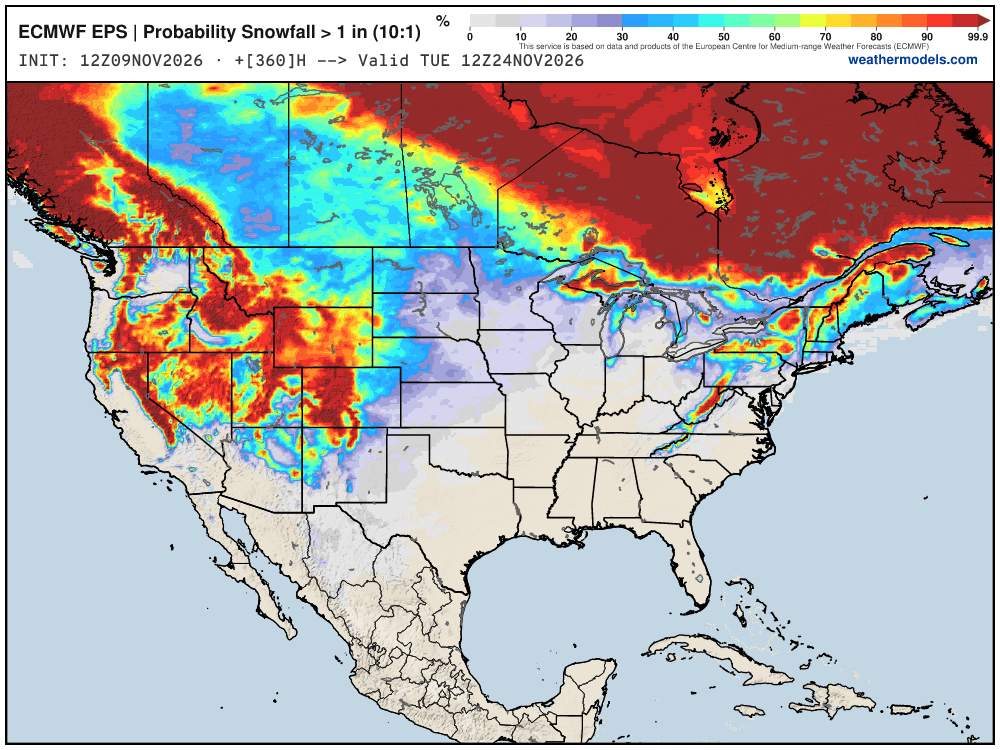
(I need to get the little numbers back on the maps)
Week 1 Chunk of Temperature Anomaly | Nov 9 - Nov 16
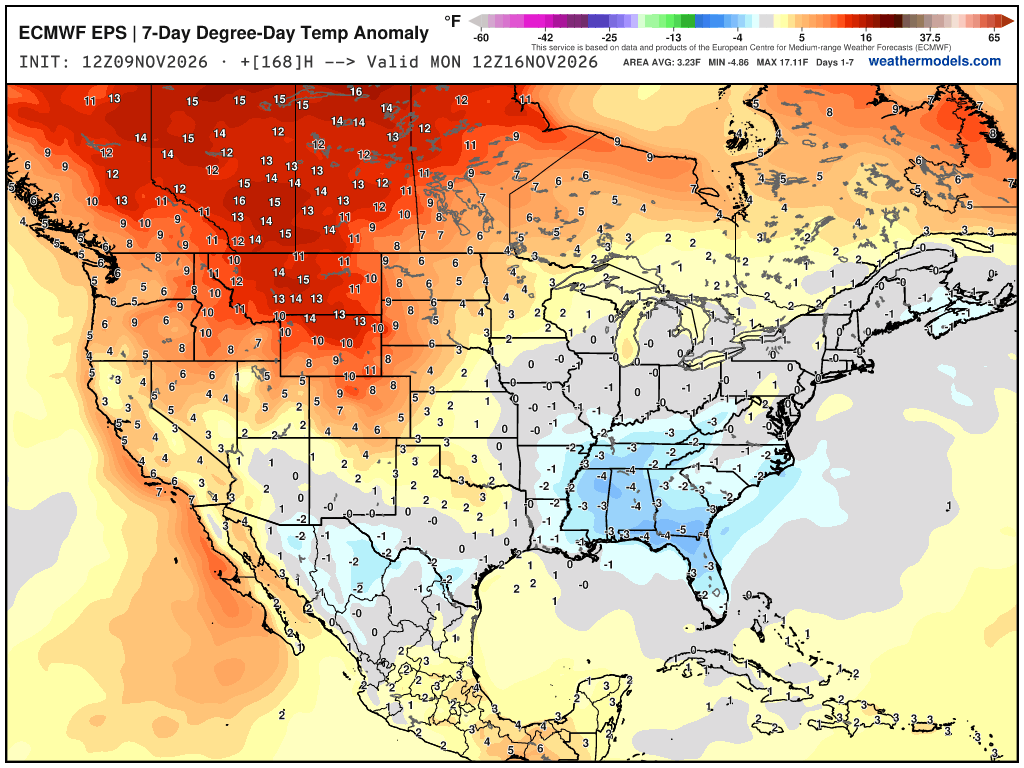
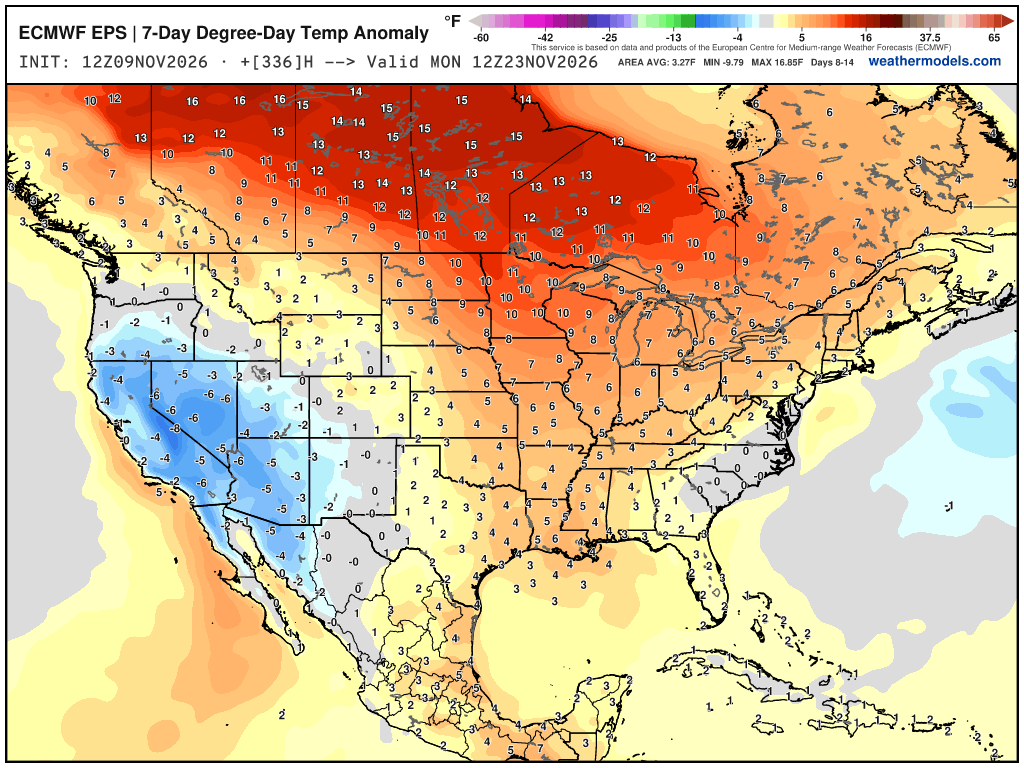
Week 2 Chunk of Temperature Anomaly | Nov 17 - Nov 23
Thank you for visiting / reading — always more to come!
Visit Global Tropical Cyclones w/Dr. Pielke Jr. for more ACE information, as well as my original climatlas.com/tropical site with much new research including a calibrated “Best Track” and historical tropical cyclone browser with plenty of interesting features like rankings of storms by their IKE (size).
ACE up to 953
Satellite imagery from Squall Cloud. Maps sourced from weathermodels.com designed and innovated entirely by Ryan. Please subscribe there for real-time access to the newest maps, charts from all of the weather models including ECMWF and AIFS, and NOAA GFS/GEFS, HRRR/RRFS and Blend of Models (NBM). NOAA WPC and SPC for fronts/convective outlooks. Our own content is sourced from forecast.city and weather.city and celsius.earth.
Atlantic Hurricane Season | YTD: 10 Named Storms, ACE = 19.5
NE Pacific Hurricane Season: YTD: 24 Named Storms, ACE = 355
My Atlantic Hurricane Season Forecast (2026)
From April 7, 2026: Atlantic Seasonal Hurricane Forecast: (11/5/2)
9-13 Named Storms (11 most likely)
4-7 Hurricanes (5 or 6 most likely)
1-3 Major Hurricanes (2 most likely)
Accumulated Cyclone Energy: 75-85 (well below normal)
NOAA 2026 Atlantic Hurricane Season Forecast
Previous in this storyline: Monitoring a East Coast storm system with some snow potential late next week (NOV 7)
- Milepost
- 1643 · laid 2026-11-10T03:37:25Z
- Source
- https://weather.substack.com/p/november-9-2026-monday-weather-update · November 9, 2026 Monday Weather Update
- Tagged
- I-32 Winter · Winter 2026–27 · Eastern U.S. (37.0, -78.0) · by rule, at build
- Digest
- ee24035329e415b6785abc29ed12394aa2822f39afa475d2d9838a5c116d4faf