July 12, 2026 Sunday Summer Weather
Yet another major heat dome for the northern tier including the Great Lakes with 100°F and many records to fall
July 2026 was the warmest July in the 132-year national record (1895–2026), at 76.9°F against a 1991–2020 normal of 74.4°F (+2.5°F).
July 2026 was the 26th-driest July in the 132-year national record (1895–2026), at 2.5in against a 1991–2020 normal of 2.9in (-0.3in).
NOAA/NCEI Climate at a Glance, contiguous United States. This is the observed record for the month, not a score of anything said in this piece — the forecast ledger begins 2026-08-17 and cannot reach earlier posts.

Announcing our weather.city
For 20-years, I’ve dreamed of my own weather website the way that I wanted it. I’ve been sitting on this domain for 10+ years waiting for an opportunity to develop weather.city [weather dot city] and now it’s entirely feasible, and a lot of fun creating exactly the look and feel of a weather forecasting website.
Please click around. I’ll be adding more features including satellite, radar, models, and other useful tools, but I’m very picky with the details and design. Again, without your support over the past 2-years, this could not have happened. Substack + Weather Trader subscribers have sustained my development and kept me motivated to finally launch everything. This makes n=6 websites that will work together with Weather Trader providing the data store and forecasting engine to run everything. Then comes Weather Hedger, not joking.
Main question is what does your paid subscription here get you in addition to access to this Newsletter via email from the Substack App? Well, this is obviously not the platform to share data or host a full-service weather data platform. However, I do have your email address, and the capability to extend subscription level services on the full Weather Trader / weather.city / everywhere else assuming that’s in your interest. I do not want the garish / ugly advertising that assaults users of the main weather websites. Sponsorships might be a nice idea, especially for state, urban, local or event “points of interest” forecast pages. I want to keep “everything under the sun” freely available for non-commercial usage.
There really hasn’t been a high quality and newly designed weather website in a decade, and the other options are not modernized, and are impossible to navigate. They are ad heavy, location and personal details tracking, cybersecurity nightmares.
I think you can see where I’m going. Weather forecasts are a commodity, and the vast majority of users just click on their phone app, and really don’t pay much attention to the underlying science or the beautiful details inherent within the intersection of weather and geography. I think the U.S. Interstate system connects them both, and the signage and colors are iconic.
Hopefully, this Substack Website will transition to the look and feel of the weather.city / Weather Trader constellation of websites including the maps. The full ECMWF feed (real-time) data will cost $40k/year, and that’s a steep hill to climb at this time. However, I do like my color tables, so don’t expect much change.
There are major startup costs involved that could balloon quickly [servers] so I do need your continued support to make this happen. Current subscribers can add gift subscriptions at 50% off, or upgrade to the Founder’s Level —> This is a small but growing group that has trusted me to provide them the best possible and profitable information, and they will be granted nameplate status within weather.city. You’d obviously have open-door access to my consulting services.
And, I need to develop the mobile app for weather.city — normally a task that would take 3-6 months and require a team of coders. Not anymore. As someone with the in domain knowledge (PhD 16-years ago) and 13-years of private sector experience plus everything I know about weather models, giving me access to Claude Code (or the other ones) almost is unfair to anyone that isn’t familiar or comfortable at the command line prompt of a server shell.
I’m very excited for what’s coming. This is what I’ve been waiting for 15-years now: Finally charting my own course.
This is forecast post number 979: Day 194 of 2026.
Day 42 of Atlantic Hurricane Season — something is brewing
Author: Dr. Ryan Maue (X @RyanWeather X @weathertrader)
Help support this newsletter (nearing post 1,000!) — Become a paying subscriber. Weather Trader is entirely reader-supported publication (no ads). To receive all new posts and support our work, consider becoming a free or paid subscriber.
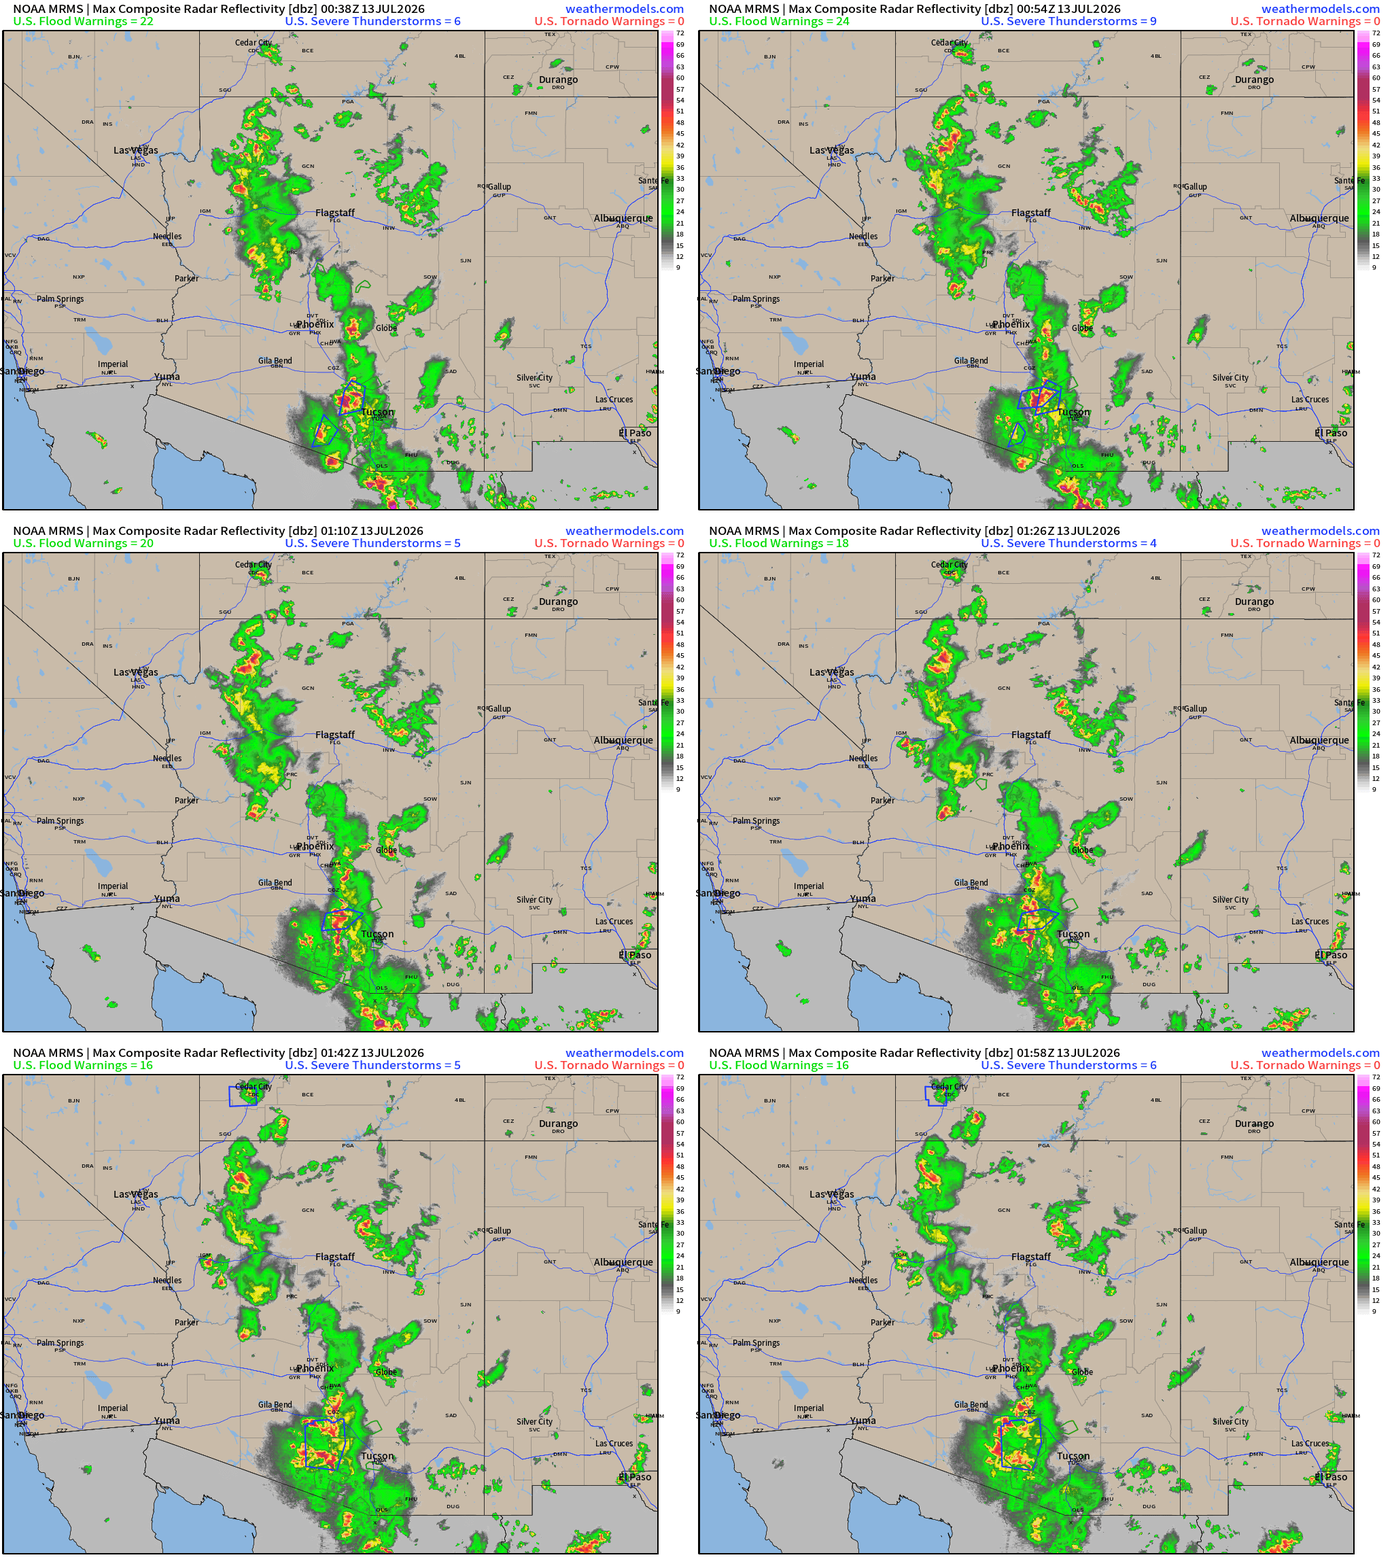
Impressive Southwestern Monsoon thundershowers especially across Arizona
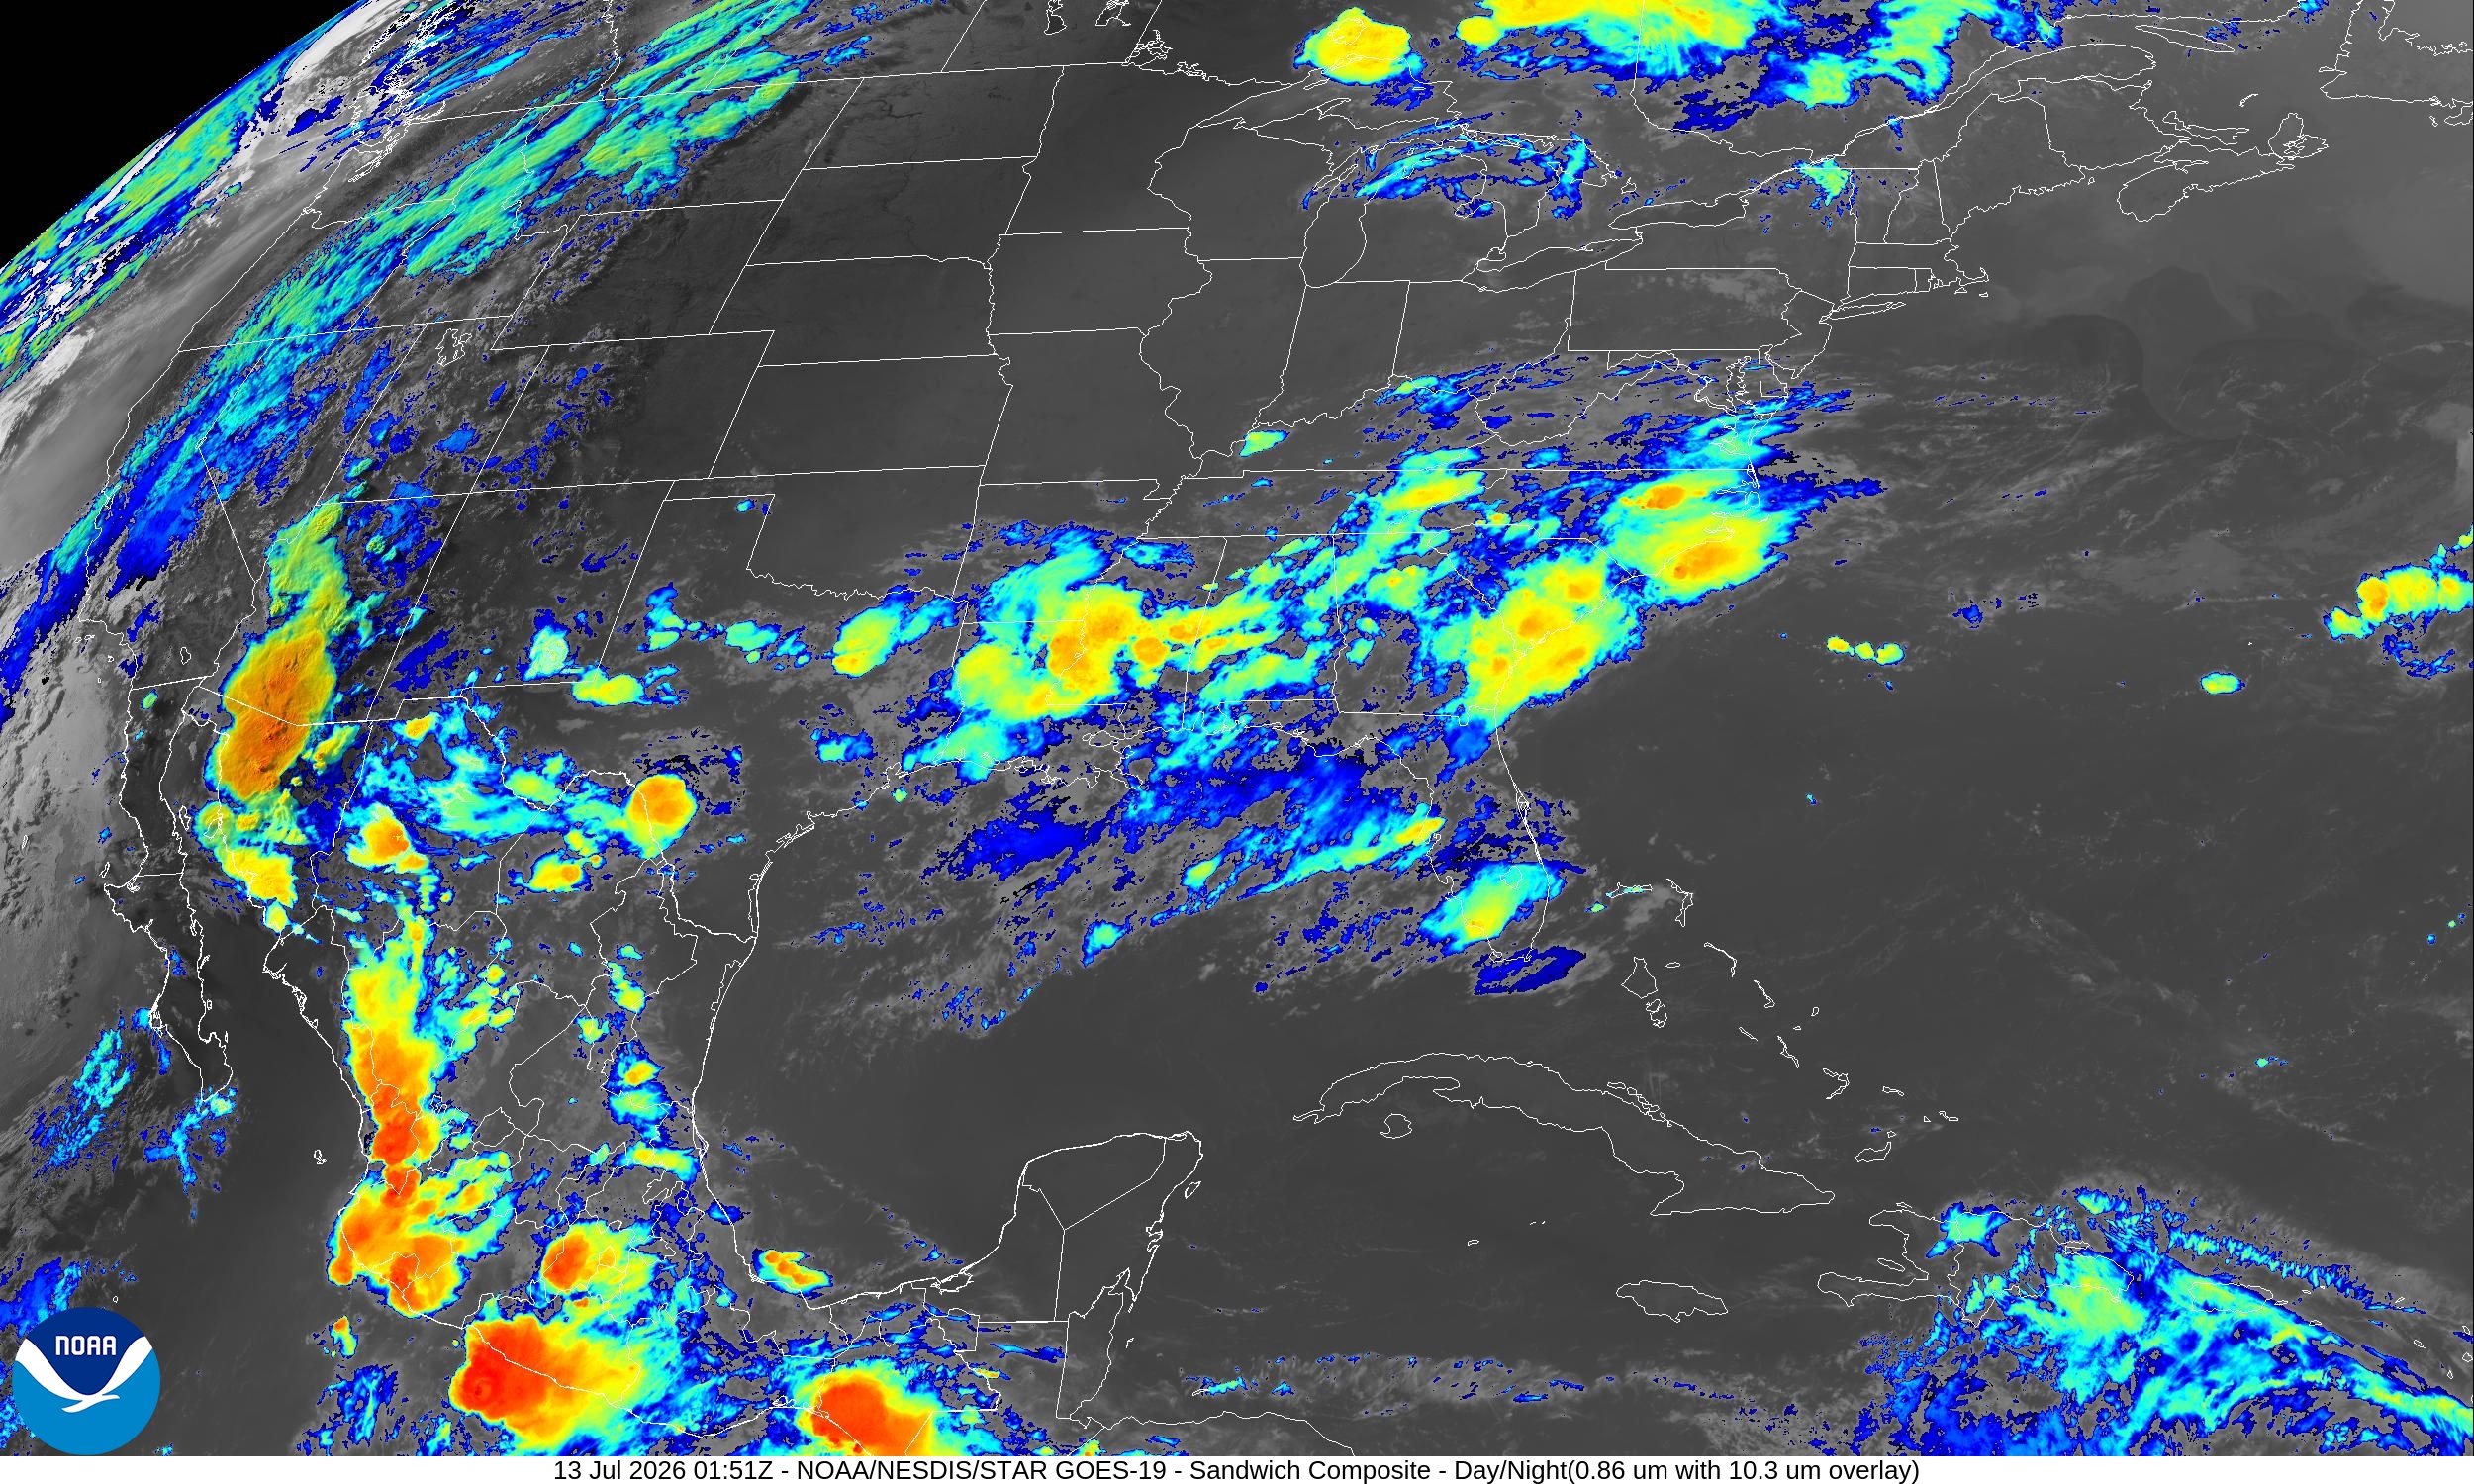
The main flow is from the east underneath the powerful “heat dome” completely clearing out the center of the Lower 48 into Canada.
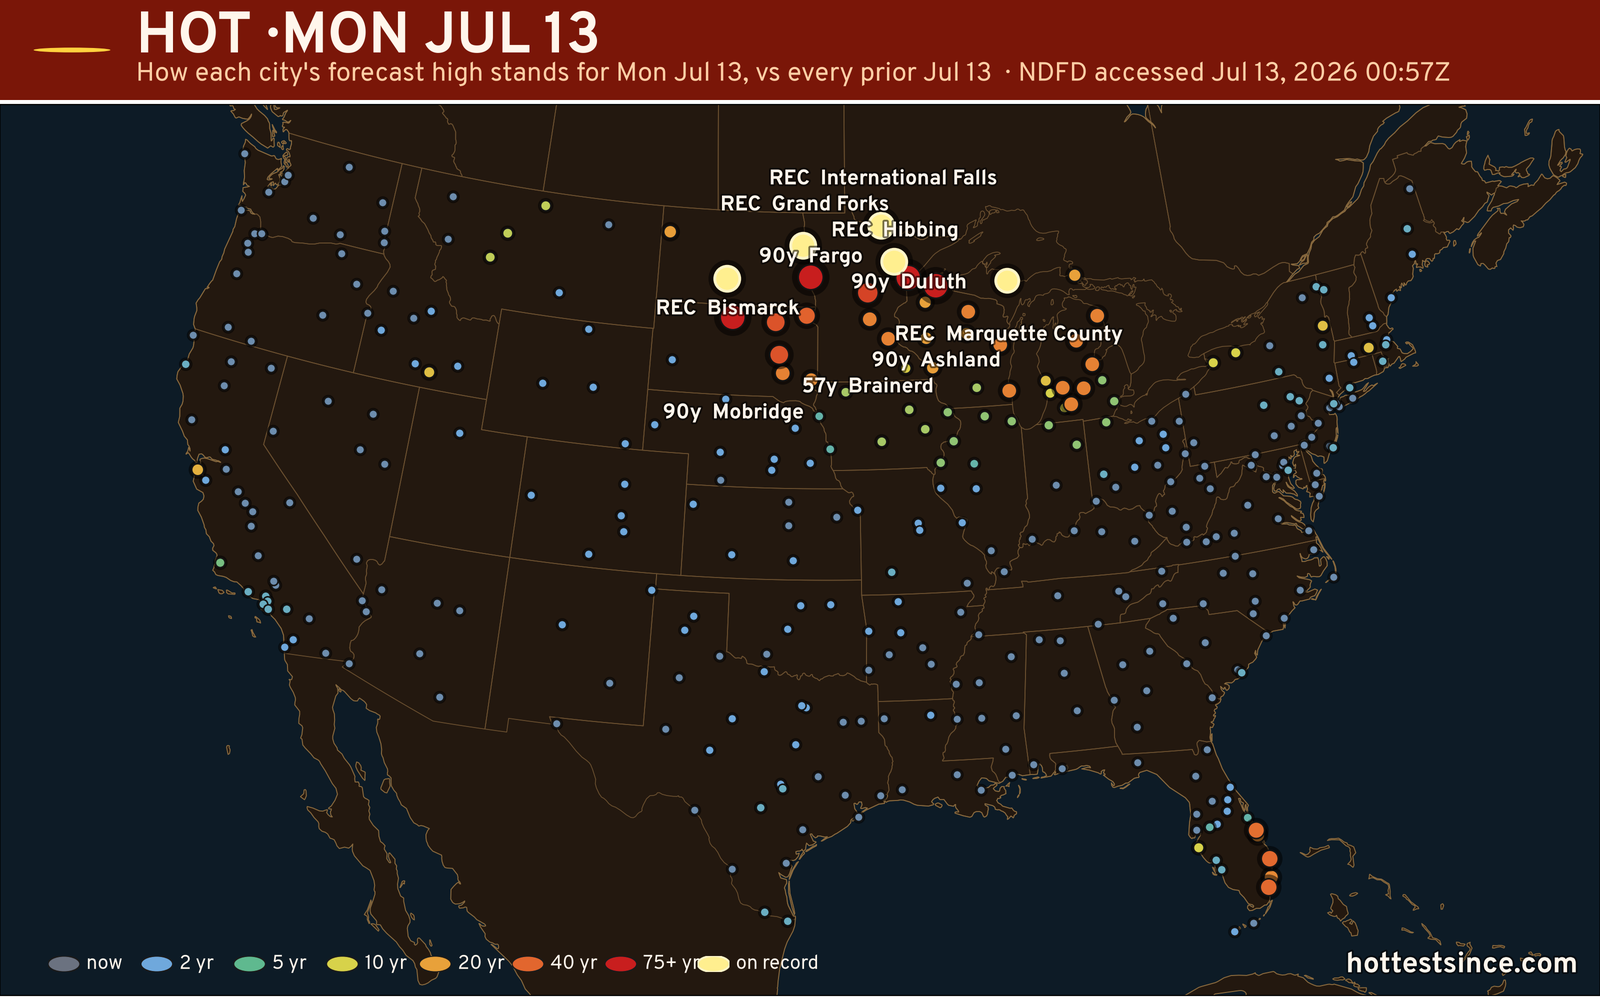
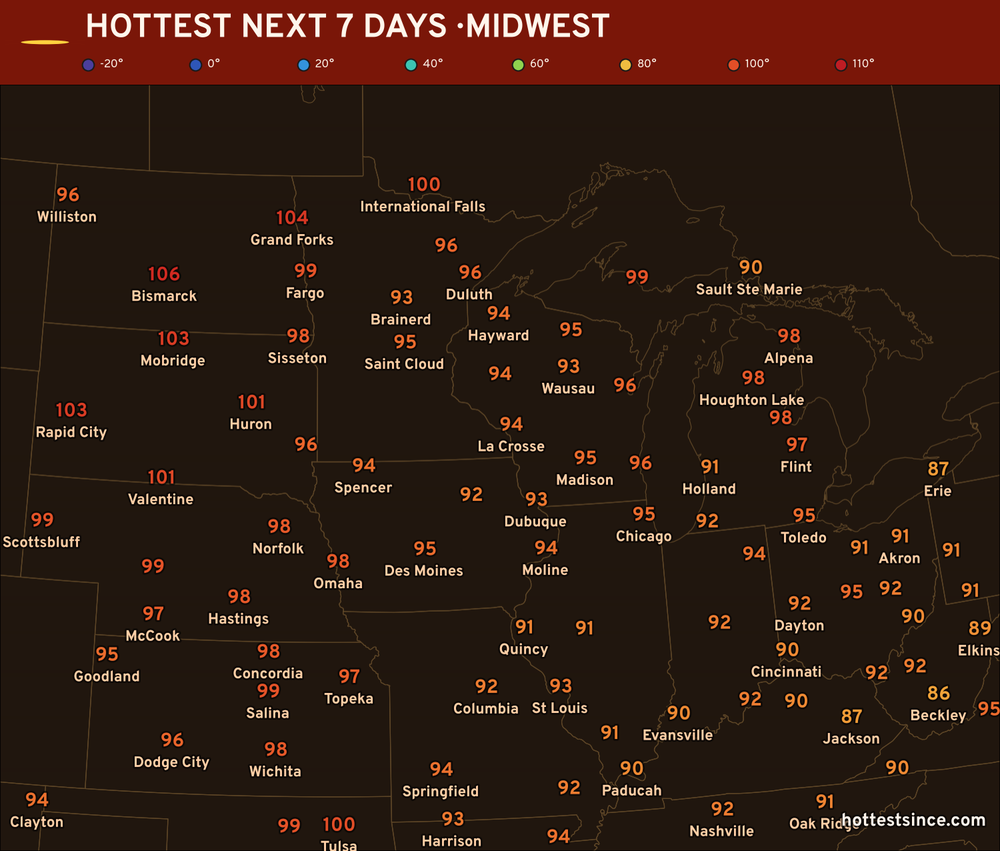
Records Threatened on Monday — concentrated in the upper-Midwest
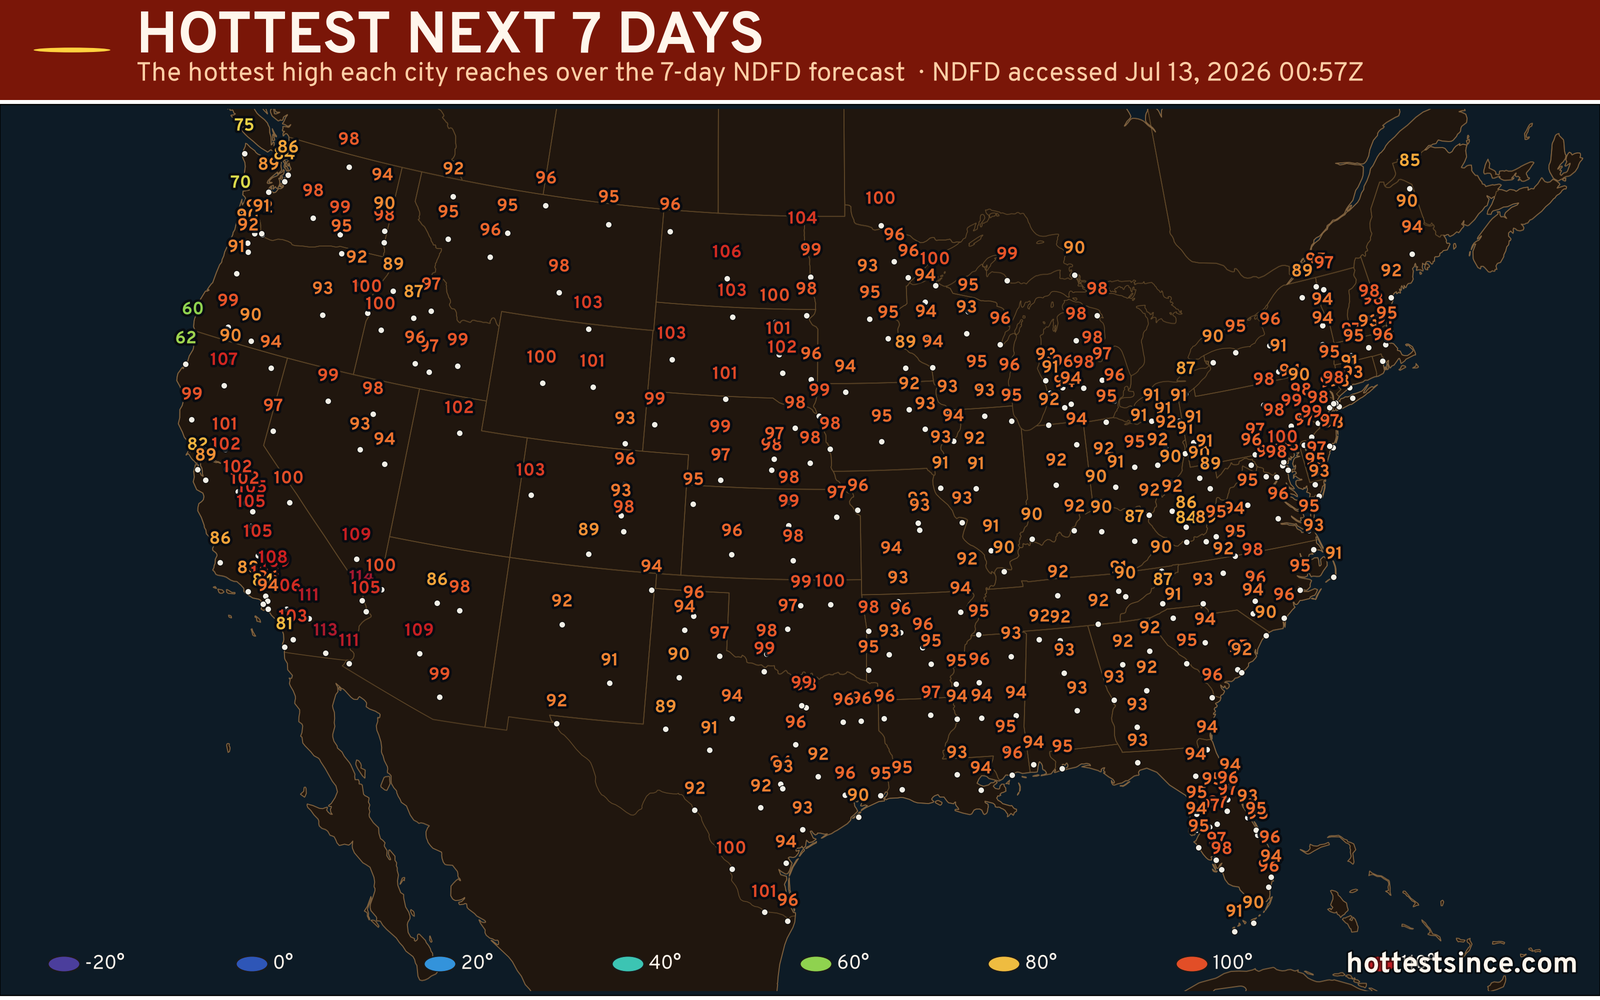
Hottest temperature for the next 7-days from the NDFD NWS forecast —> see more at Hottest Since — one of our companion sites
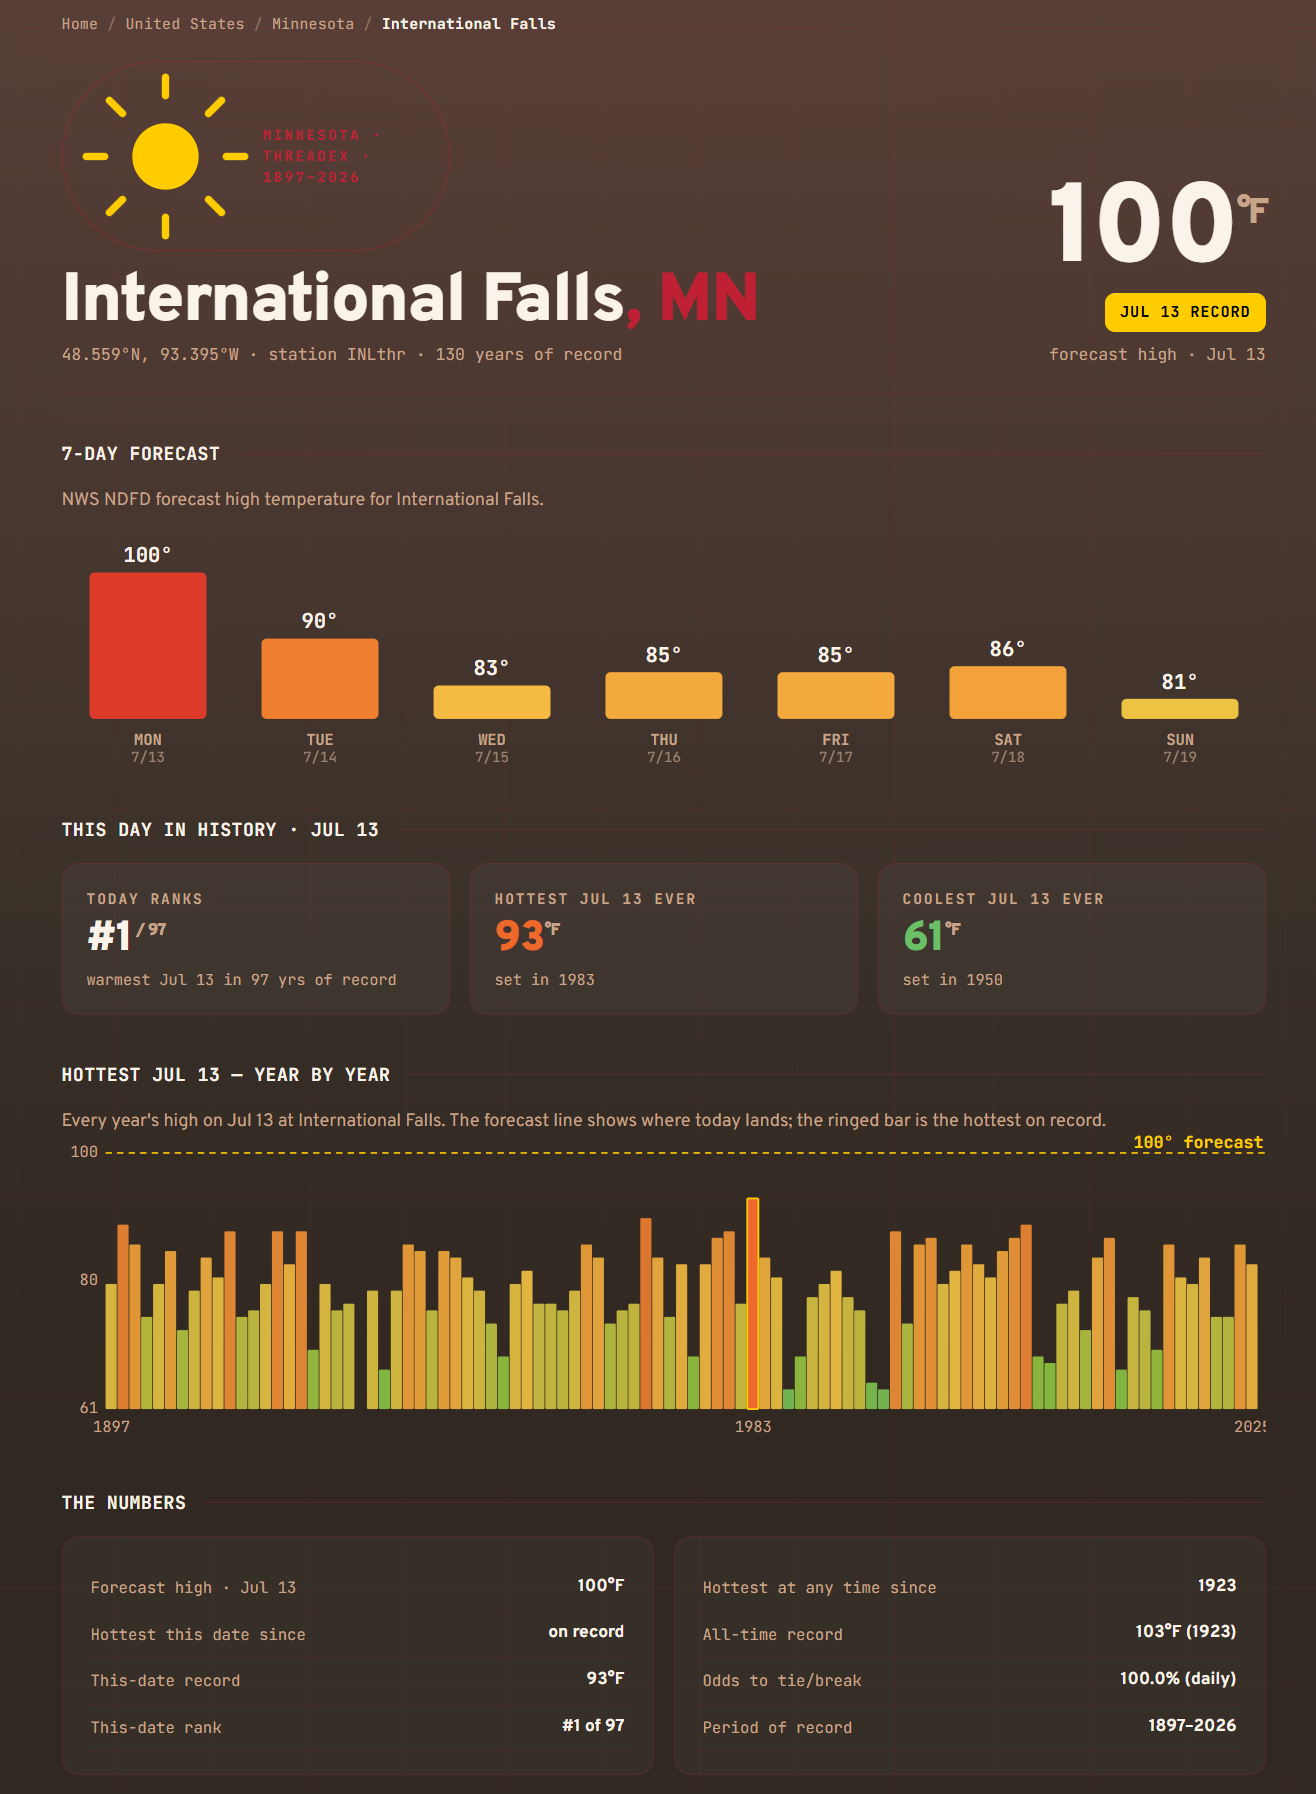
International Falls —> 100°F forecast on Monday
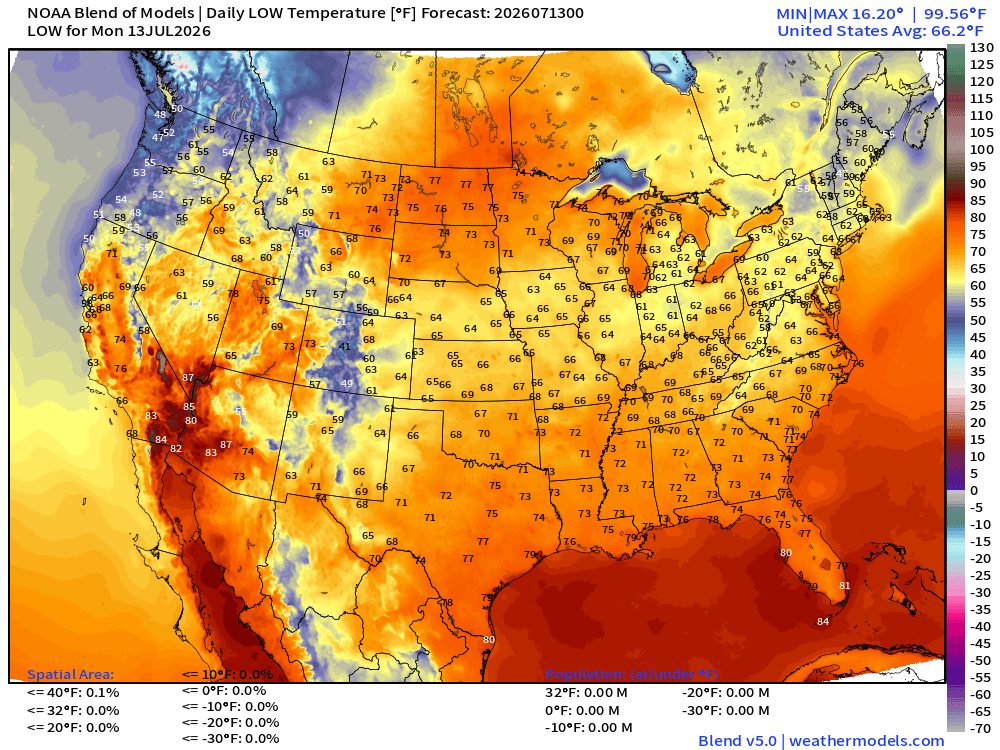
Back to more familiar maps — Monday Low Temperatures
High Temperatures on Monday
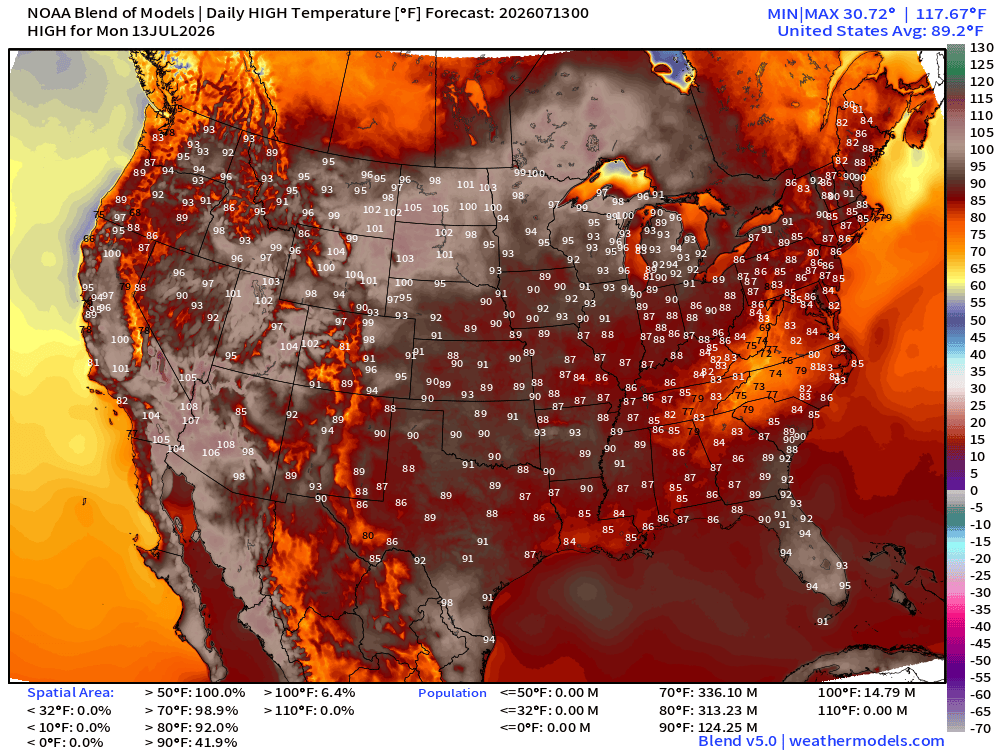
Heat dome pattern — hottest across the Southwest, California, into the Great Basin, and then northern Rockies —> Midwest & Great Lakes with 90s and 100s
Lower 48 average high is 89.2°F
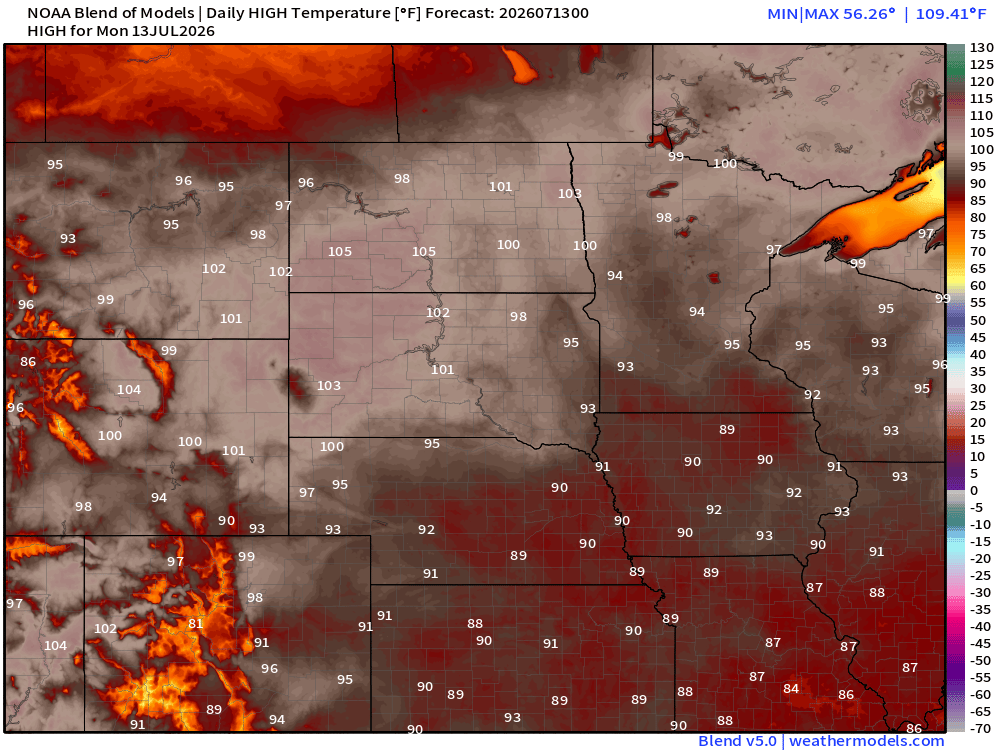
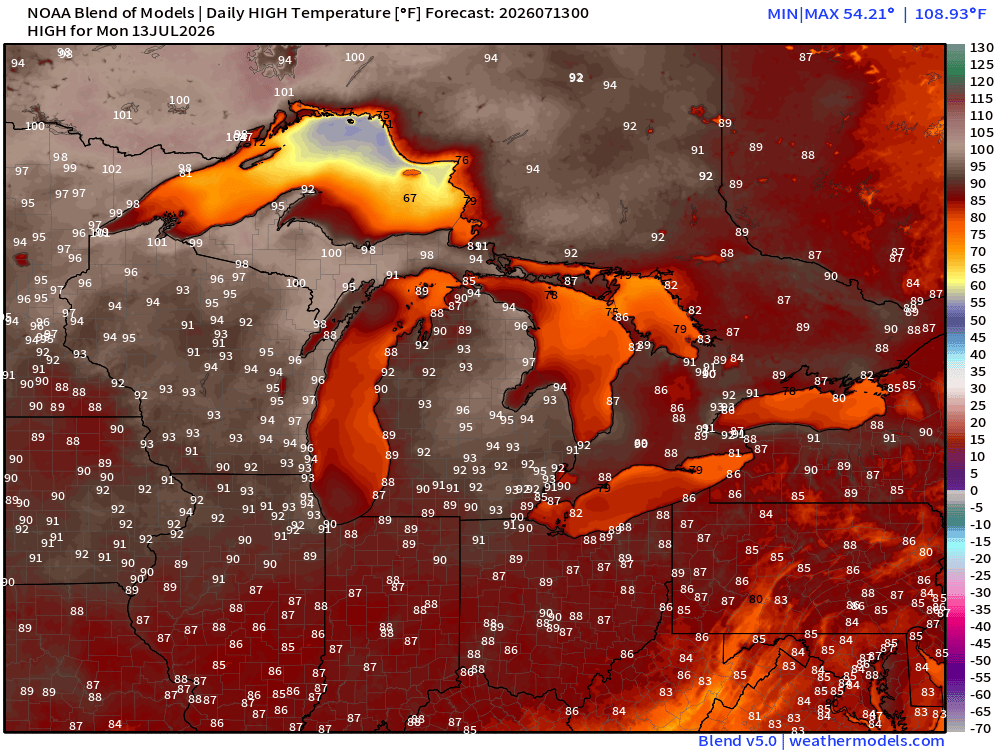
Tuesday High Temperatures
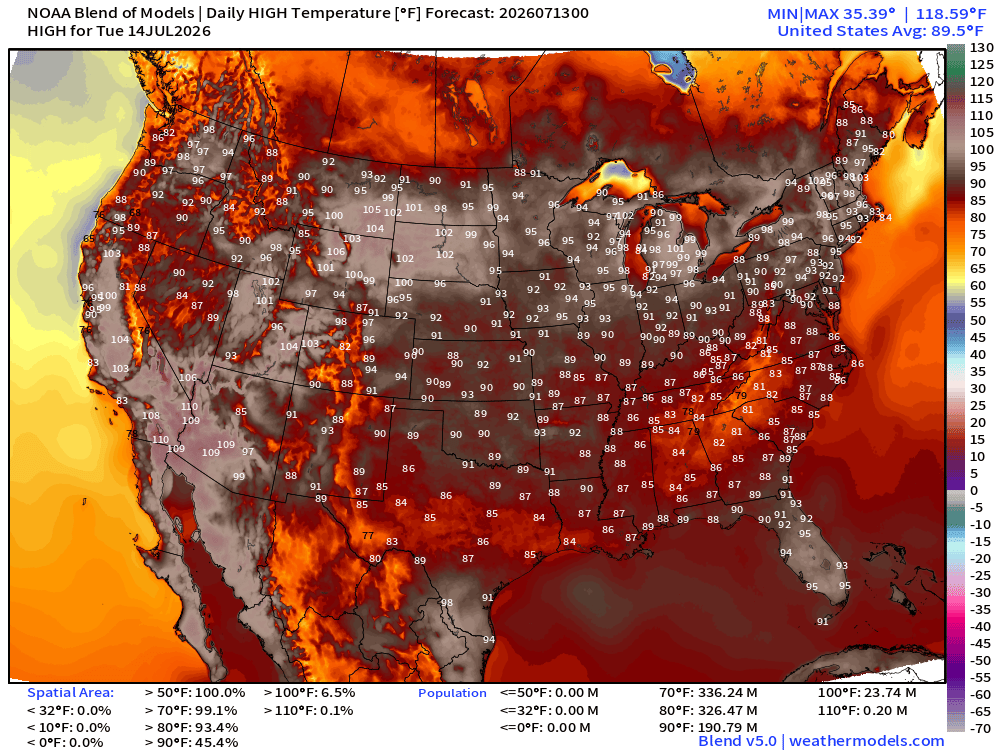
Very hot in Michigan into Canada including Toronto and Montreal
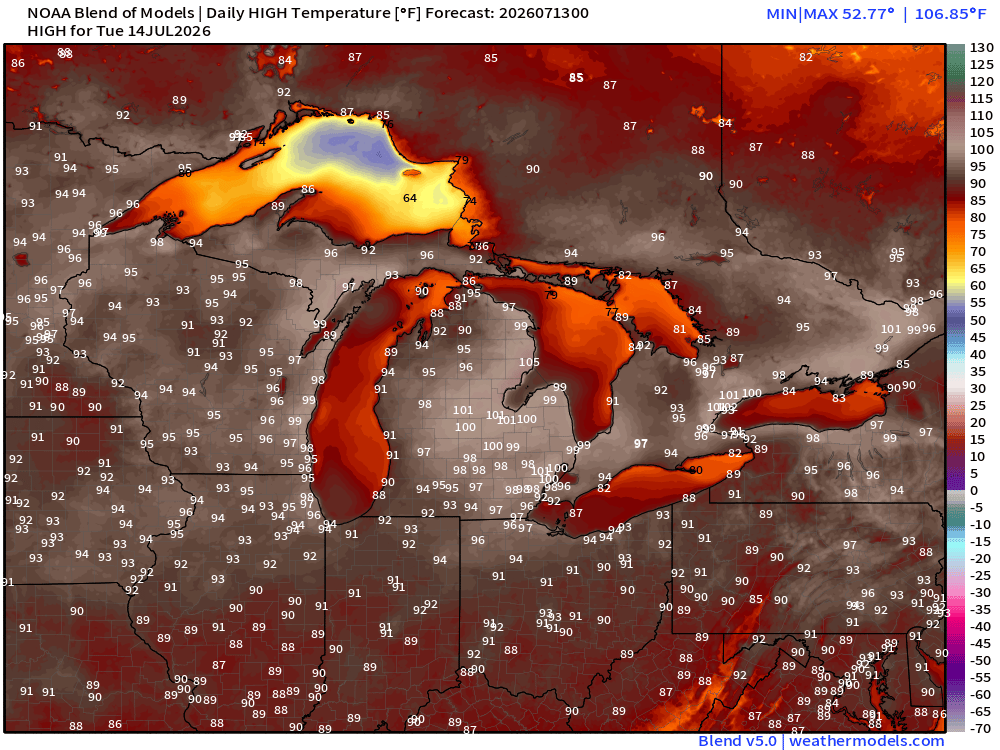
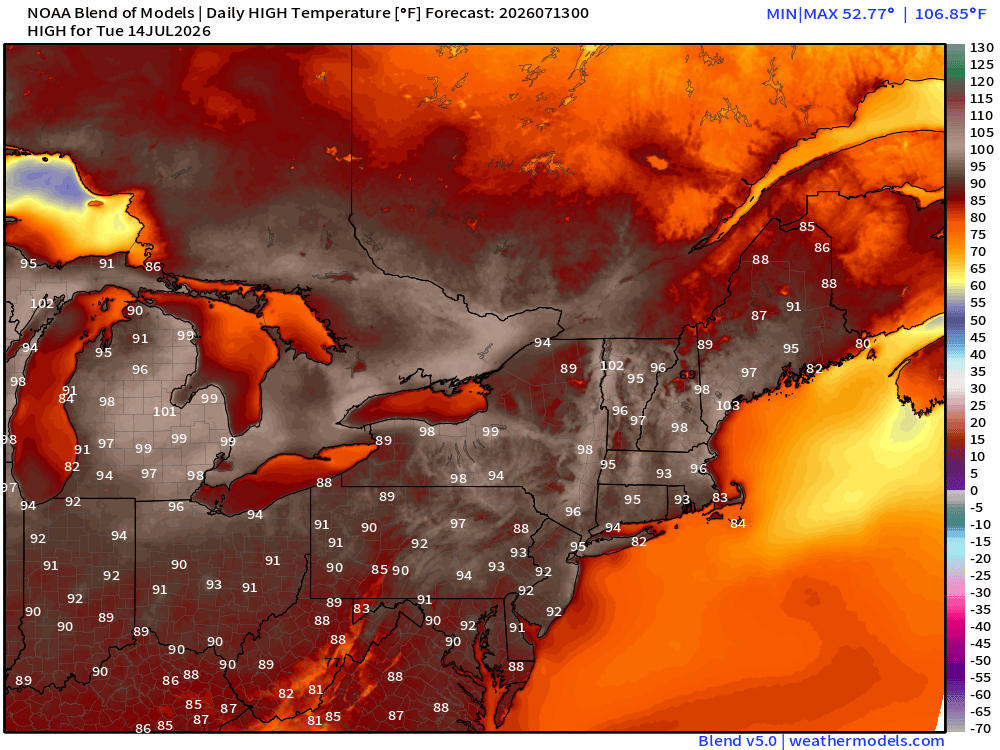
Into the mid-90s in NYC … low-100s in Michigan. Yikes!
Into Summer —> Height Anomalies don’t tell entire story … actual height does!
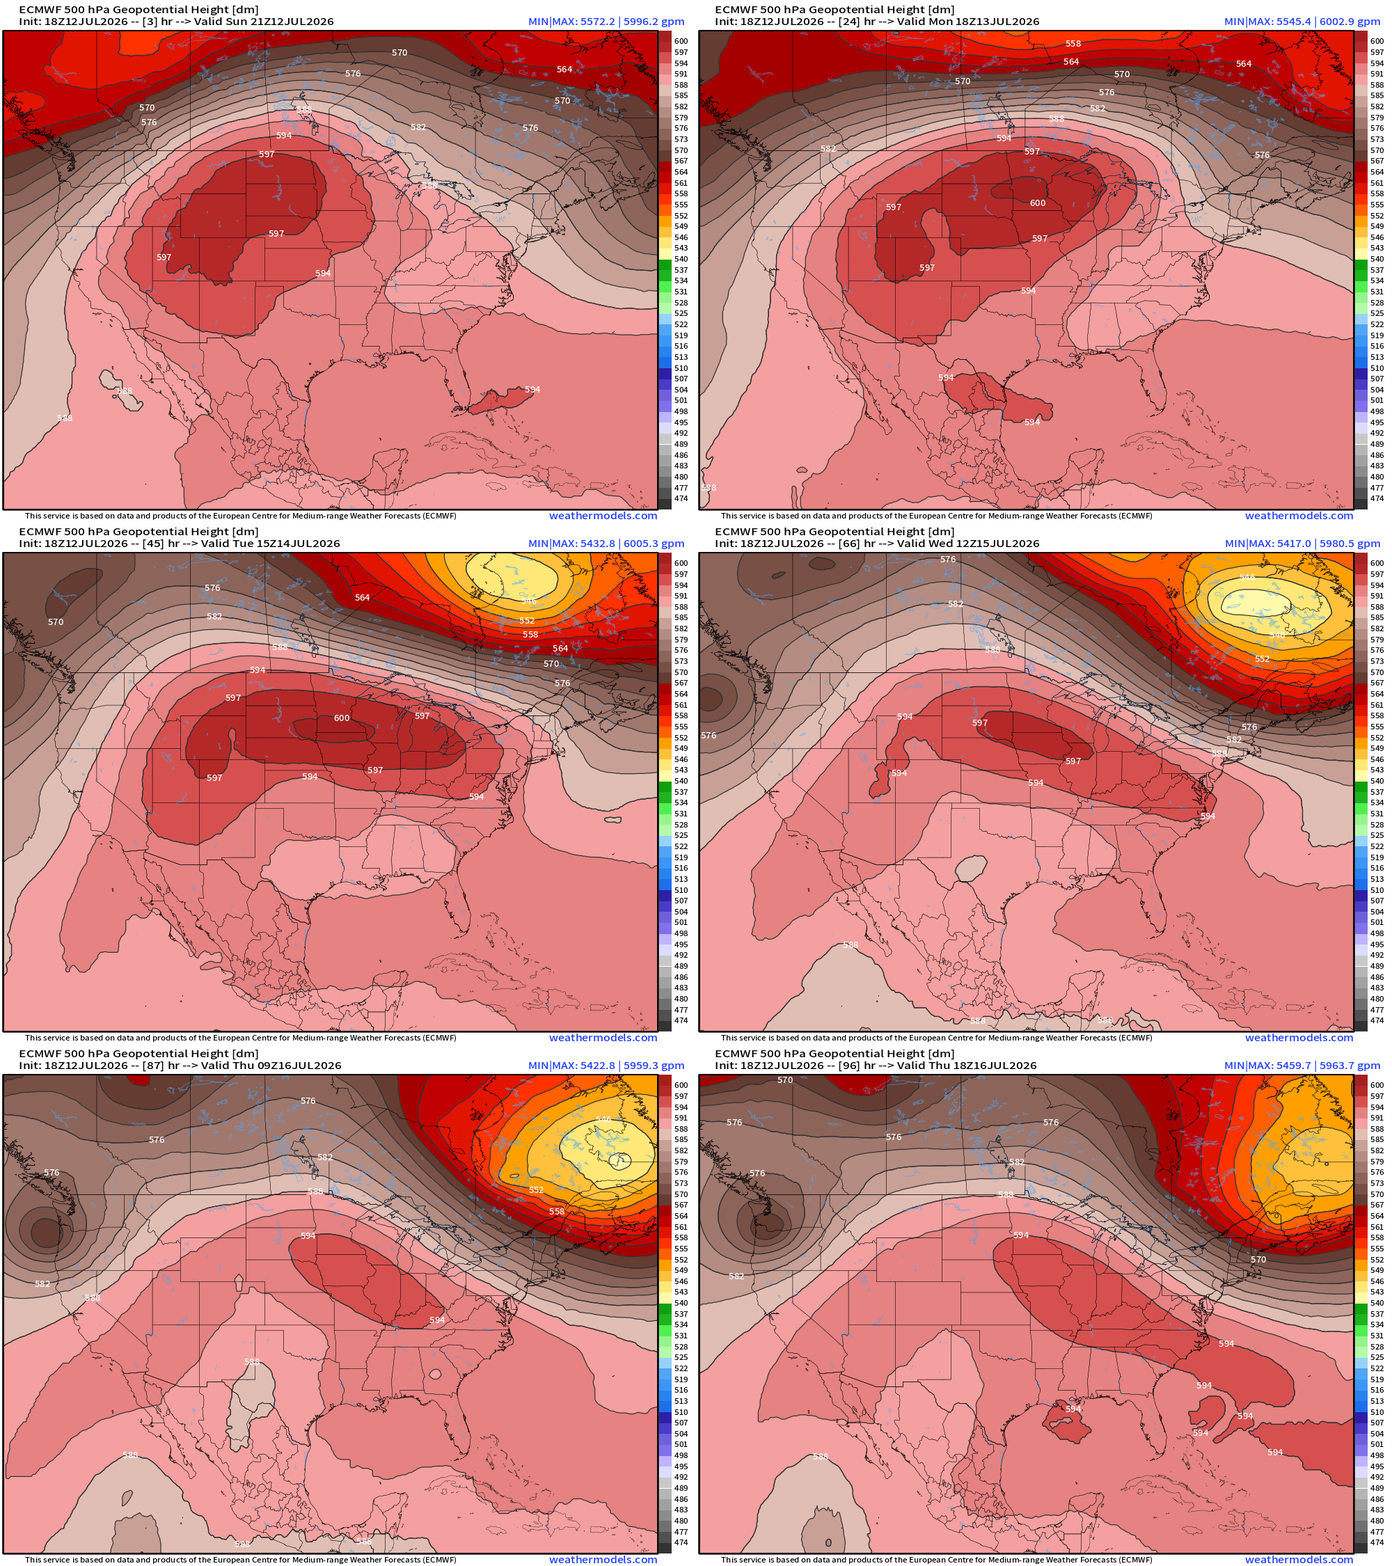
ECMWF 18z next 4-days —> maximum 6012 meter heat dome … a trough over the Northeast erodes the “heat dome” by end of the week, and that is key to a potential tropical storm development in the Gulf of Mexico down the road.
Normally when you’d see 600 dm, it’d be a major panic for potential record high temperatures everywhere with the entire Lower 48 broiling off the face of the Earth. However, the worst / most anomalous heat is on northern periphery while clouds and rain with tropical moisture is on the underside!
Upper-Level Height Anomaly | AIFS-Single Next 12-days
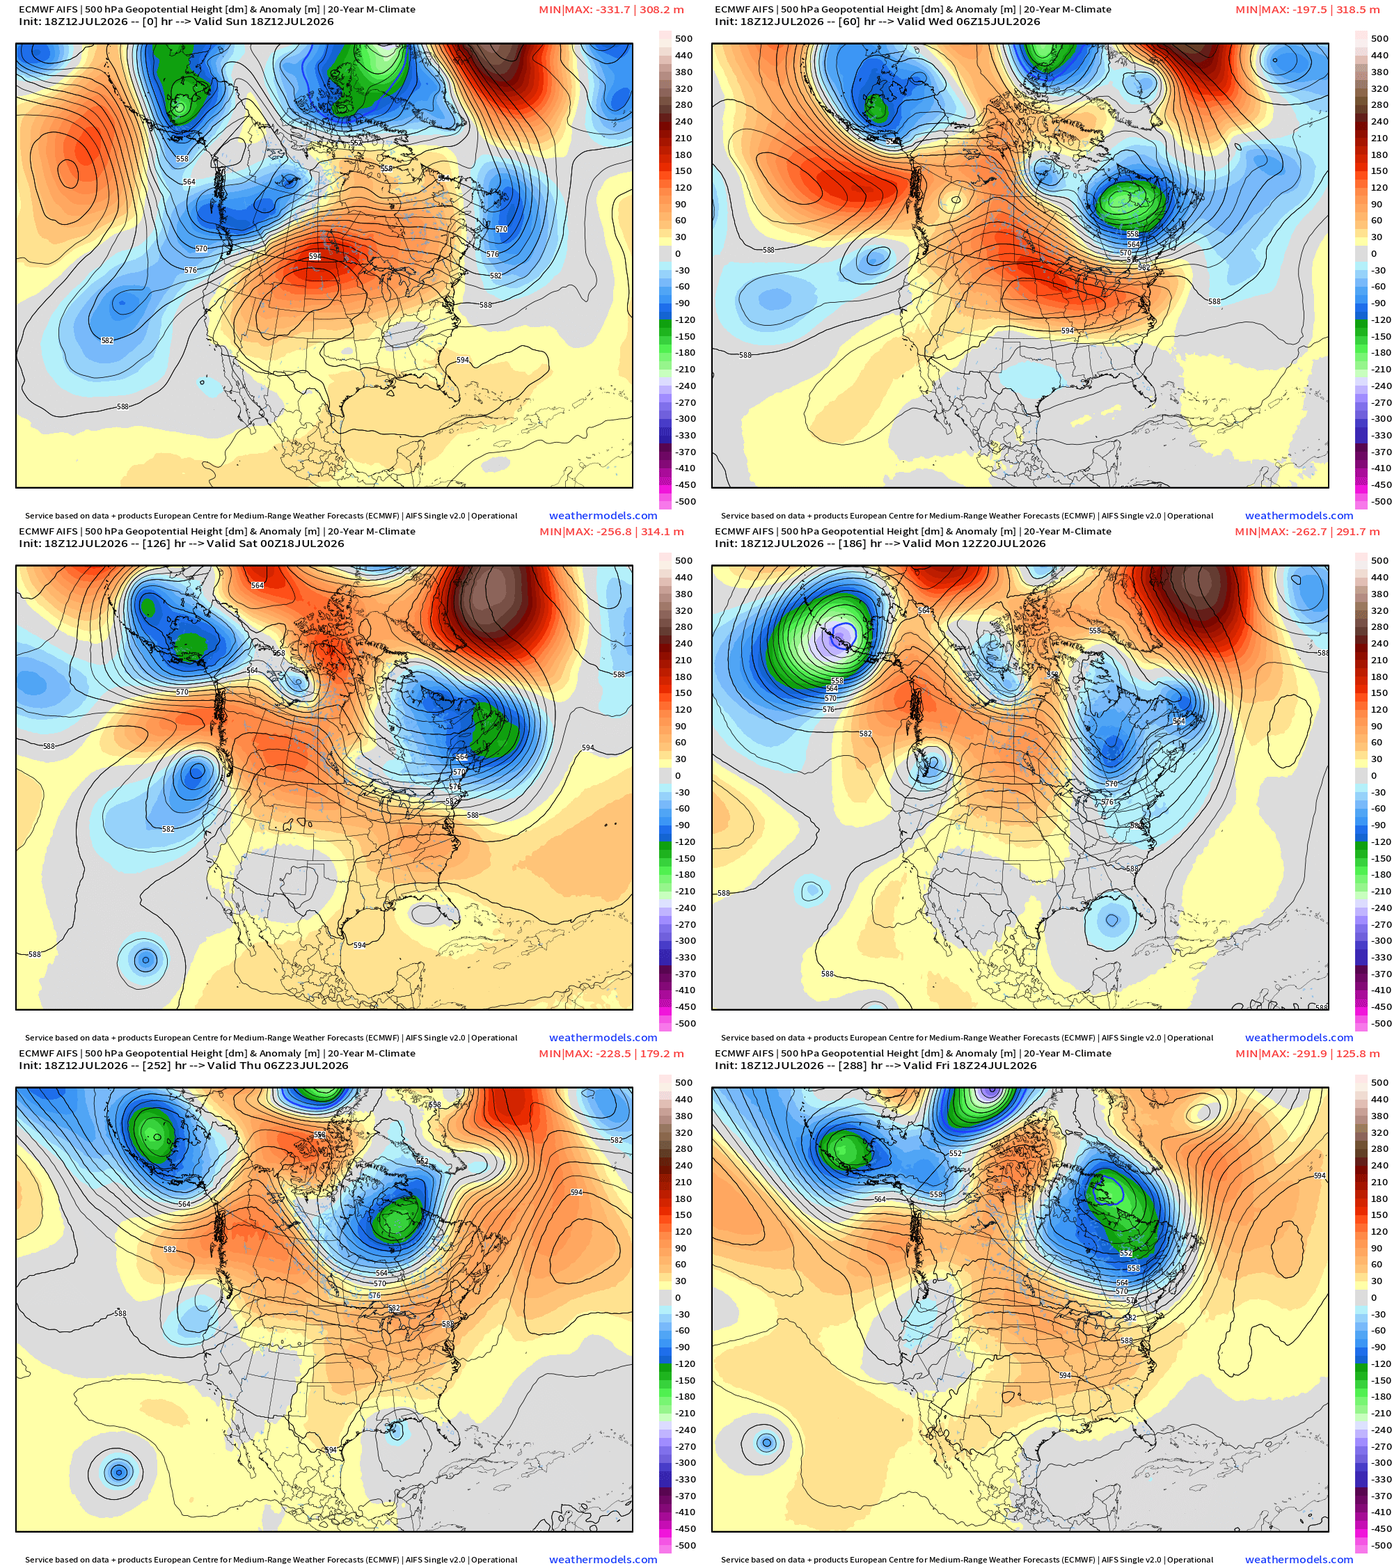
The impressive central U.S. ridge + a series of digging troughs out of the Gulf of Alaska and Pacific Northwest.
Also, note the troughs digging into the Northeast into Days 7-10 —> back to the cooler/unsettled pattern for mid-July.
Cut-off low formation in the Gulf of Mexico —> Bertha?
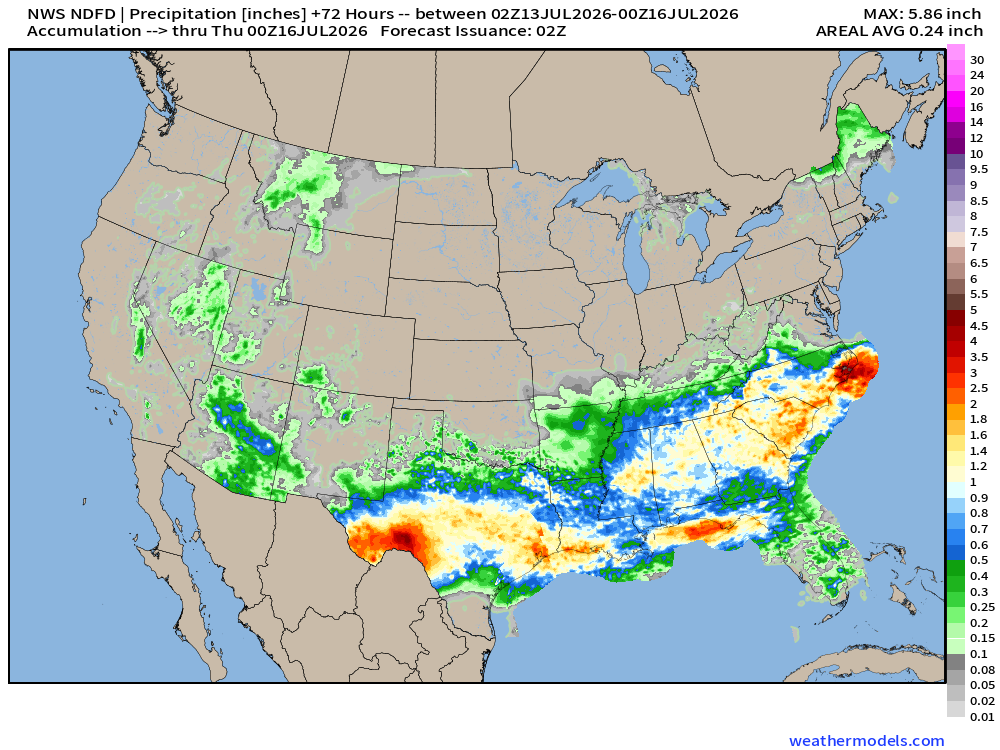
NWS Precipitation Next 72-hours —> Wednesday Evening
My favorite parameter — next 48-hours of HRRR Precipitable Water
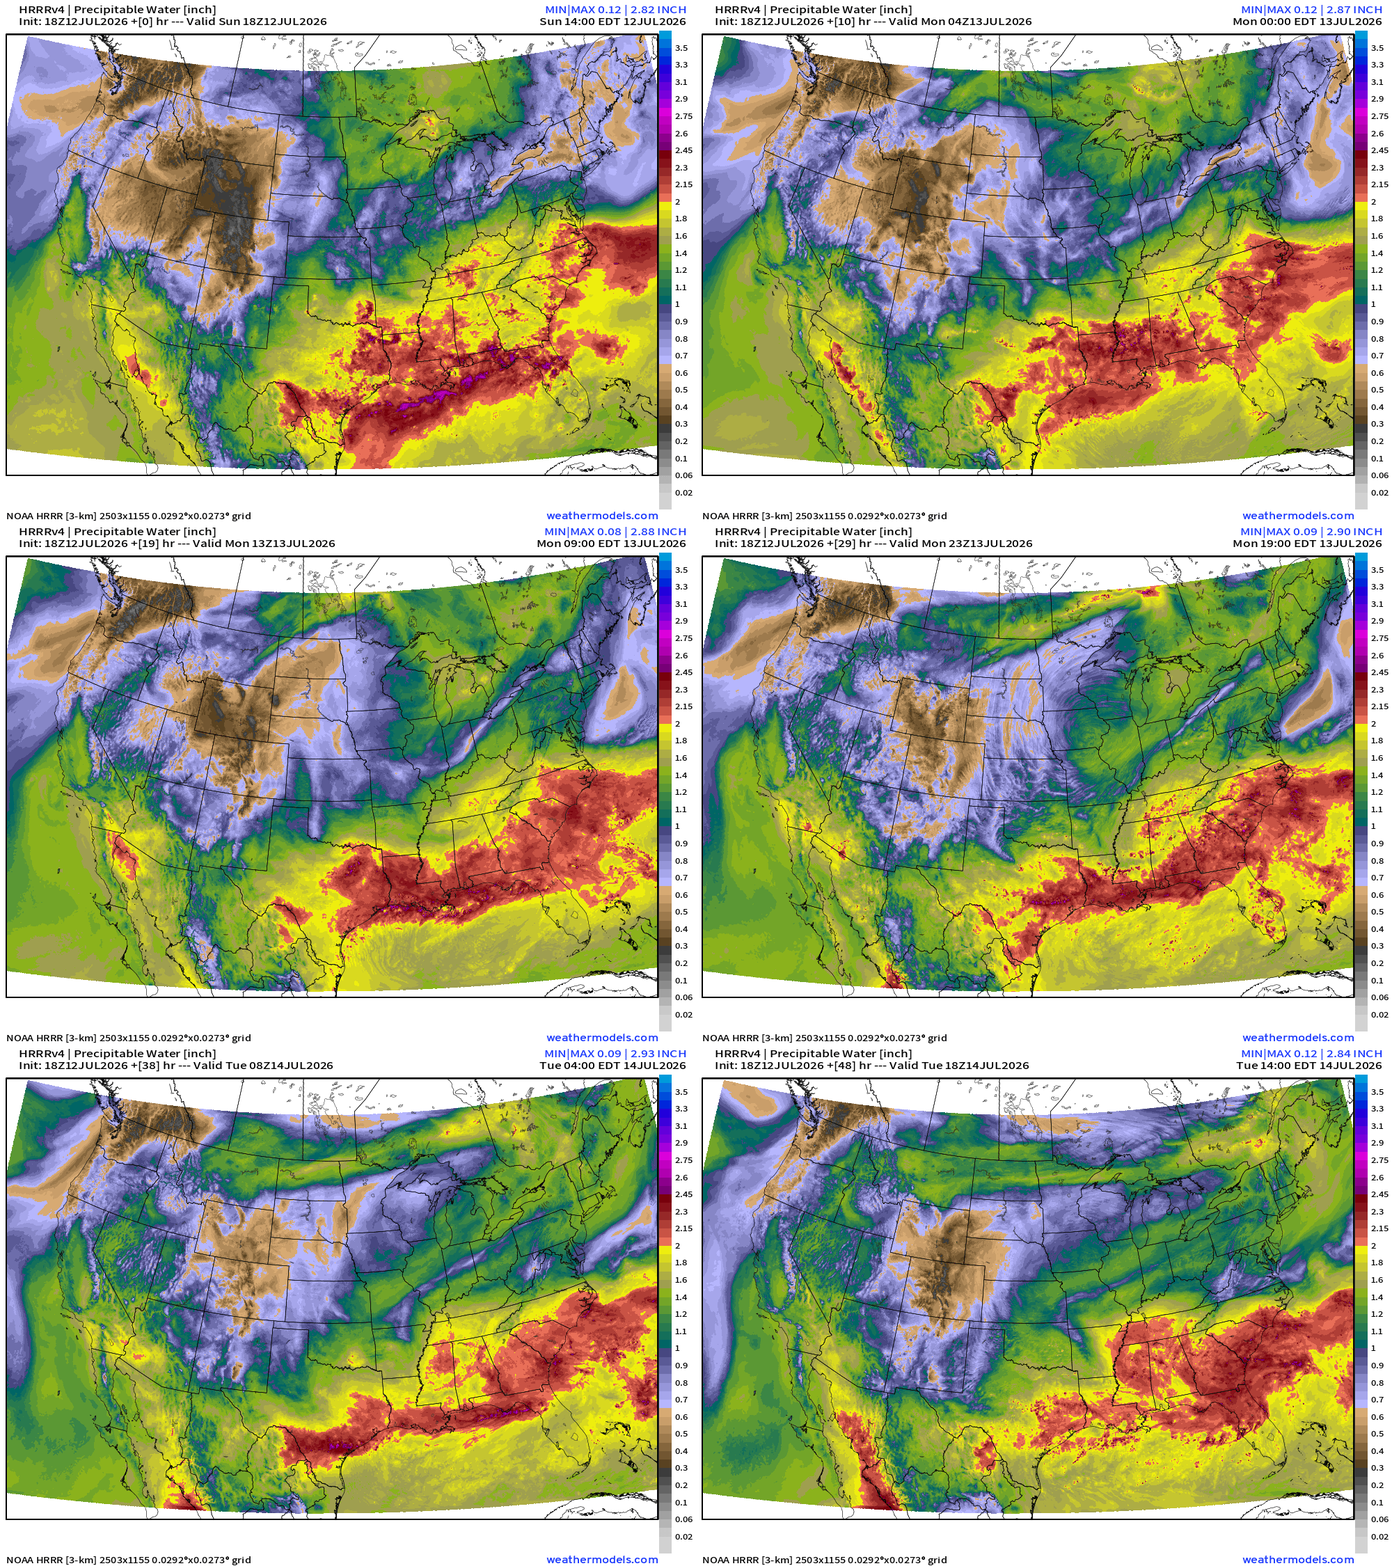
Plenty of moisture continuing to circulate and bubble up with the summer-time air mass across the Eastern U.S. to fire daytime thunderstorms with heavy downpours.
Southwest monsoon with high-PWAT air coming out of the Pacific
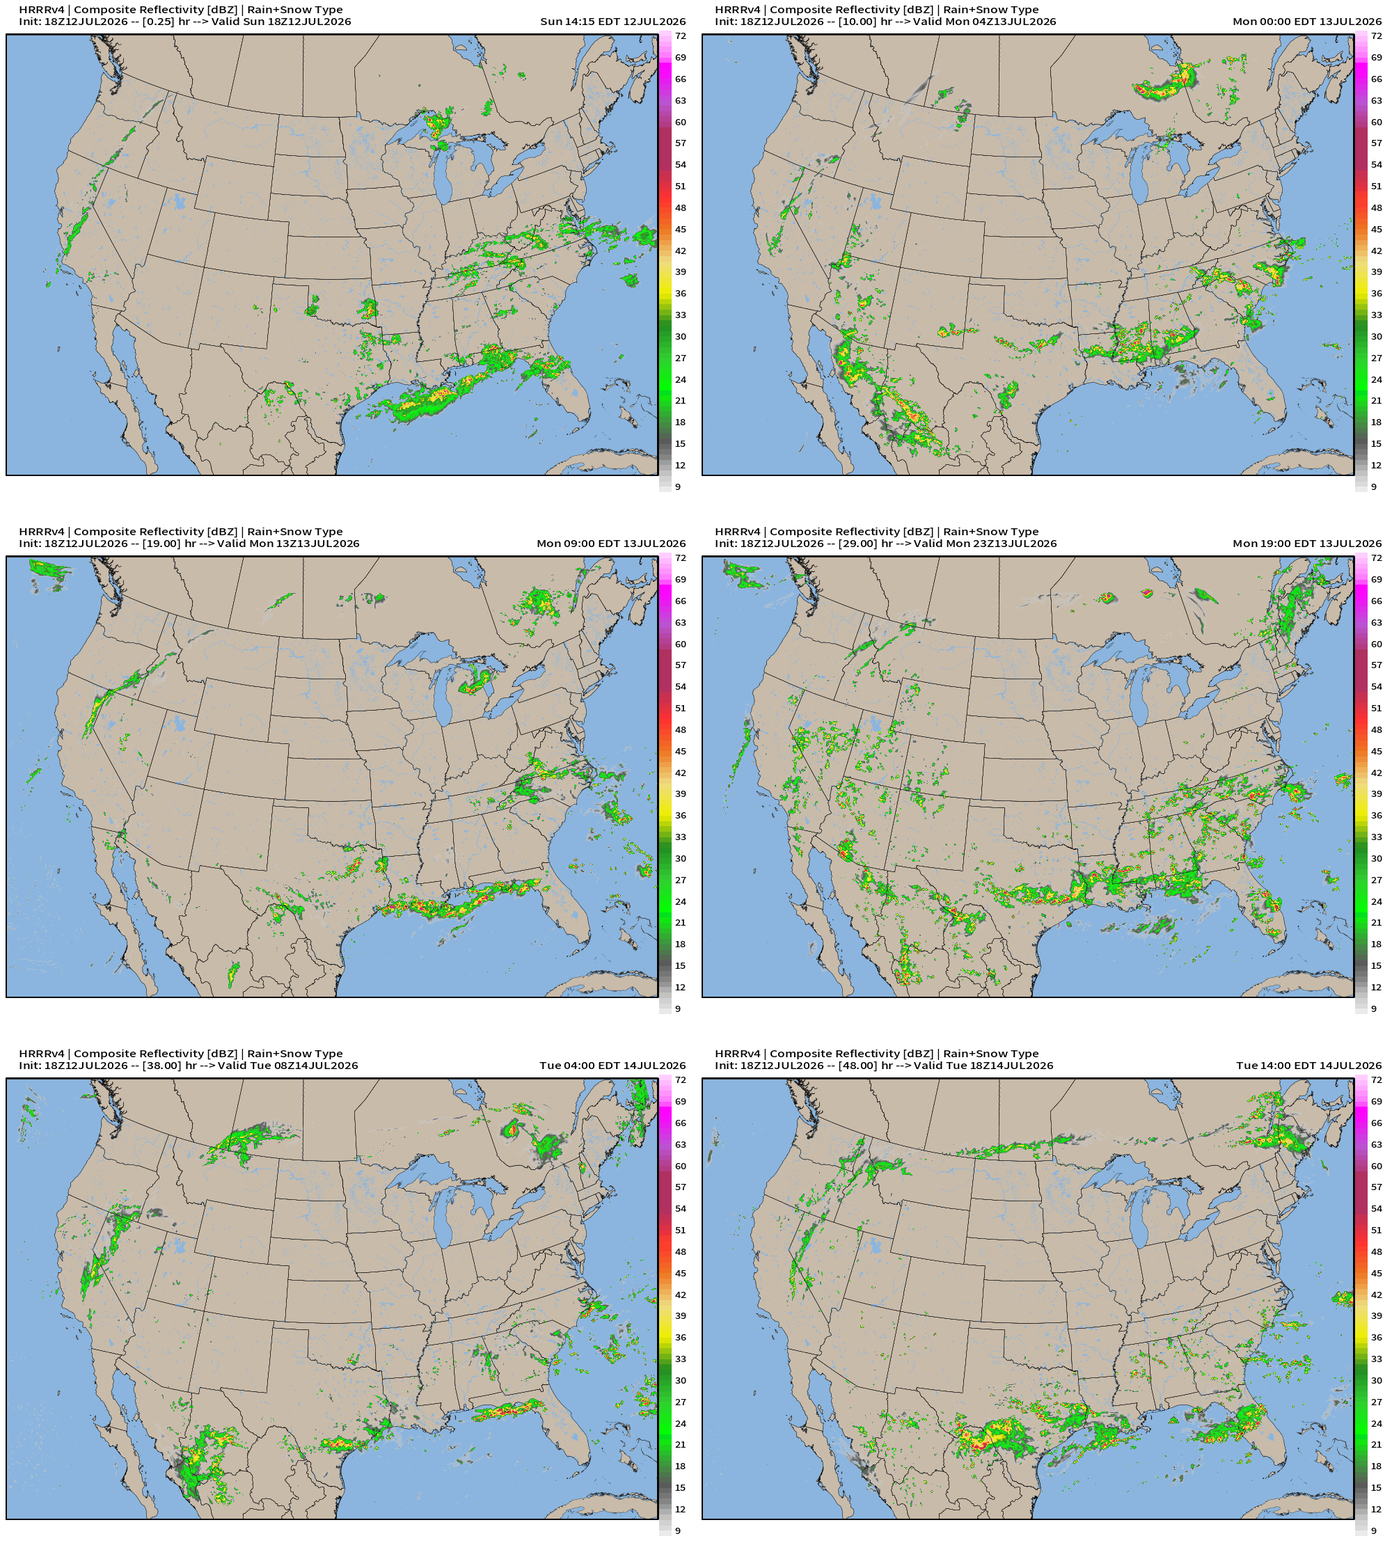
HRRR Next 48-hours simulated Radar through Friday 2 PM ET
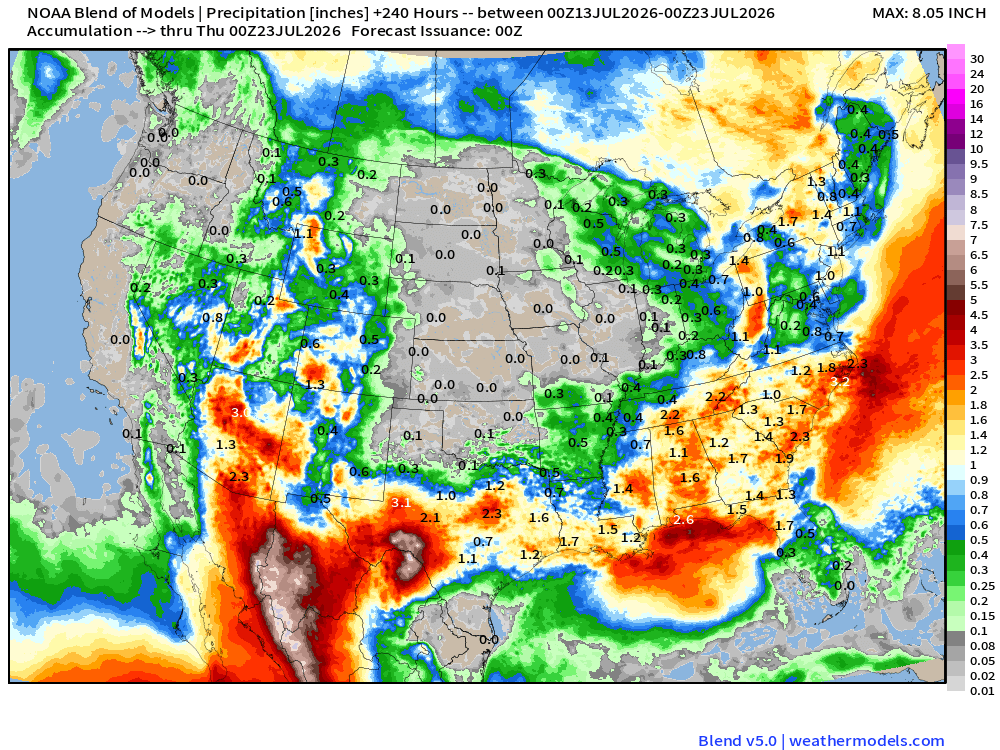
Blend of Models —> Precipitation Next 10-days
Flagship model: ECMWF AIFS 18z —> Integrated Vapor Transport next 12-days
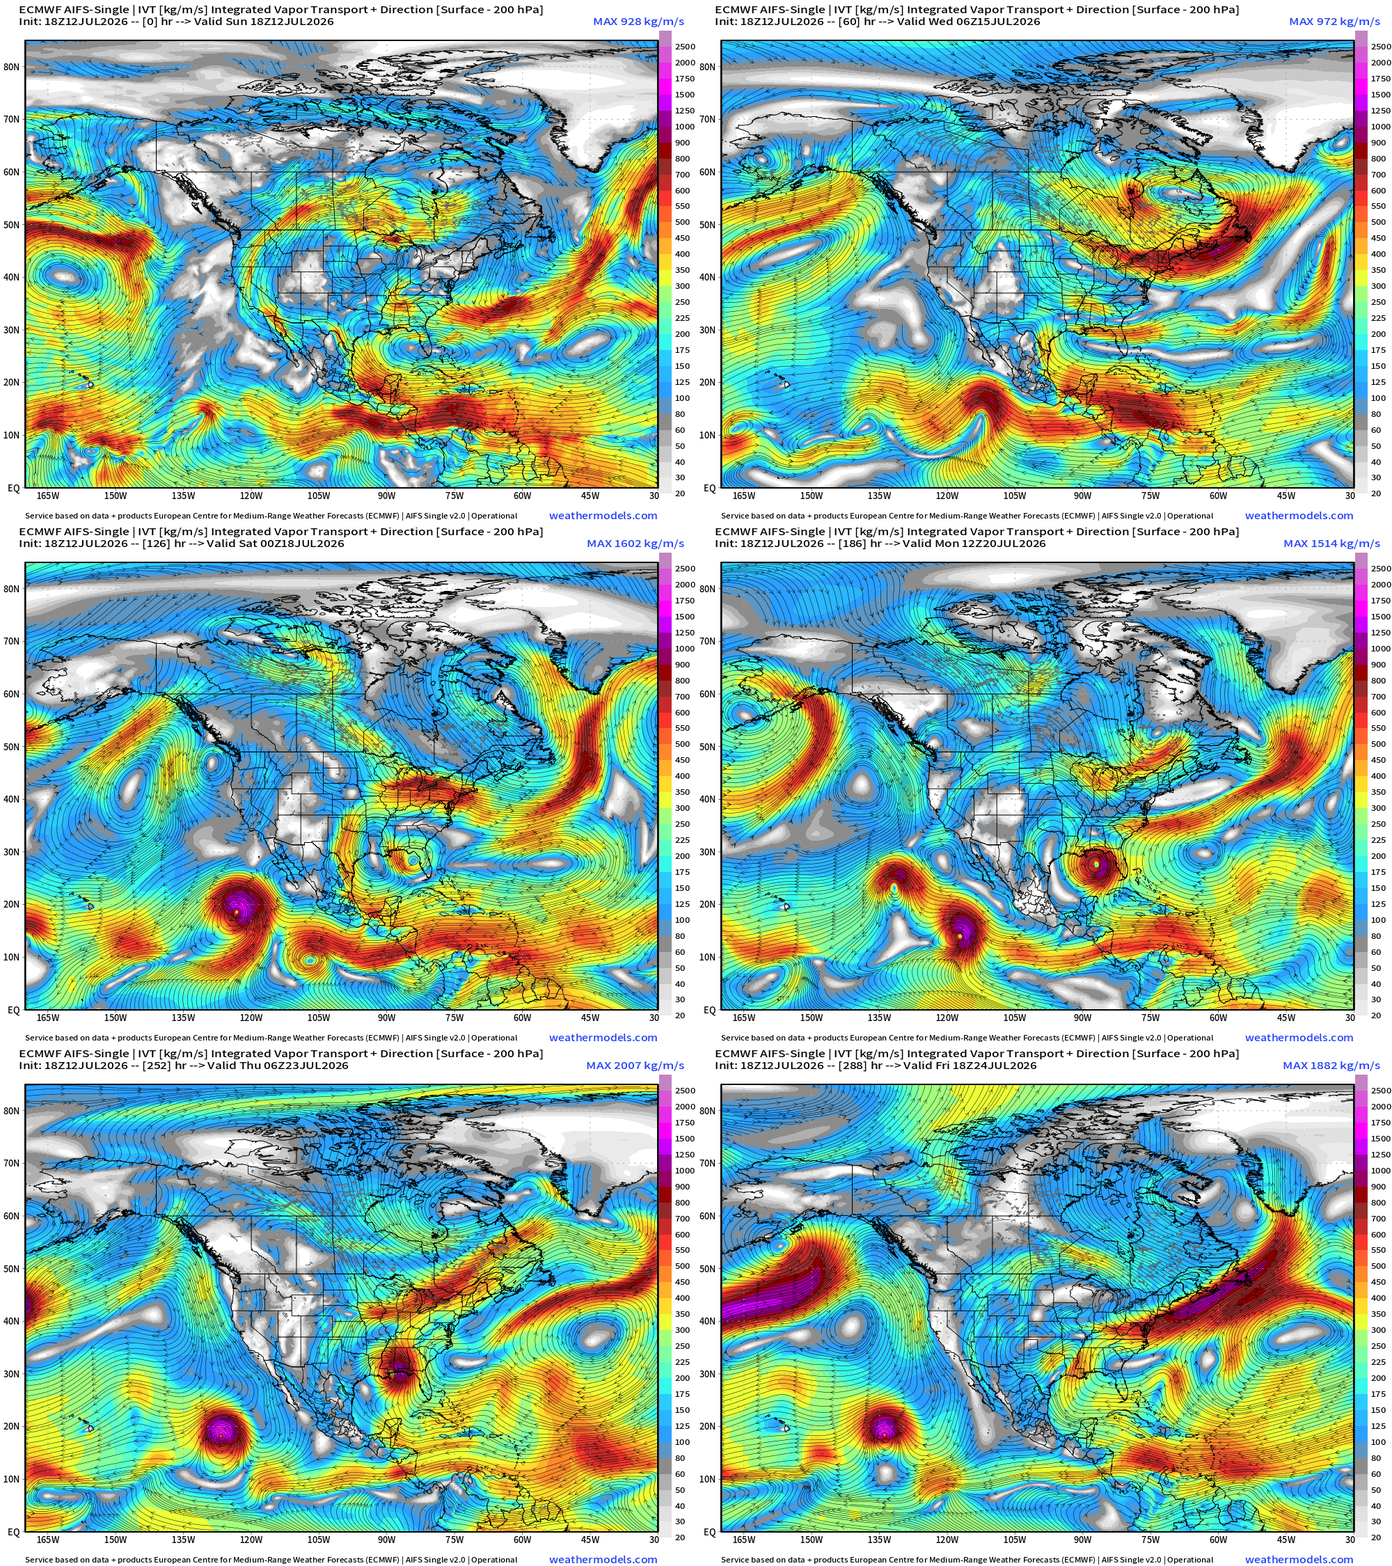
The heat dome across the Great Lakes shows up as a clockwise closed circulation within the moisture parameter (IVT)
Formation of a trough bent across North Florida and the Southeast Atlantic underneath the strong ridge —> spins up into Bertha!
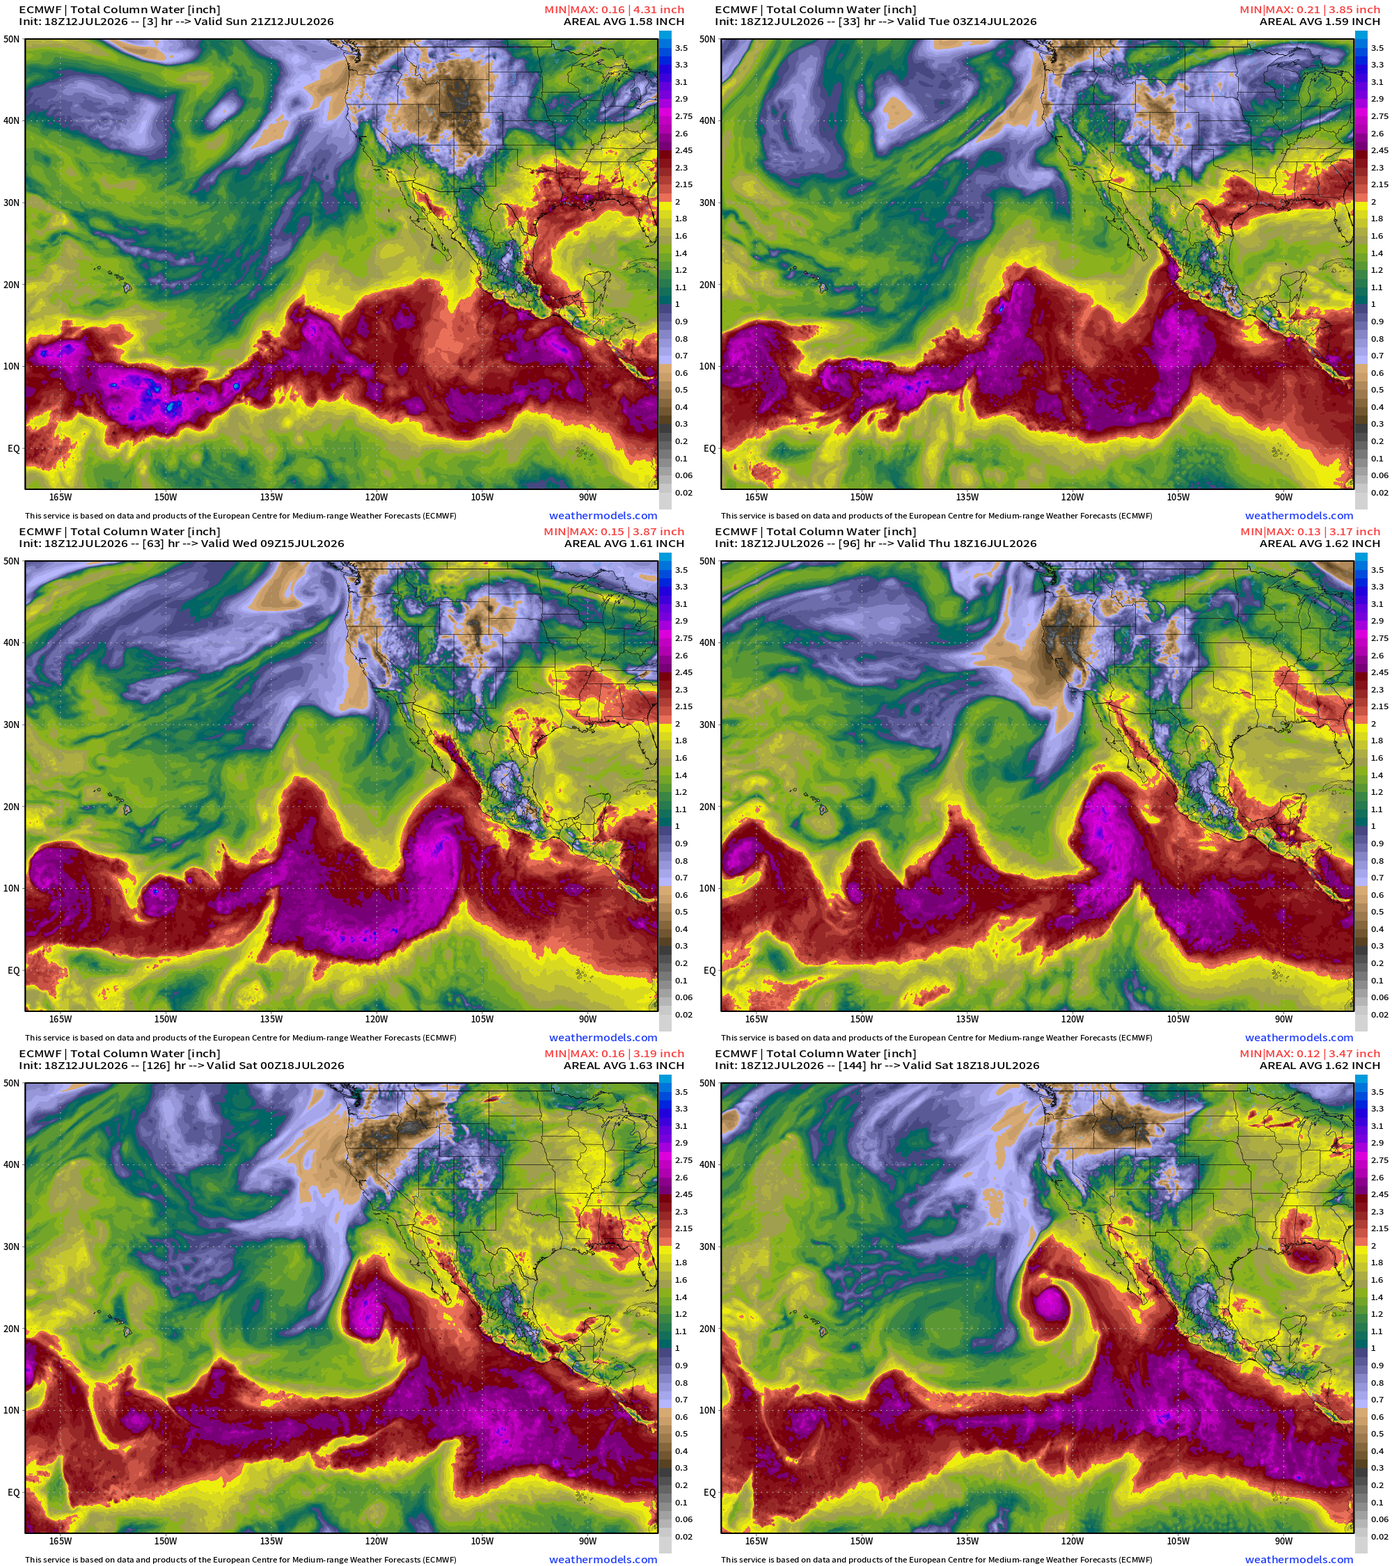
1 or 2 Eastern Pacific hurricanes likely in next 3-7 days
Otherwise, the Atlantic tropical basin is quiet, except “close to home” even during an intensifying El Niño
ECMWF HRES 18z | Precipitable Water | My Favorite Parameter
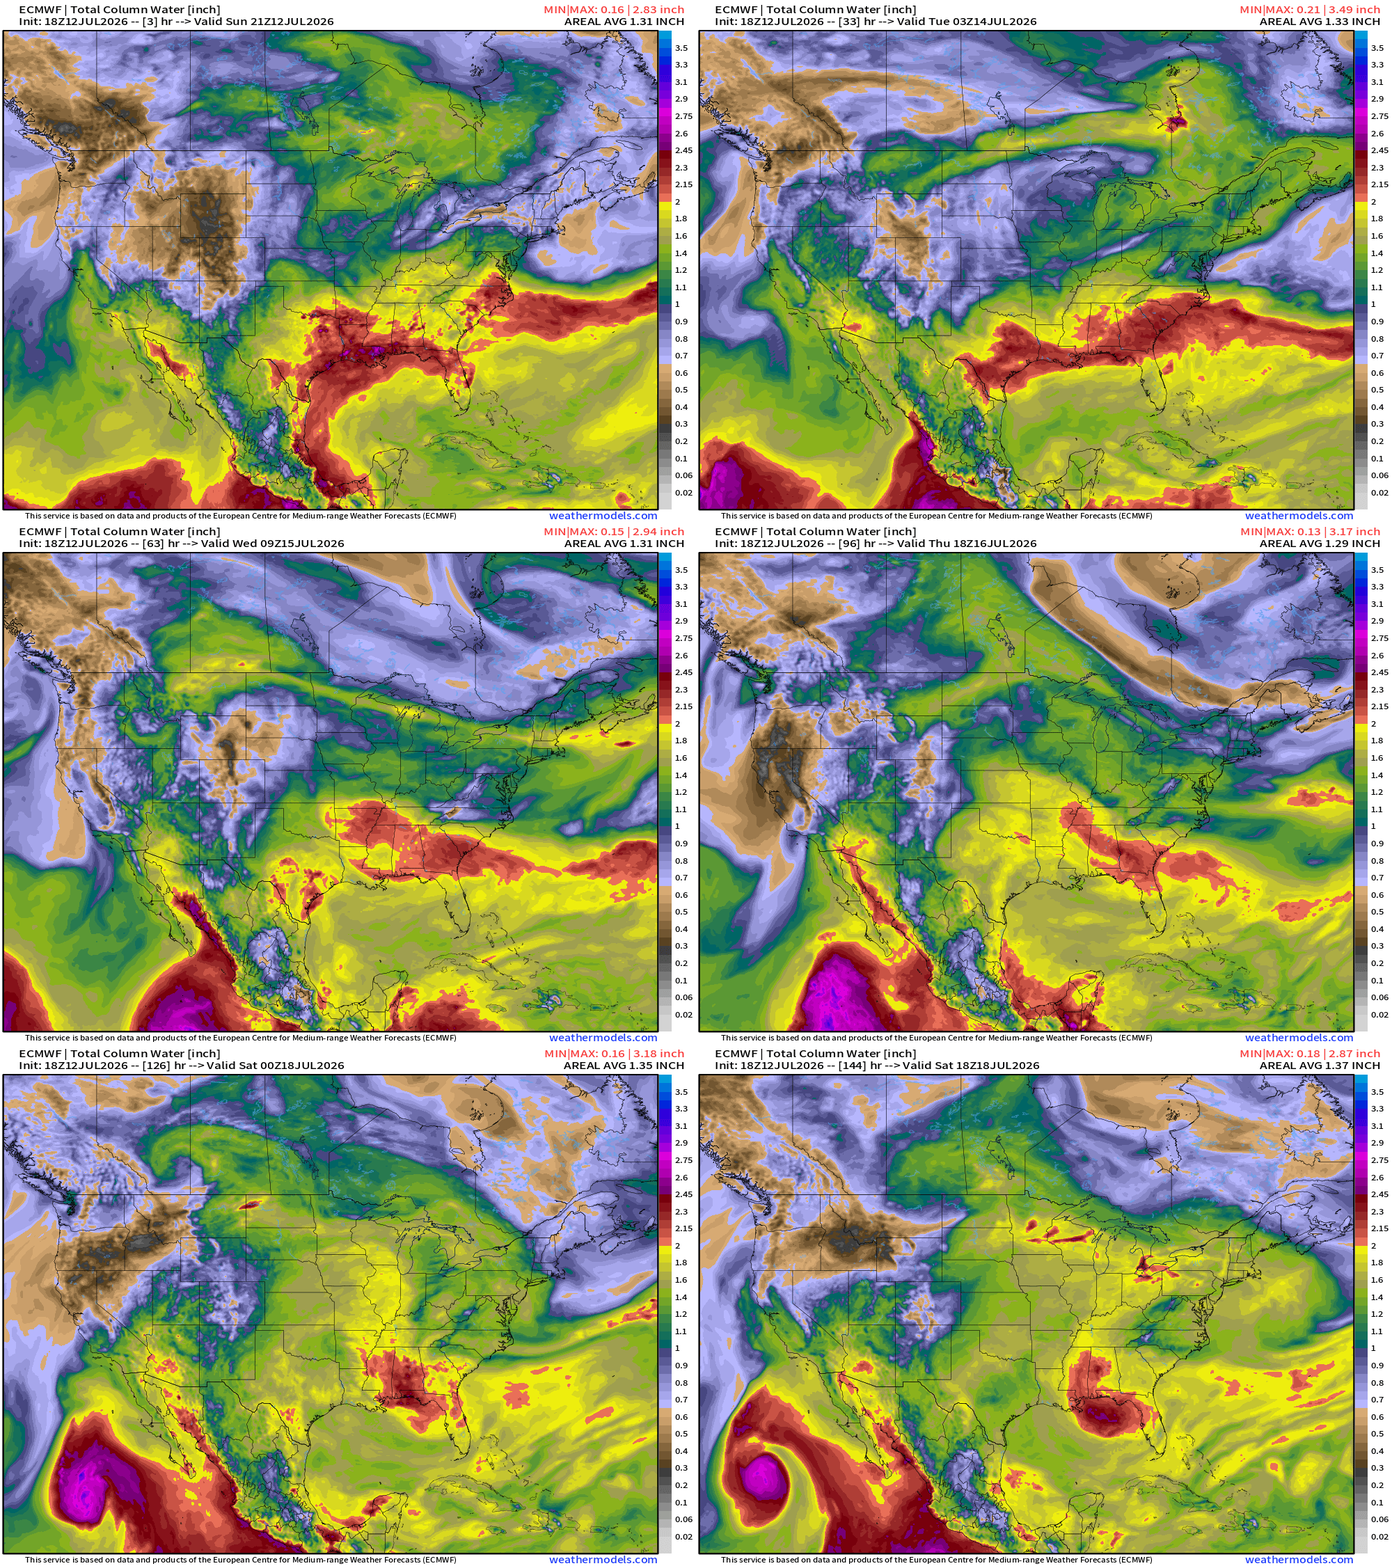
PWAT variable shows the formation of a stationary frontal boundary with heavy moisture content across the Gulf coast from Texas into Florida — and that will be the focus for continued clouds and heavy rain keeping temperatures mild.
Temperature Analysis | RTMA | 9:45 PM ET
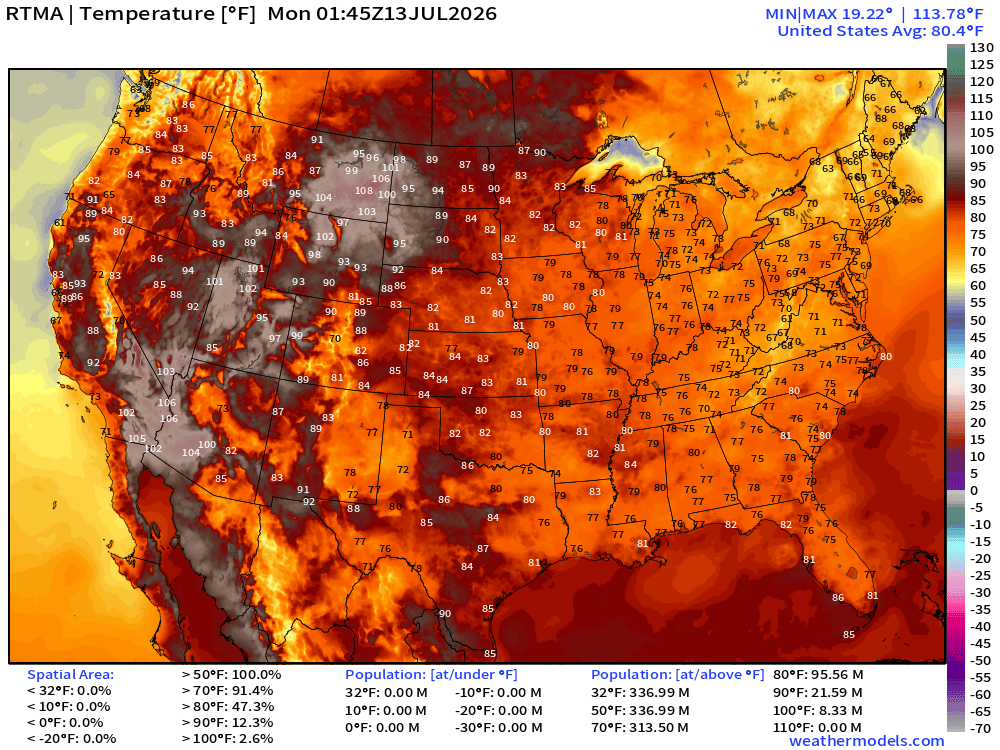
Still in the 100-110°F across Wyoming and Montana. Unbelievable heat dome
Temperature Anomaly | RTMA | 9:45 PM ET
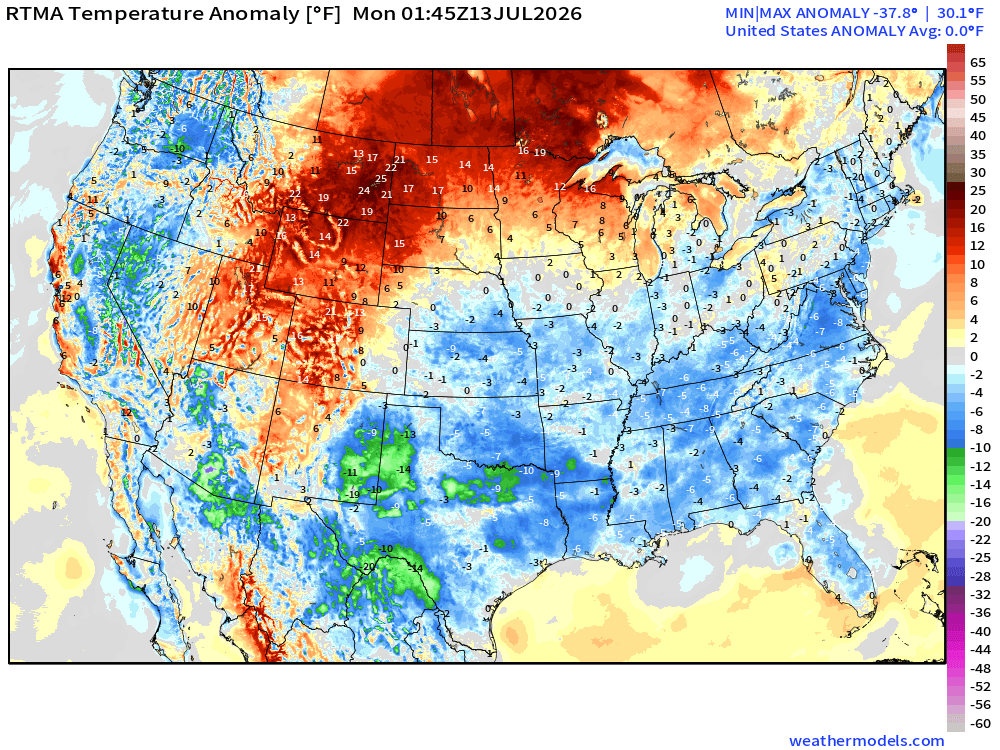
Lower 48 was normal 0.0°F — the heat dome is creating wet/cloudy conditions on the underside and canceling out the temperature
High Temperatures Next 8-days — until Tuesday, July 21st
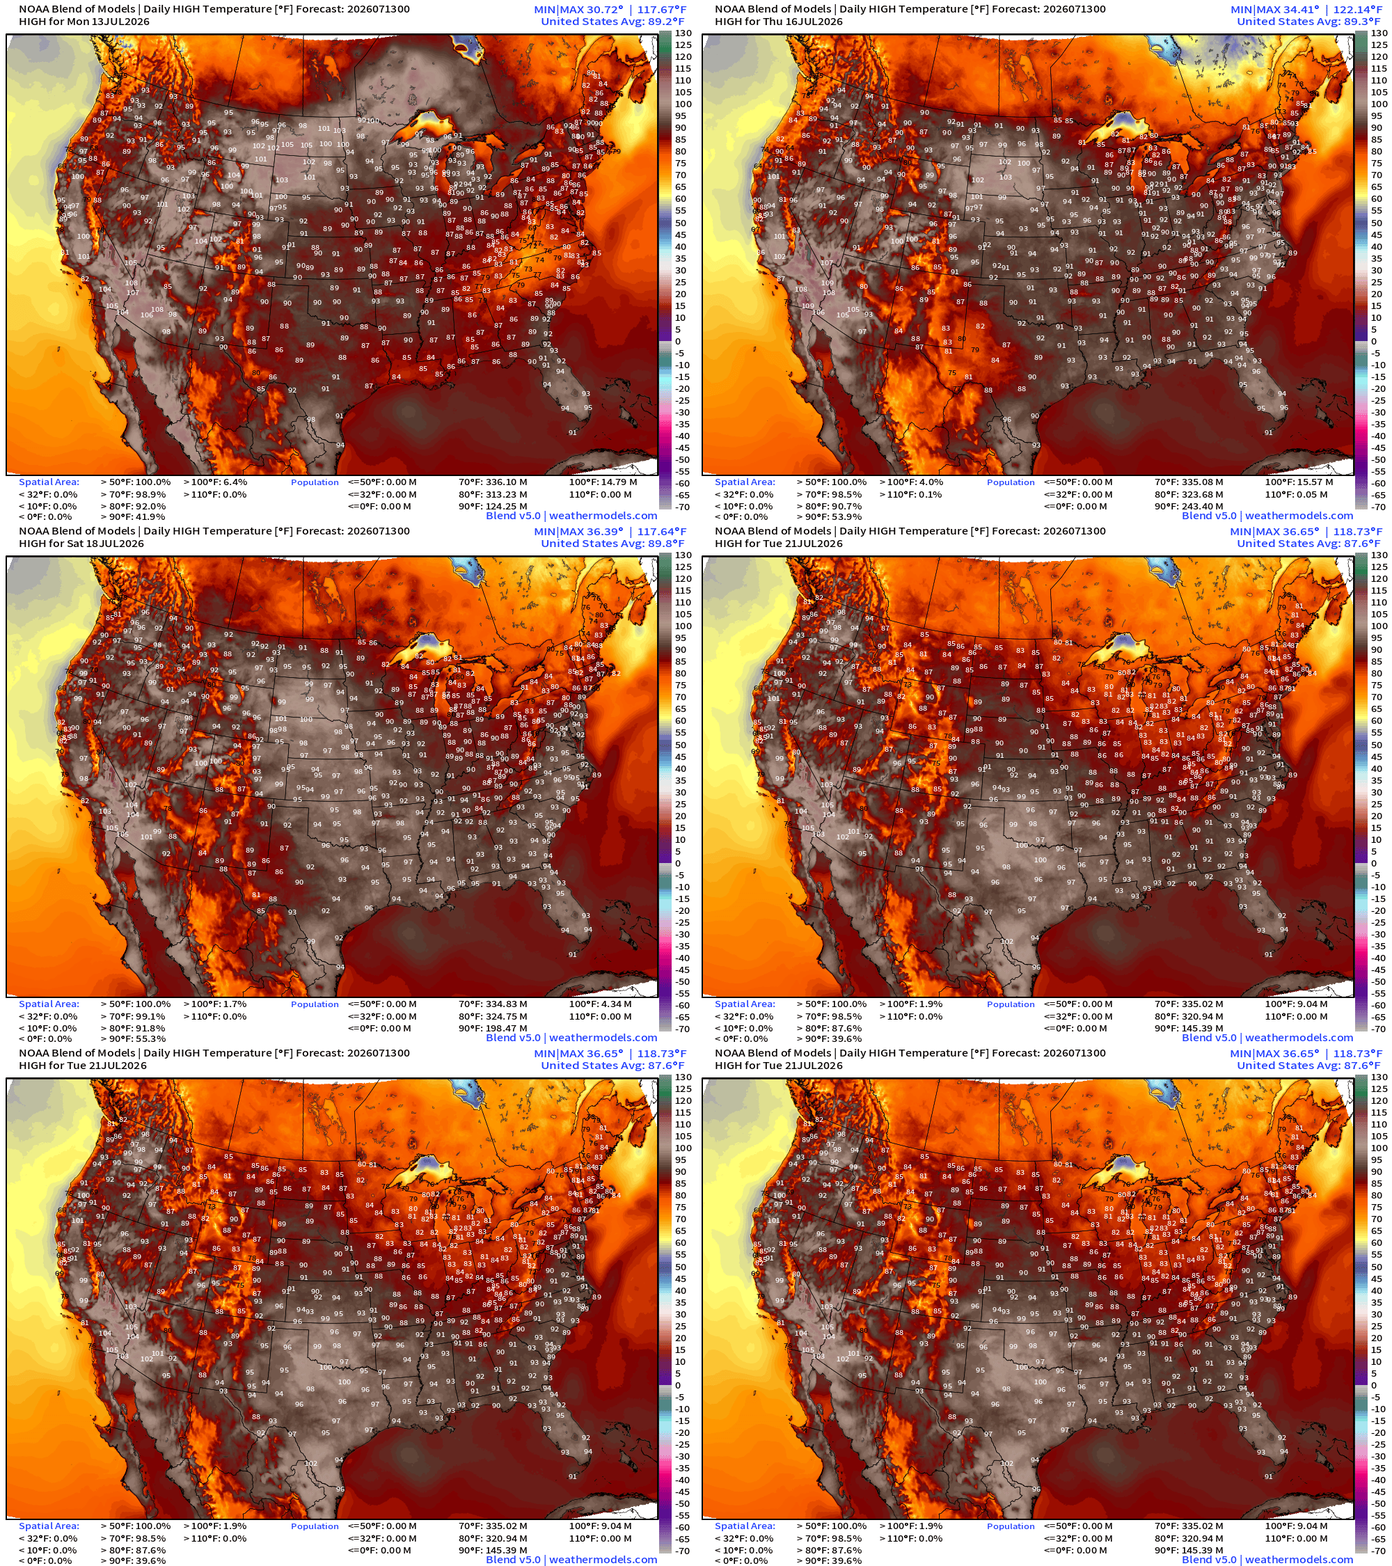
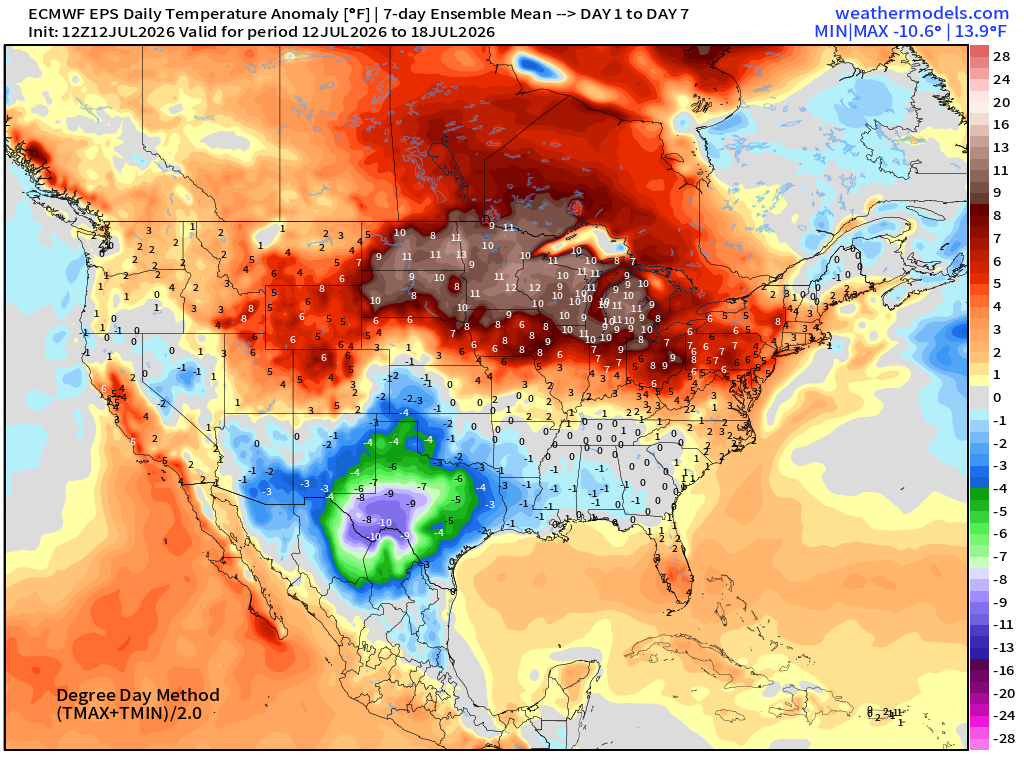
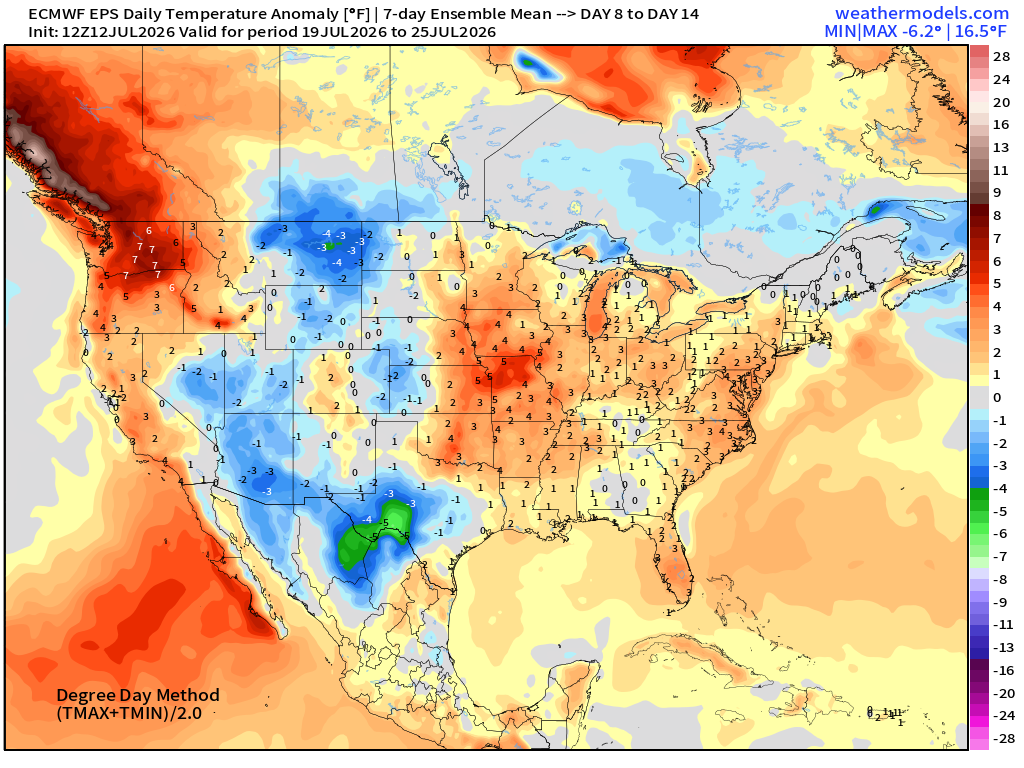
ECMWF Flagship Ensemble Mean Temperature Anomaly next 15-days
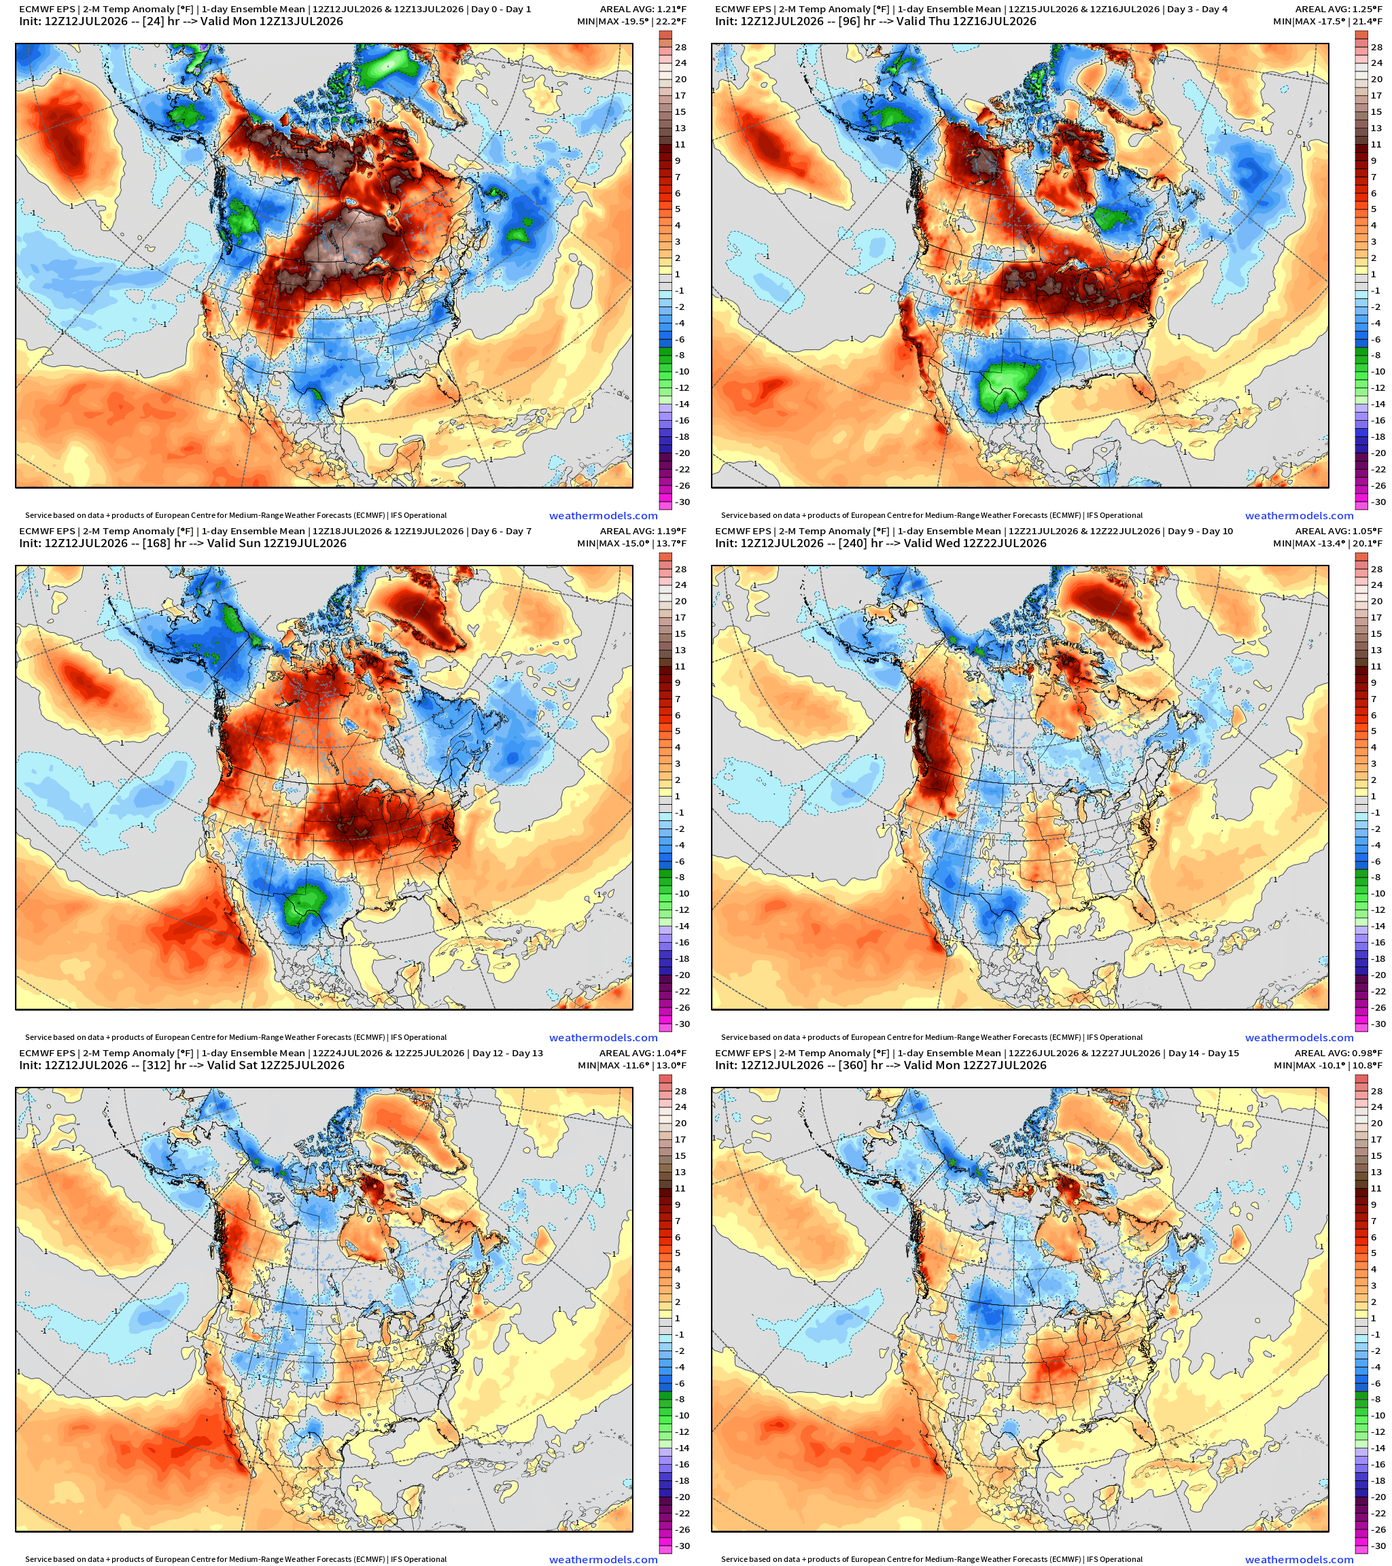
Mixed temperature signals into week 2 after the heat dome breaks down.
Week 1 —> July 12 to July 18
Week 2 —> July 19 to July 25
Atlantic Tropics
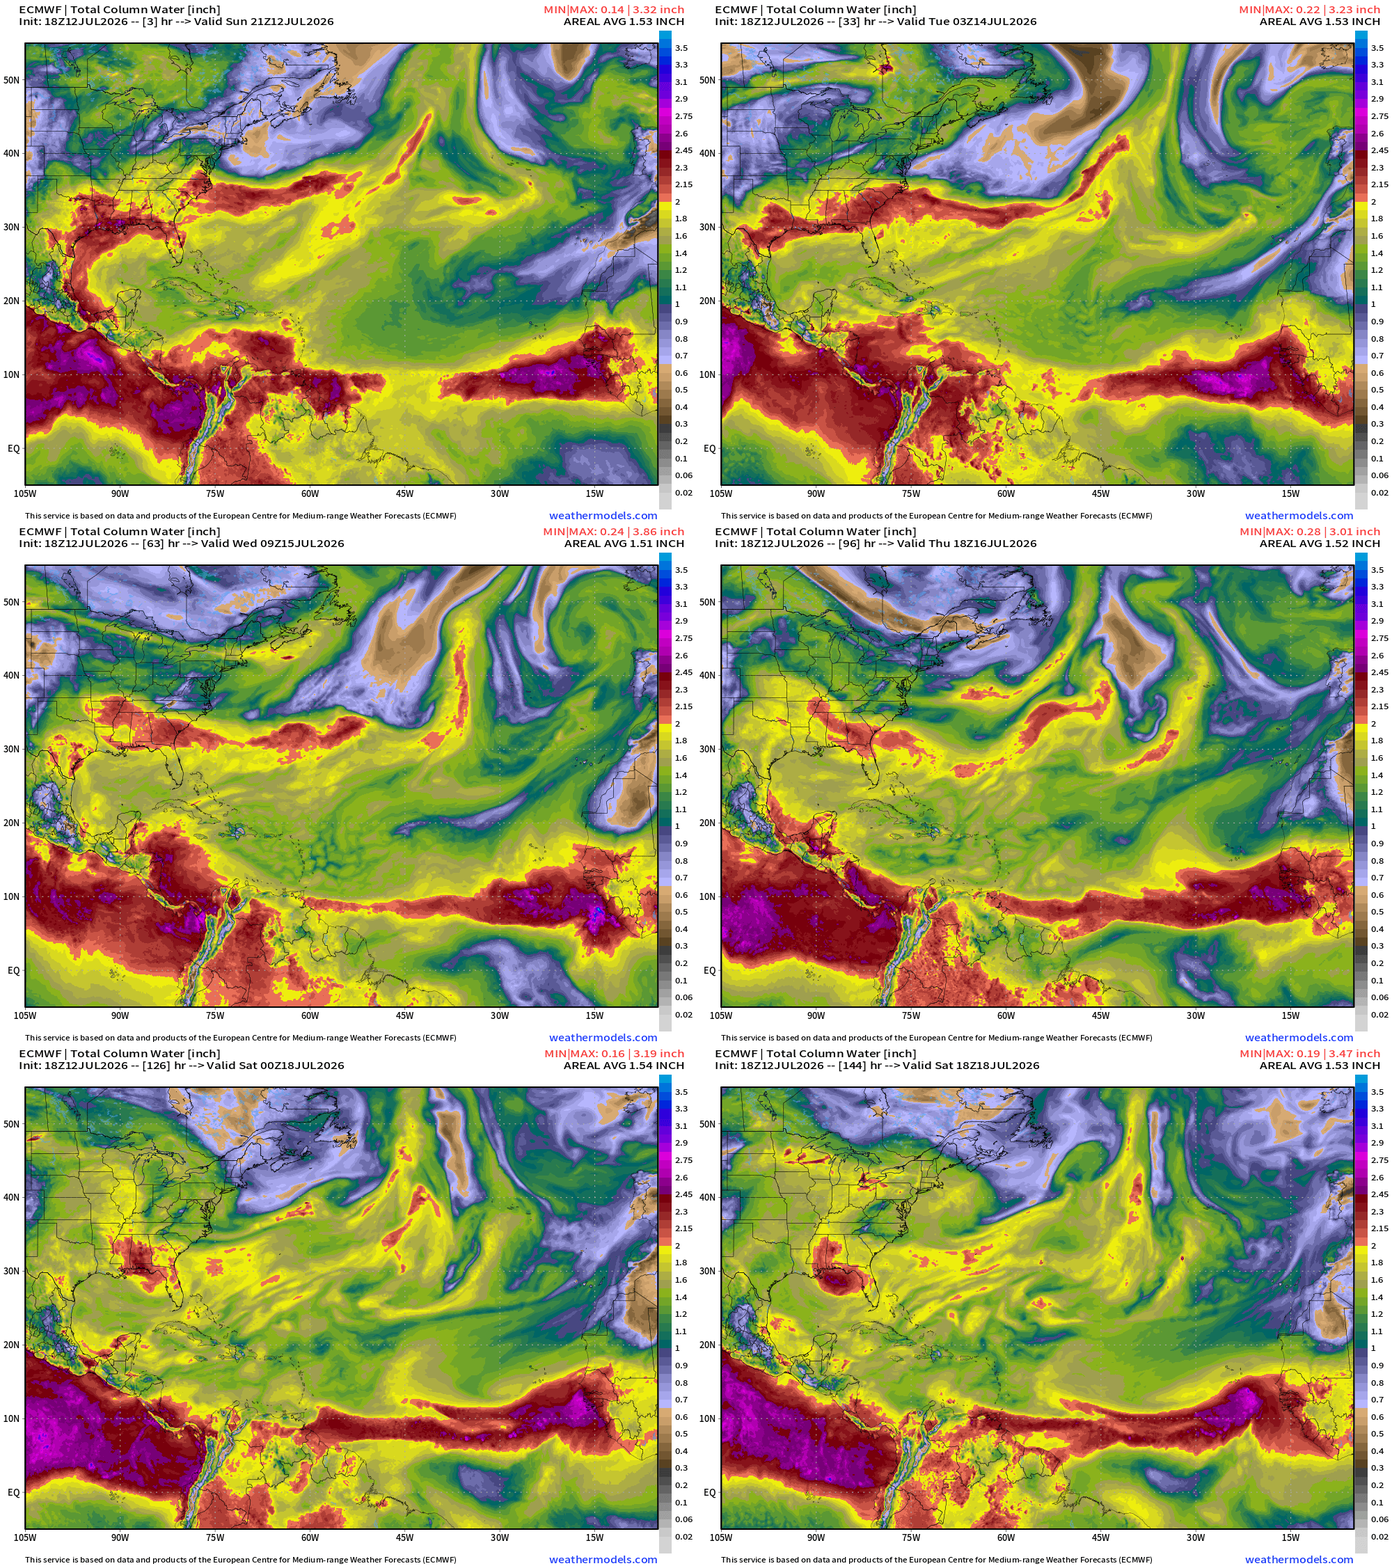
Full physics ensembles (12z) show a small signal in the northern Gulf of Mexico, but it’s likely to come alive with the AIFS catching onto the signal.
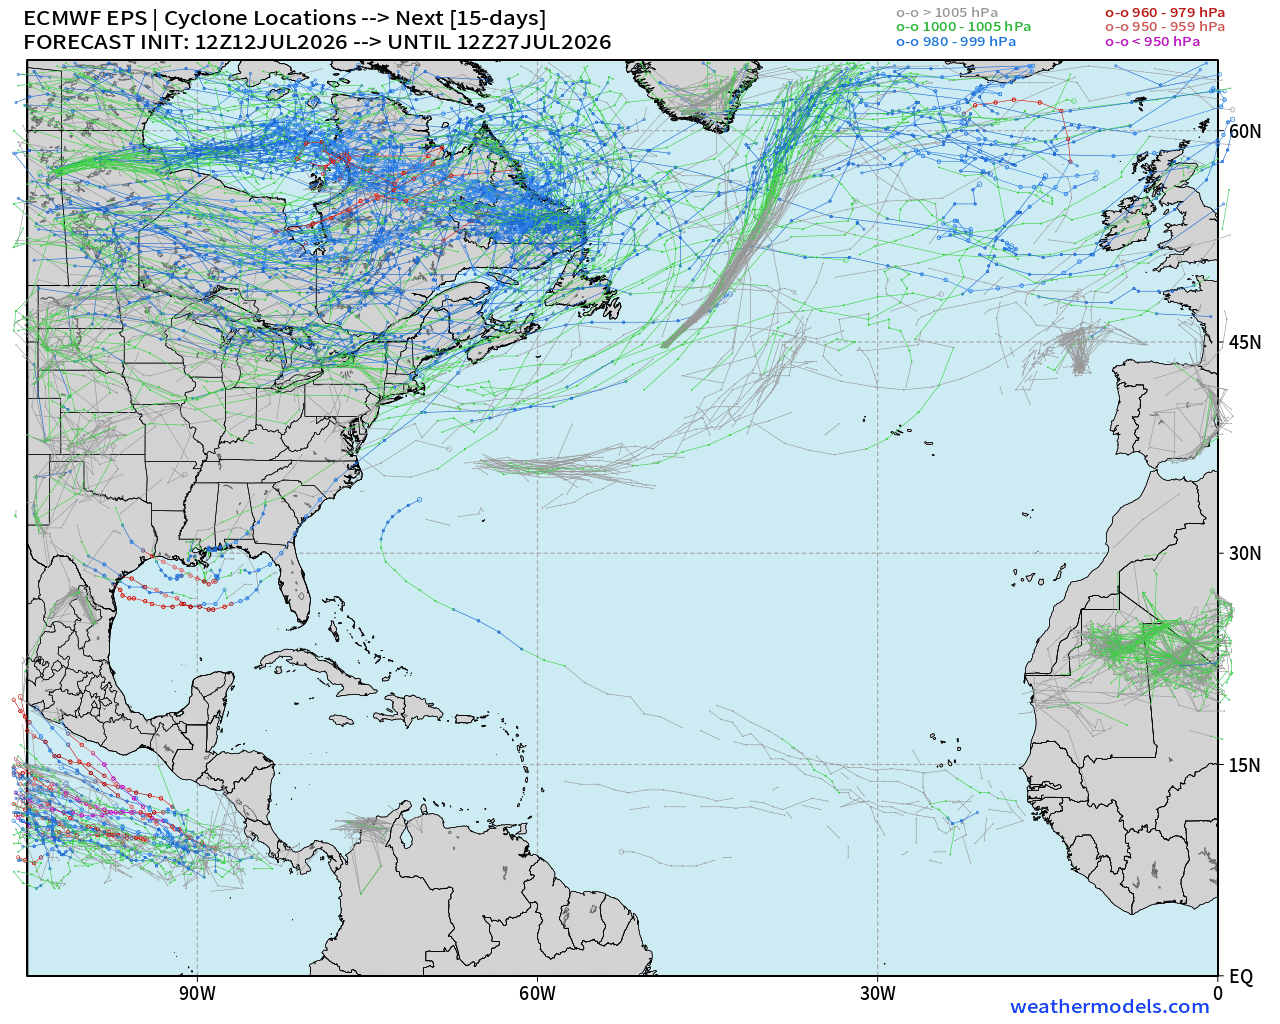
More — a lot more members with the AIFS-ENS at 18z with “Bertha”
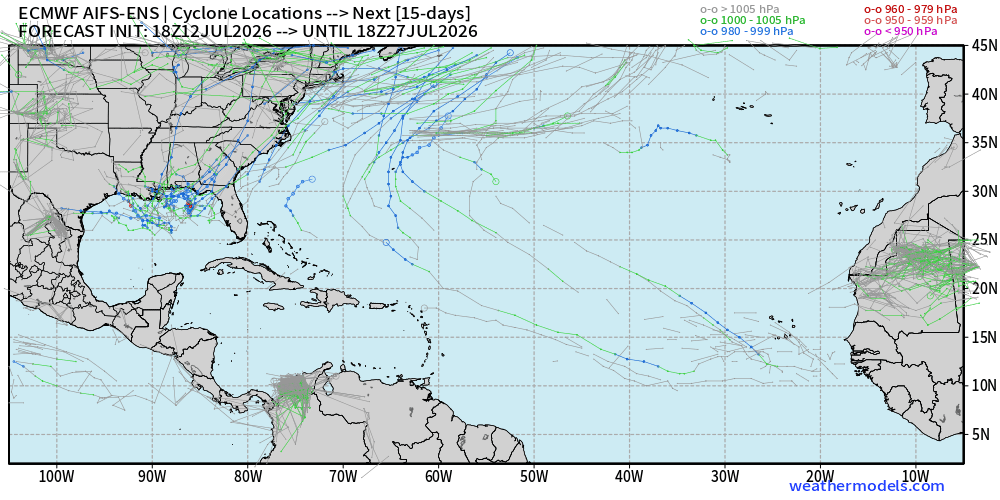
Still a few days before we can be sure about the formation of Bertha near the U.S. coastline — so we’ll keep watching, not much other choice!
NASA GEOS-5 Dust Forecast Next 10-days
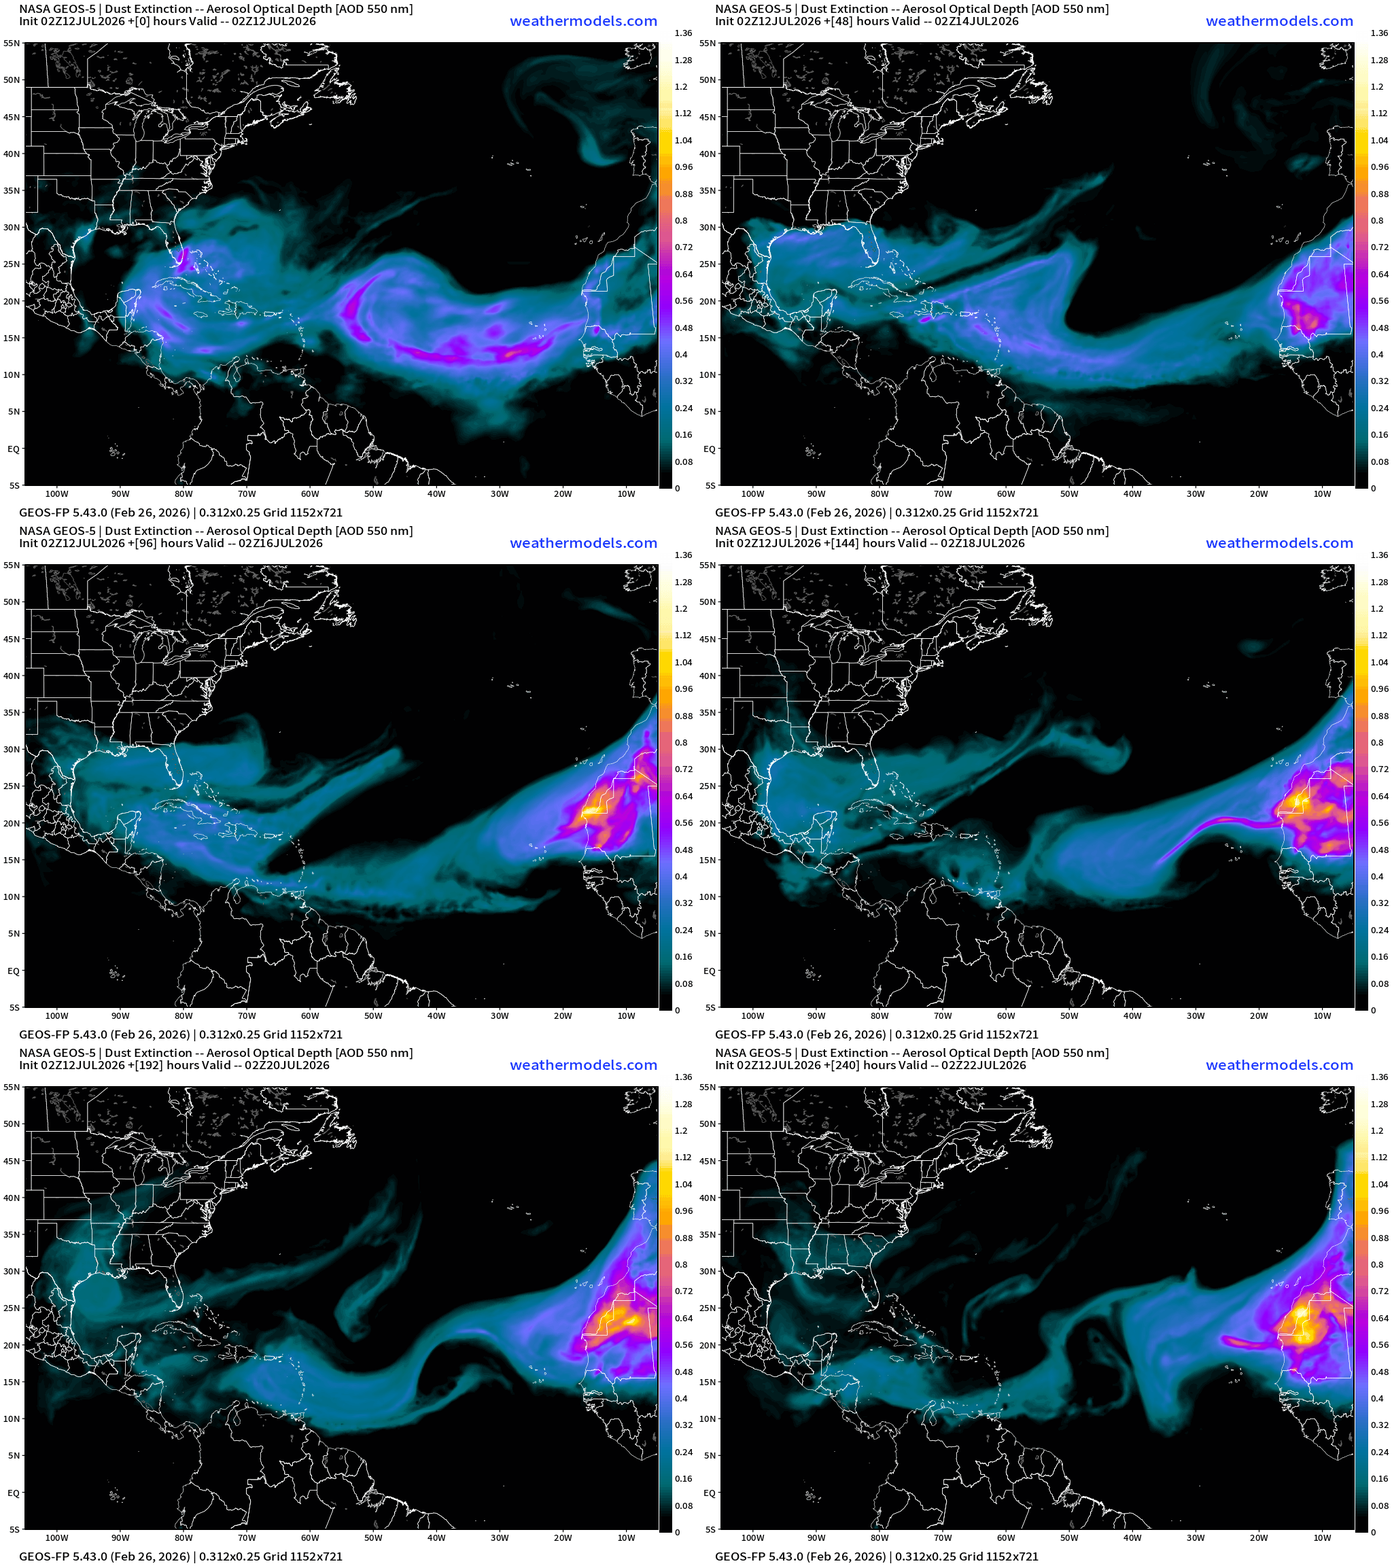
Like a dragon breathing fire off the African continent across the Atlantic — the entire basin along 15°N to 25°N will be very dusty and under control of Saharan Air Layer origin air mass.
Eastern Pacific Tropics
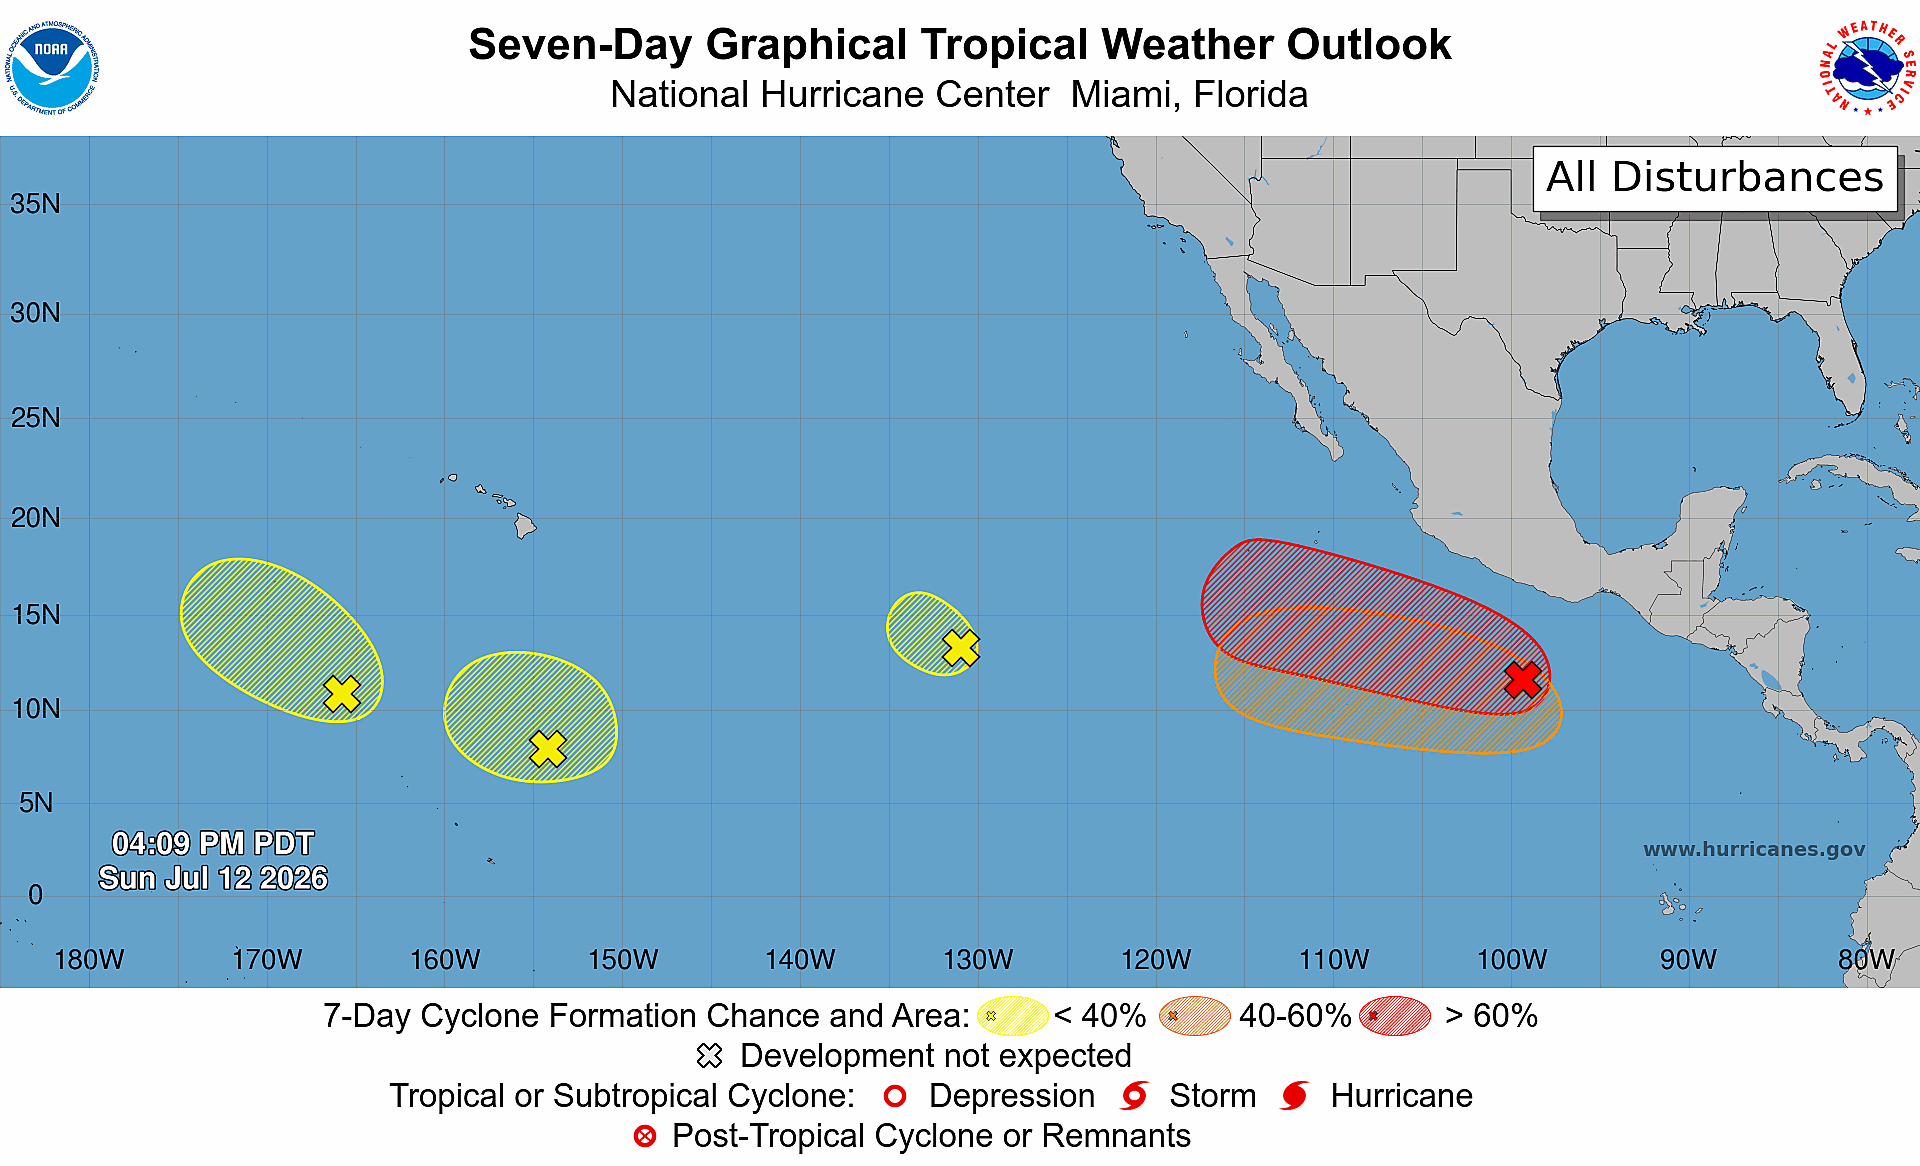
1 Moderate + 1 High Chance of development … other lemon drops are too weak, but they could spin up at any time … busy ITCZ/monsoon trough out in the EPAC!
Thank you for reaching the end of this post! Hopefully you enjoyed the beautiful weather maps. Please help increase the visibility of Weather Trader on Substack: Share or Like!
Please also use our constellation of other sites … growing.
Maps sourced from weathermodels.com designed and innovated by yours truly! Please subscribe there for real-time access to the newest maps, charts from all of the weather models including ECMWF and AIFS, and NOAA GFS/GEFS, HRRR/RRFS and Blend of Models (NBM). NOAA WPC and SPC for fronts/convective outlooks.
Our own content is now sourced from hottestsince.com
My Atlantic Hurricane Season Forecast (2026)
From April 7, 2026: Atlantic Seasonal Hurricane Forecast: (11/5/2)
9-13 Named Storms (11 most likely)
4-7 Hurricanes (5 or 6 most likely)
1-3 Major Hurricanes (2 most likely)
Accumulated Cyclone Energy: 75-85 (well below normal)
NOAA 2026 Atlantic Hurricane Season Forecast
- Milepost
- 978 · laid 2026-07-13T02:36:25.404000Z
- Source
- https://weather.substack.com/p/july-12-2026-sunday-summer-weather
- Digest
- 9364c36201ca2c3455afc5b86d177391c3462ede68b09d8261144de4c4fa2760
- Machine
- JSON