July 8, 2026 Wednesday Summer Weather
Heat dome builds across the Rockies and Midwest but large population centers miss out on extreme heat into mid-July
July 2026 was the warmest July in the 132-year national record (1895–2026), at 76.9°F against a 1991–2020 normal of 74.4°F (+2.5°F).
July 2026 was the 26th-driest July in the 132-year national record (1895–2026), at 2.5in against a 1991–2020 normal of 2.9in (-0.3in).
NOAA/NCEI Climate at a Glance, contiguous United States. This is the observed record for the month, not a score of anything said in this piece — the forecast ledger begins 2026-08-17 and cannot reach earlier posts.

Scattered convective clusters but rather quiet for early July
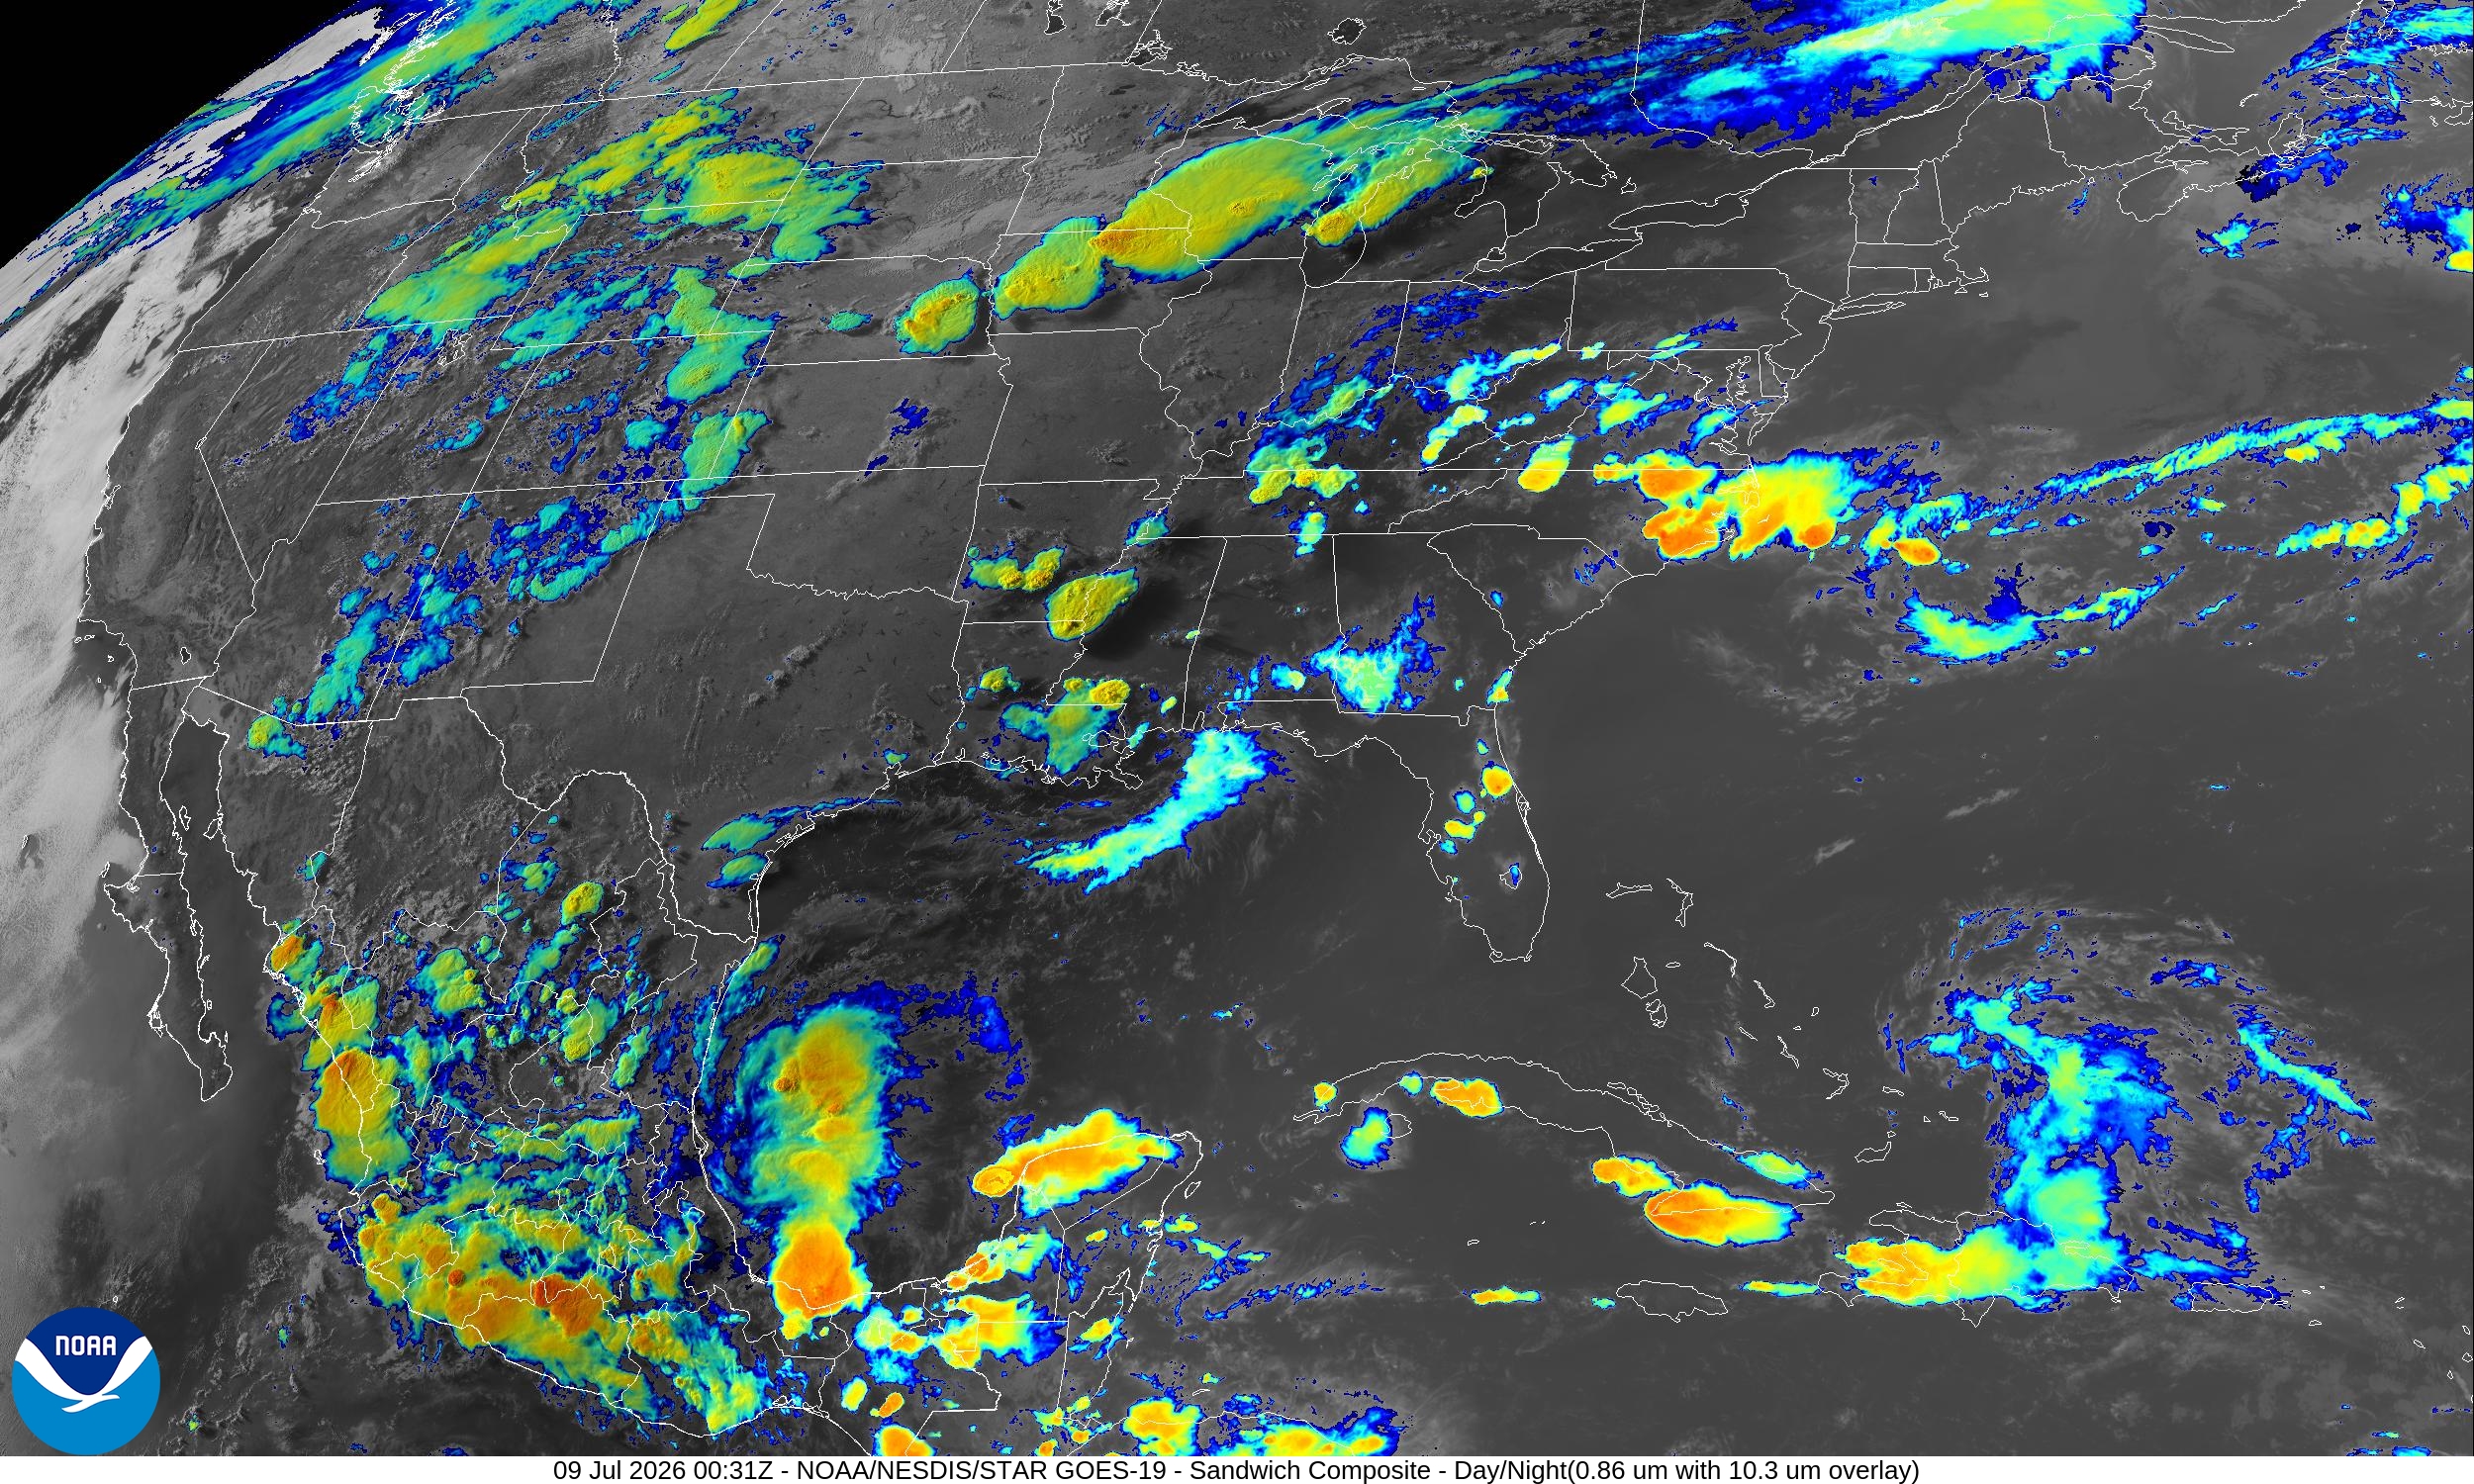
Top story next several days: a heat dome forms out of the Rockies and intensifies into the Midwest and Great Lakes. However, the circulation around it will mean moisture and easterly flow across the Gulf Coast into Texas —> cloudy and wet.
The hottest and driest conditions will be in Montana and the Dakotas into next week. Temperatures over 110°F to near the Canadian Border.
Weather Trader is entirely reader-supported publication (no ads). To receive all new posts and support our work, consider becoming a free or paid subscriber. ALL CONTENT is original (human — Dr. Ryan) and not A.I. although your subscription (a Starbucks each month) subsidizes Claude Max+ and unlocks my creativity (Hottest Since + Coldest Since) on top of Weather Map Maker and Weather Trader fed by Weather Zarr. I know what I’m doing with weather data, but always needed a developer to fill in the gaps in my skill stack. Not anymore!
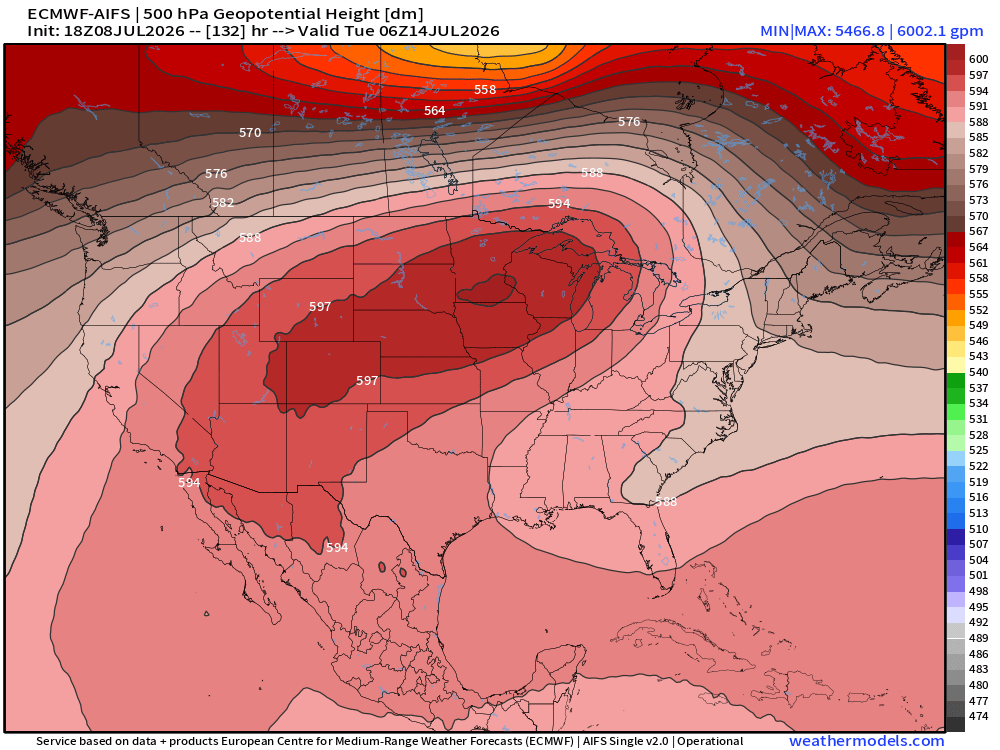
We almost lost the 6000 meter Heights at 500 mb — 6002 meters (close enough) into early Tuesday. The ridge intensity is trending weaker.
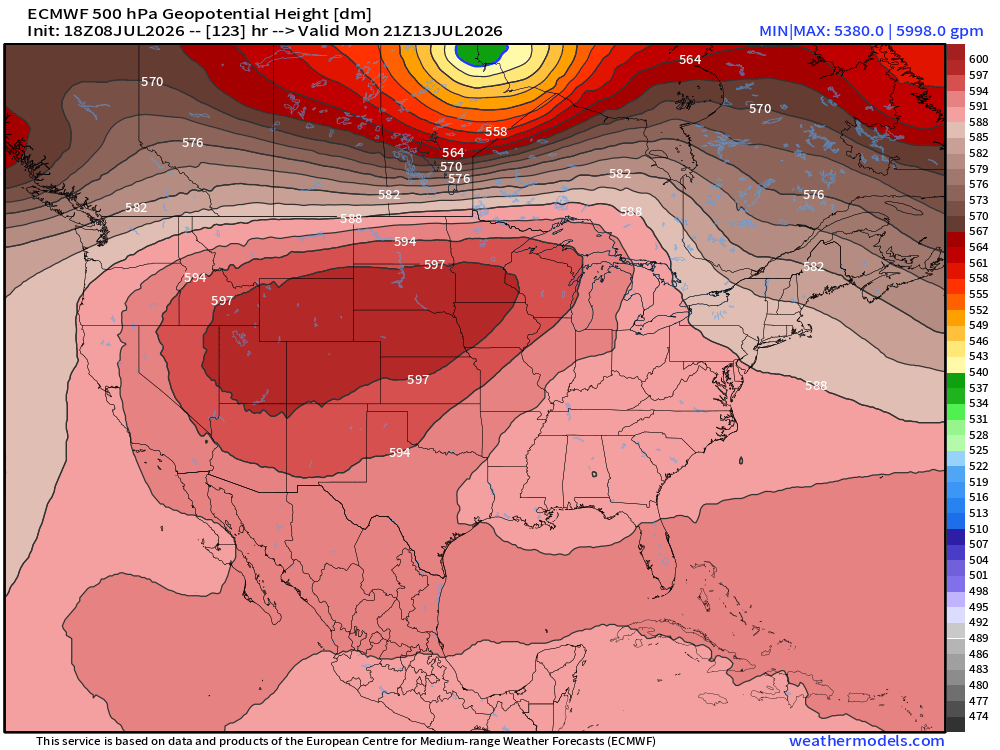
Normally when you’d see 600 dm, it’d be a major panic for potential record high temperatures. But in Mid-July, it’s normally quite hot, and setting any records is difficult with 150-years of American weather history books full of seemingly unbreakable temperature records.
Temperature Anomaly Monday Highs — concentrated 20°F+ above normal in Montana with smattering of blue (below normal) in the Ohio River Valley and Mid-Atlantic with easterly return flow.
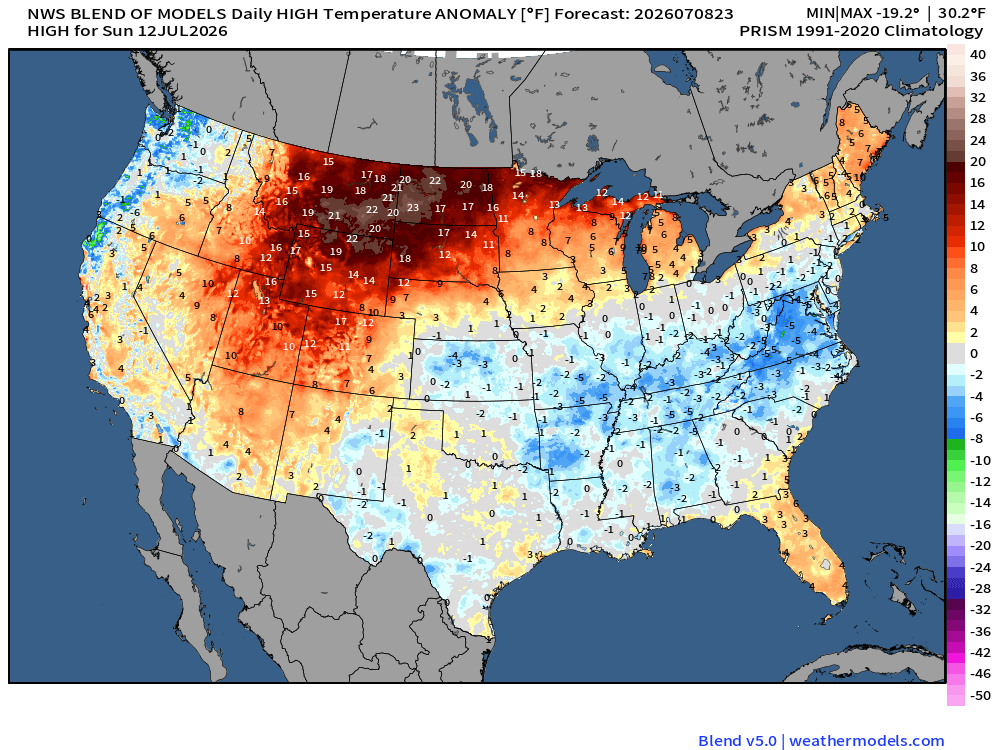
Blend of Models — Ensemble Mean High Temperatures for Sunday July 12
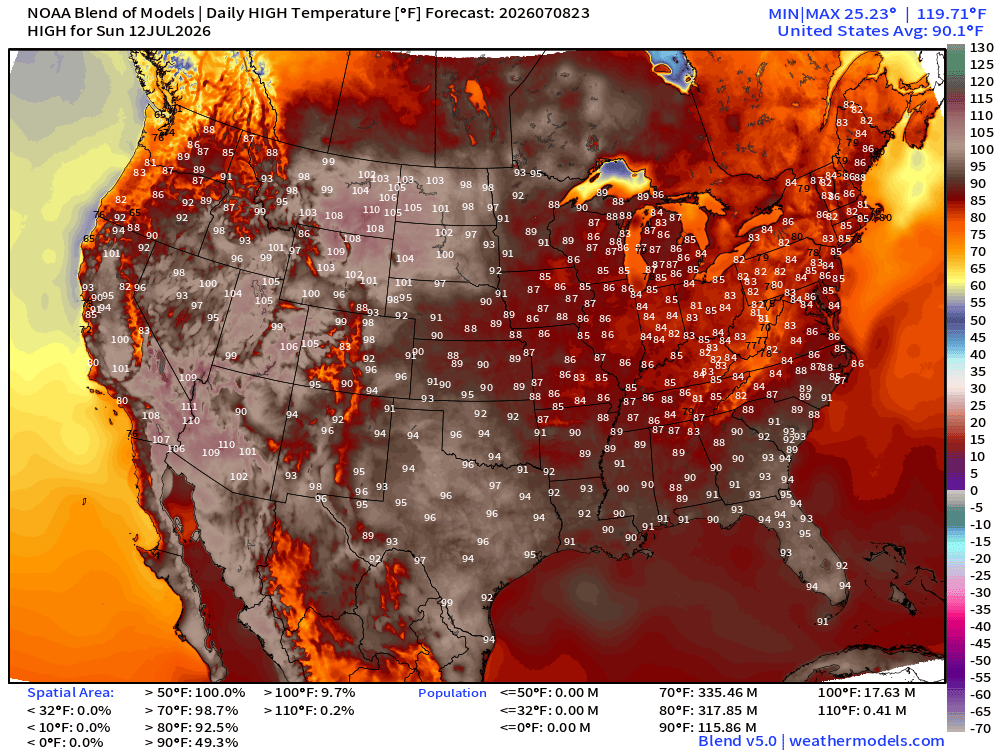
The Lower 48 high at 90.1°F but quite manageable 116 million population at least 90°F but only 18 million at least 100°F
This won’t be remotely on same level of the extreme heat we just experienced across the Mid-Atlantic and Northeast for the past week.
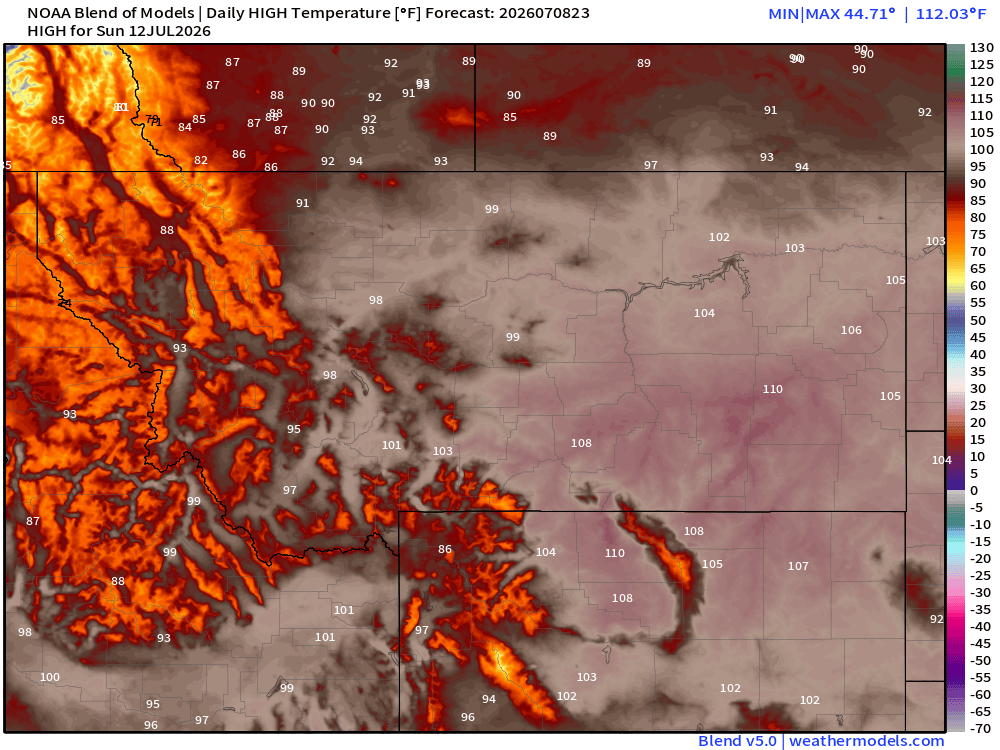
Hottest in Montana at 112°F
Upper-Level Height Anomaly | AIFS-Single Next 10-days
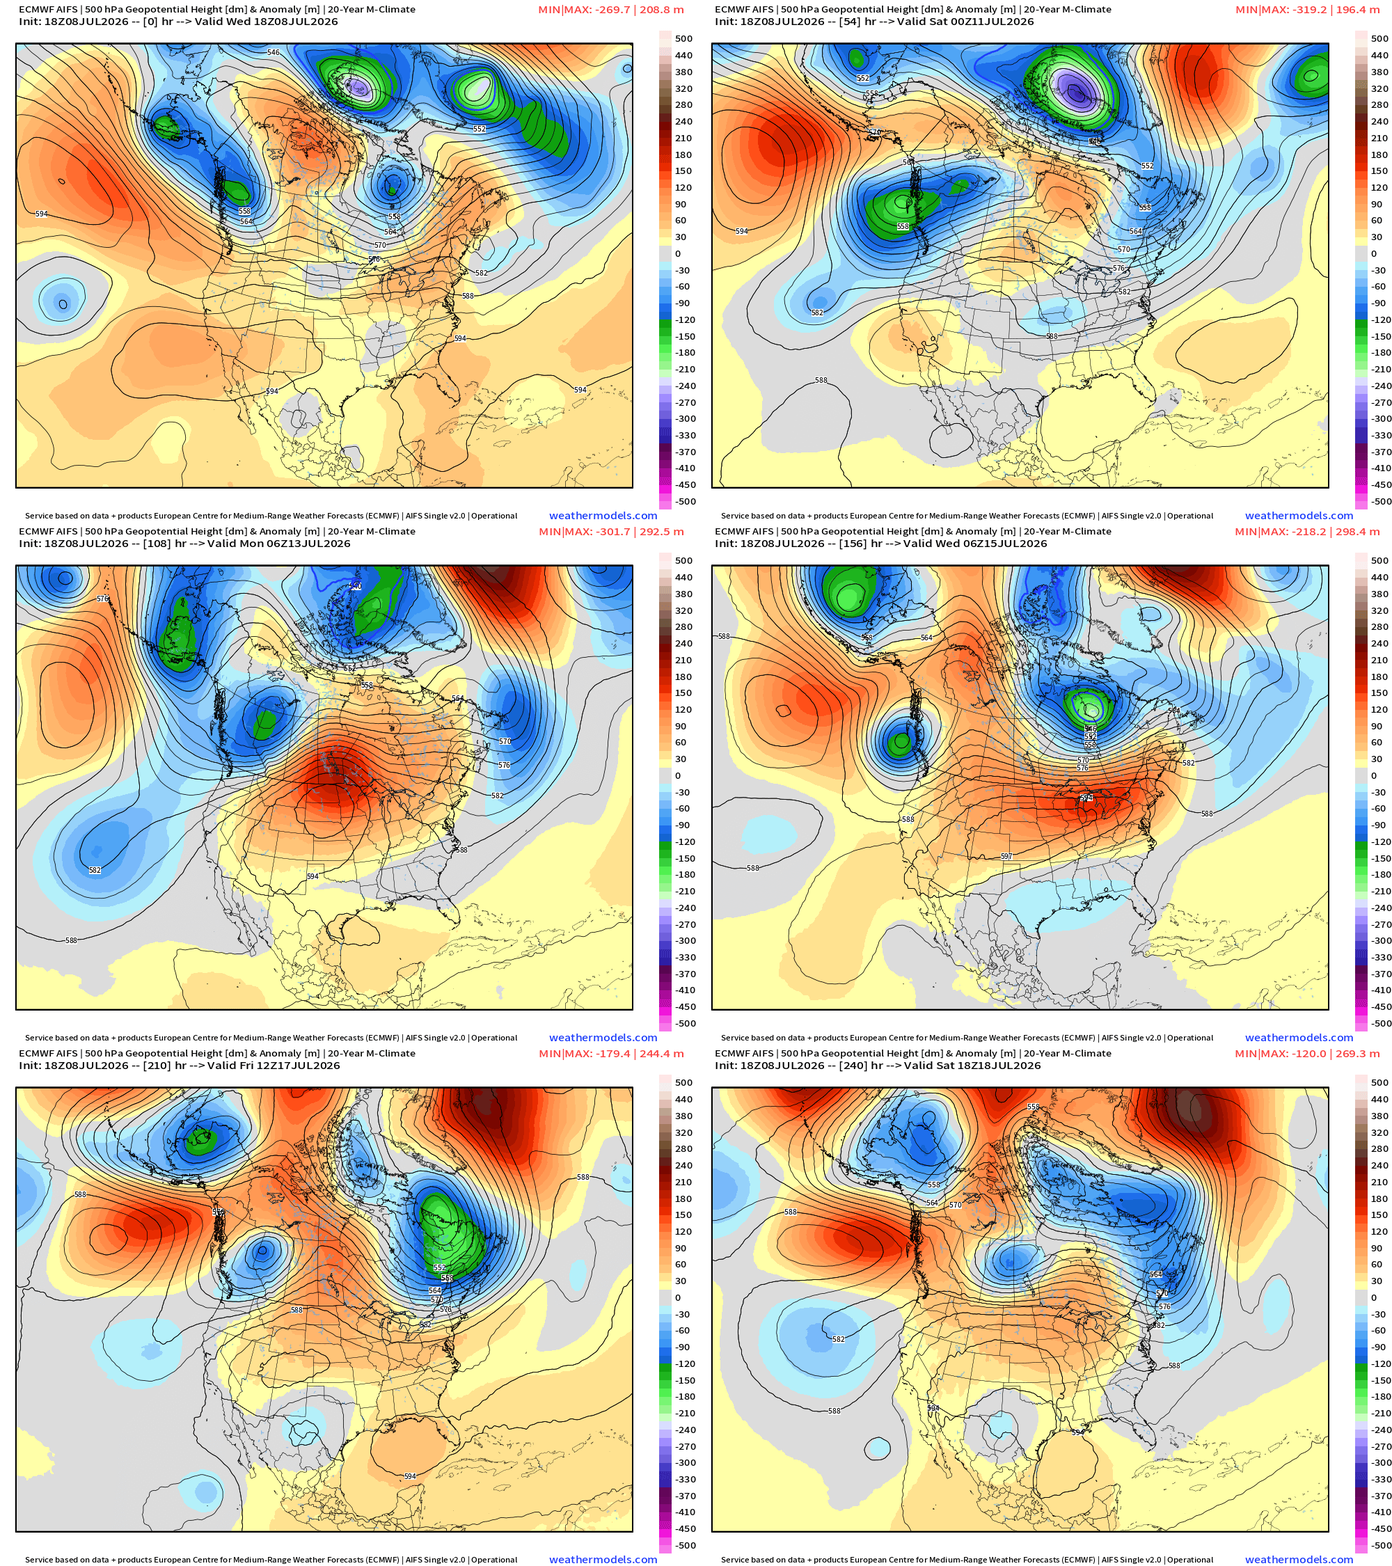
The impressive central U.S. ridge forms this weekend downstream of a series of digging troughs out of the Gulf of Alaska and Pacific Northwest.
The origin of the 500 mb high is probably best described as the subtropical eastern Pacific and across the U.S. Southwest.
Also, note the troughs digging into the Northeast into Days 7-10 —> back to the cooler/unsettled pattern for mid-July!
Into Summer —> Height Anomalies don’t tell entire story … actual height does!
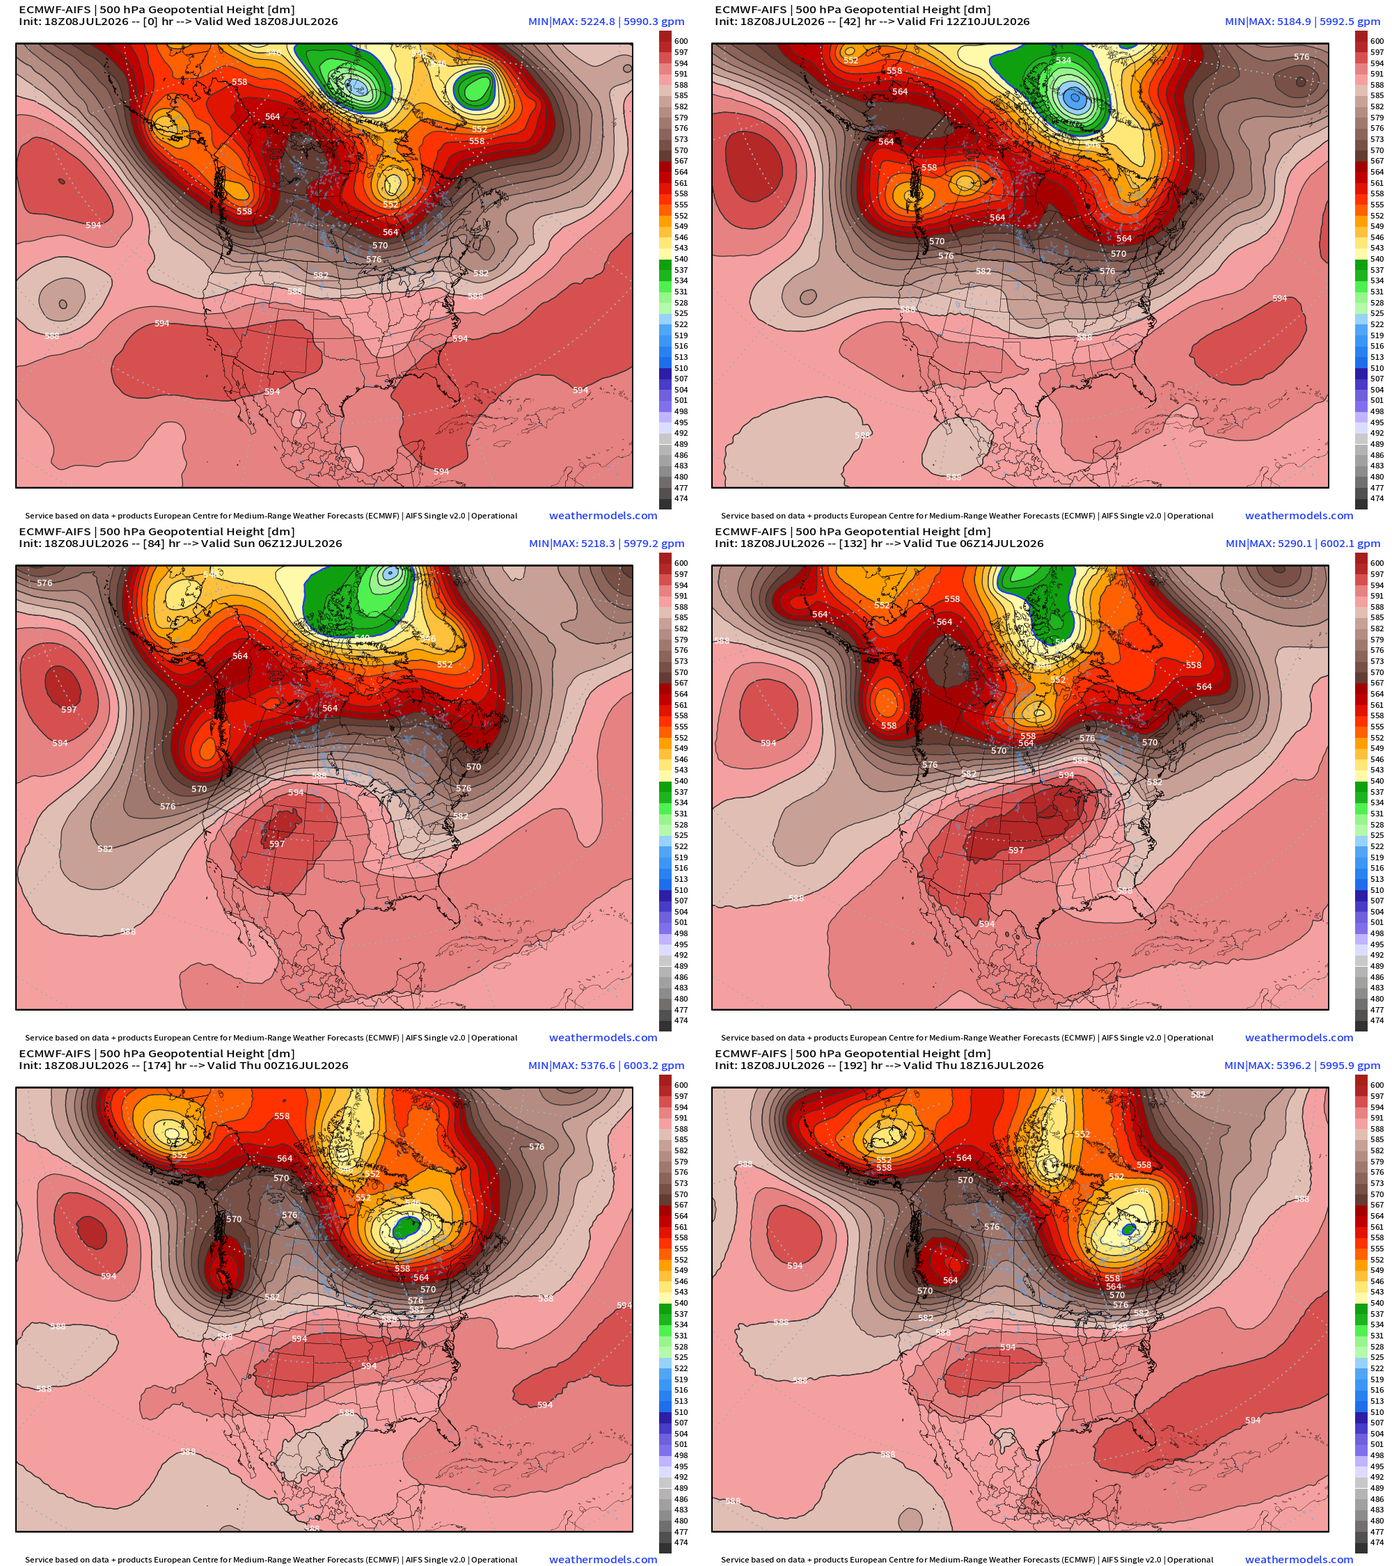
ECMWF AIFS — the ridge at 594 dm pushes out of the U.S. Southwest into the northern Plains and then Great Lakes reaching 600 dm in 5-days, but is squished / flattened by lower heights from Canada.
This gets us into middle July.
NWS Precipitation Next 72-hours —> Saturday Afternoon
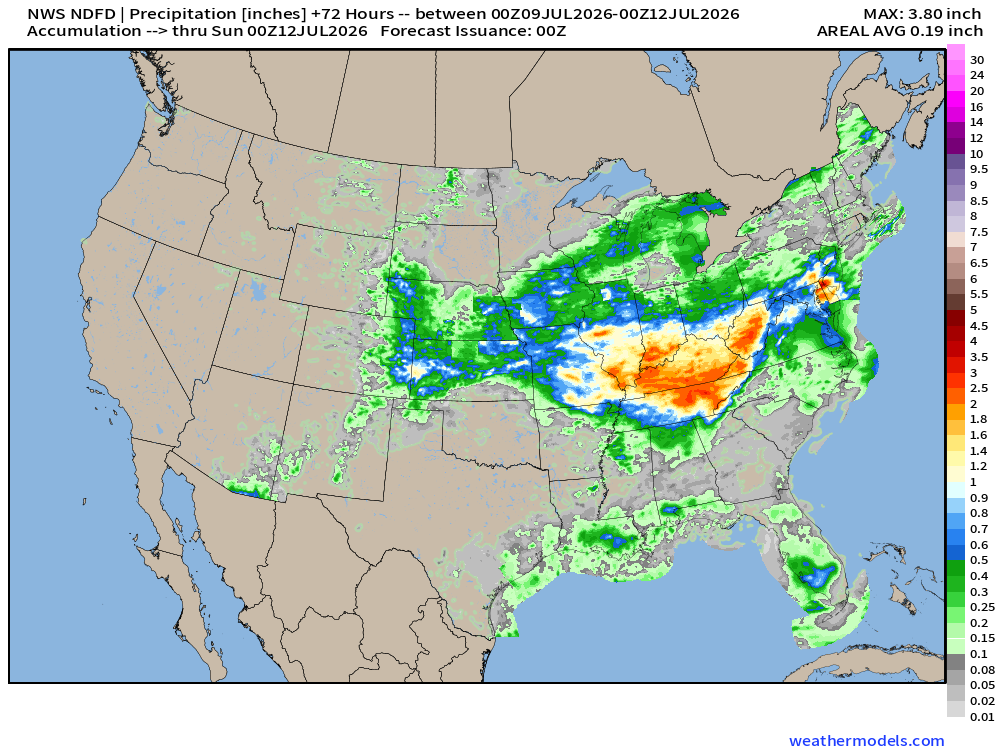
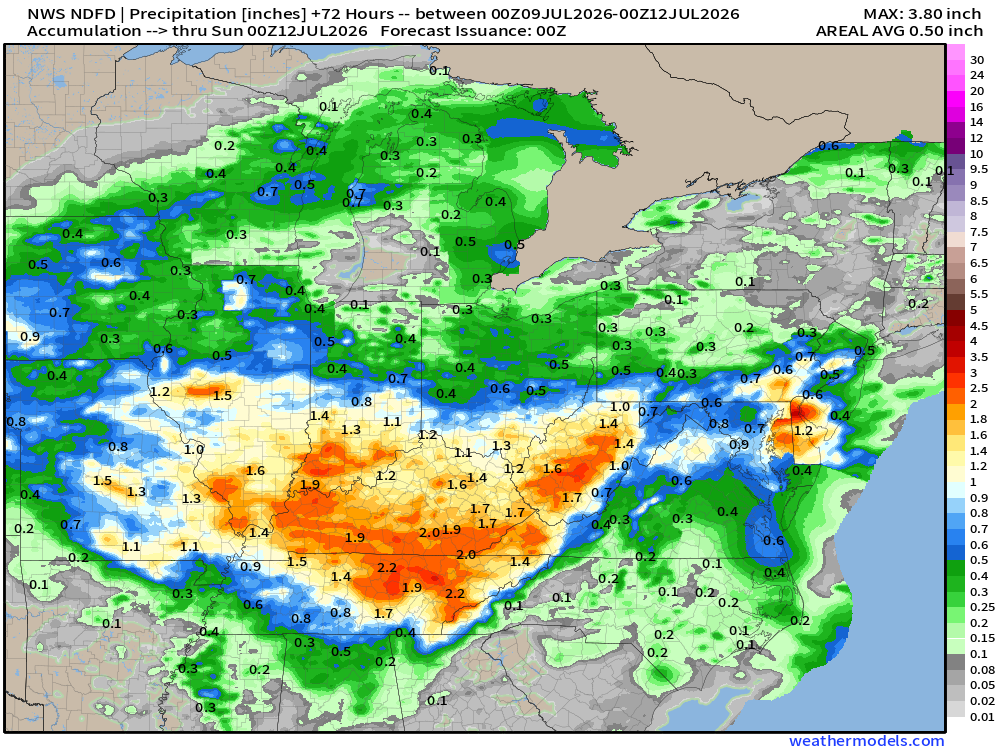
Heaviest rain centered on Ohio River Valley > 2”
My favorite parameter — next 48-hours of HRRR Precipitable Water
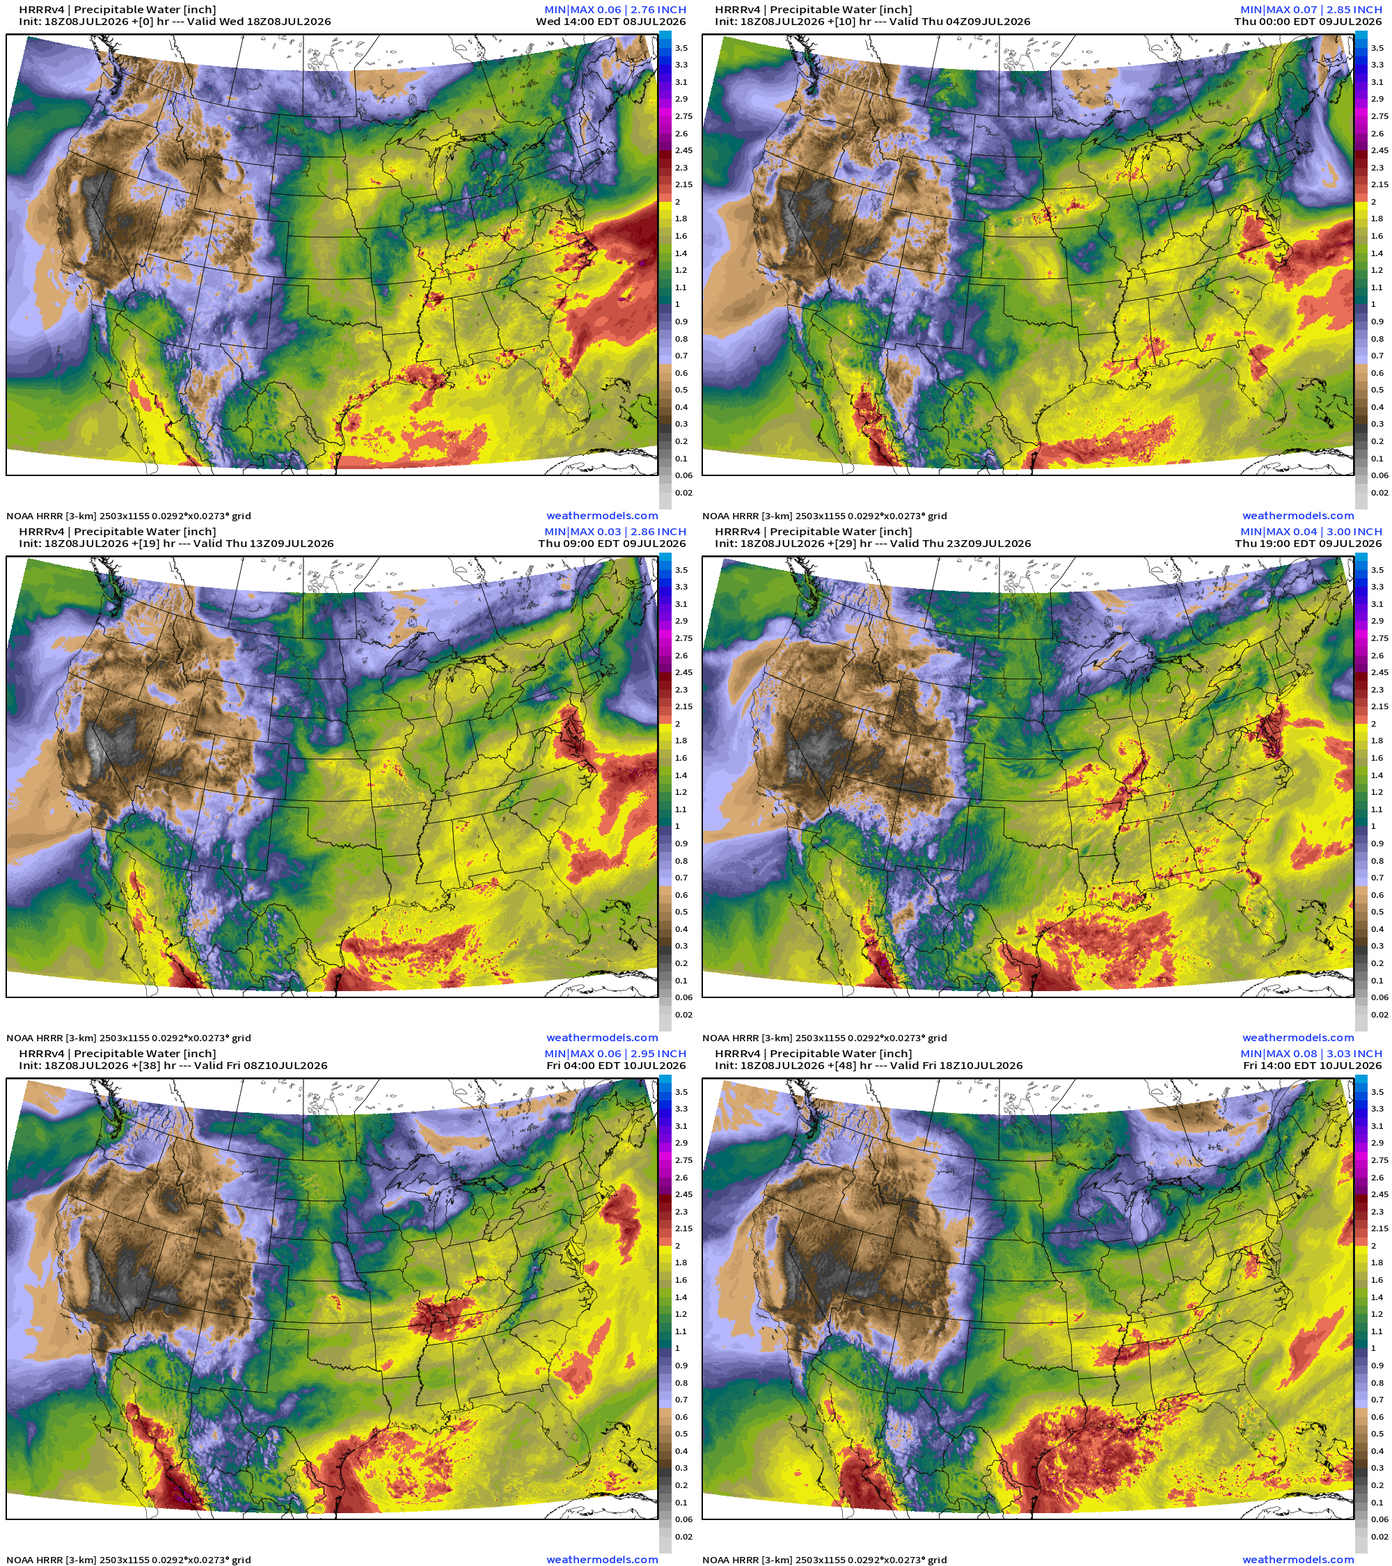
Plenty of moisture continuing to circulate and bubble up with the summer-time air mass across the Eastern U.S. to fire daytime thunderstorms with heavy downpours.
Weather Into Thursday Morning
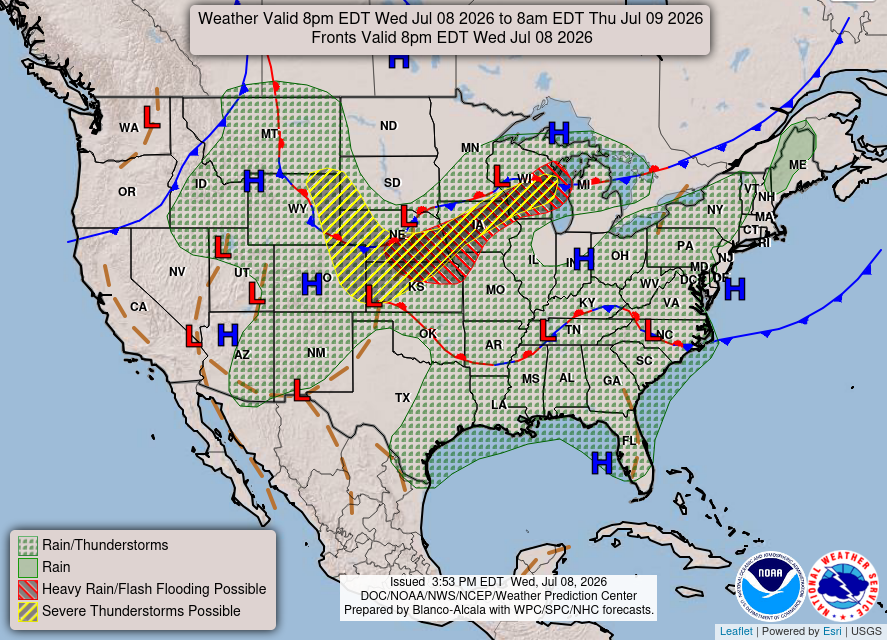
Storms firing along a frontal boundary stretching from Denver to Milwaukee
HRRR Next 48-hours simulated Radar through Friday 2 PM ET
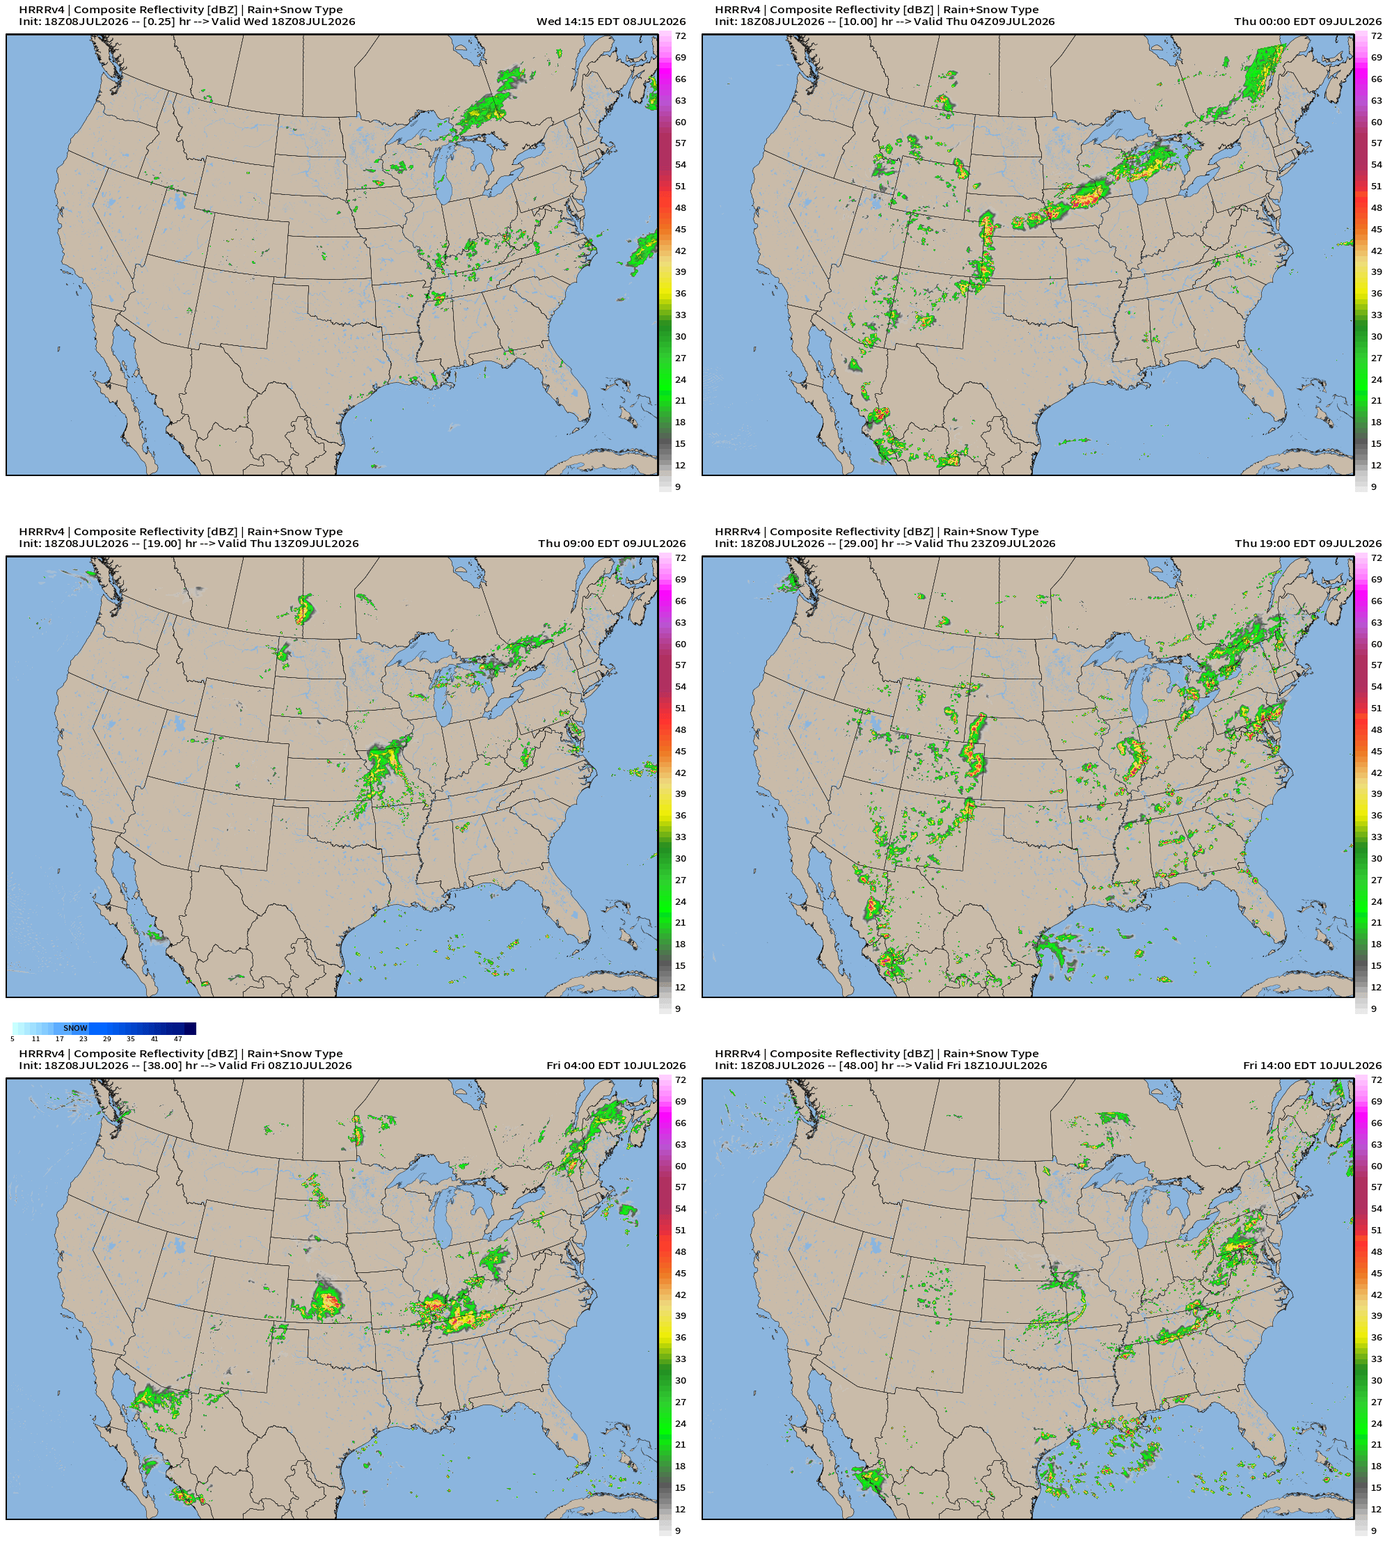
Scattered monsoon showers and storms across the Rockies — nice to see — but those will decrease into weekend with the ridge development.
Widely scattered daytime pop-up storms elsewhere with the most organized convection in the Ohio River Valley.
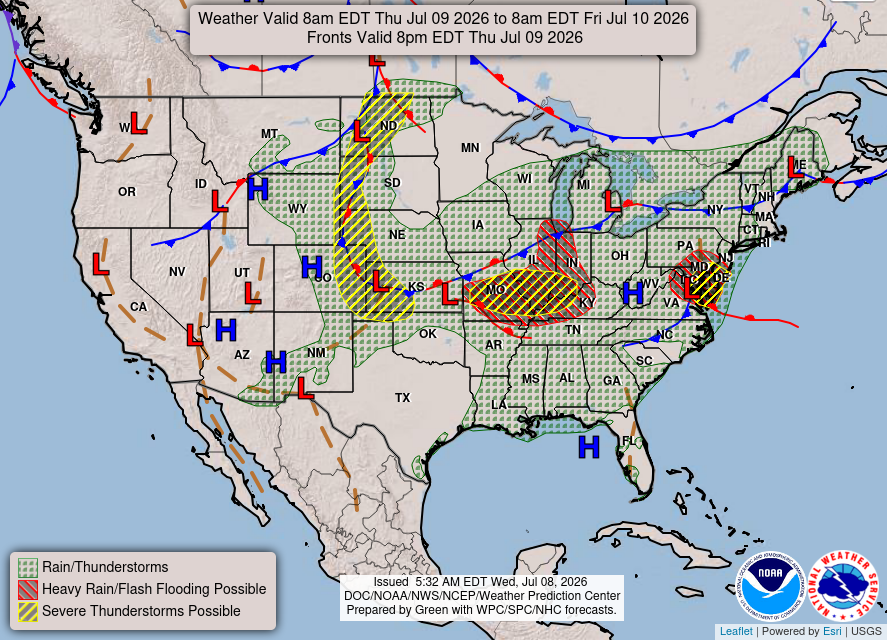
Weather on Thursday
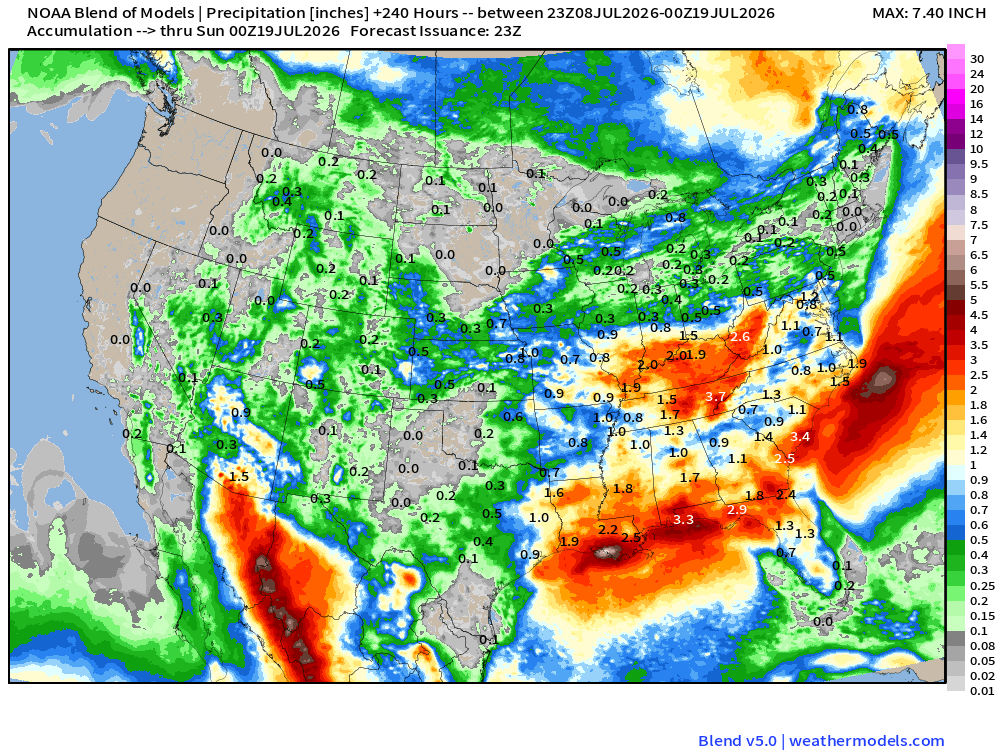
Blend of Models —> Precipitation Next 10-days
Flagship model: ECMWF AIFS 18z —> Integrated Vapor Transport next 12-days
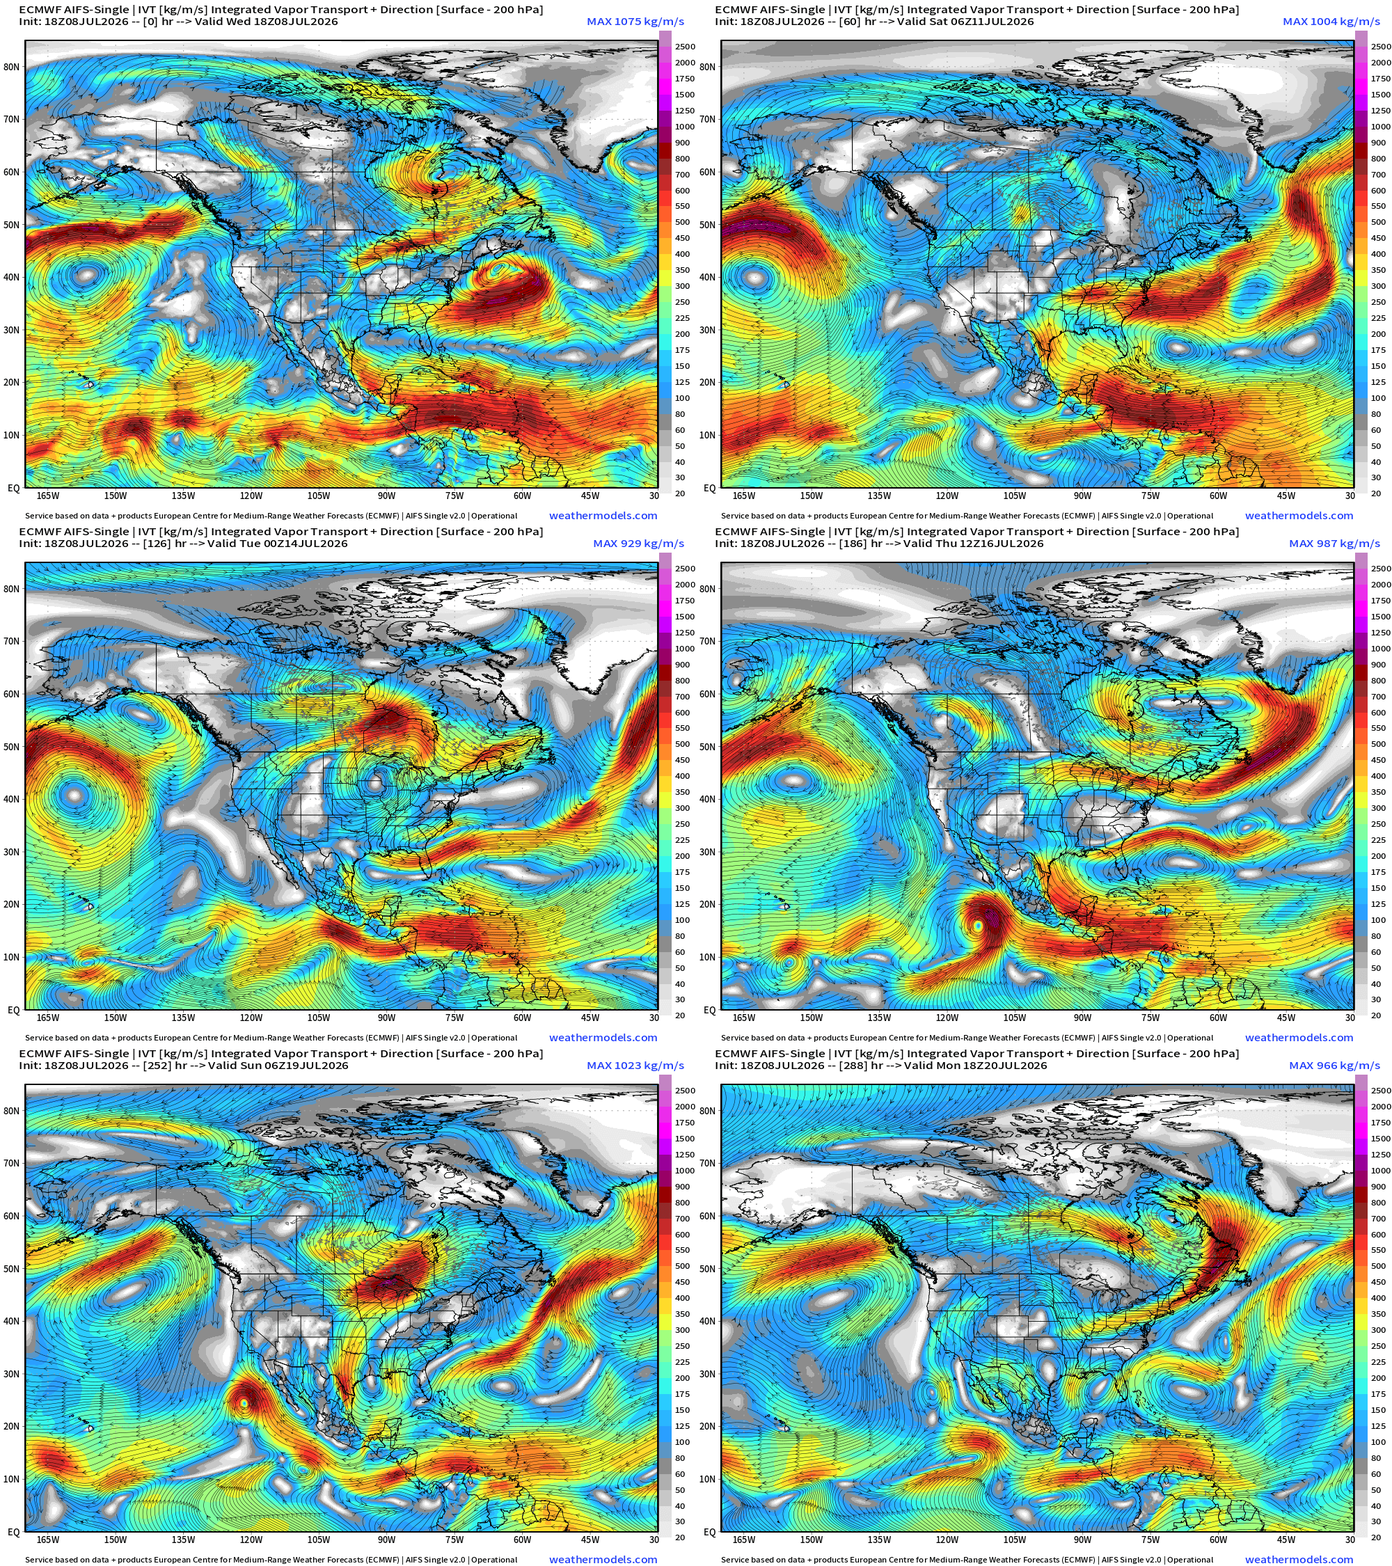
The heat dome across the Great Lakes shows up as a clockwise closed circulation within the moisture parameter (IVT)
The Gulf of Mexico is largely shut off from deep fetch southerly flow into the Lower 48 through Texas and the Deep South.
Instead, there is a bit of a trough bent across North Florida and the Southeast Atlantic underneath the strong ridge.
Eastern Pacific hurricane likely in 7-8 days
Atlantic tropical basin is a ghost town
ECMWF HRES 18z | Precipitable Water | My Favorite Parameter
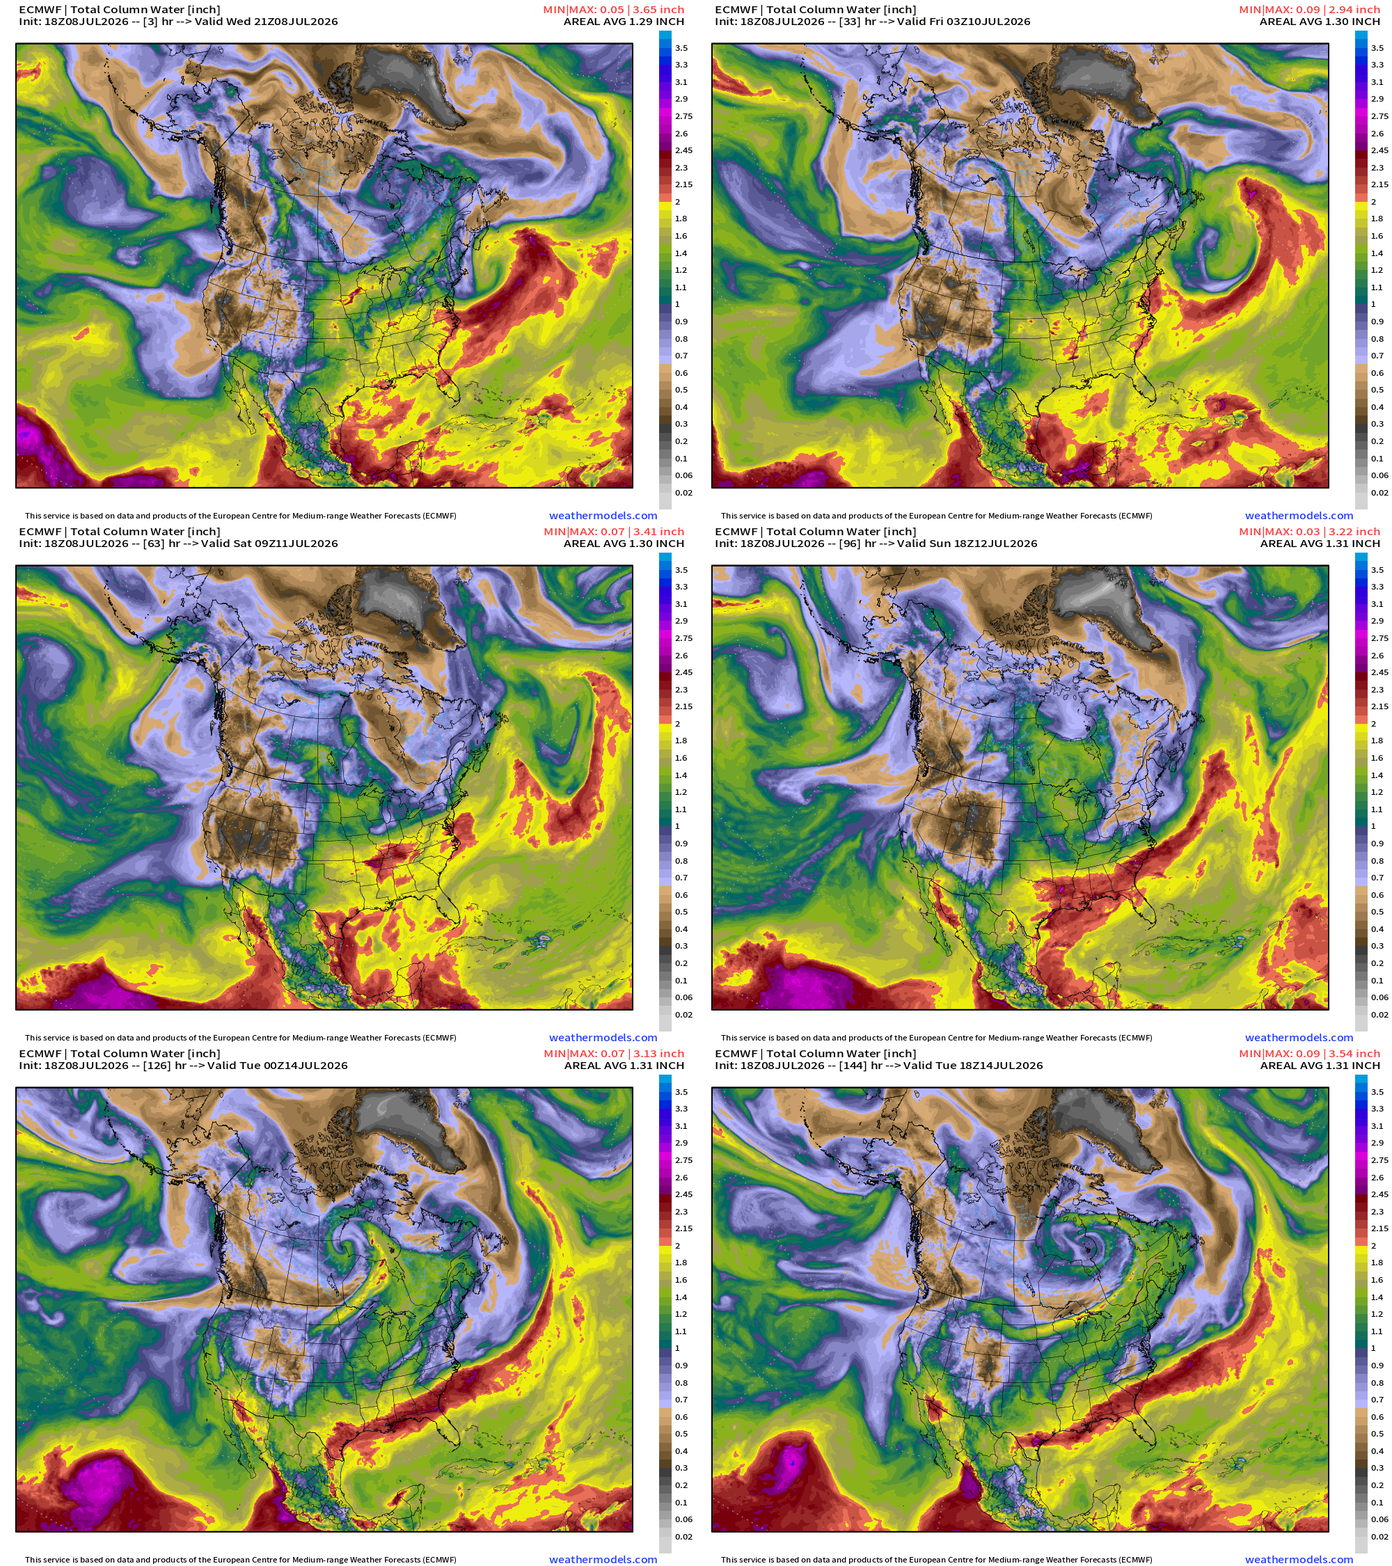
PWAT variable shows the formation of a stationary frontal boundary with heavy moisture content across the Gulf coast from Texas into Florida — and that will be the focus for continued clouds and heavy rain keeping temperatures mild.
Temperature Analysis | RTMA | 7:45 PM ET
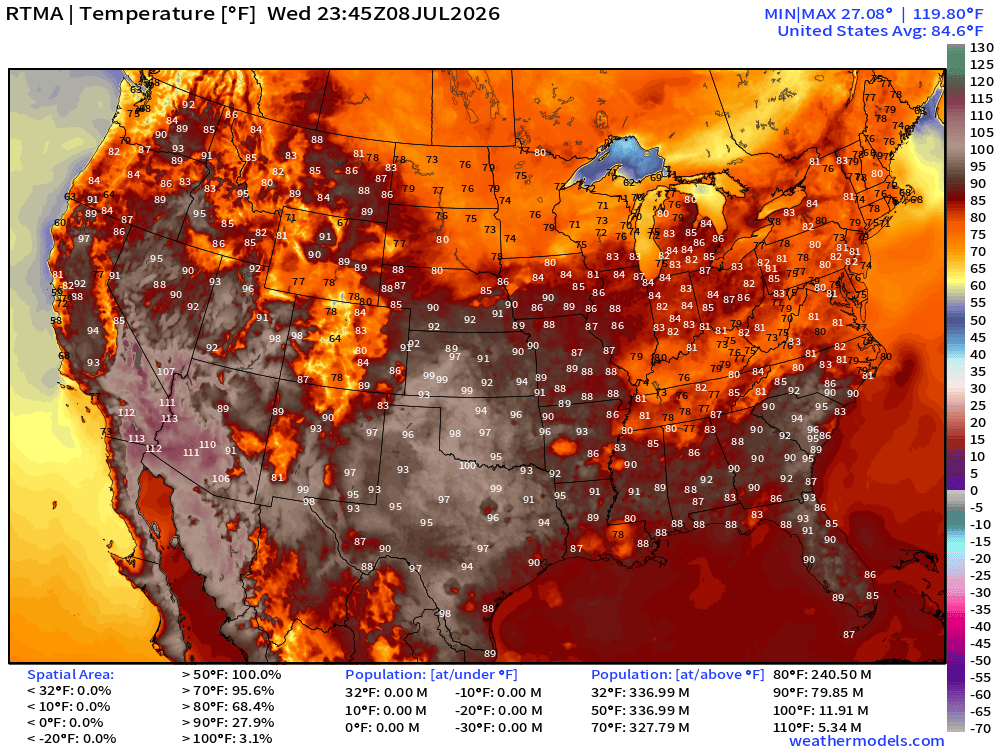
About 80 million population at least 90°F at 7:45 PM ET
Temperature Anomaly | RTMA | 7:45 PM ET
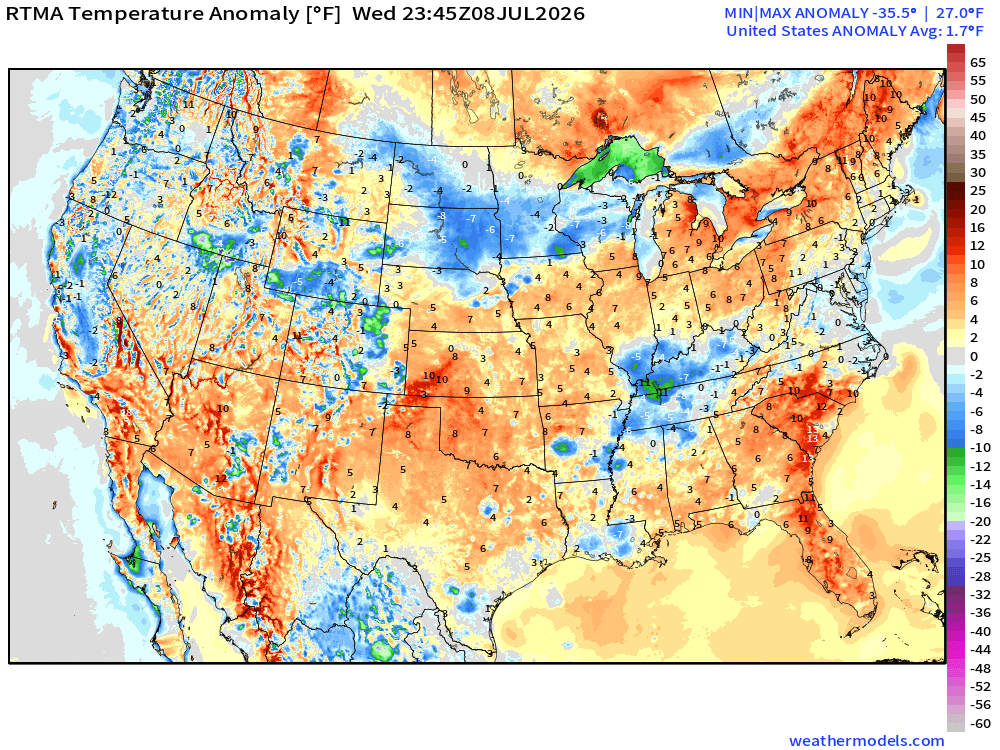
Lower 48 was 1.7°F above normal
High Temperatures Next 8-days — until Friday July 17th
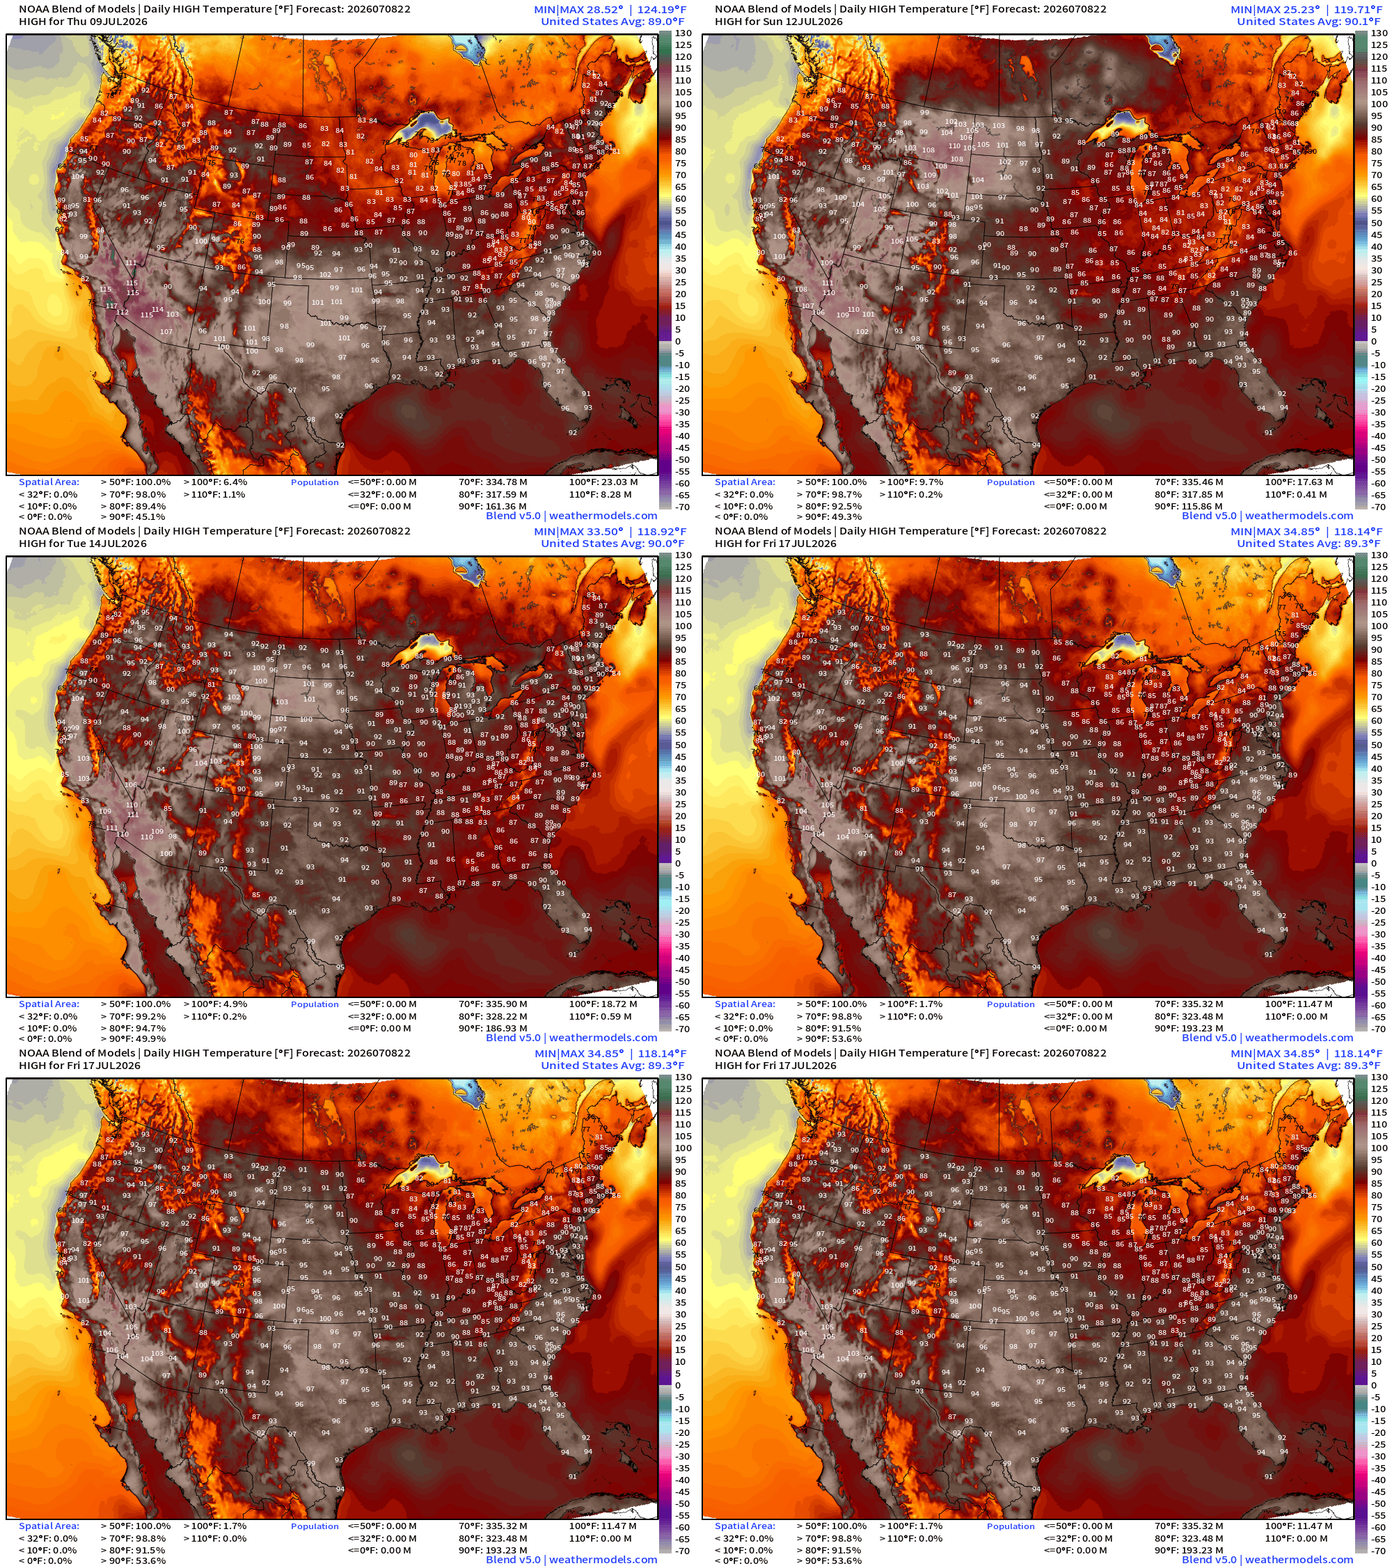
Settling into typical mid-July dog-days of summer heat — but entirely manageable with mainly 80s in the Great Lakes and Northeast.
The track of the heat dome — clockwise flow — actually brings cooler Canadian air into the Midwest and Great Lakes leaving the 100s in Montana and the Dakotas.
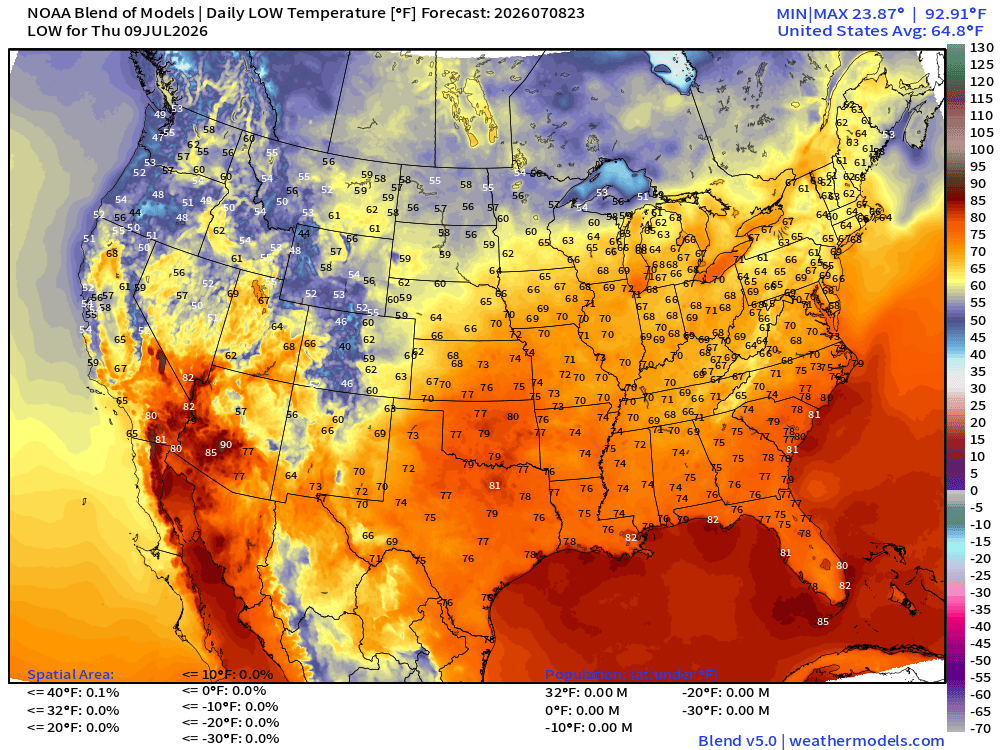
Low Temperatures on Thursday
High Temperatures on Thursday
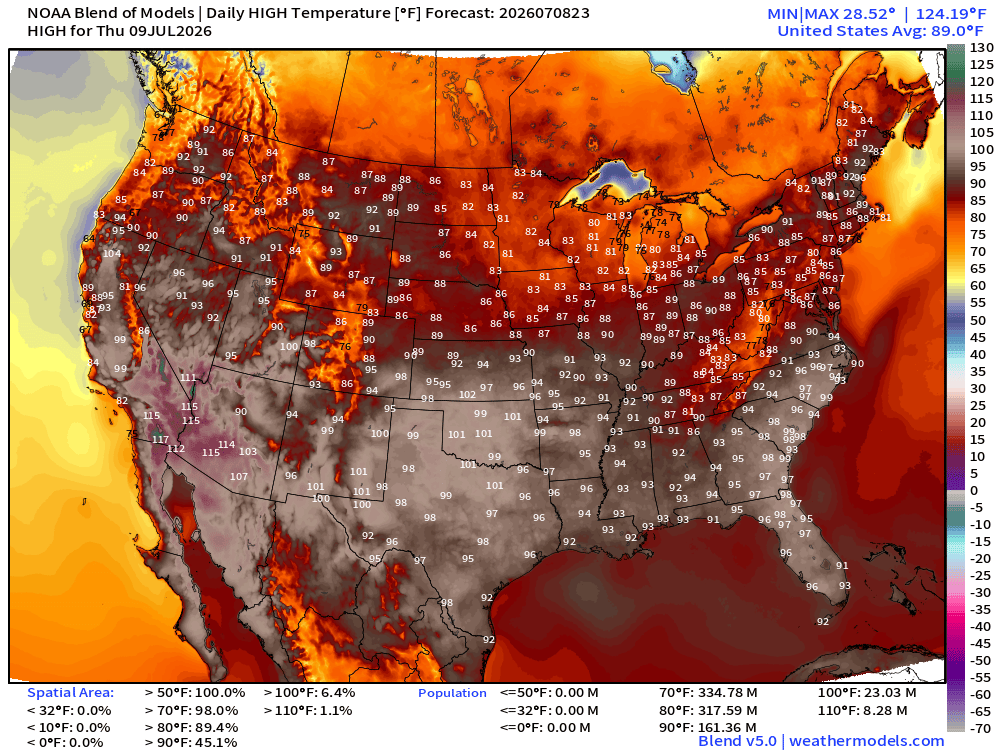
161 Million at least 90°F & only 23 million at least 100°F
High Temperatures on Friday
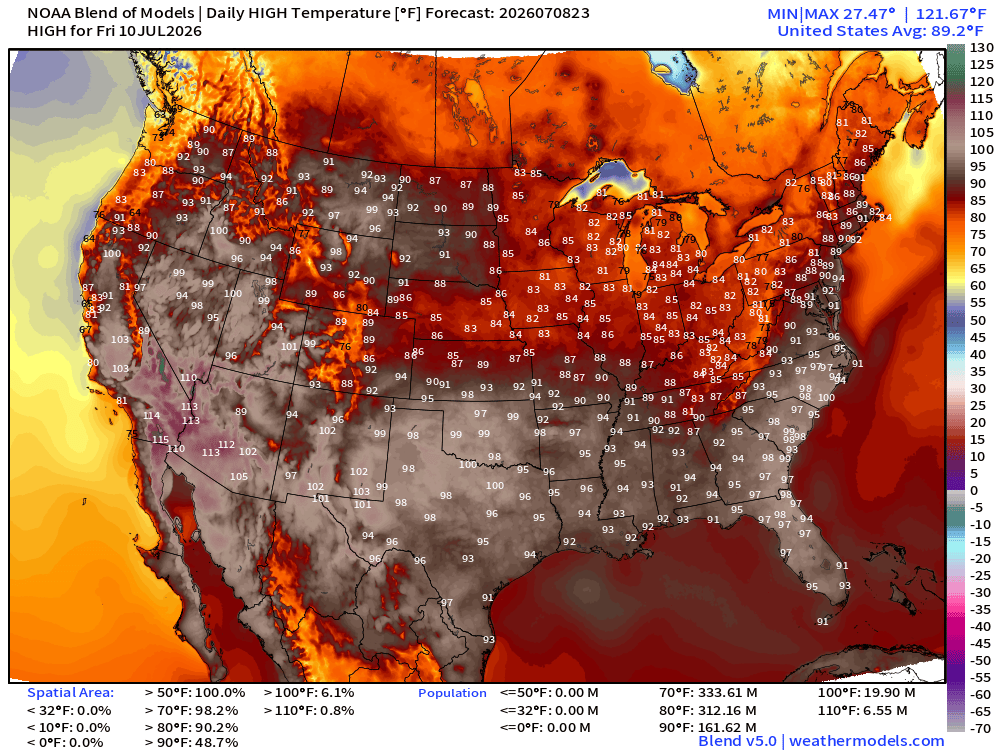
Only 20 million at least 100°F
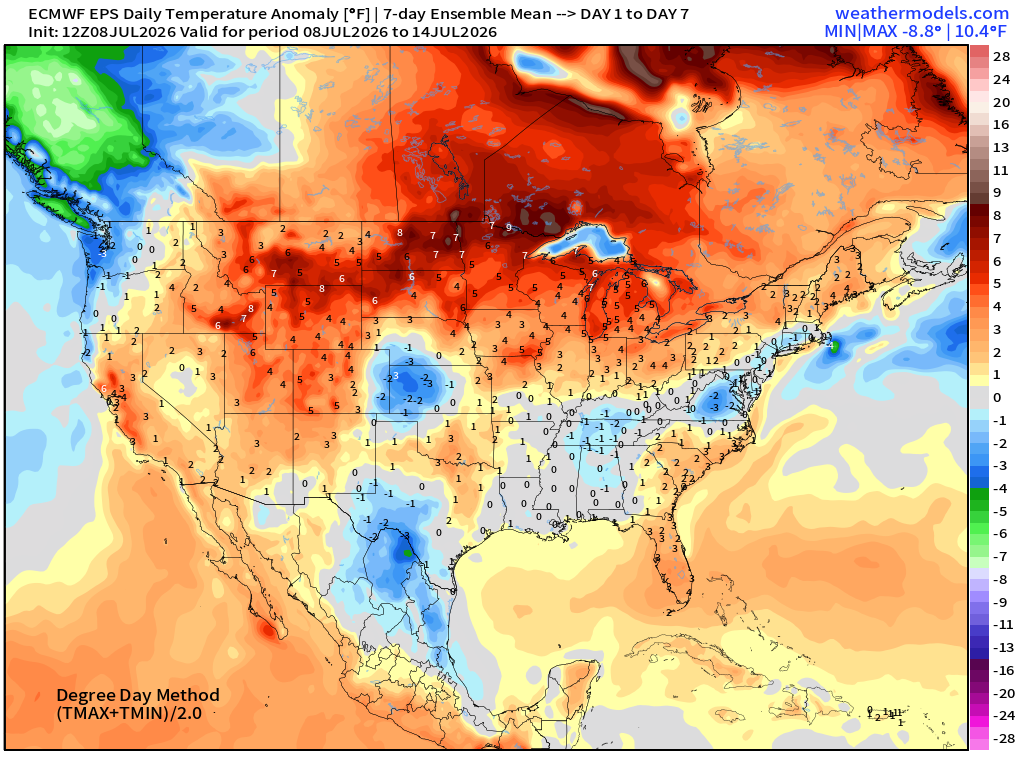
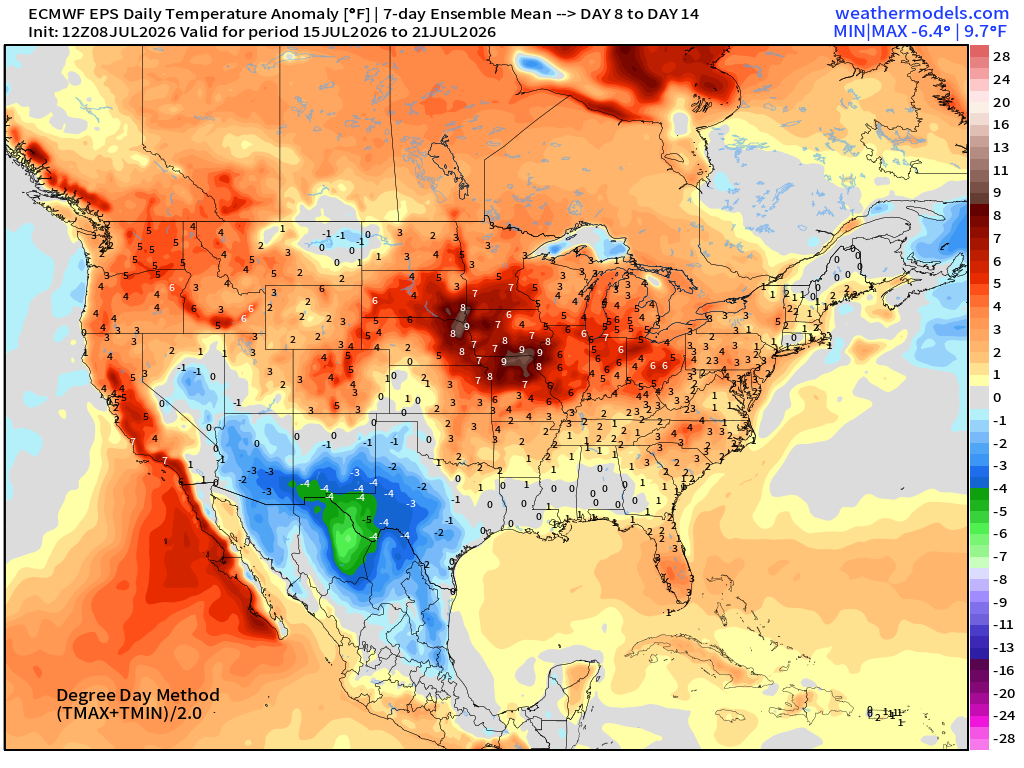
ECMWF Flagship Ensemble Mean Temperature Anomaly next 15-days
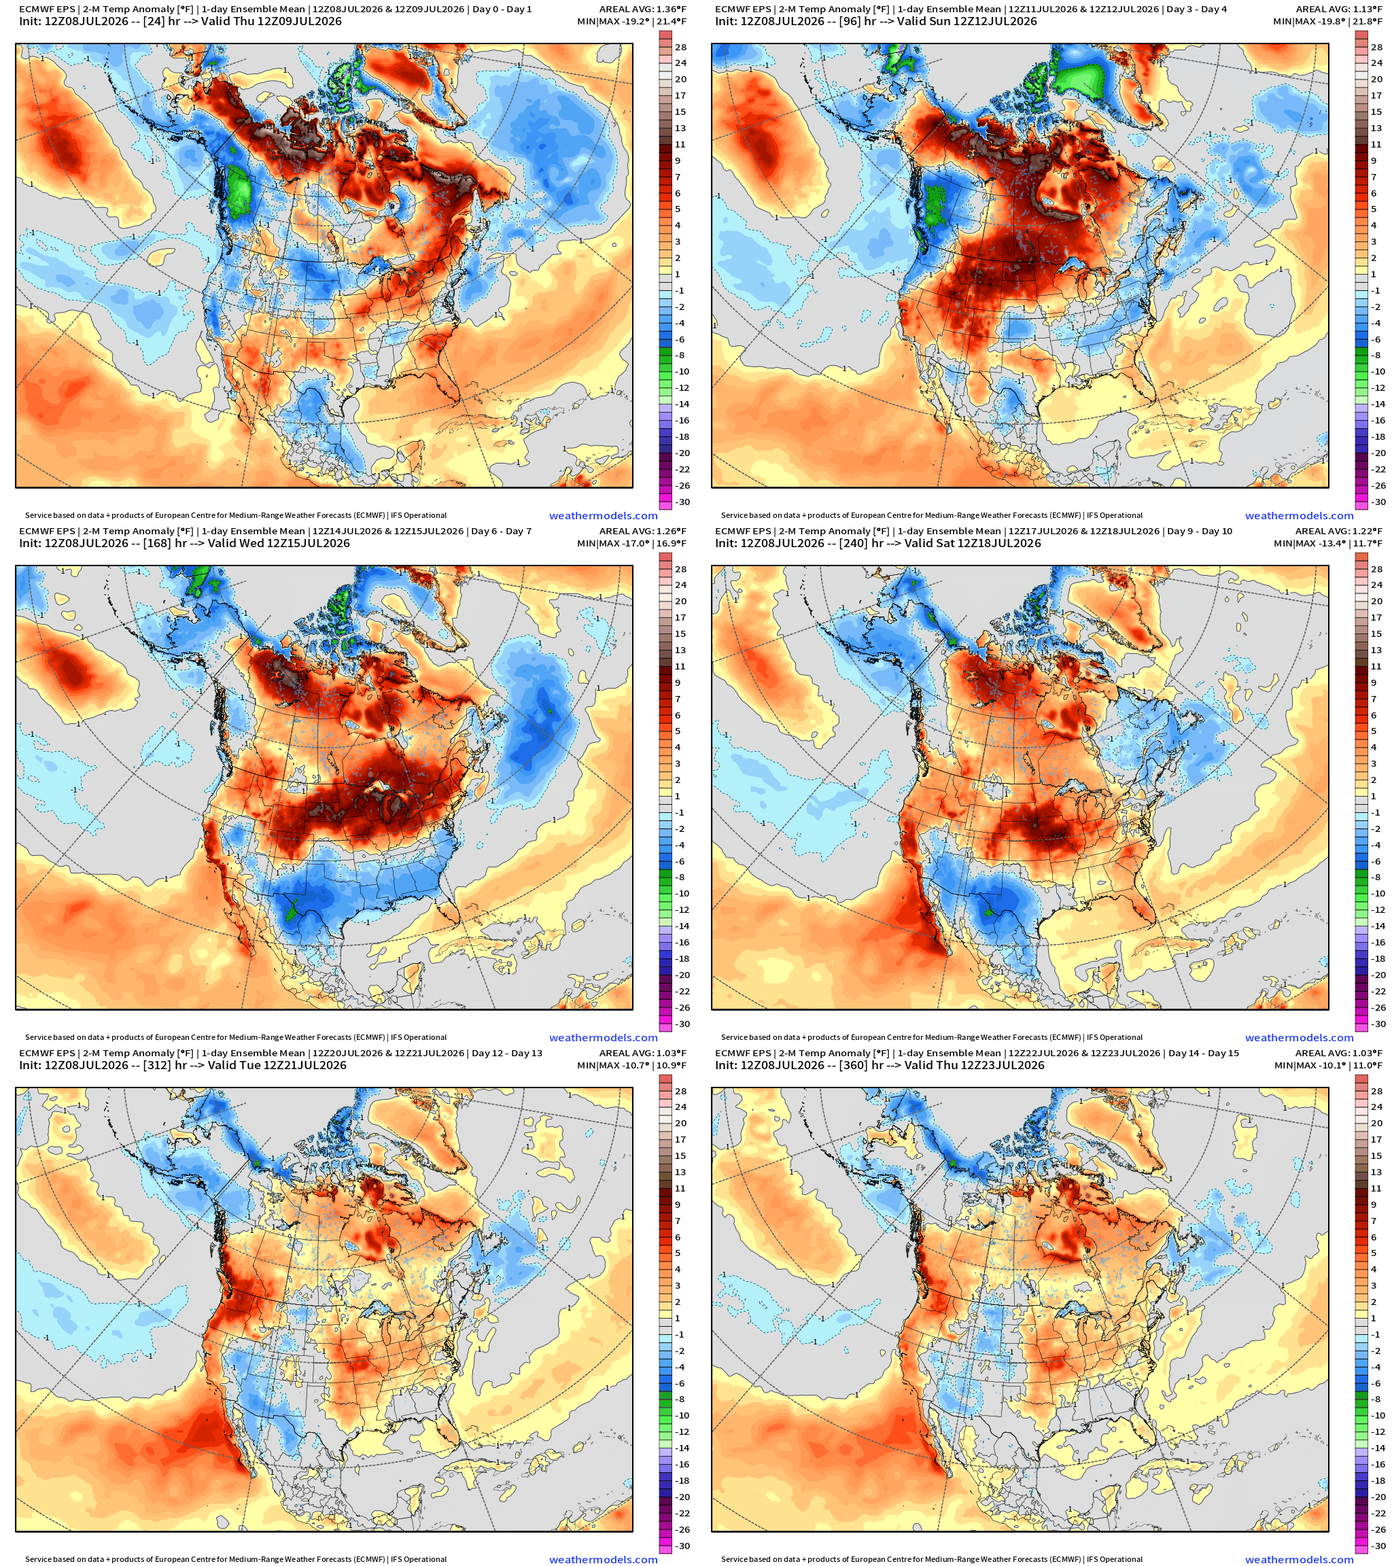
Mixed temperature signals into week 2 after the heat dome breaks down.
Week 1 —> July 8 to July 14
Week 2 —> July 15 to July 21
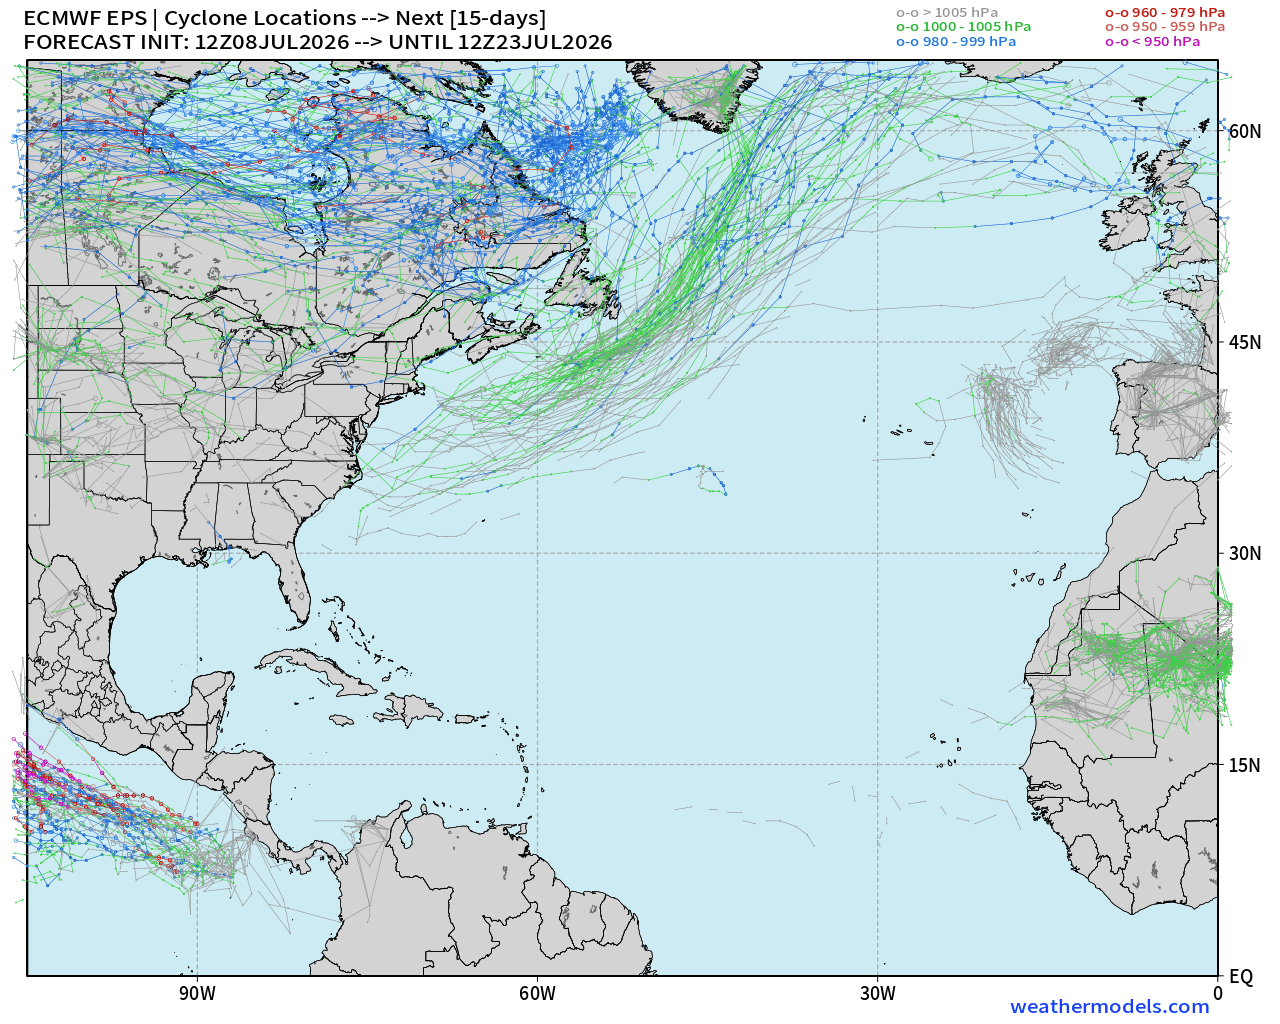
Atlantic Tropics — Ghost Town into mid-July, at least
ECMWF EPS 12z ensembles completely blank to July 23
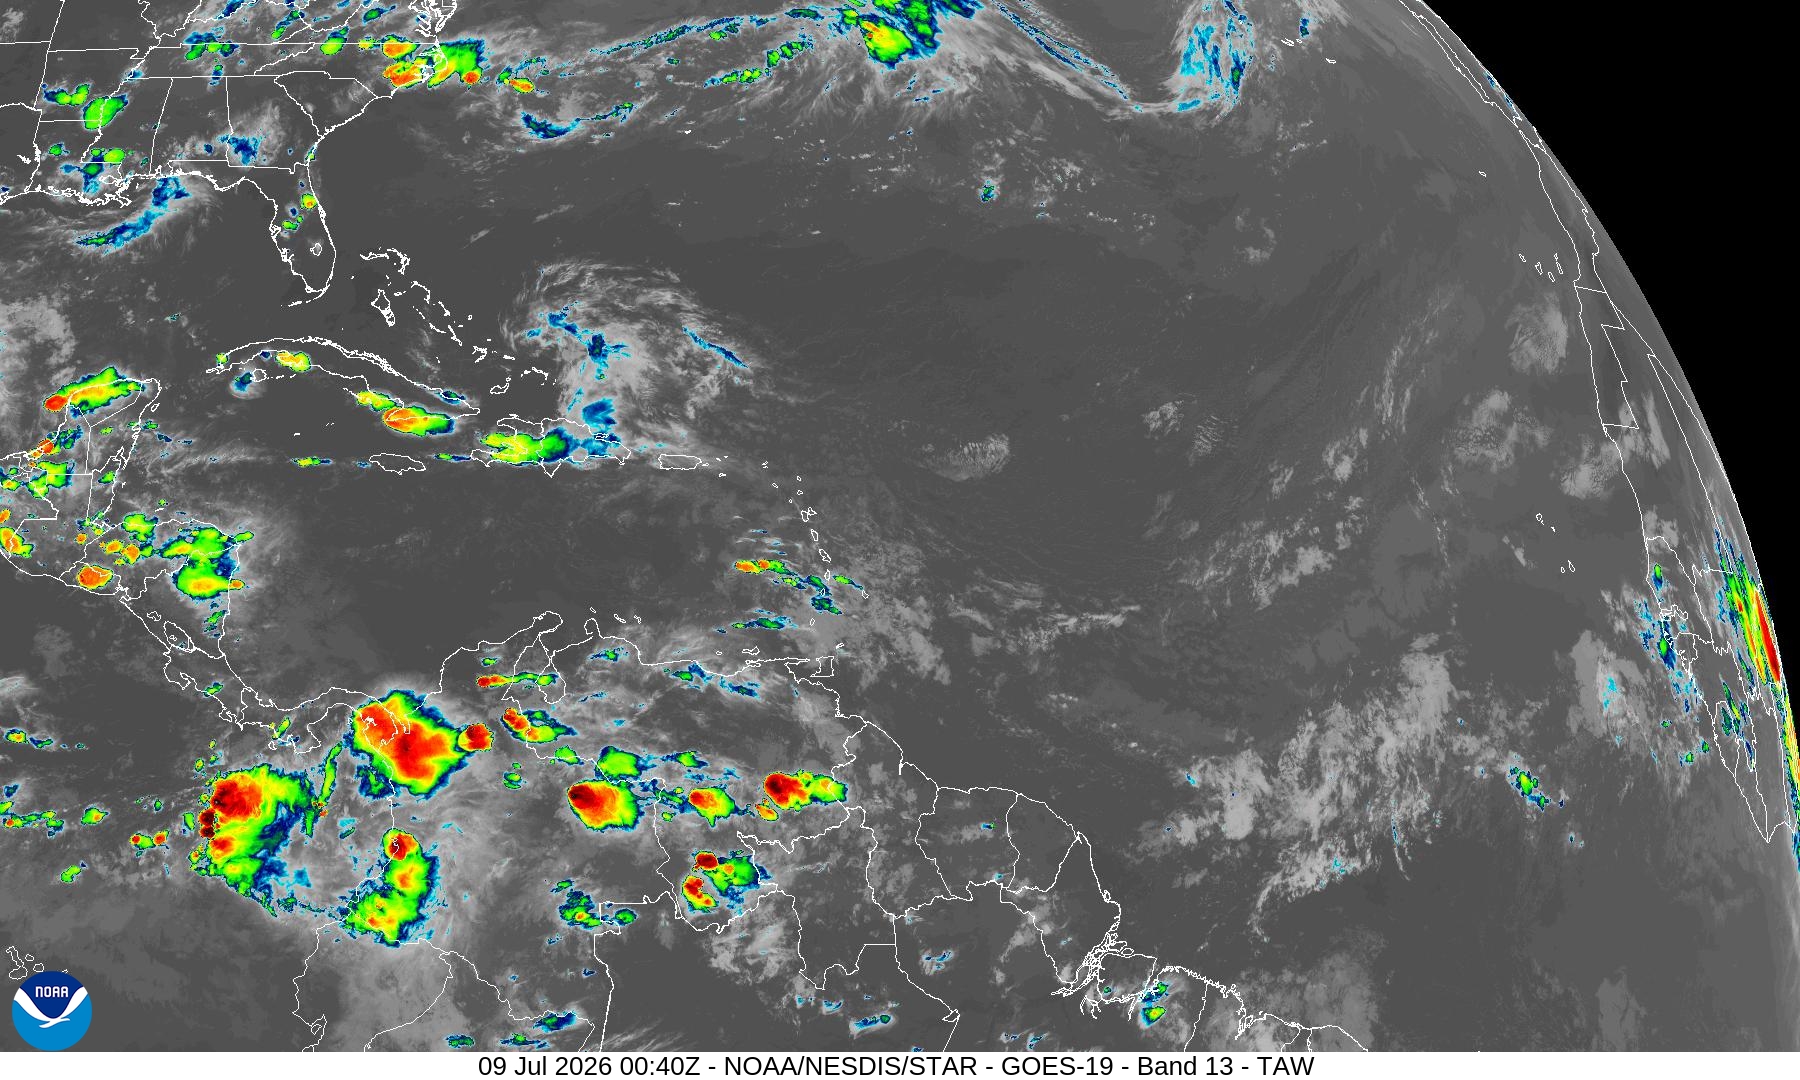
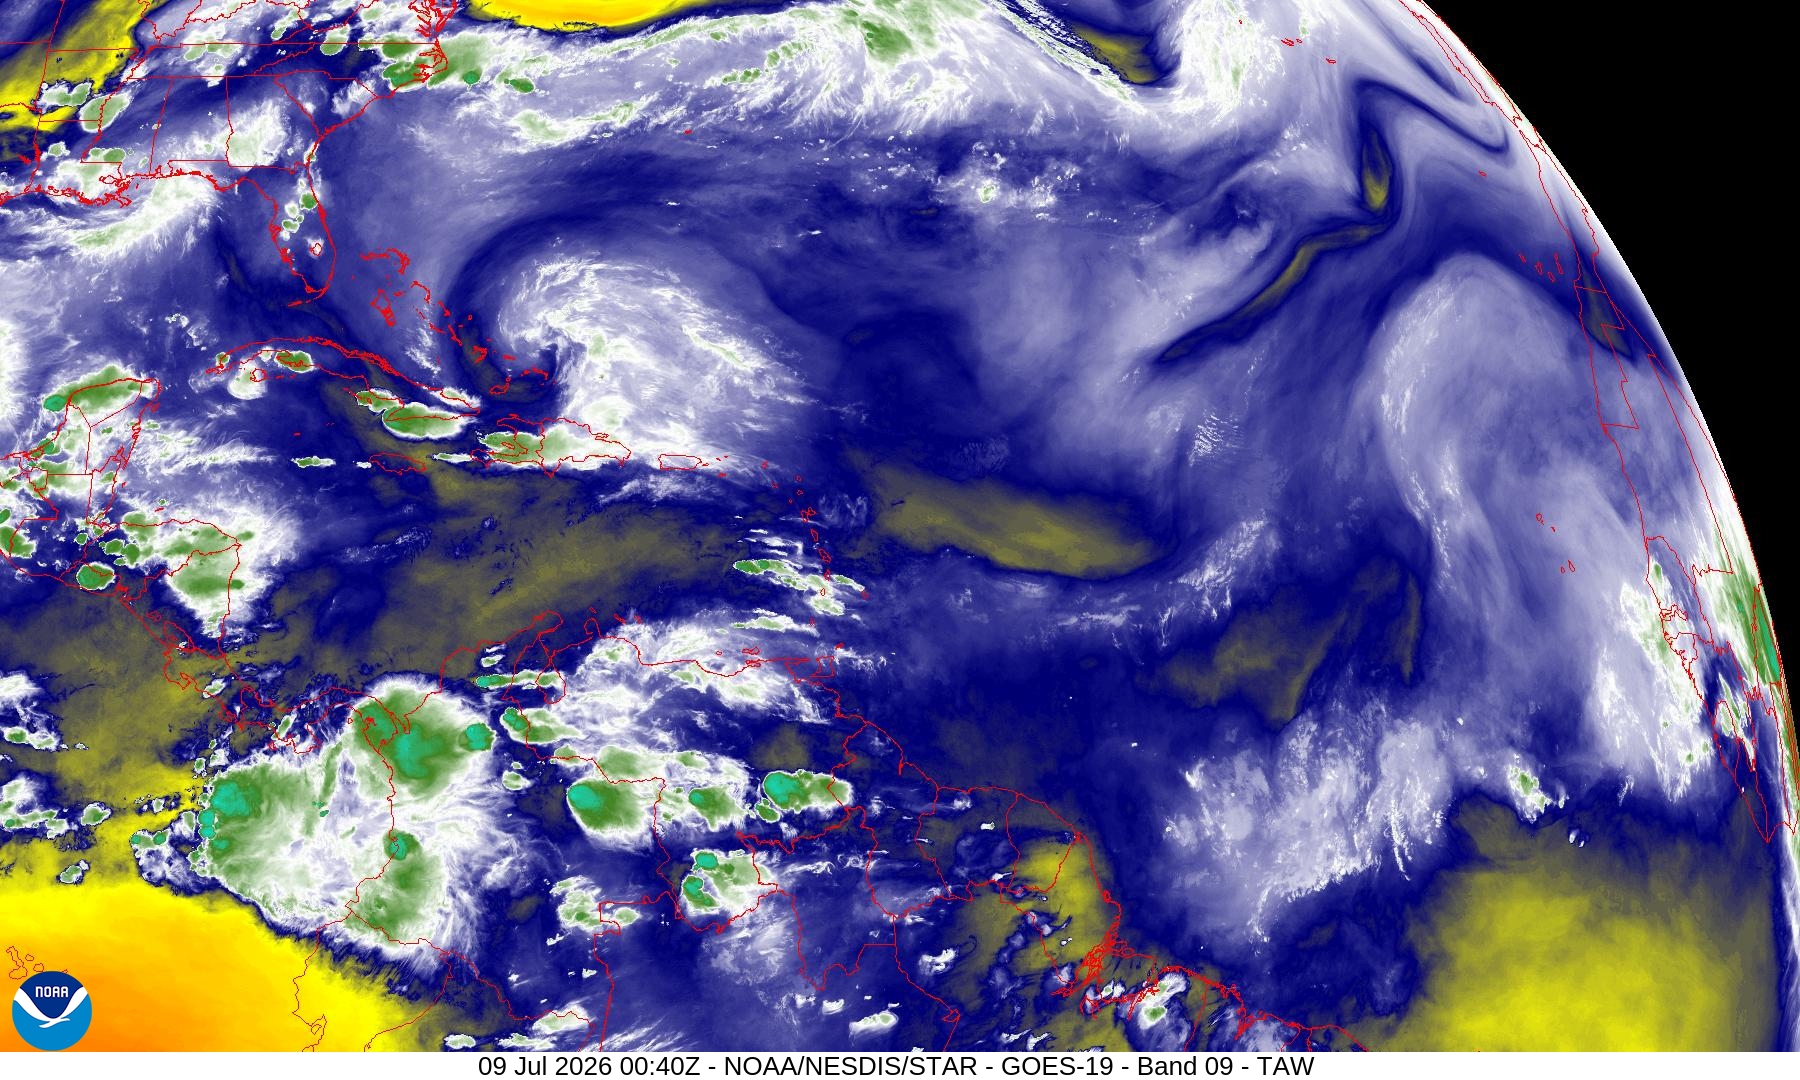
Satellite is almost entirely blank as well, with very limited convection. Tough sledding with the Saharan Dust!
NASA GEOS-5 Dust Forecast Next 10-days
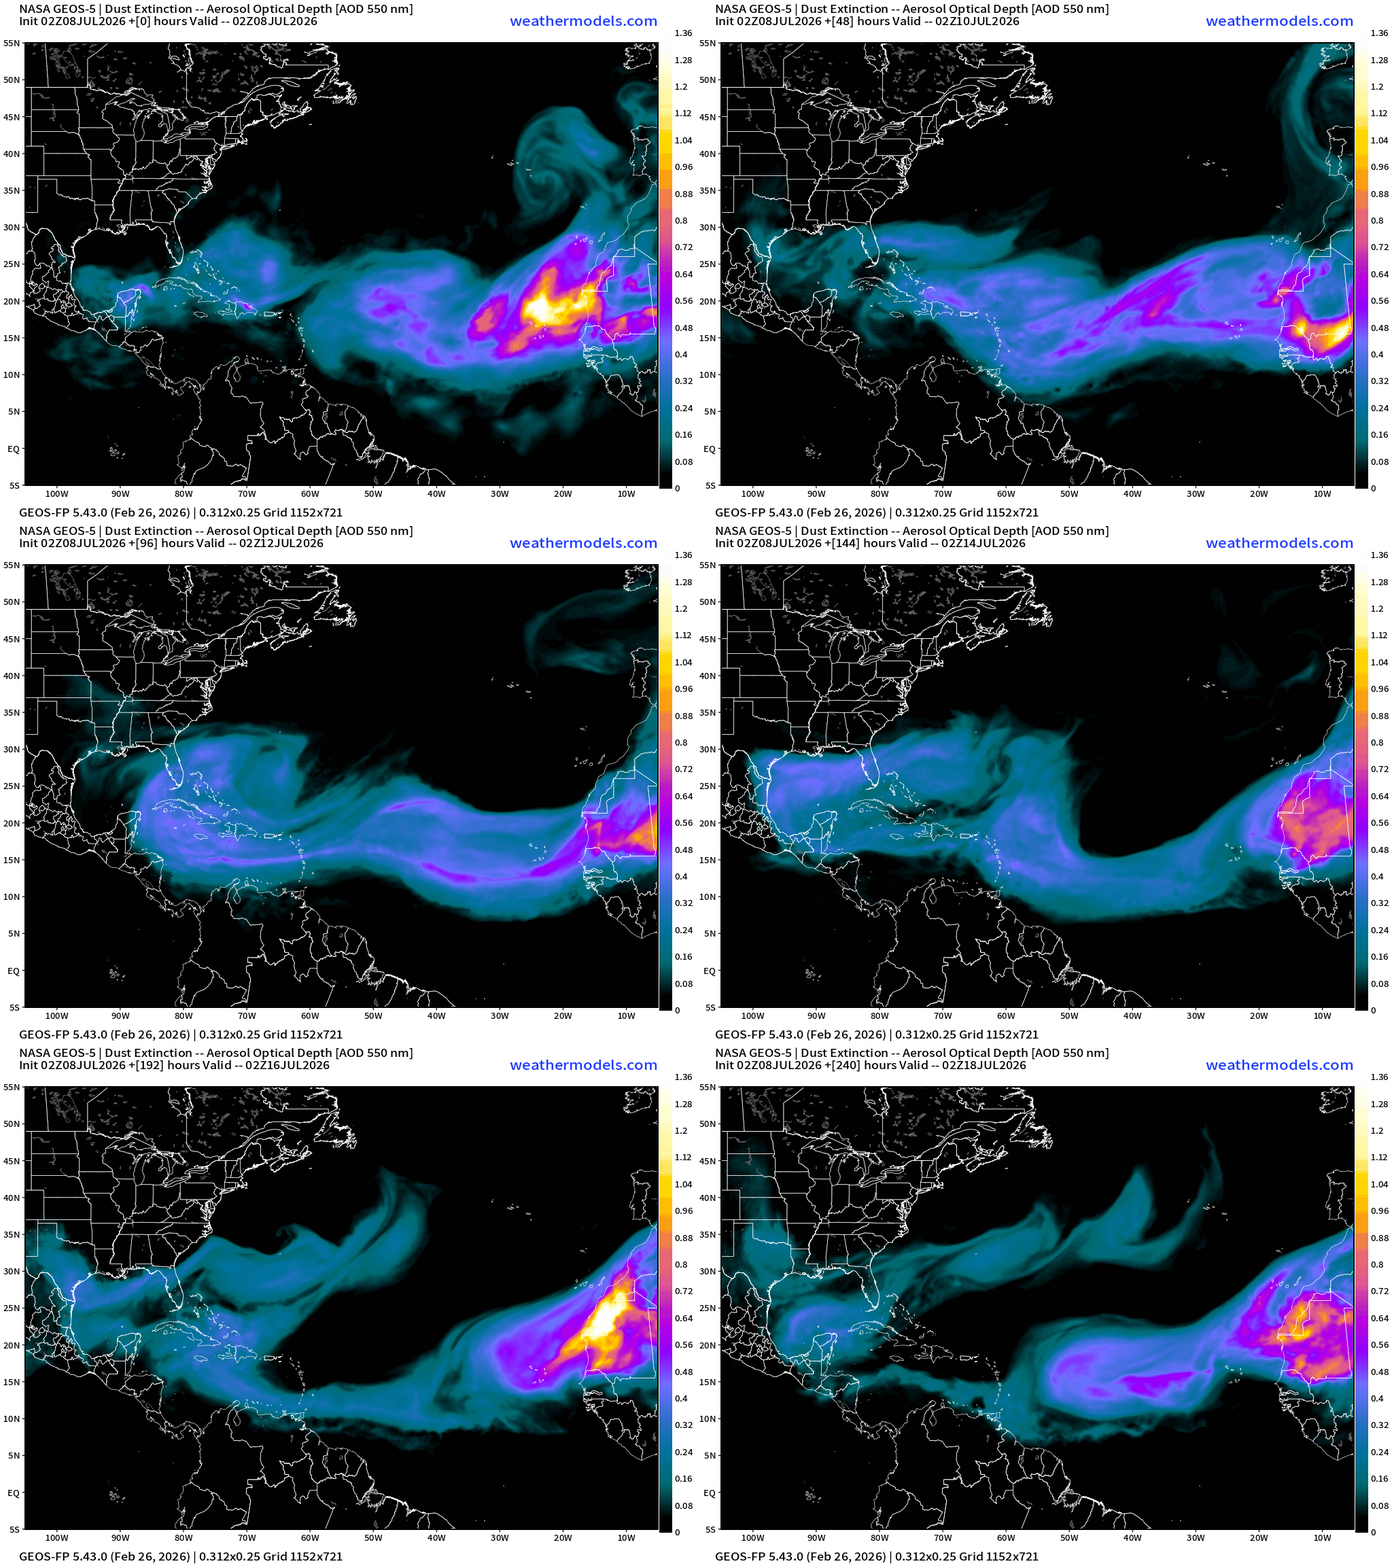
Like a dragon breathing fire off the African continent across the Atlantic — the entire basin along 15°N to 25°N will be very dusty and under control of Saharan Air Layer origin air mass.
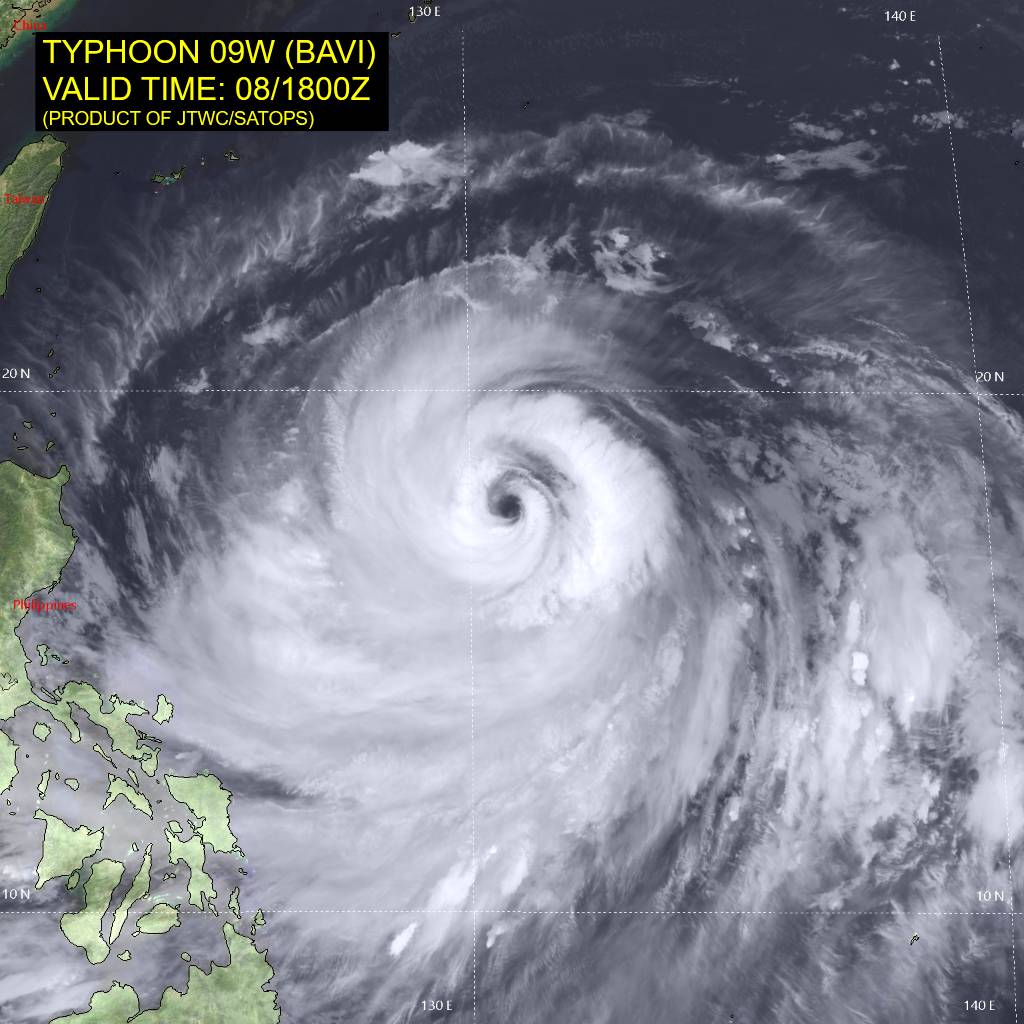
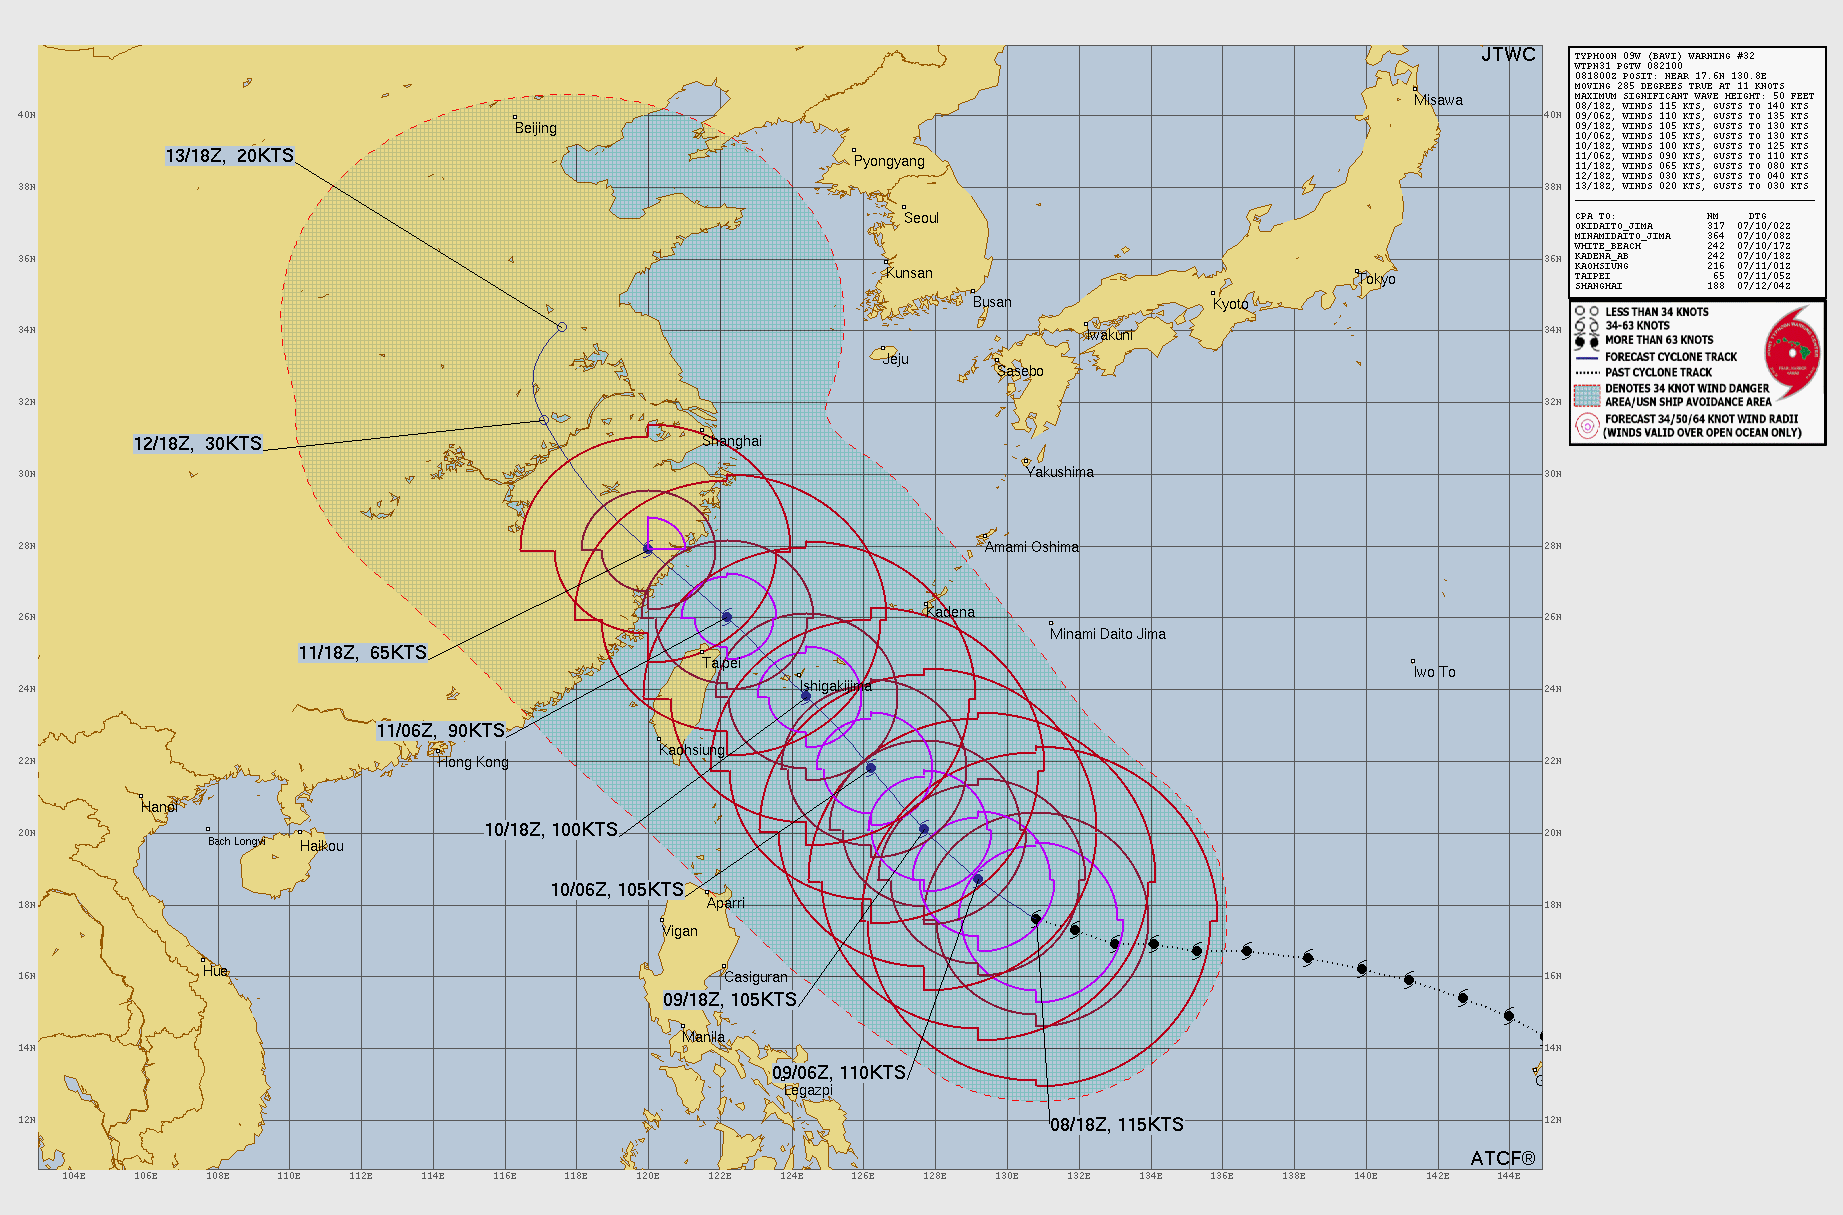
Typhoon Bavi is weakening, now down to 115-knots — still Category 4, but the large size allows more dry air from the outer environment to enter the eye and disrupt the eyewall convection.
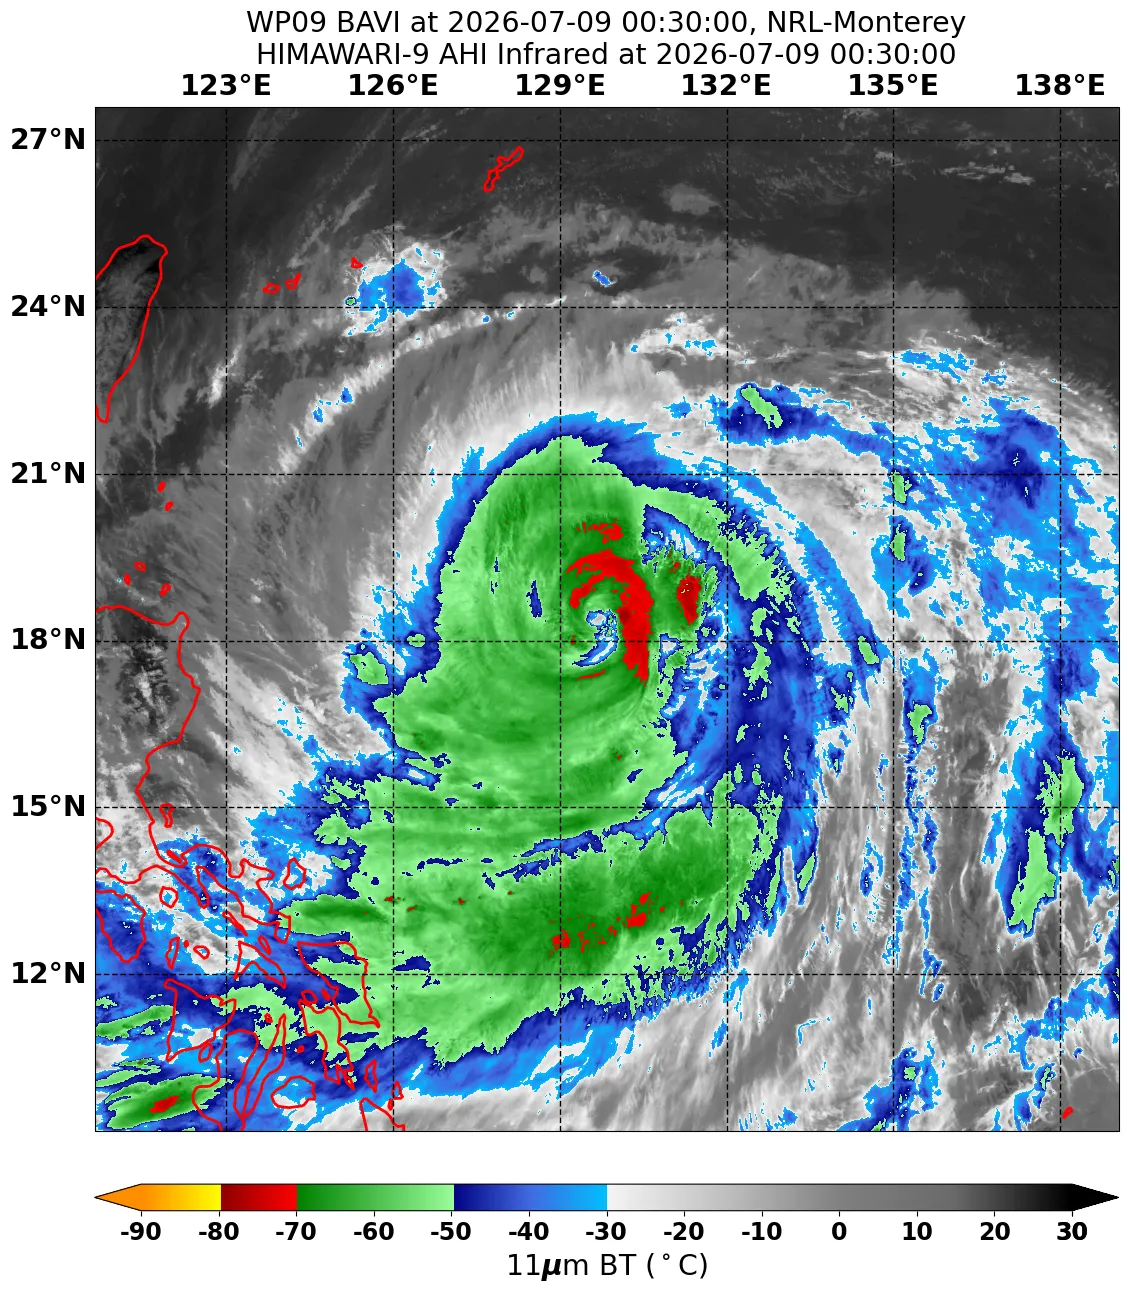
JTWC Track Forecast misses Taiwan … and major hurricane intensity
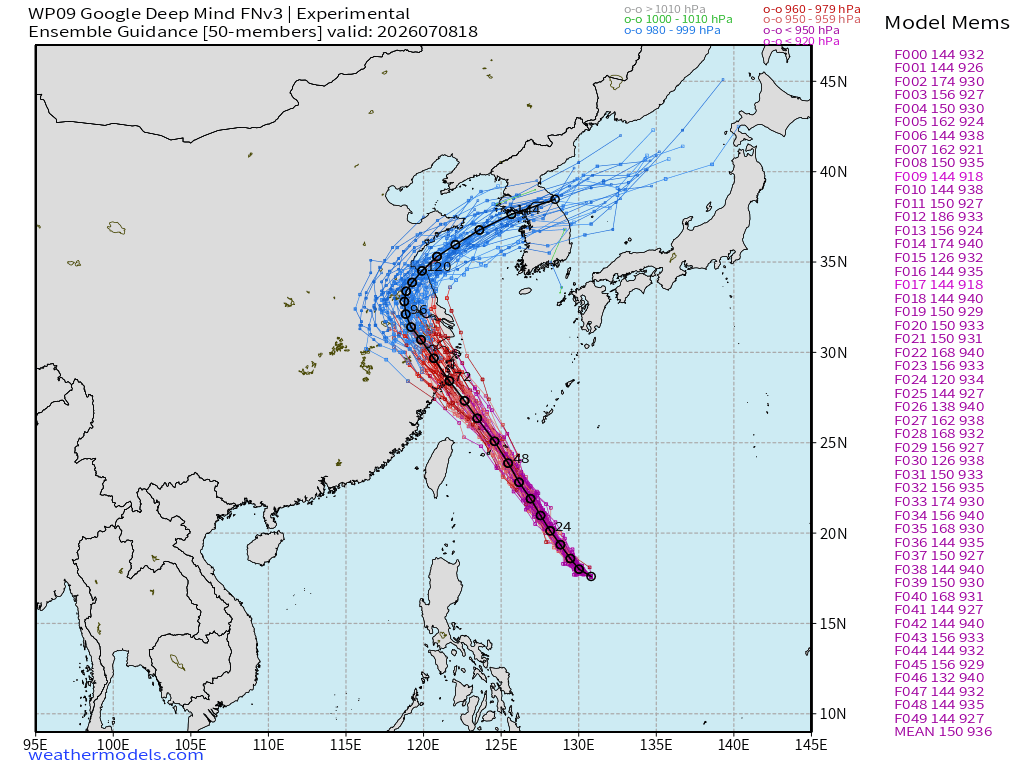
But the most recent Google Deep Mind 18z forecast ensemble for Bavi is a big shift to the north well away from Taiwan into China in 72-hours
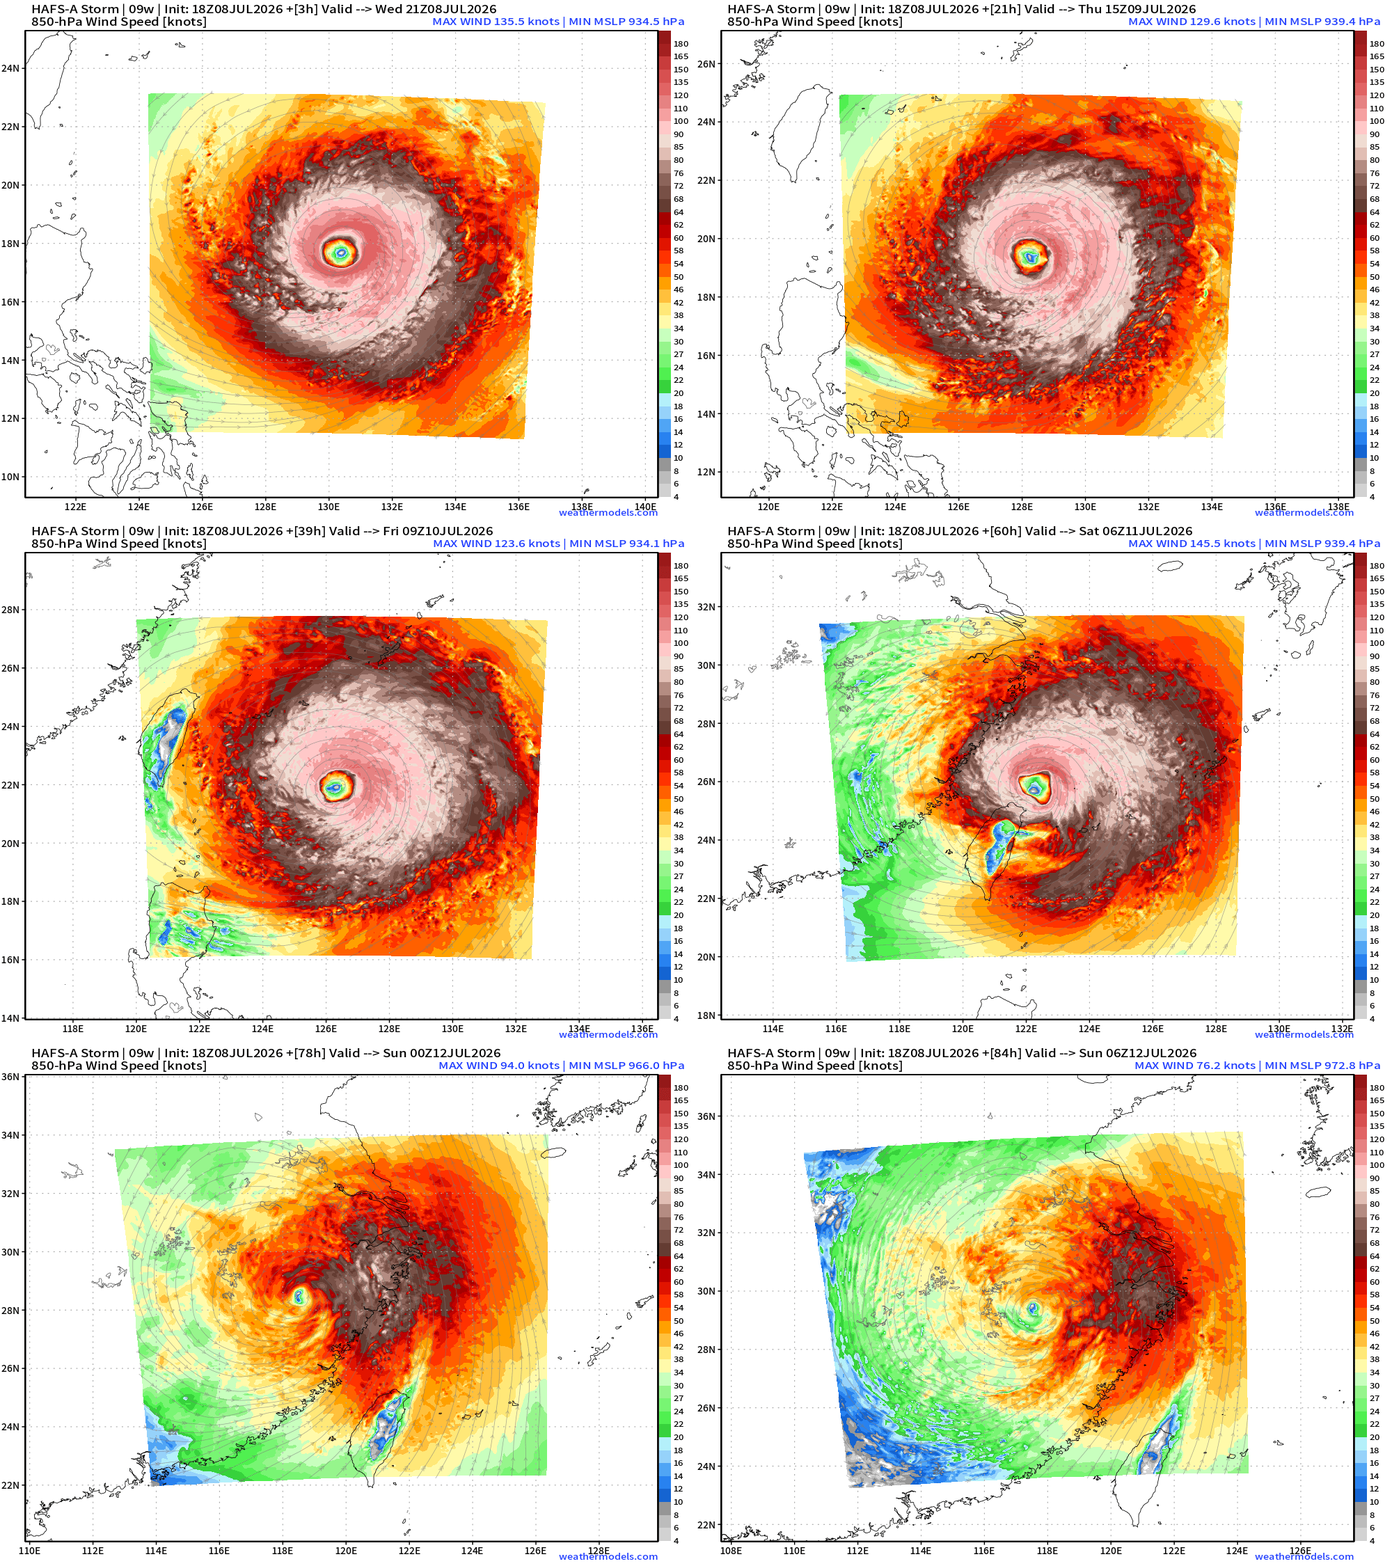
HAFS-A 18z still tracks near Taiwan but this may shift to the north as well.
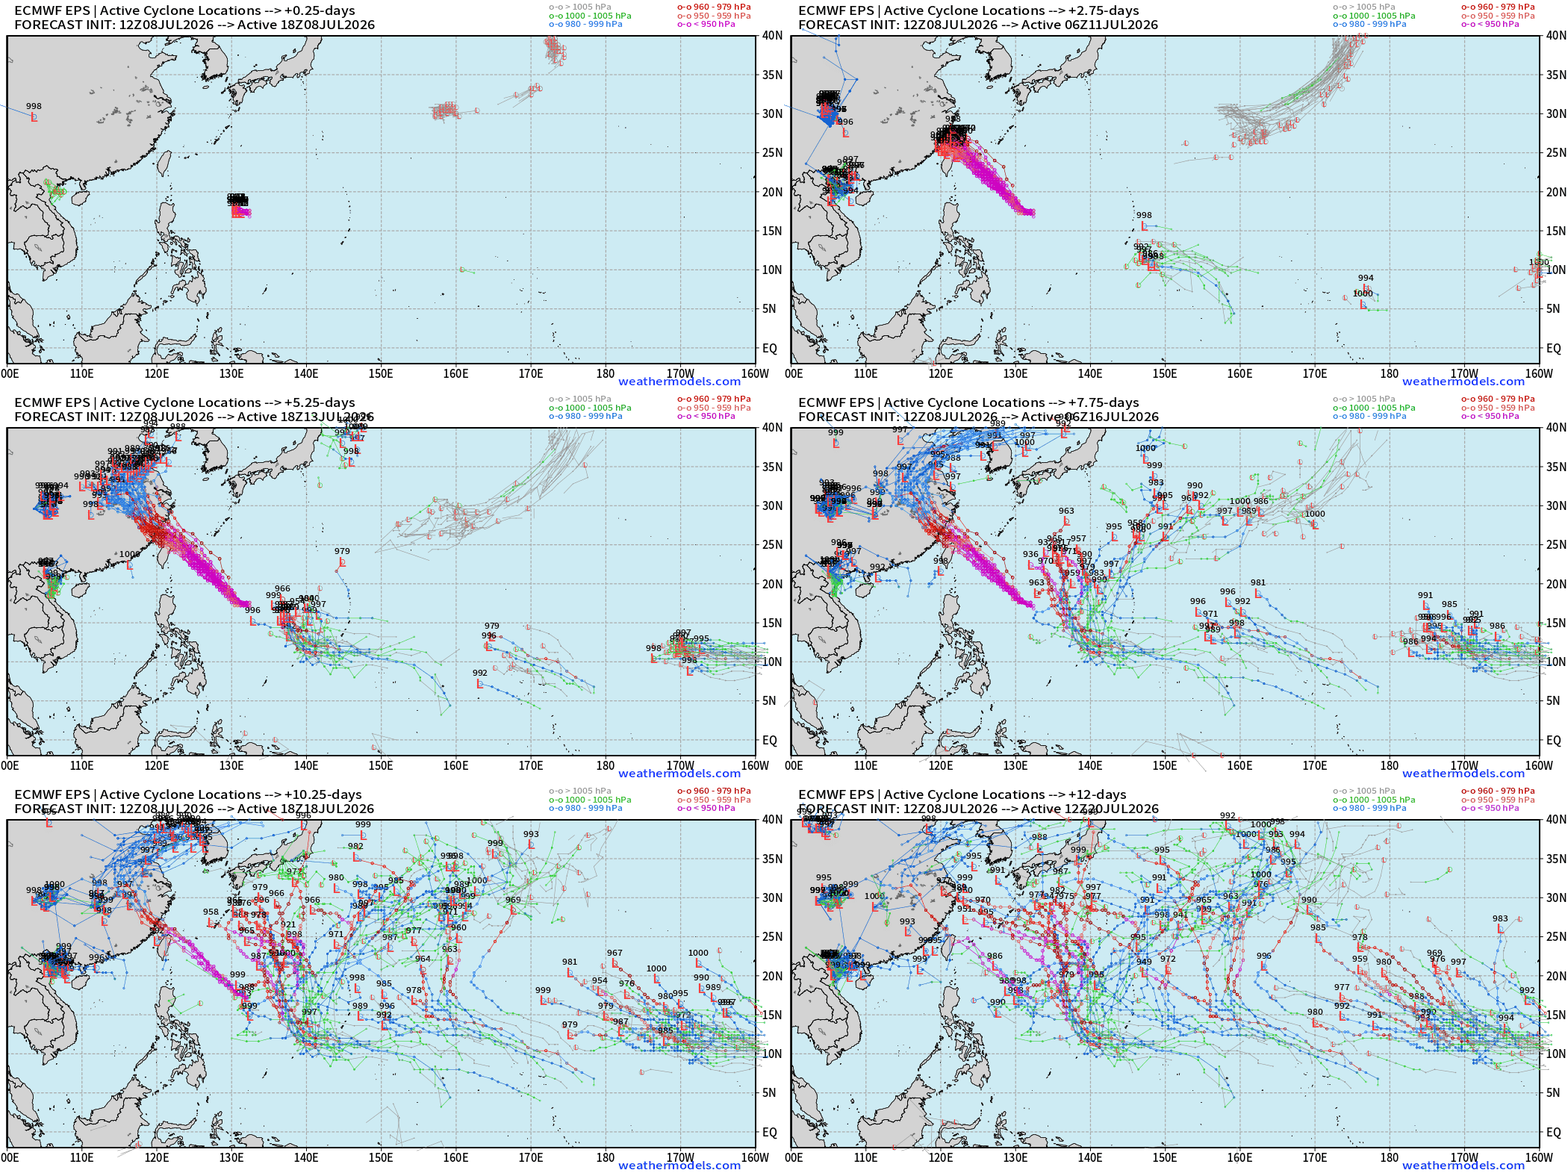
The Western Pacific — next 12-days — plenty more tropical storm + Typhoon opportunities! ECMWF EPS 12z ensembles:
Thank you for reaching the end of this post! Hopefully you enjoyed the beautiful weather maps. Please help increase the visibility of Weather Trader on Substack: Share or Like!
Maps sourced from weathermodels.com designed and innovated by yours truly! Please subscribe there for real-time access to the newest maps, charts from all of the weather models including ECMWF and AIFS, and NOAA GFS/GEFS, HRRR/RRFS and Blend of Models (NBM). NOAA WPC and SPC for fronts/convective outlooks.
My Atlantic Hurricane Season Forecast (2026)
From April 7, 2026: Atlantic Seasonal Hurricane Forecast: (11/5/2)
9-13 Named Storms (11 most likely)
4-7 Hurricanes (5 or 6 most likely)
1-3 Major Hurricanes (2 most likely)
Accumulated Cyclone Energy: 75-85 (well below normal)
NOAA 2026 Atlantic Hurricane Season Forecast
- Milepost
- 976 · laid 2026-07-09T01:49:05.323000Z
- Source
- https://weather.substack.com/p/july-8-2026-wednesday-summer-weather
- Digest
- b708586f5b50874bc0d6ede249c9cbe085d933a9cd71fa3ddacd7f74c84c7a79
- Machine
- JSON