June 15, 2026 Monday Tropical Moisture Plume
Boatloads of rainfall with deep layer tropical moisture plume + Texas coast disturbance (30% chance)
June 2026 was the 18th-warmest June in the 132-year national record (1895–2026), at 70.6°F against a 1991–2020 normal of 69.5°F (+1.2°F).
June 2026 was the 32nd-wettest June in the 132-year national record (1895–2026), at 3.3in against a 1991–2020 normal of 3.1in (+0.2in).
NOAA/NCEI Climate at a Glance, contiguous United States. This is the observed record for the month, not a score of anything said in this piece — the forecast ledger begins 2026-08-17 and cannot reach earlier posts.

Help support this newsletter (nearing post 1,000!) —> June 2026 Coupon
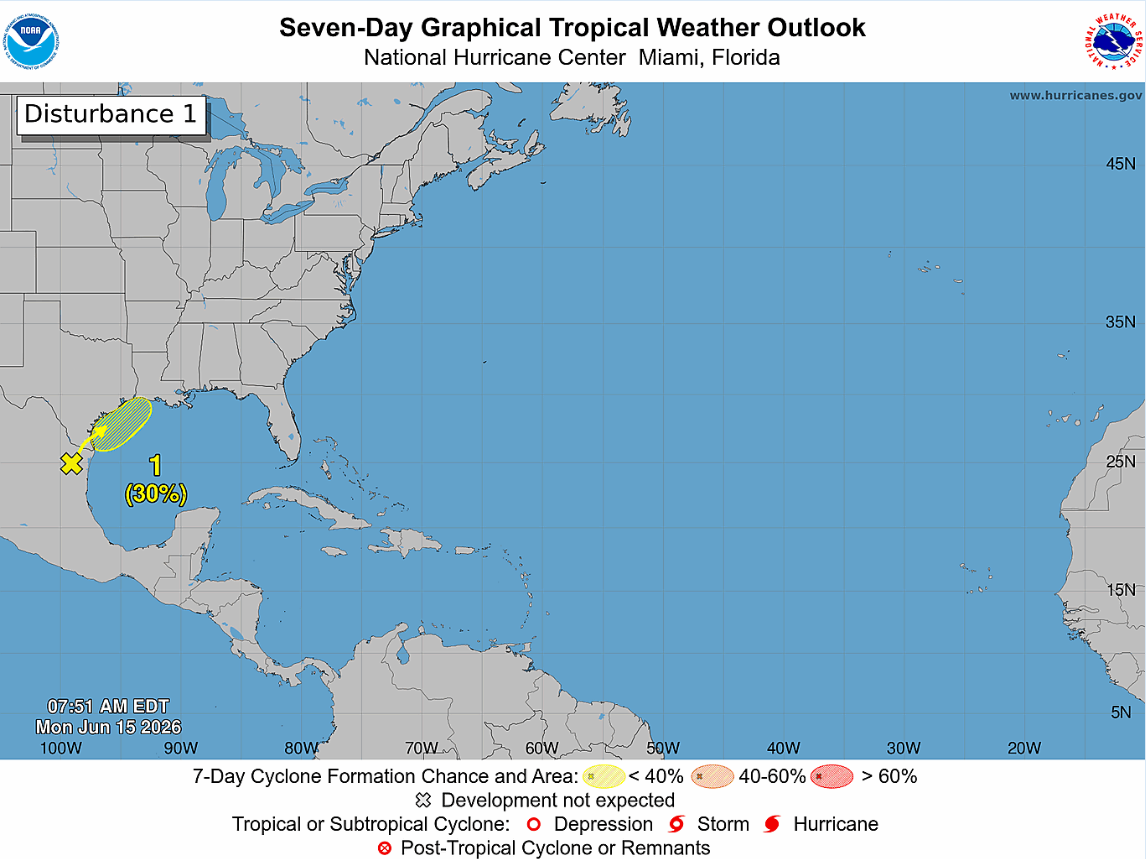
Monday Headline: Tropical Disturbance over northern Mexico and South Texas may emerge over the very warm waters of the Gulf [30% chance] —> and develop a circulation enough to become a tropical depression or tropical storm.
Time frame —> Wednesday
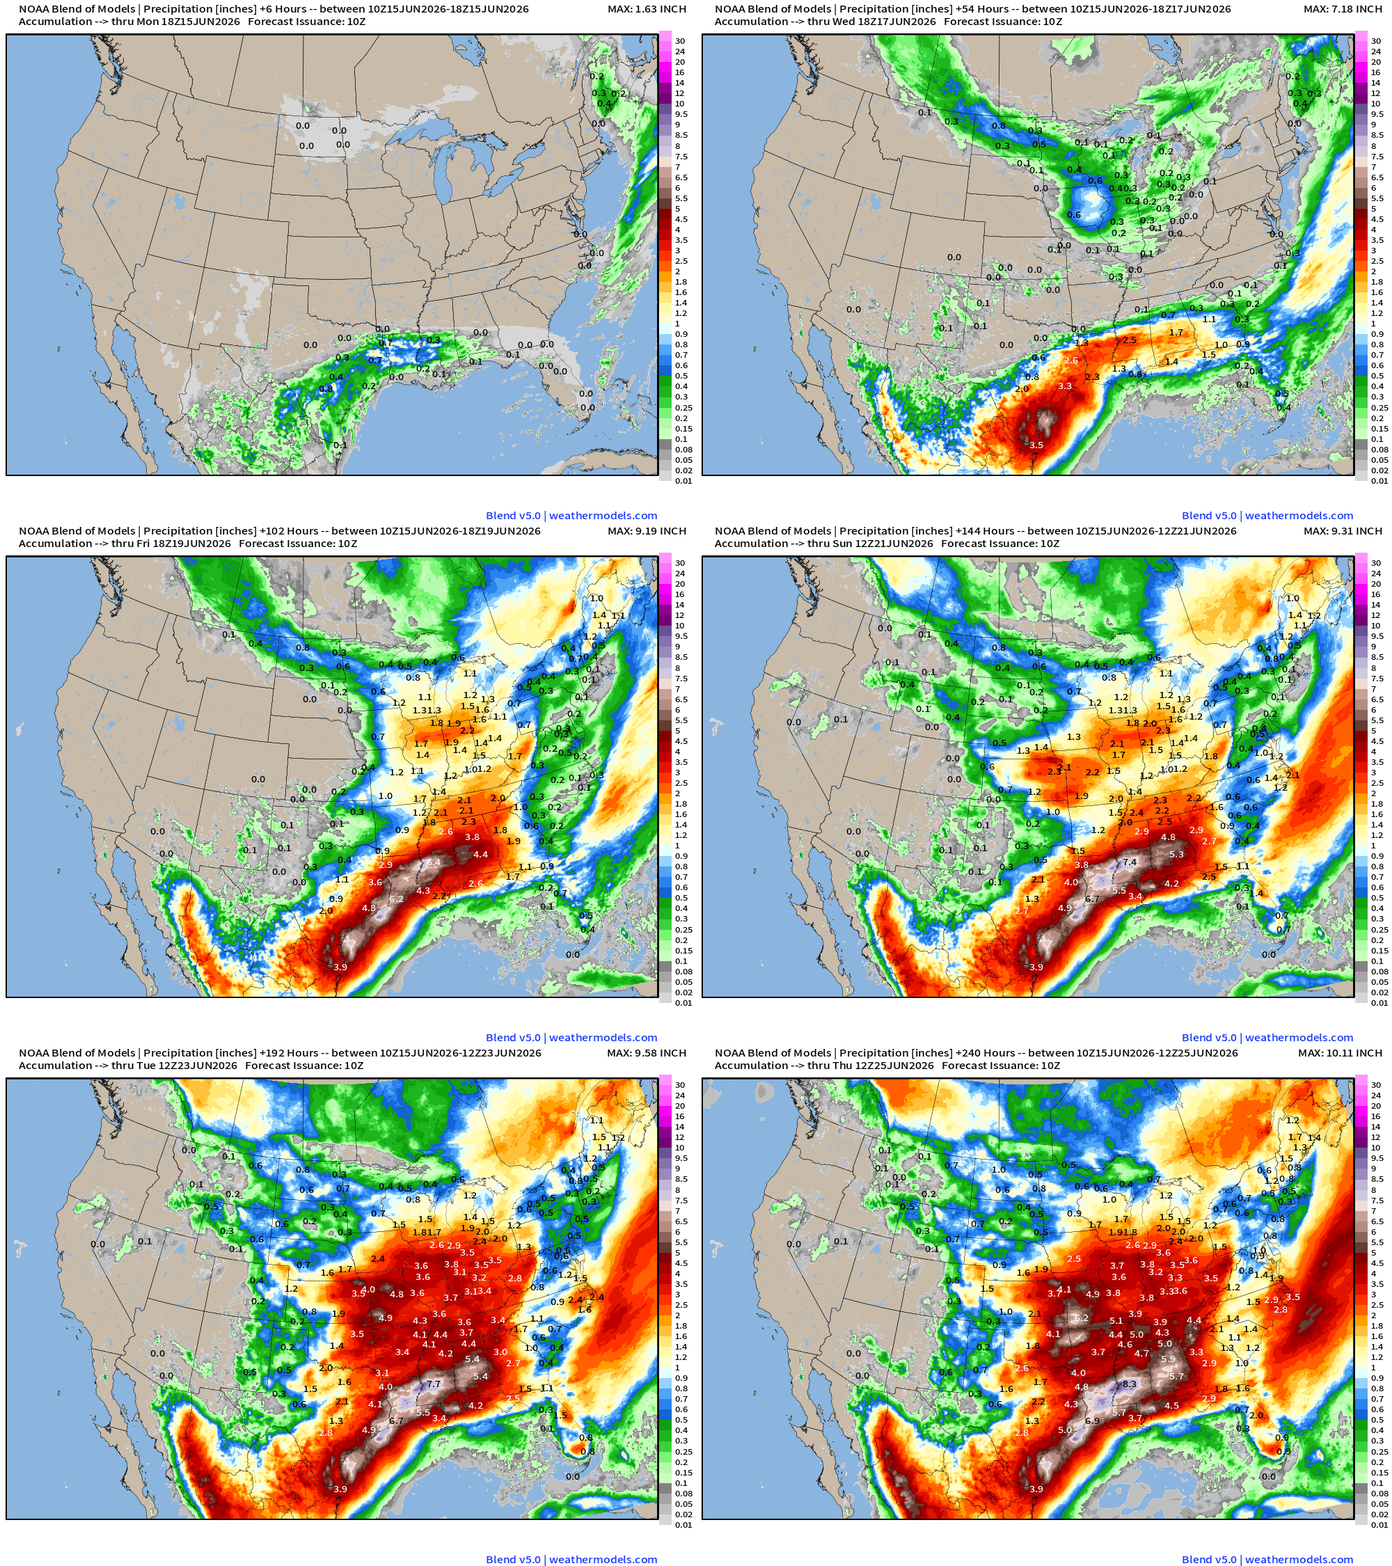
Regardless of any “named storm” development [NHC at 30%] the deep tropical moisture will inundate the coast and deliver “boatloads” — upwards of 4”-6”+ from Texas into the Mississippi River Valley over next 7-days.
Very soggy pattern!
Help Support these posts (now nearing 1,000!) —> June 2026 Coupon
ECMWF Cyclonic Vorticity — next 5-days
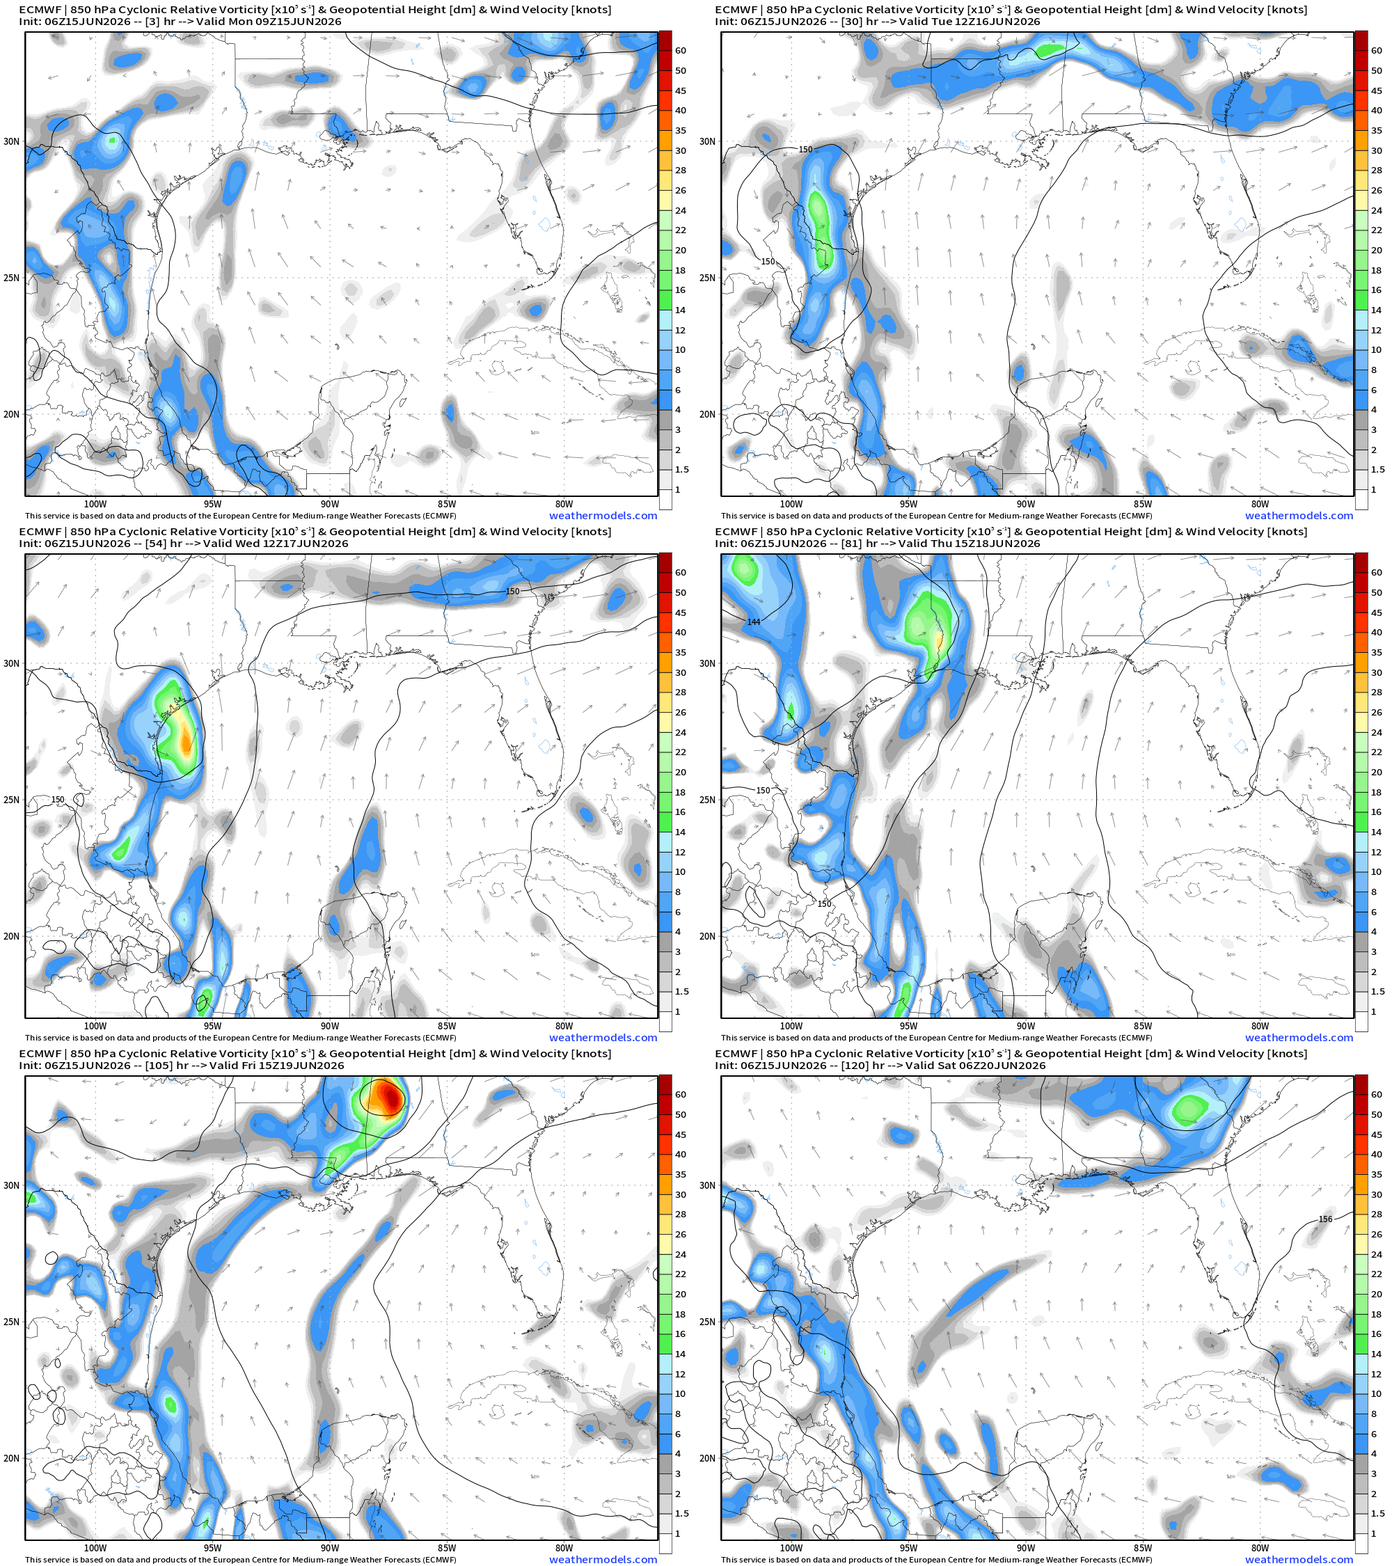
Nice way to show the low-level circulation of the “tropical disturbance” moving on land over Mexico to South Texas and then northward up the coast to Houston.
Uncertainty — track and intensity:
If the system drifts just east over the warm Gulf of Mexico (America) for even 12-24 hours, then significant tropical cyclone development would occur — from mid-range TS to even a hurricane (outlier event) —> always a very fine line between a LOT happening and NOT much.
Even without a named or numbered system — tropical storm rainfall amounts will impact a large population and area!
Integrated Vapor Transport — Next 6-days
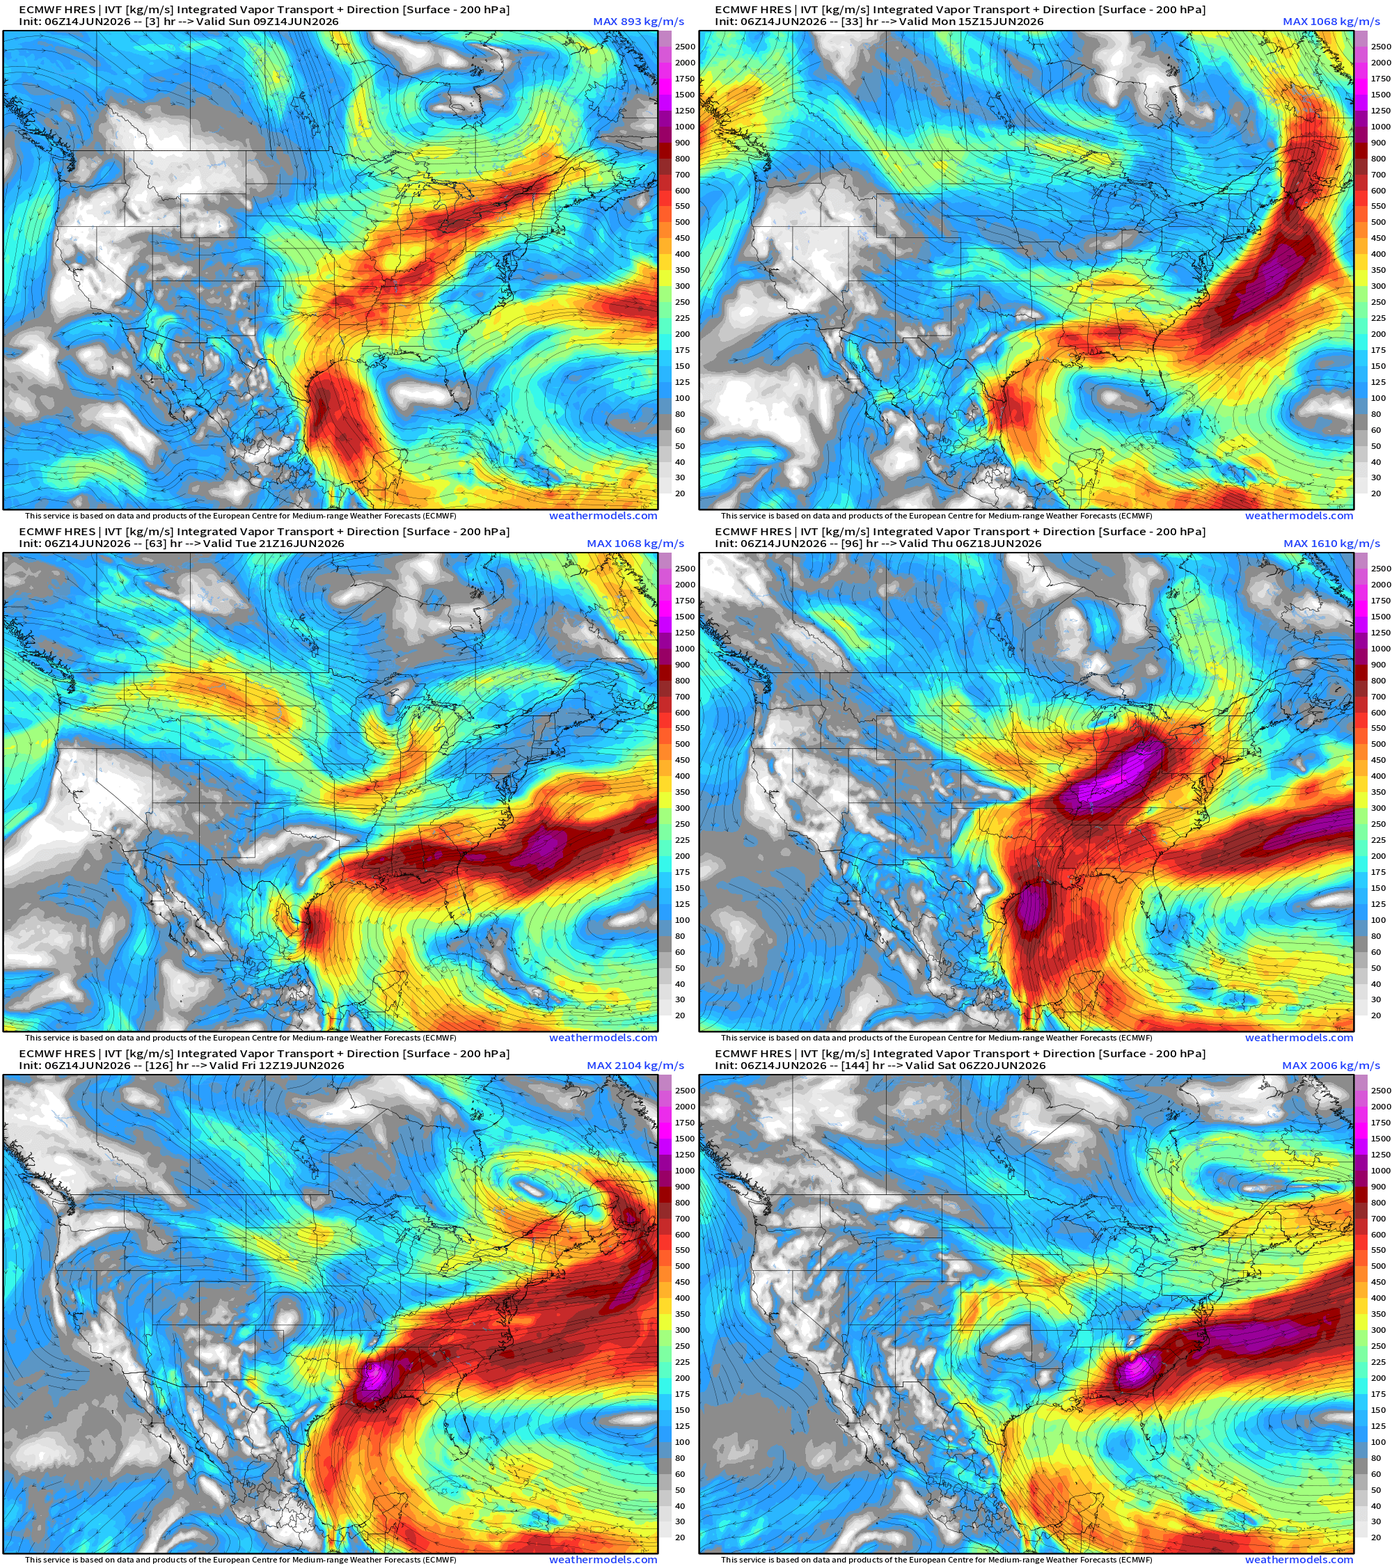
The deep layer tropical moisture plume is pulled northward … with the circulation of the tropical low embedded … and then it all shifts eastward beneath a strong Canadian trough.
The influence of the mid-latitude weather system (strong trough for mid-June) will provide upper-level jet stream energy to provide a “baroclinic kick” to the tropical disturbance OVER land.
This unusual situation can occur when a surface low encounters the jet stream quadrant (right rear) and phases to increase convergence and ascent —> intensification of the surface circulation.
ECMWF 06z | Precipitable Water | My Favorite Parameter
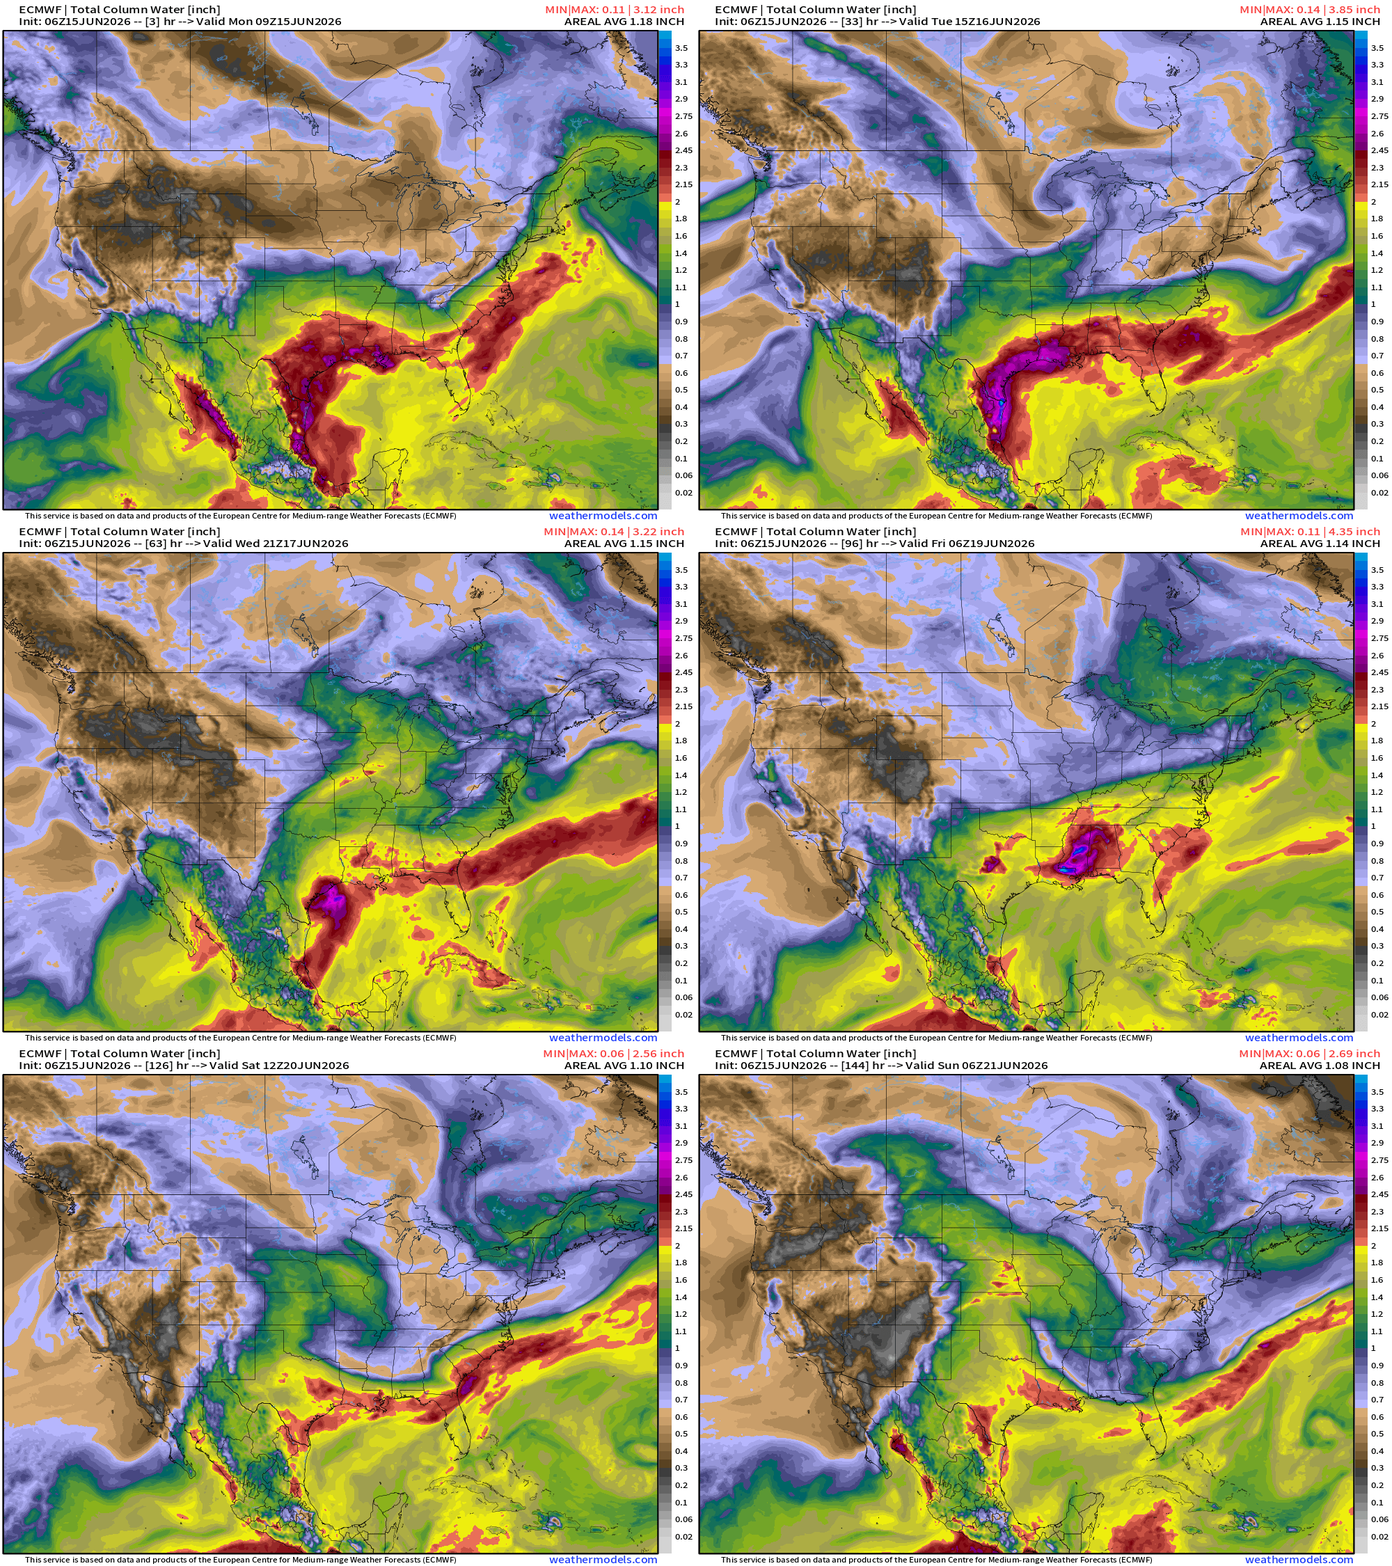
The red PWAT > 2” and even some 3” to 4” areas embedded within the tropical low. Note how the system retains its circulation / coherence while within the frontal boundary draped along the Deep South / Gulf coast.
This is a recipe for HUGE rainfall totals with daytime heating + tropical moisture.
Zooming Out on Atlantic
Flagship model: ECMWF AIFS 06z —> Integrated Vapor Transport next 10-days
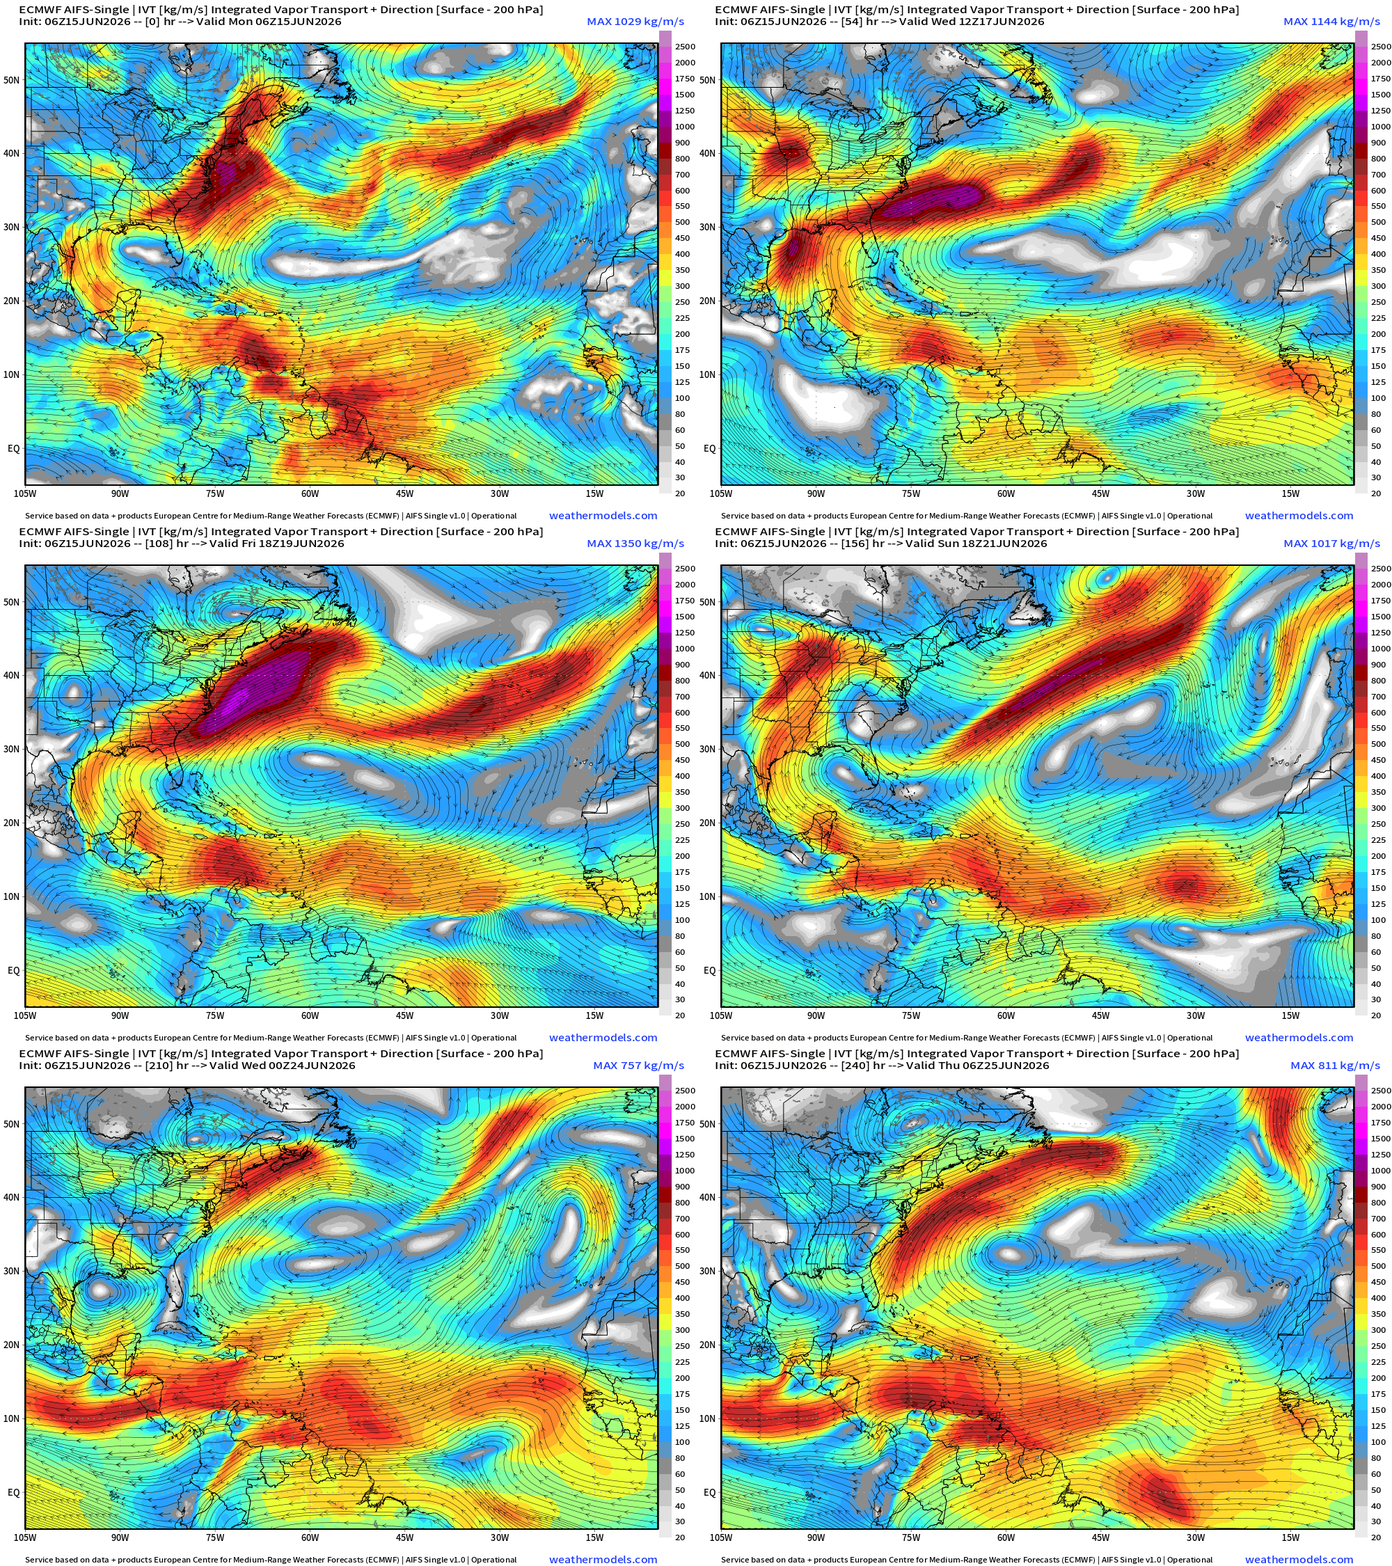
The tropical moisture plume finally breaks down into the Gulf and southern U.S. when a chunk or westward extension of the Bermuda high moves westward to dominate the Gulf of Mexico with high pressure … but until then, 7-days of deep layer tropical moisture right into the Texas and the Deep South —> rainfall
Saharan Air — African Dust Next 10-days
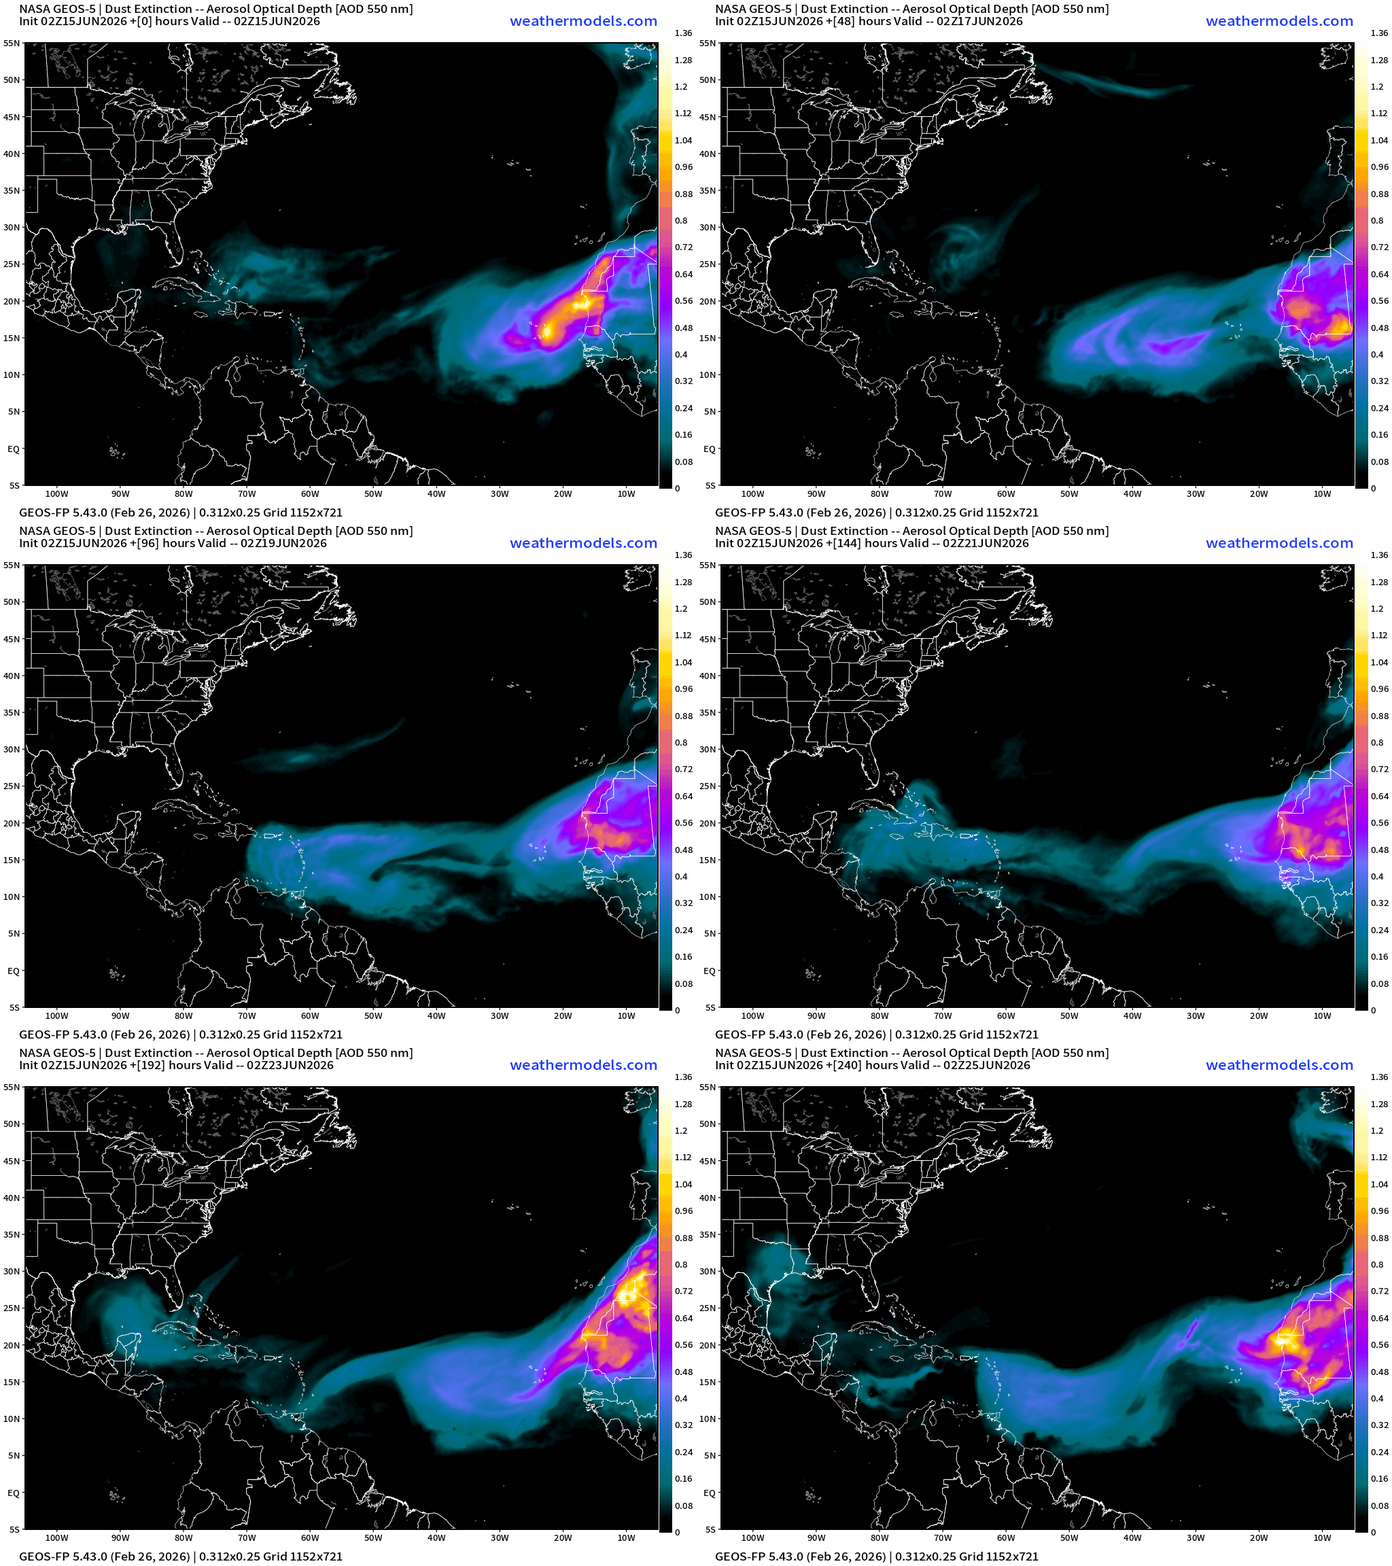
A moderate Dust Layer (with Saharan Air) moving across the Main Development Region — and will reach the Caribbean in 3-4 days before decaying/wringing out with gravity and some convection/storms. Another SAL emerges in 5-6 days to repeat the pattern — typical for mid-to-late June.
Sea Surface Temperatures + Anomaly | Atlantic
The eastern Atlantic much cooler than normal < 26°C (green actual SST map) and blue anomaly (chilly) —> signal for stability and difficulty sustaining tropical convection = no storm development and squelching of tropical waves.
Global SST Anomaly
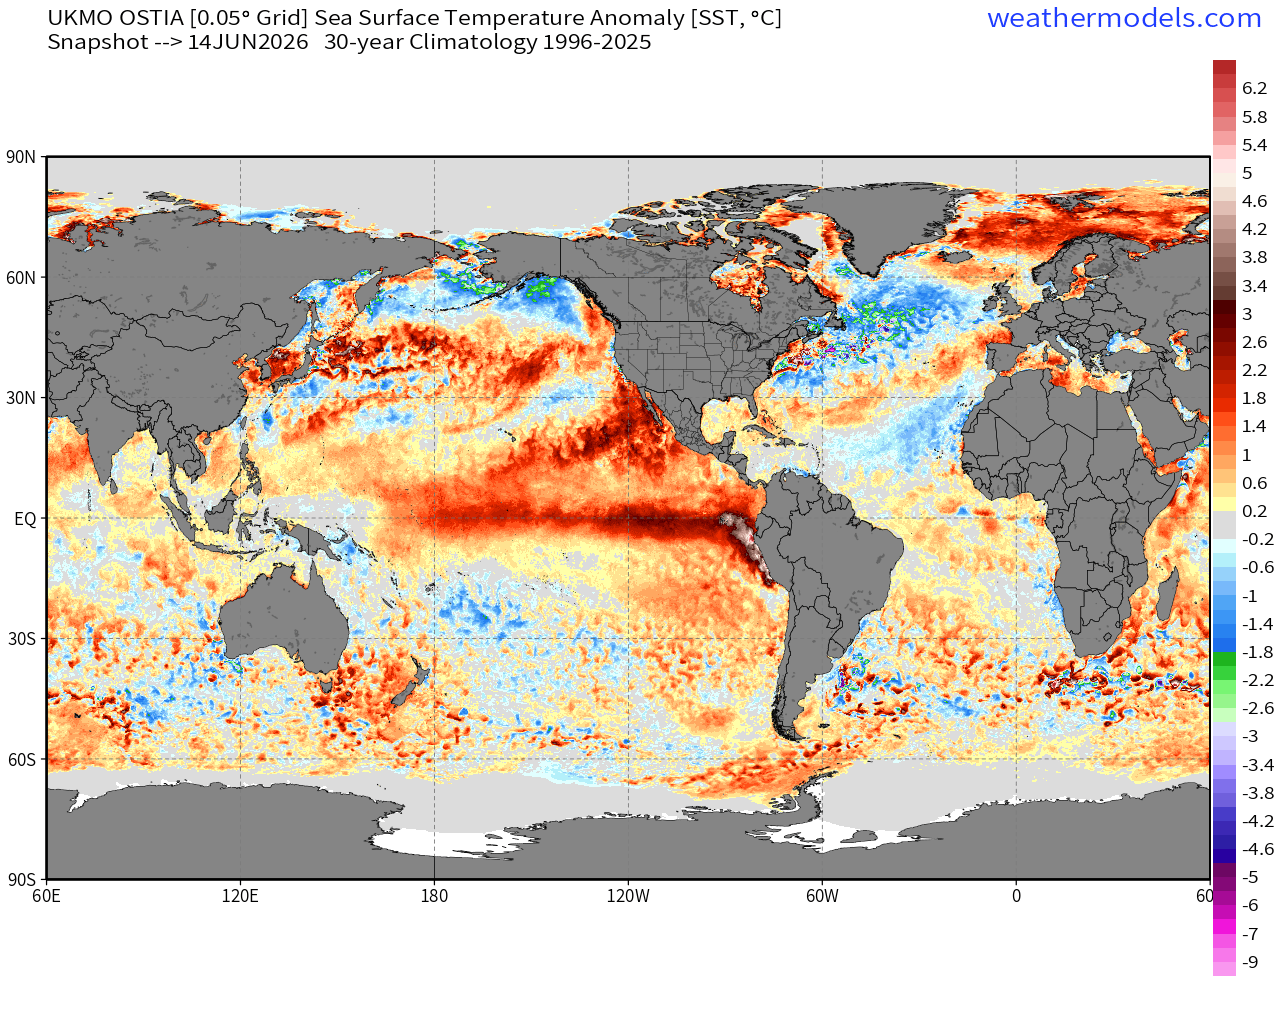
El Niño underway! Check out the very warm SST anomaly along the equatorial Pacific
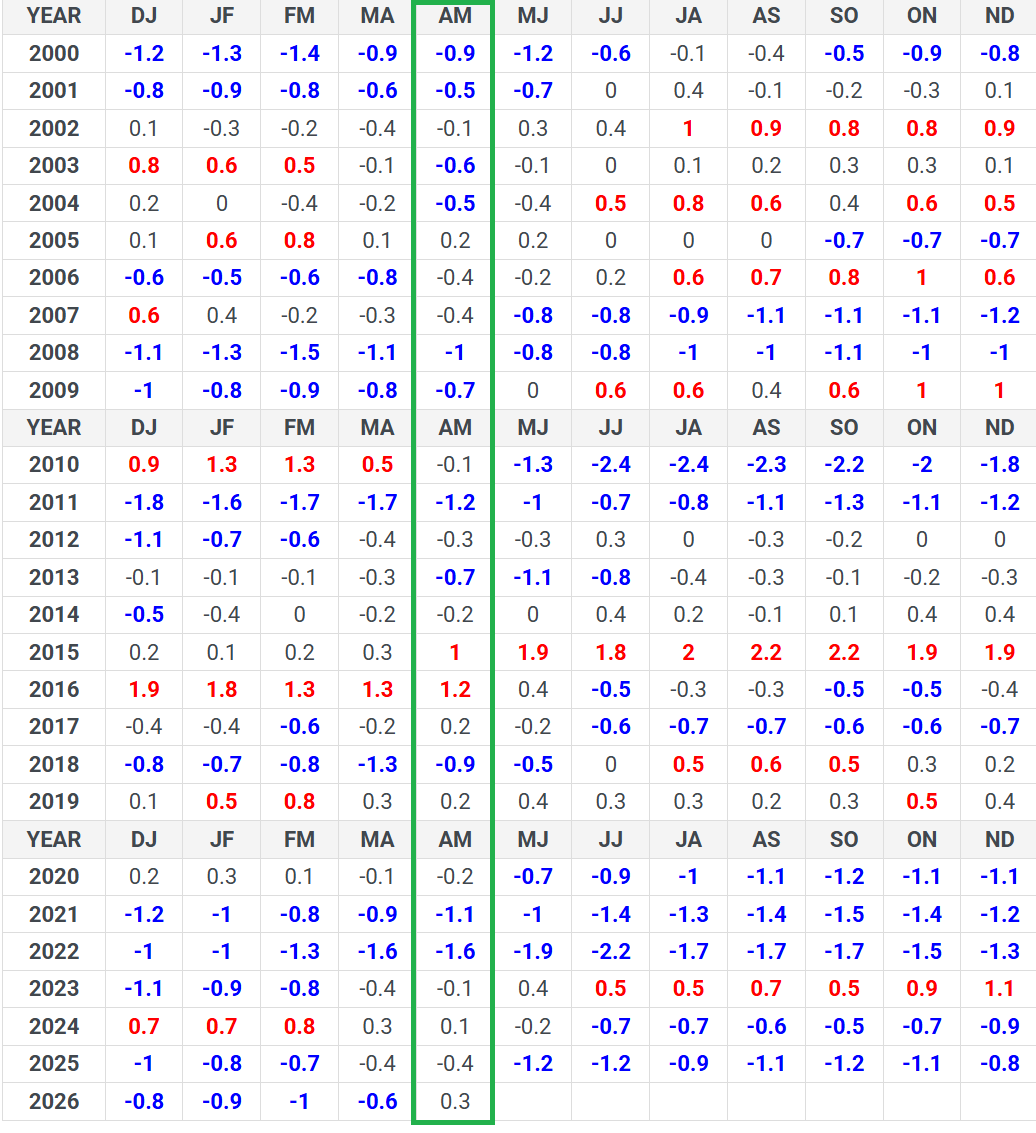
Multivariate ENSO Index (v2) Rises / Warms
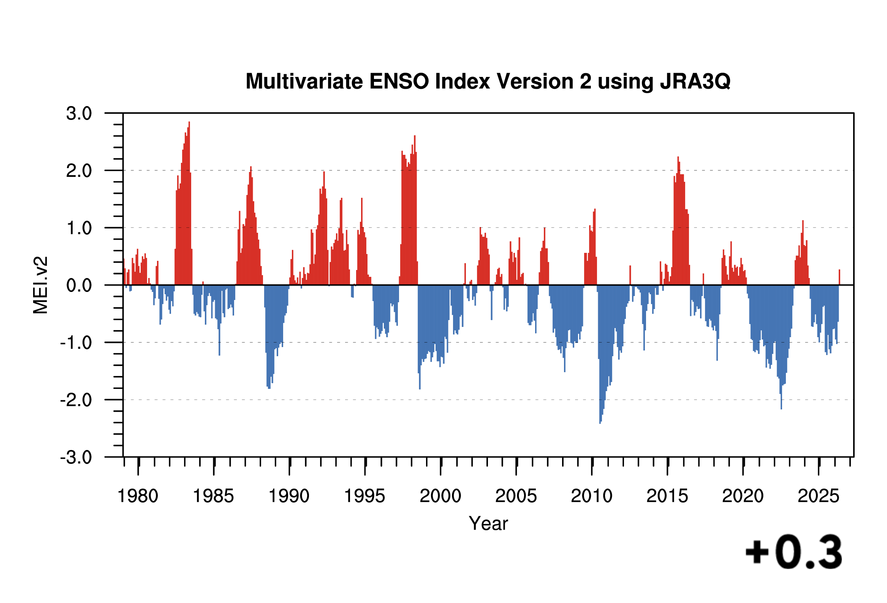
MEIv2 rises from -0.6 to +0.3 in most recent update —> large shift to El Nino on monthly time scale.
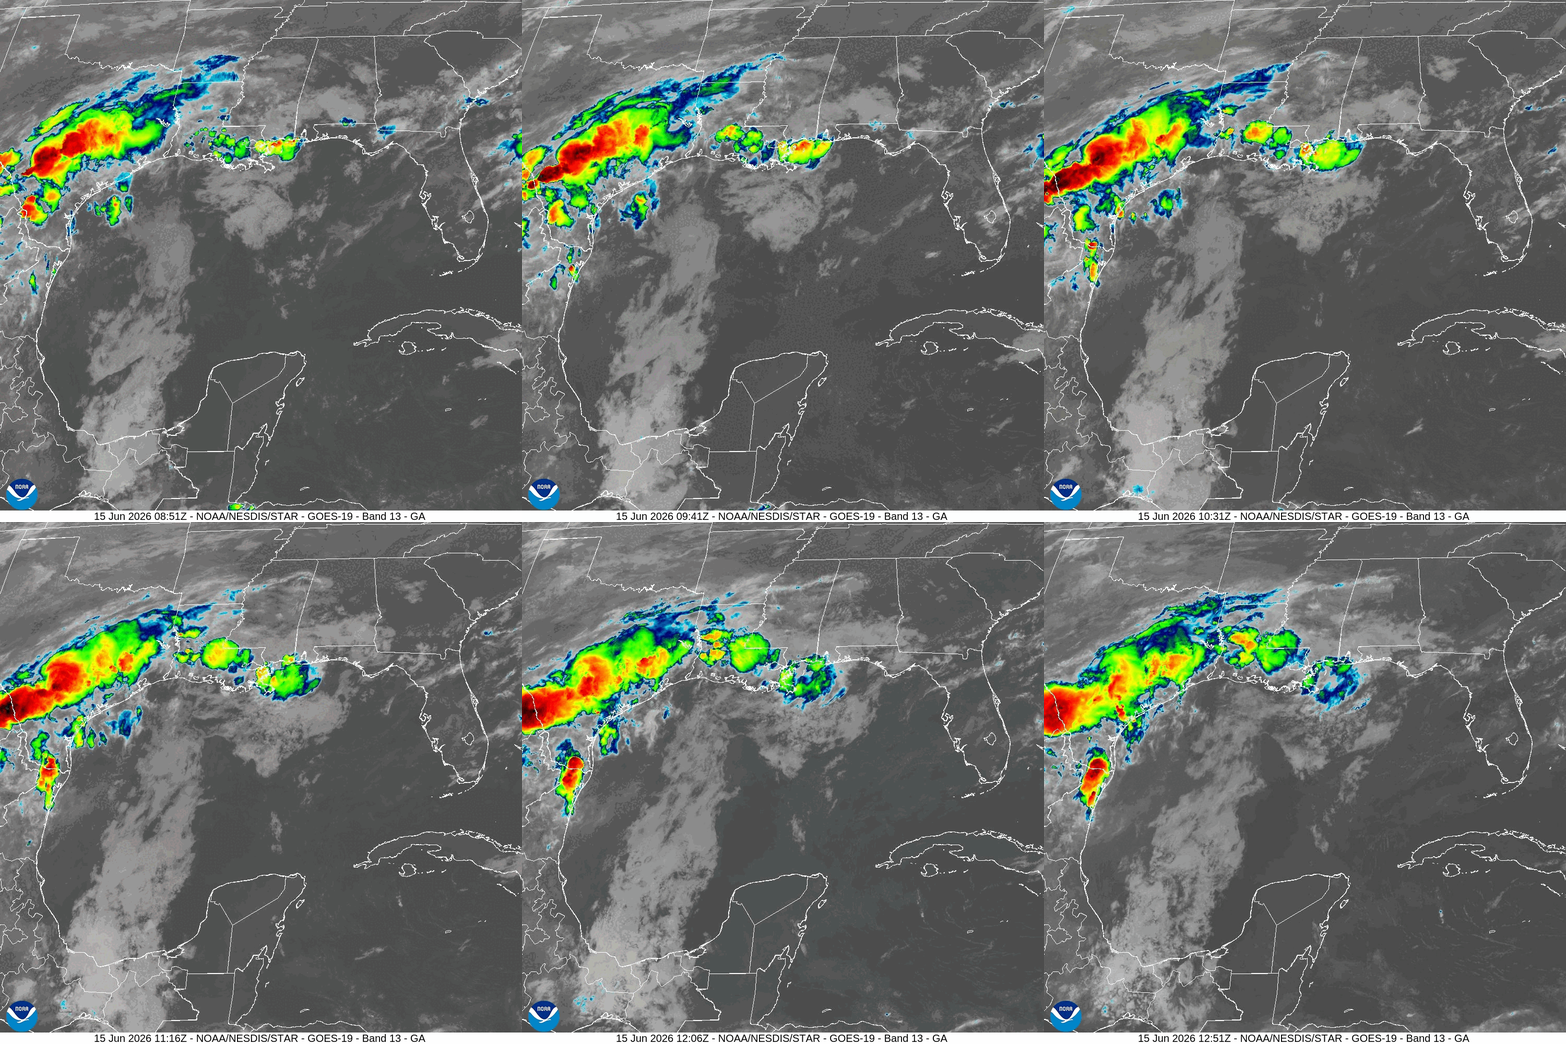
NHC —> 30% chance of Development
Saharan Air Layer highly apparent in the Satellite Imagery — dry and warm!
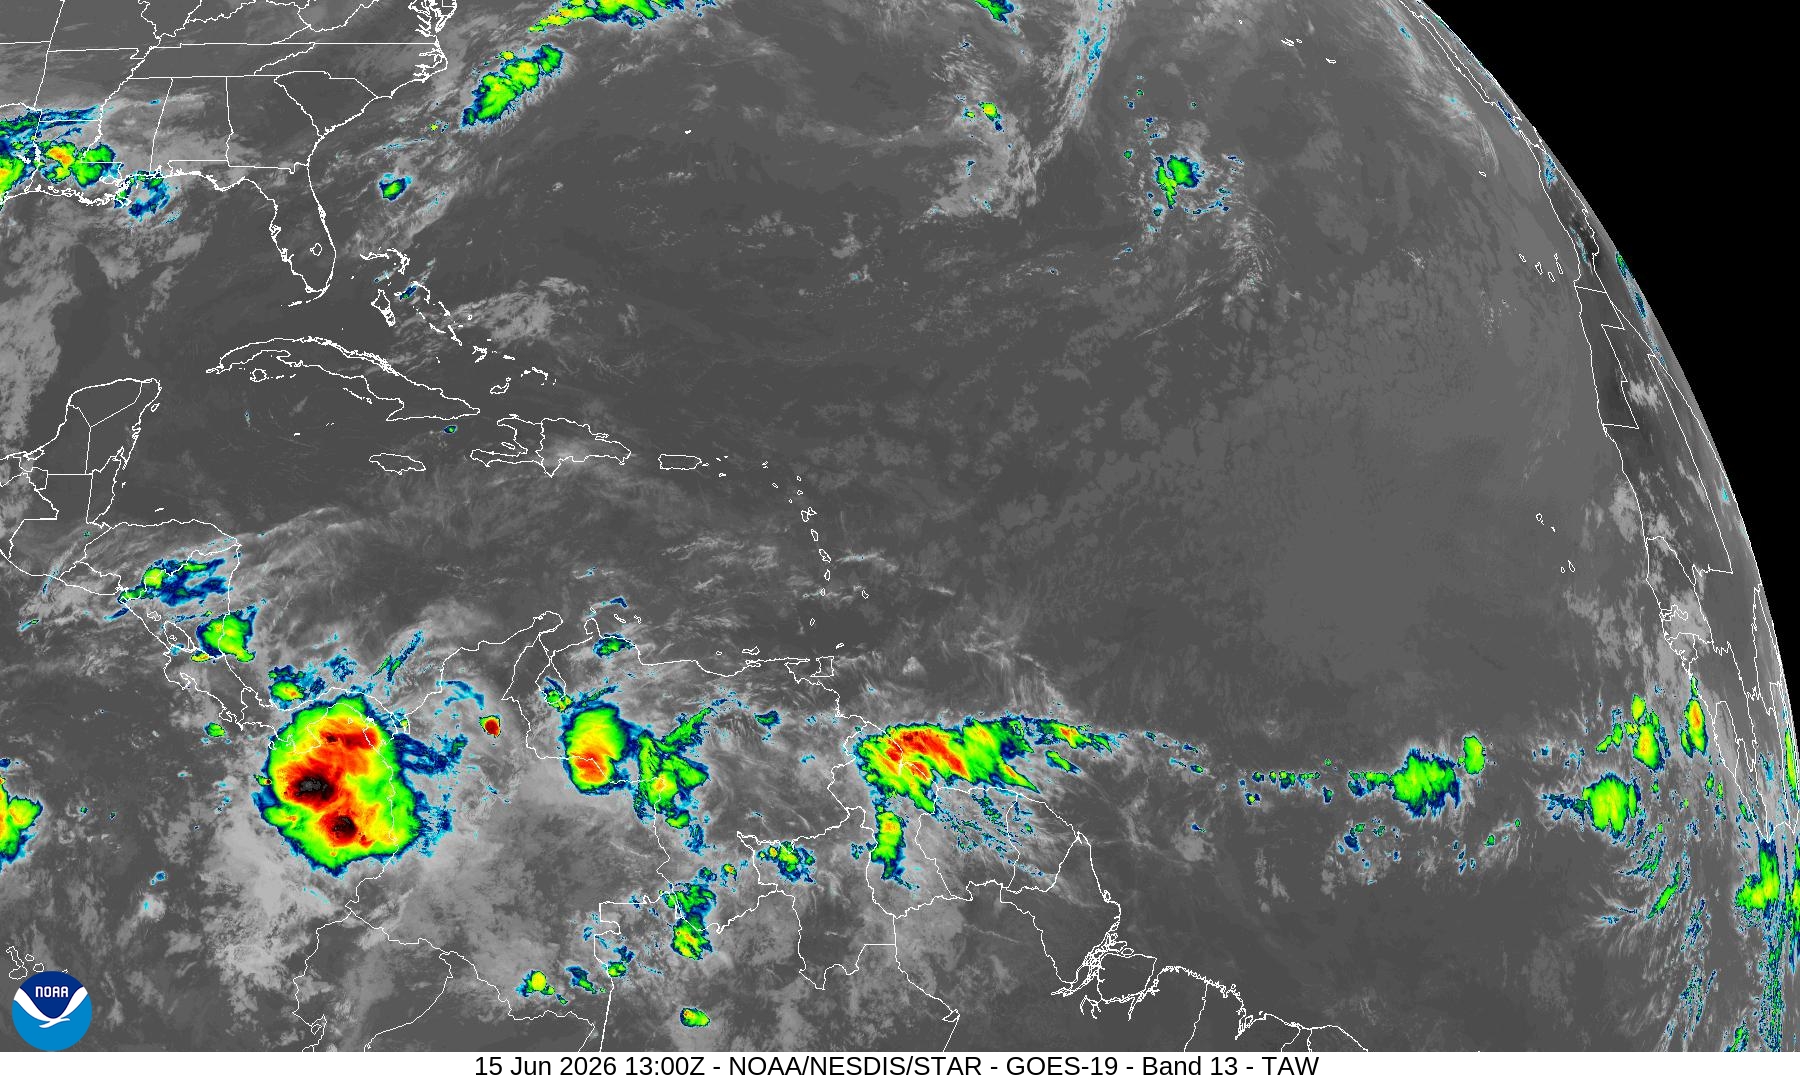
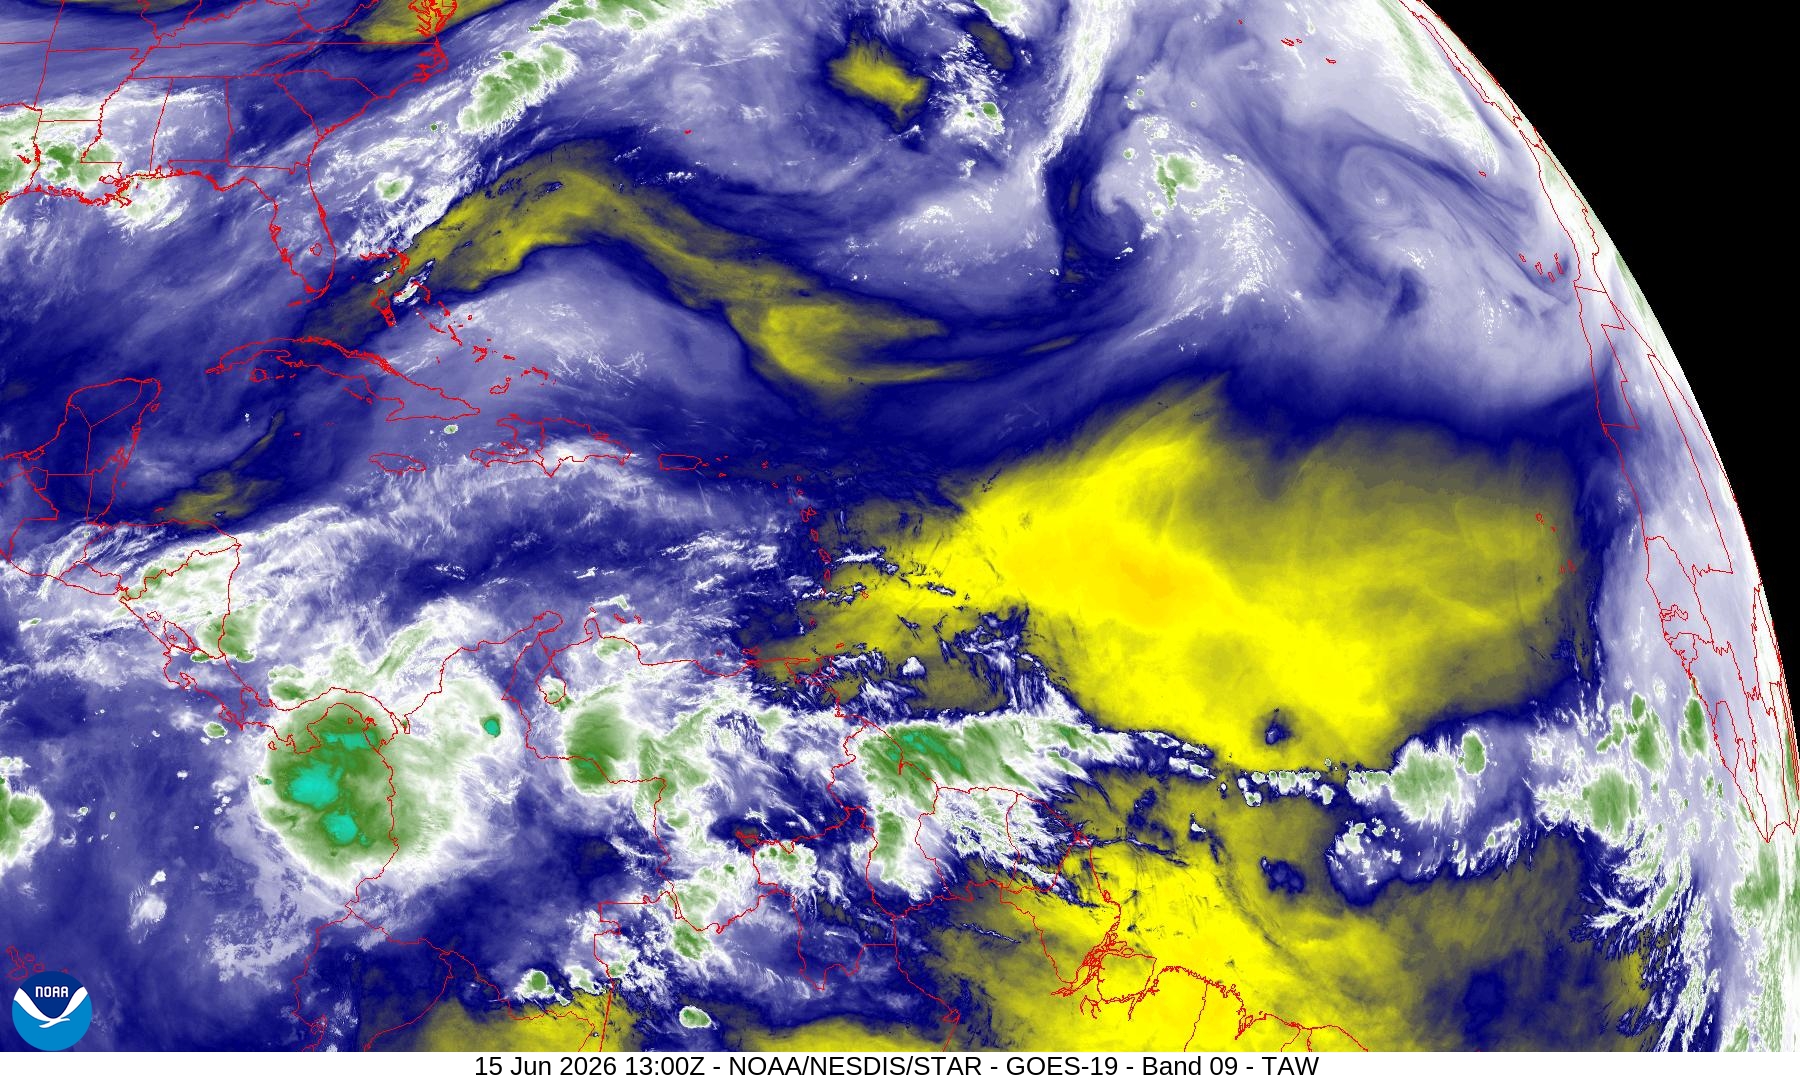
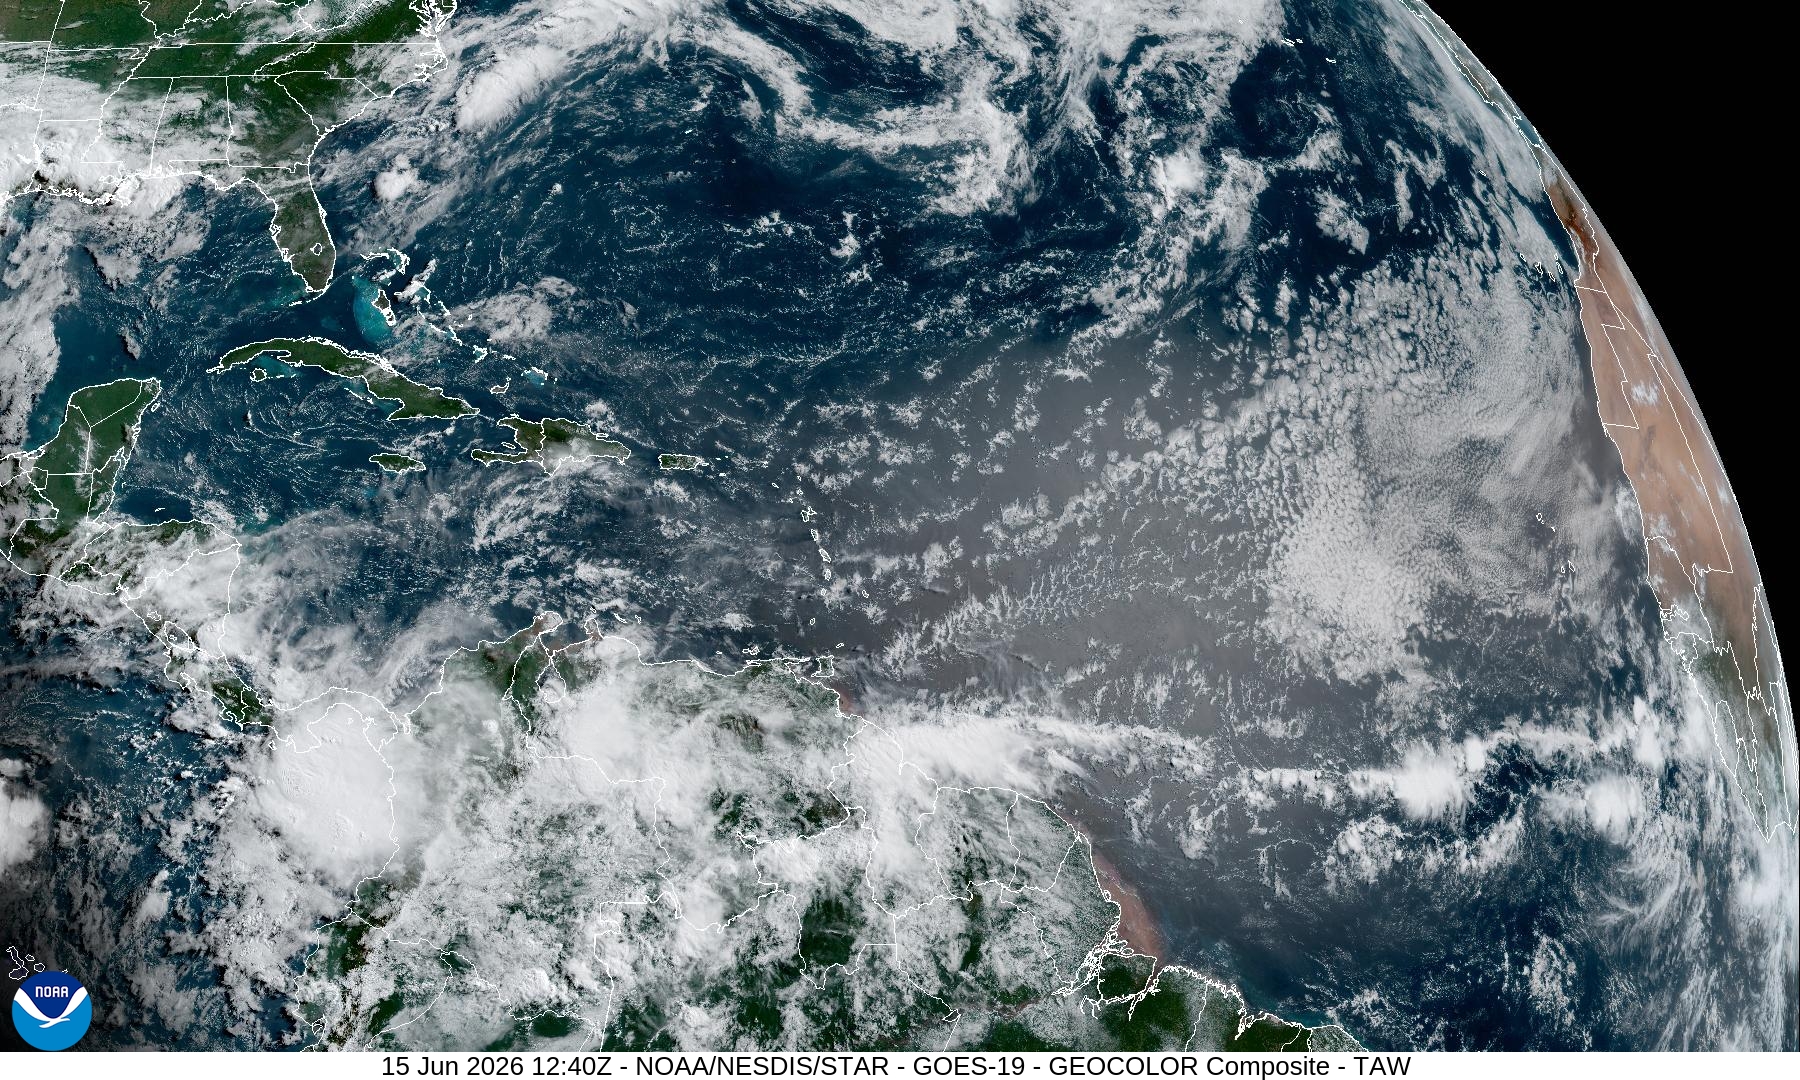
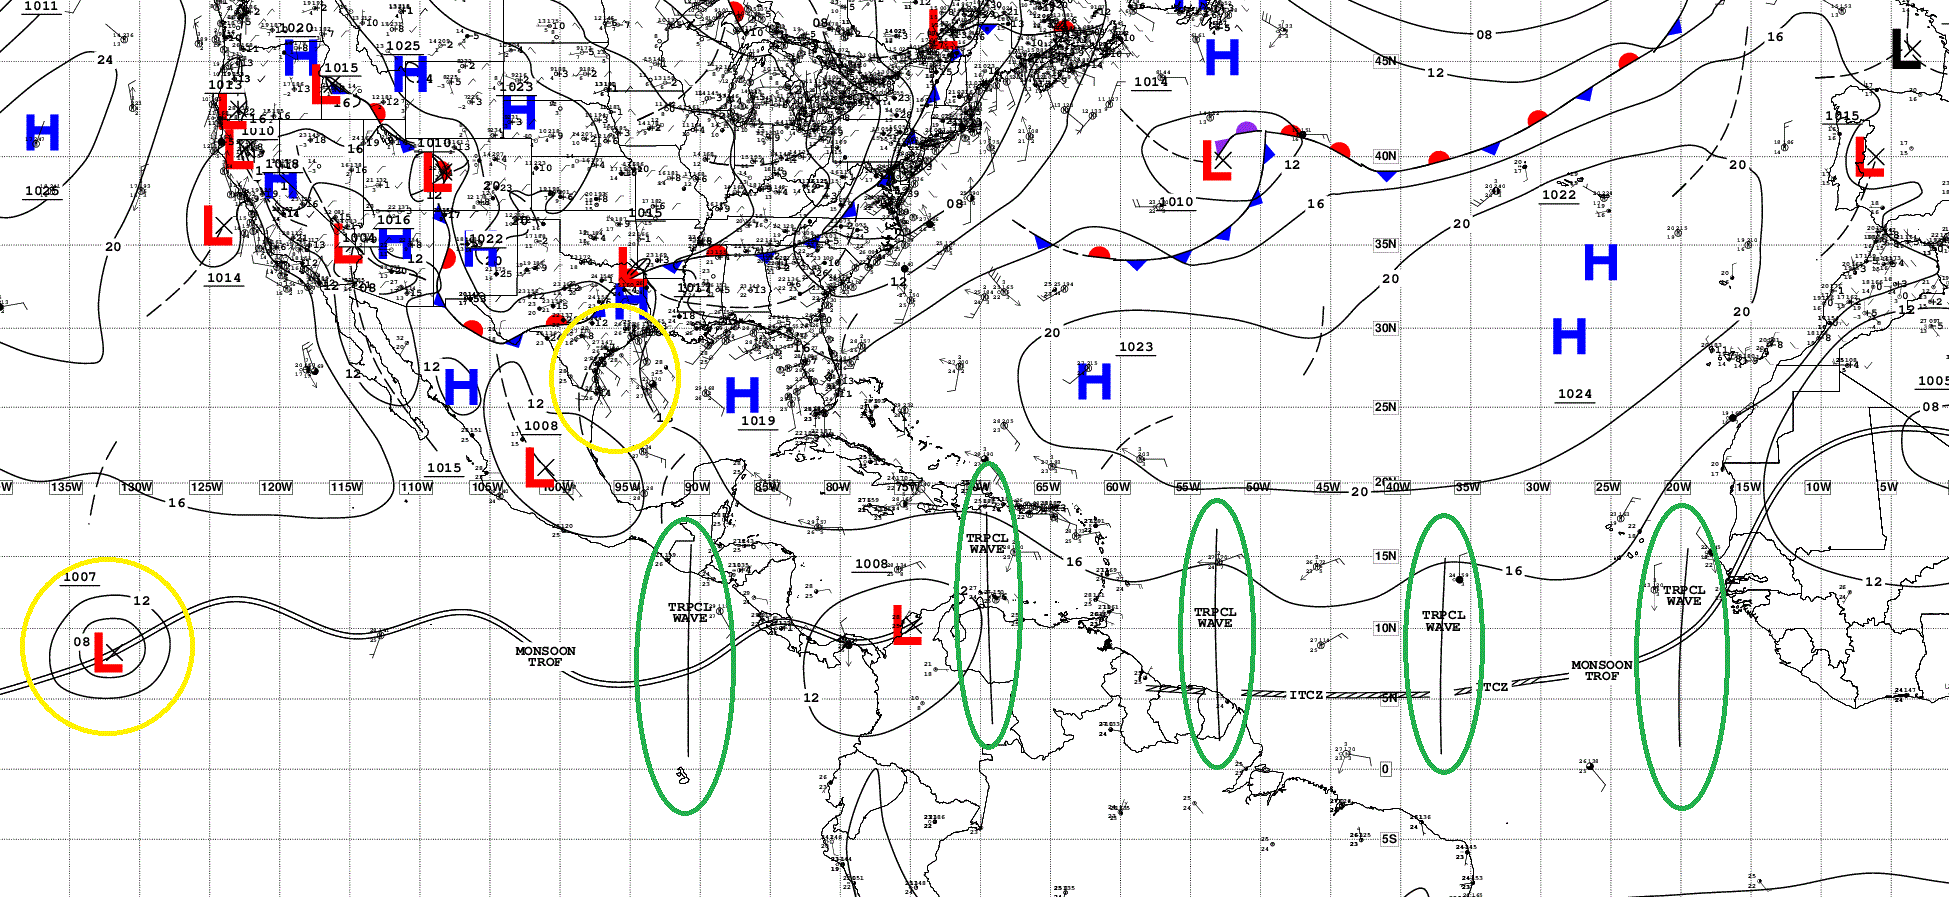
Tropical Wave Analysis: n = 4 in Atlantic + 1 in Eastern Pacific = none developing.
HUGE Rainfall Totals for mid-June
Blend of Models —> Precipitation Next 9-days
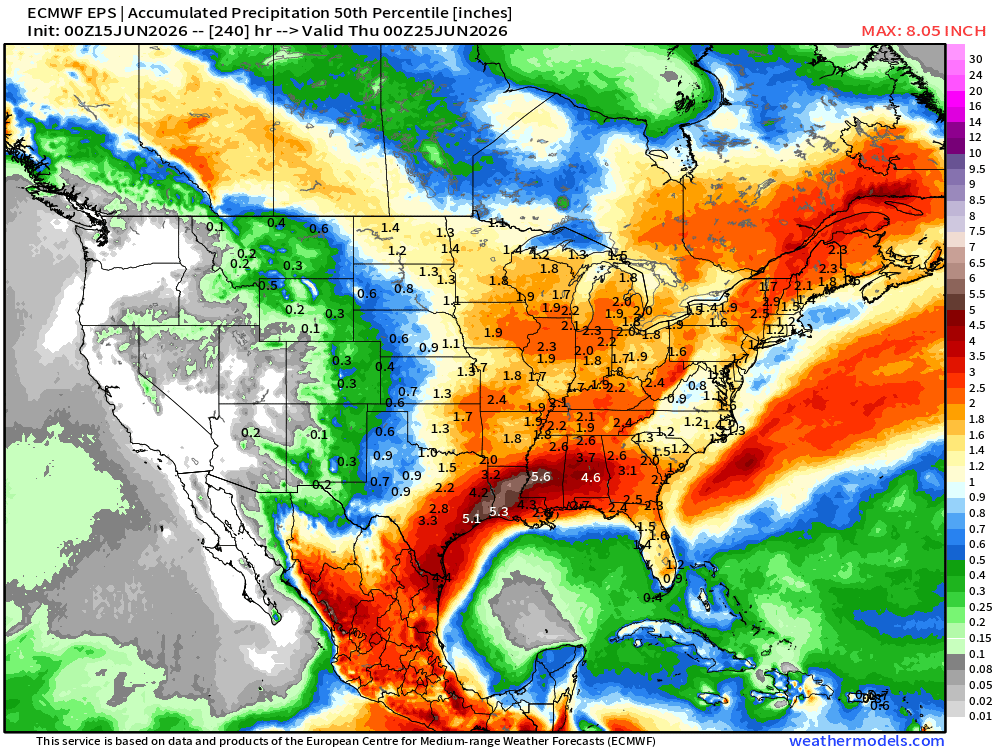
10-day ECMWF Ensemble Median (middle of distribution at each model grid point)
ECMWF 06z | Precipitation + MSLP | Next 6-days
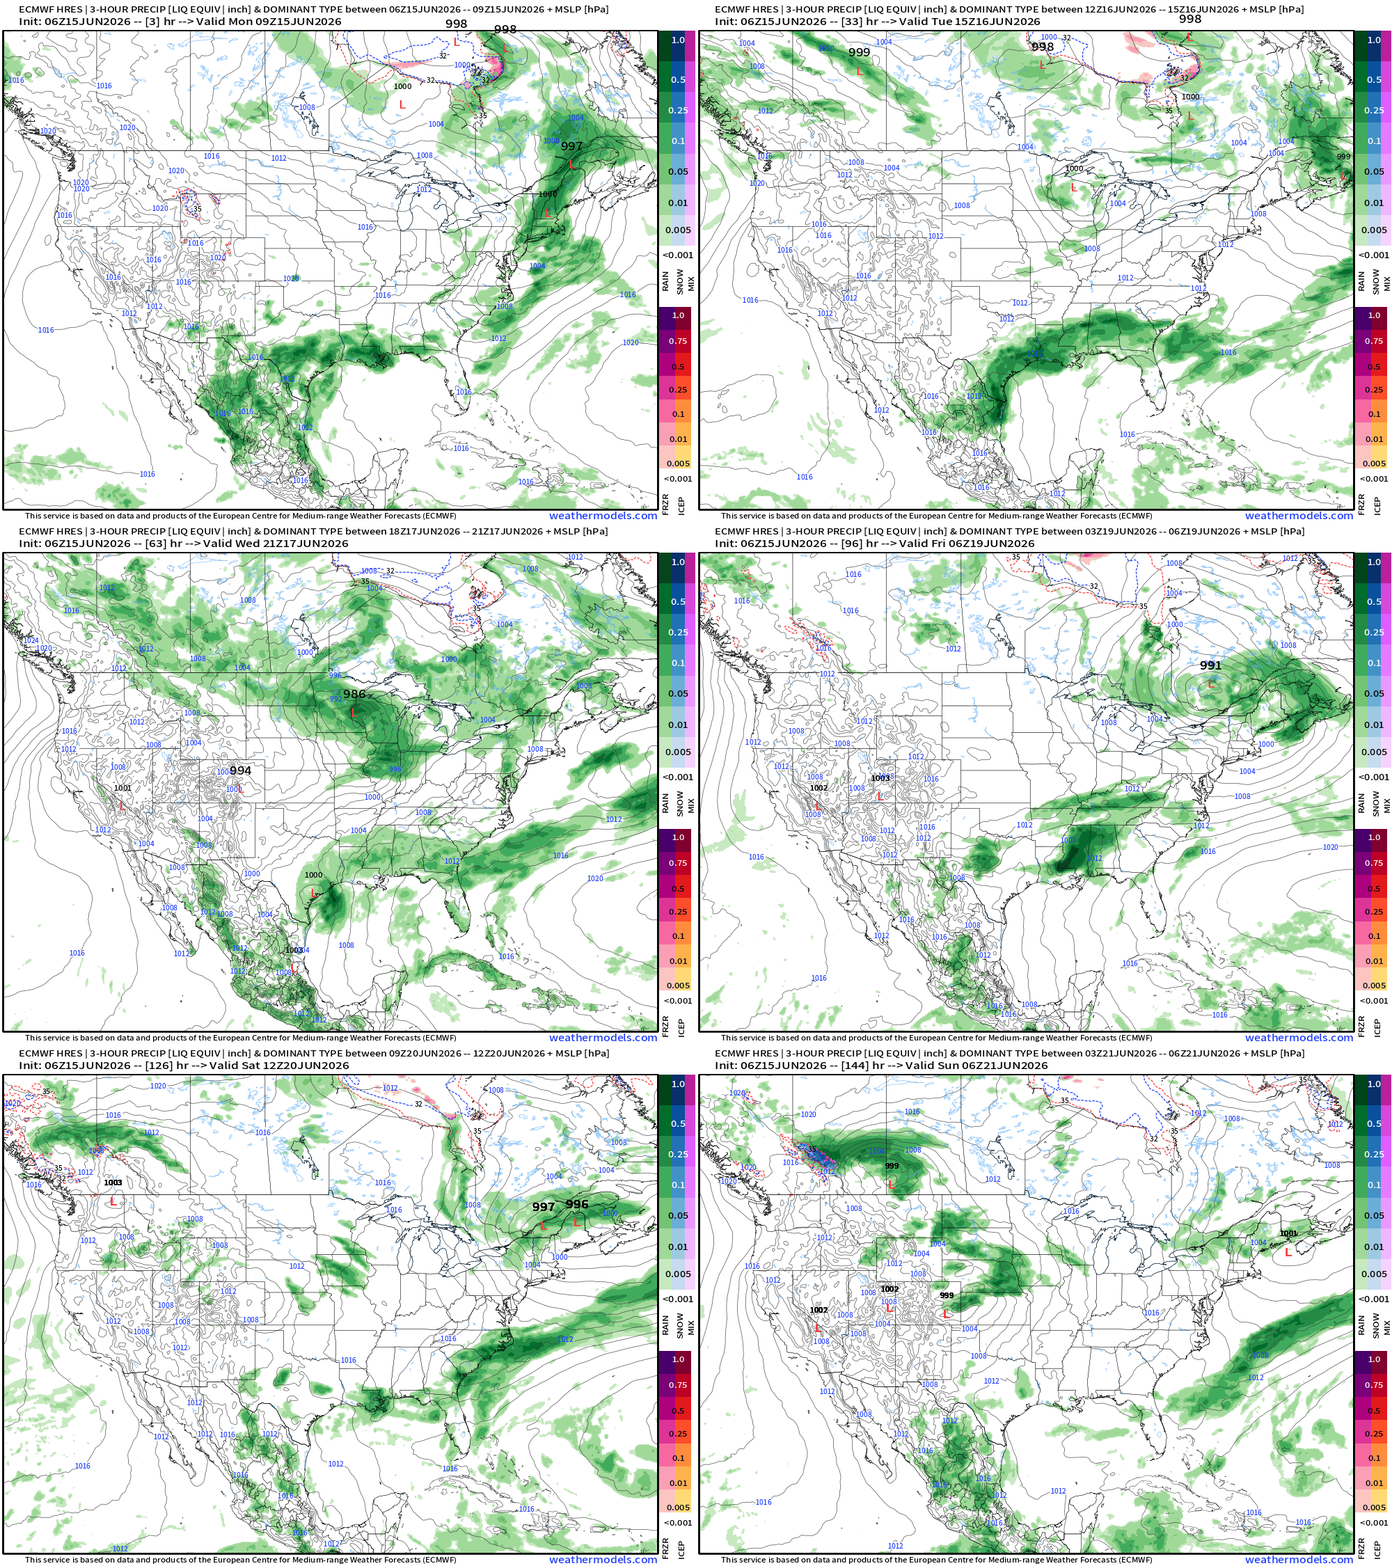
Surface low ~1000 mb does develop right along the Texas coast — we’ll see if it can emerge over the open ocean waters!
Weather Pattern: 500 mb Height Anomaly | AIFS-Single Next 10-days
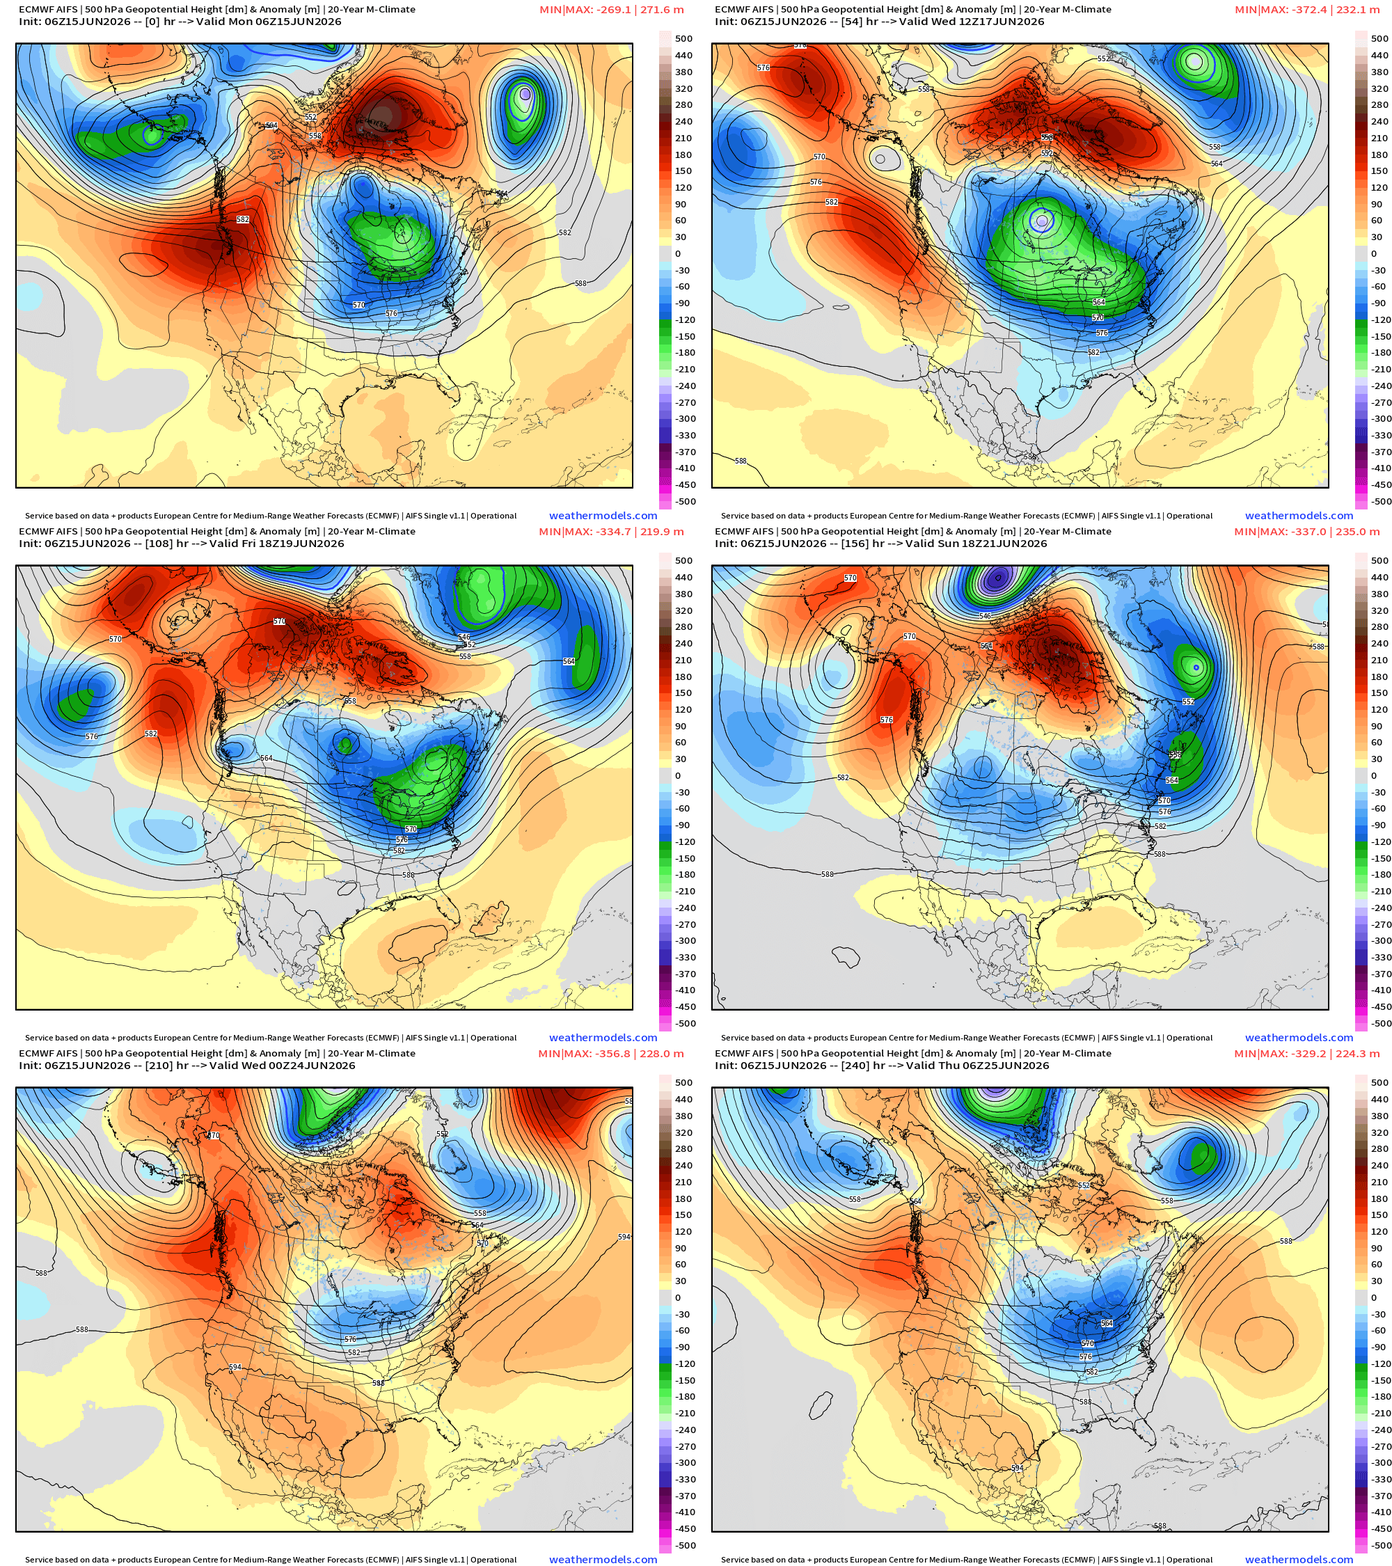
Very strong mid-level trough maintains its grip on the Midwest and Great Lakes for the next 10-days. The flow out of the Northwest is straight from the Arctic = cool and dry … very intense trough for mid-June.
A Pacific origin trough swoops into the replace the Canadian vortex into next weekend.
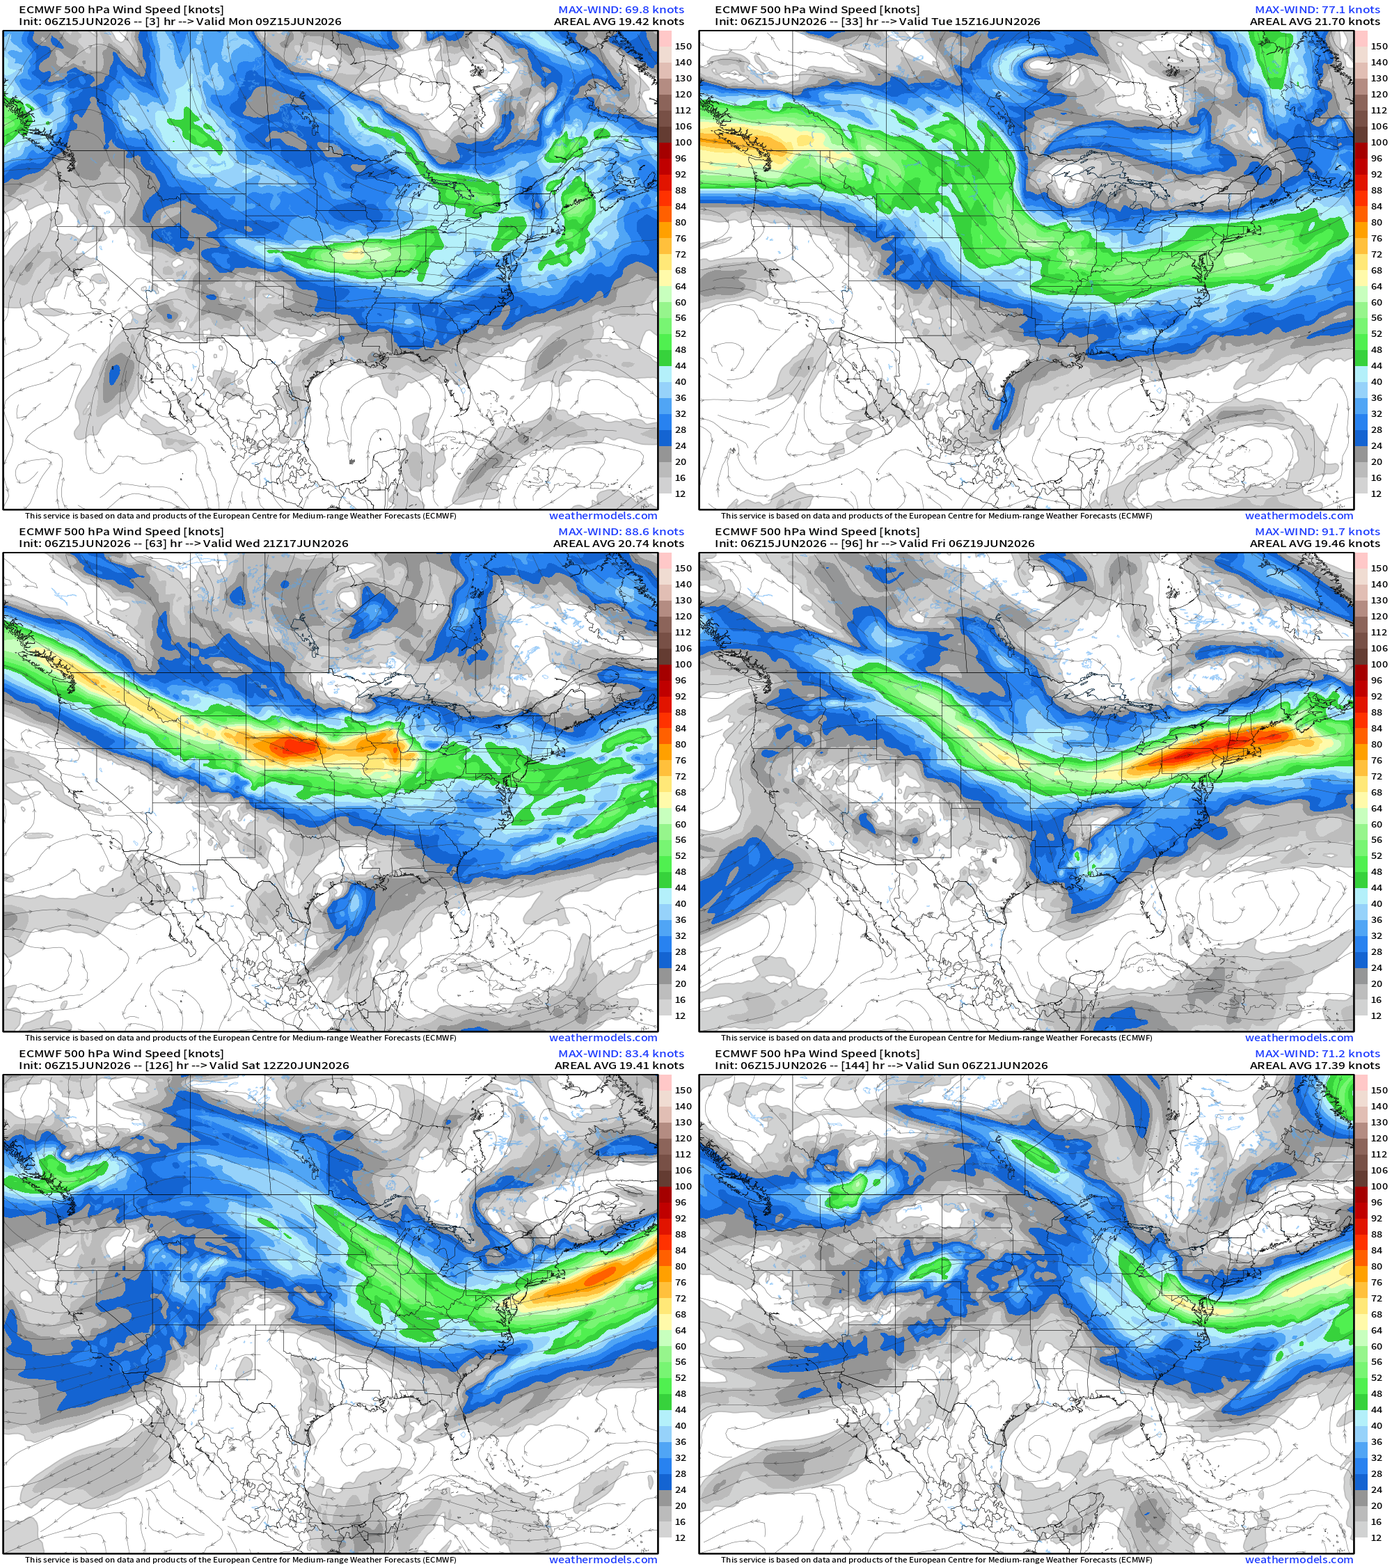
500-mb Wind Speed + streamlines
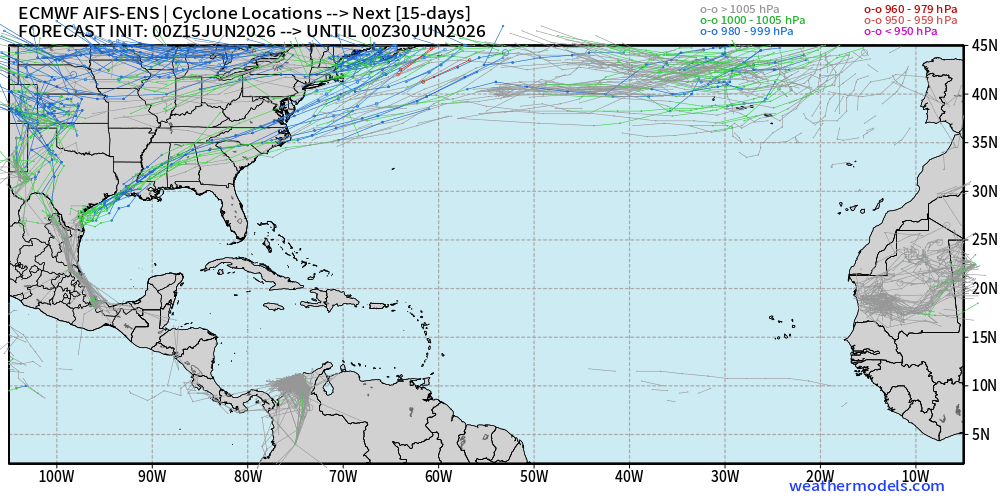
Next 15-days AIFS Ensemble Storm Tracks —> aside from NW Gulf near coast of Texas —> complete ghost town through end of June
Eastern Pacific — One area of interest Invest 93E (30% chance)
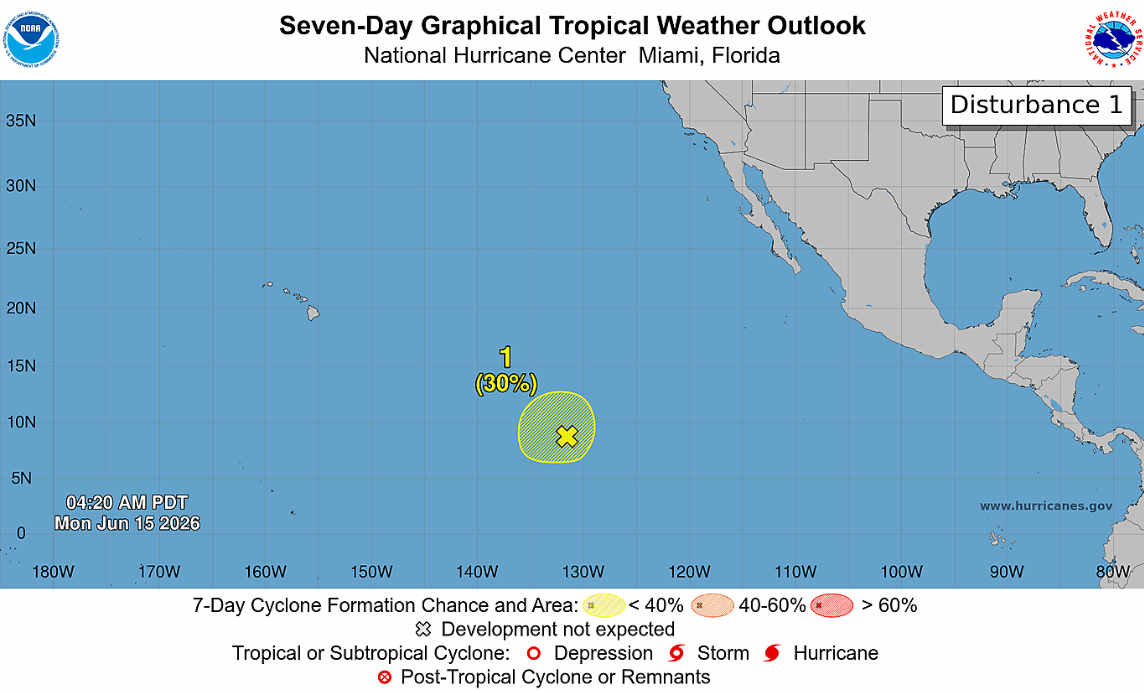
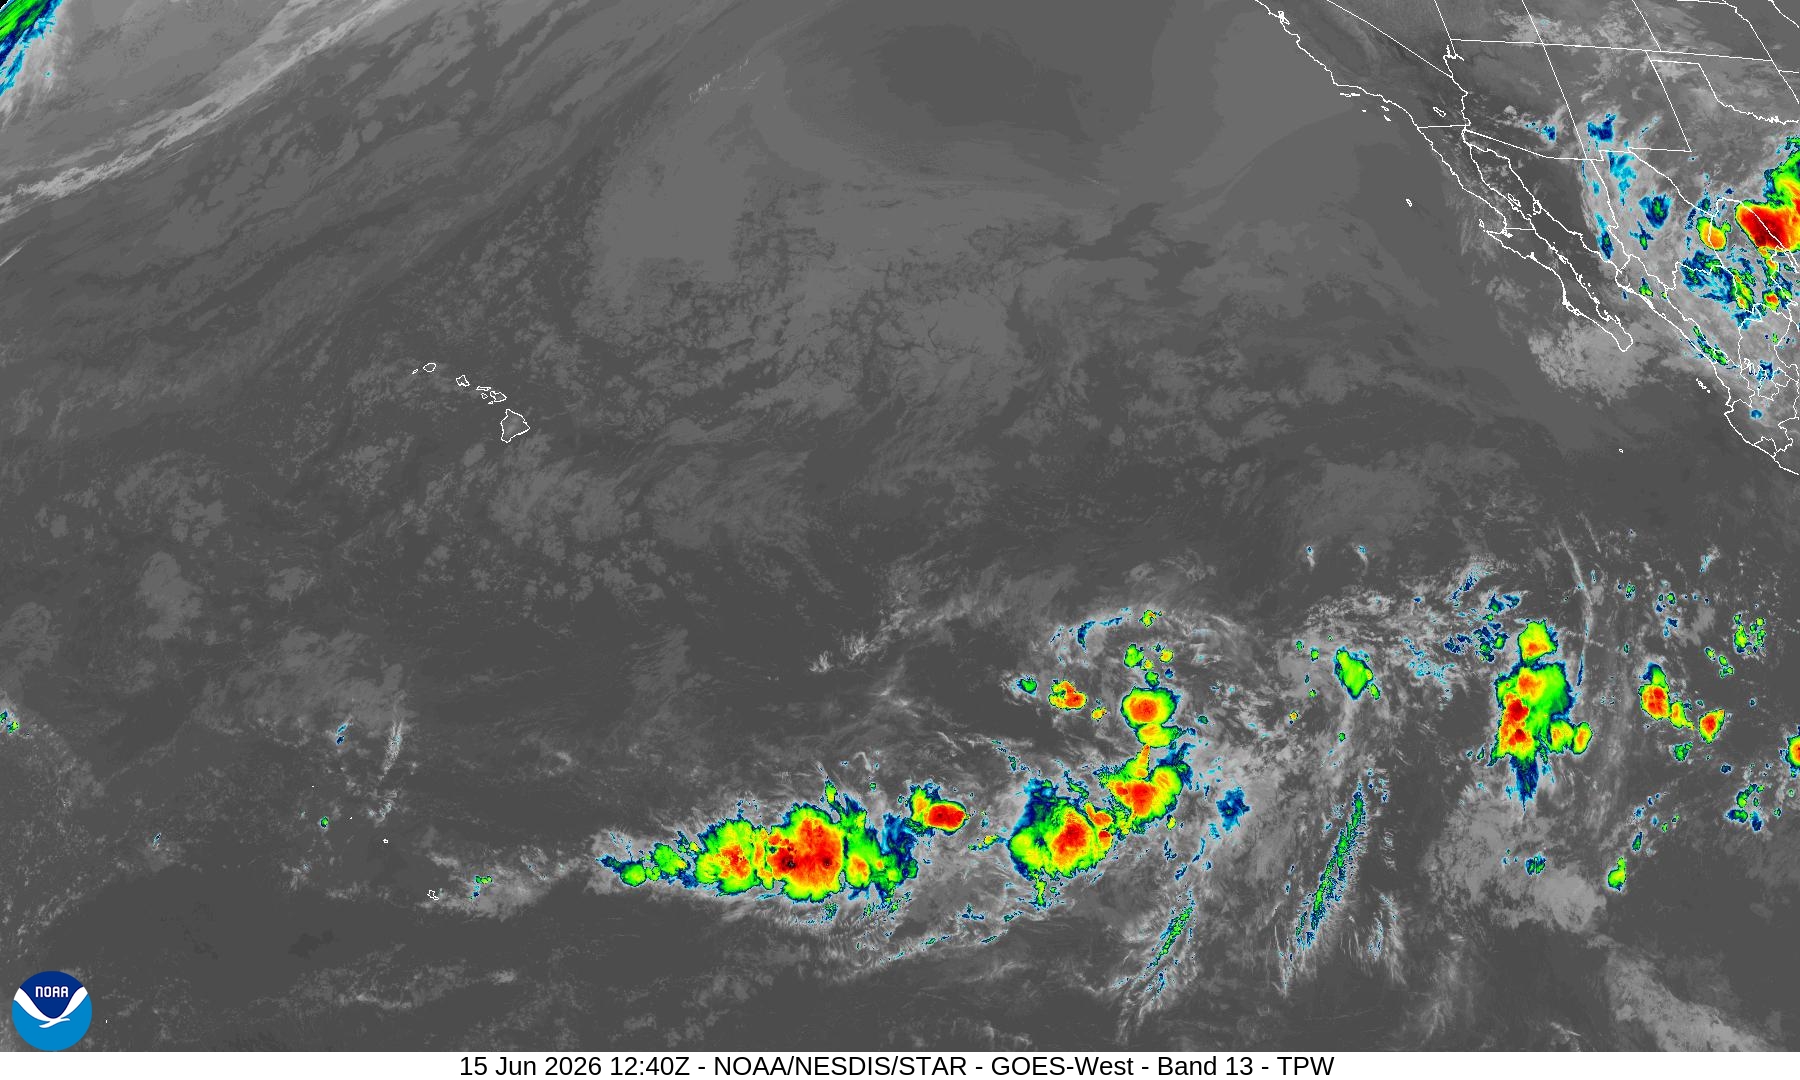
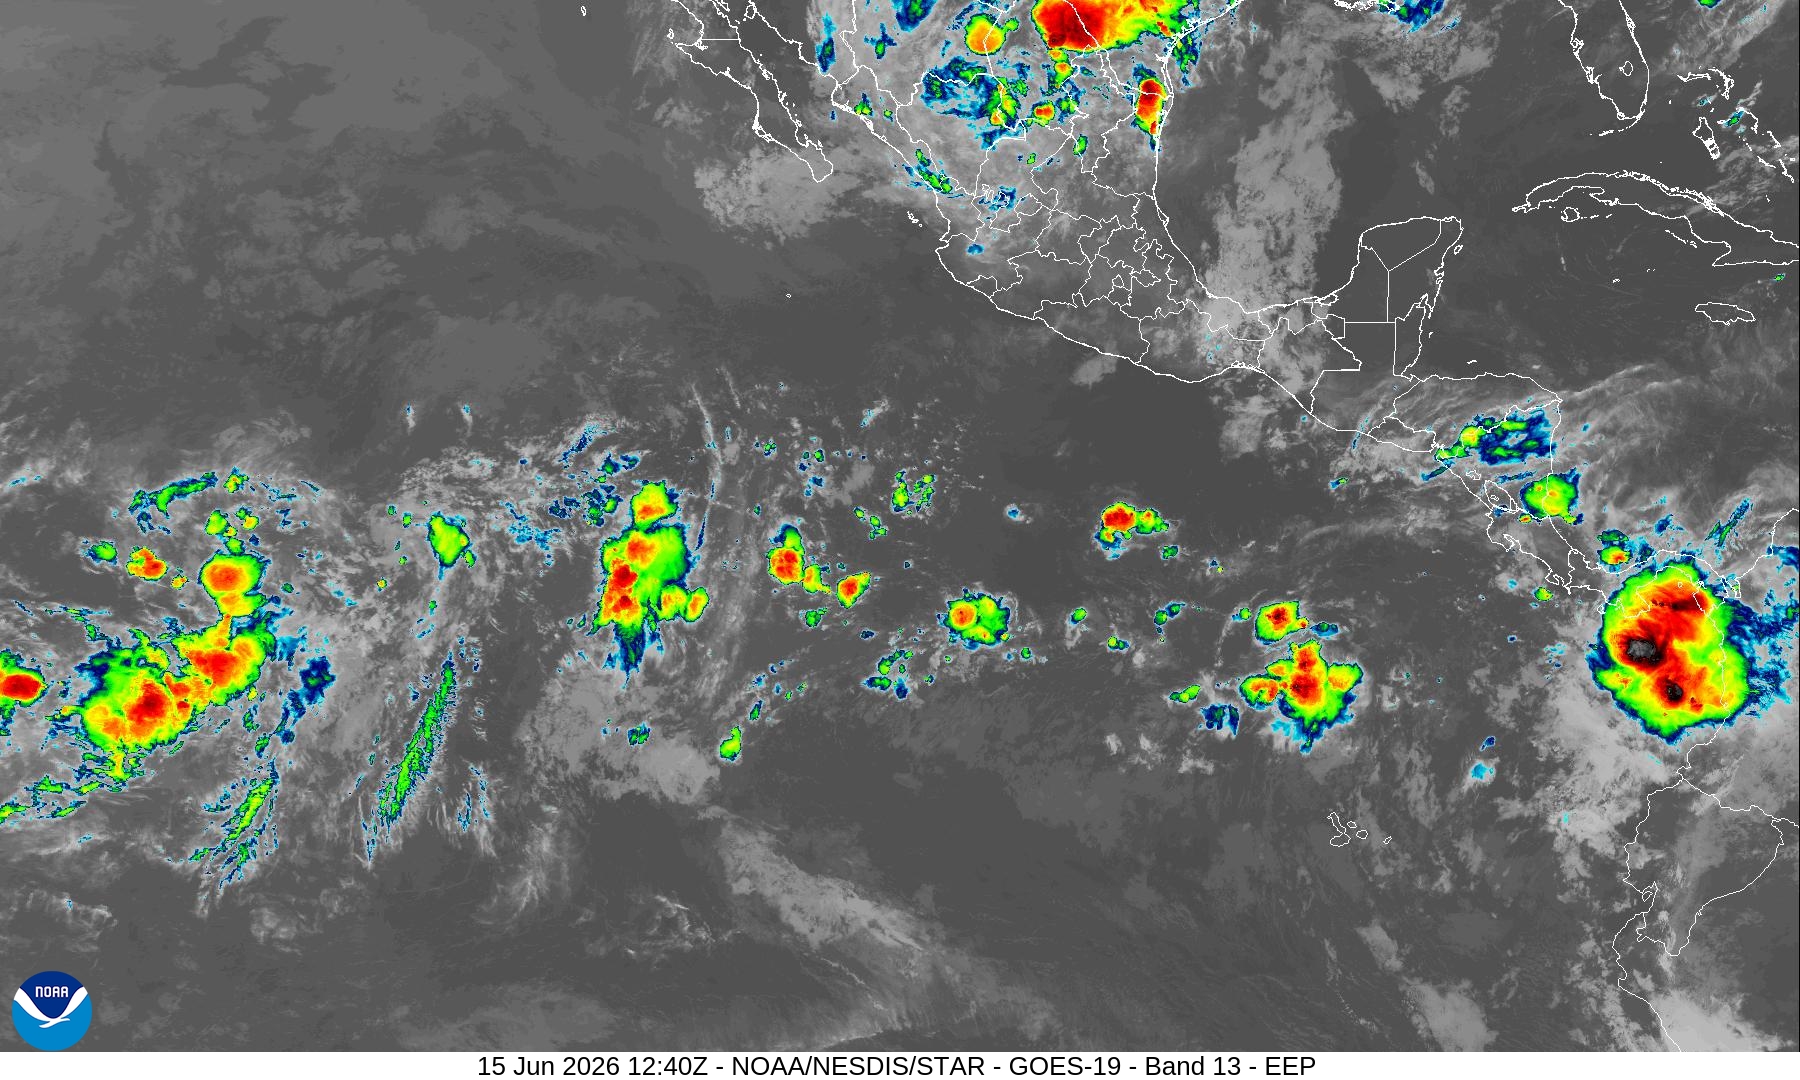
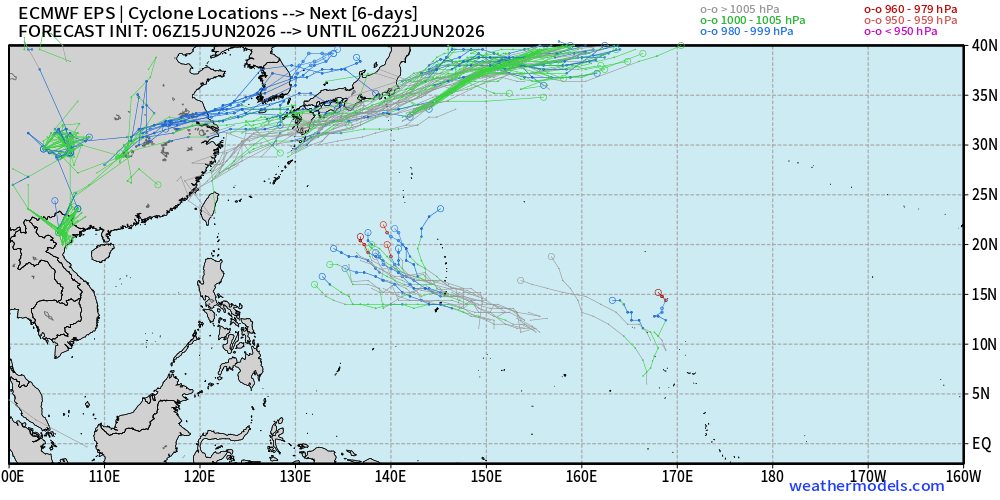
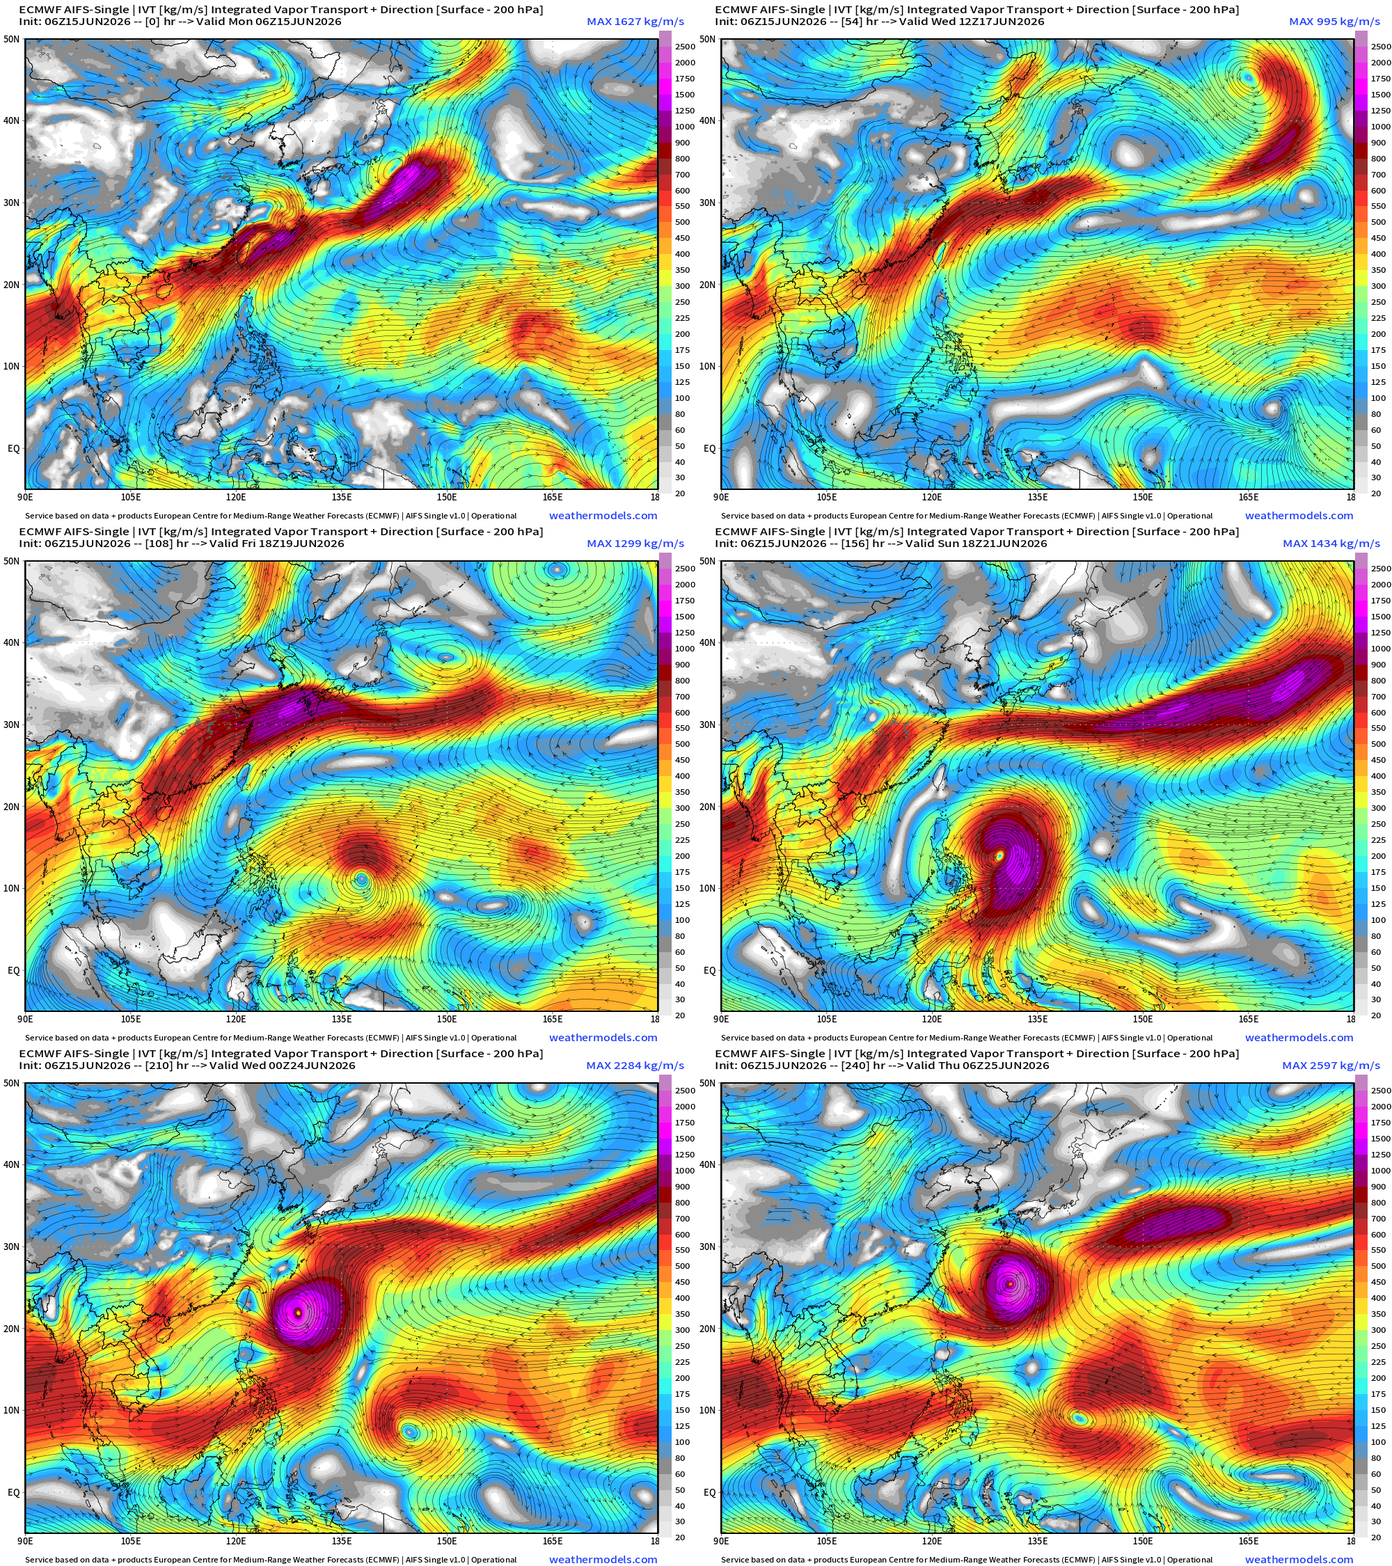
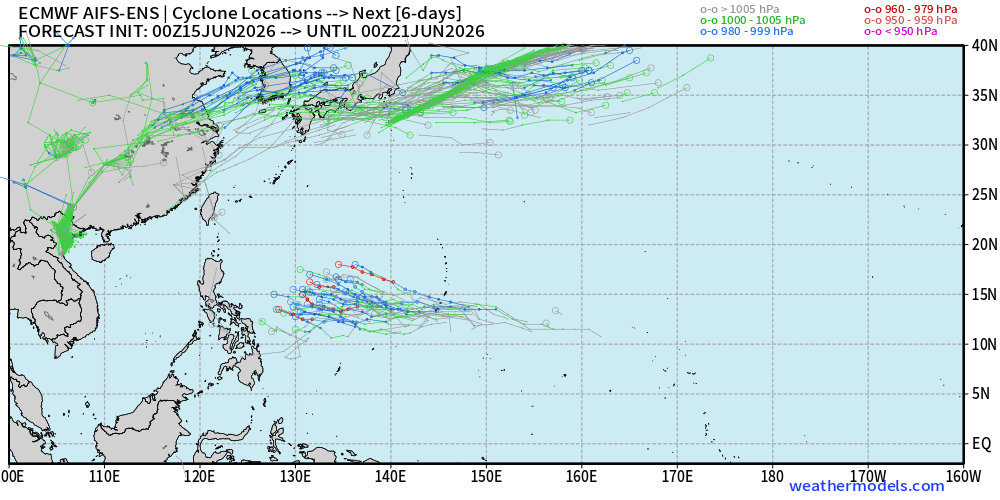
Western Pacific Typhoon — Slow but steady development of a system in 7-days
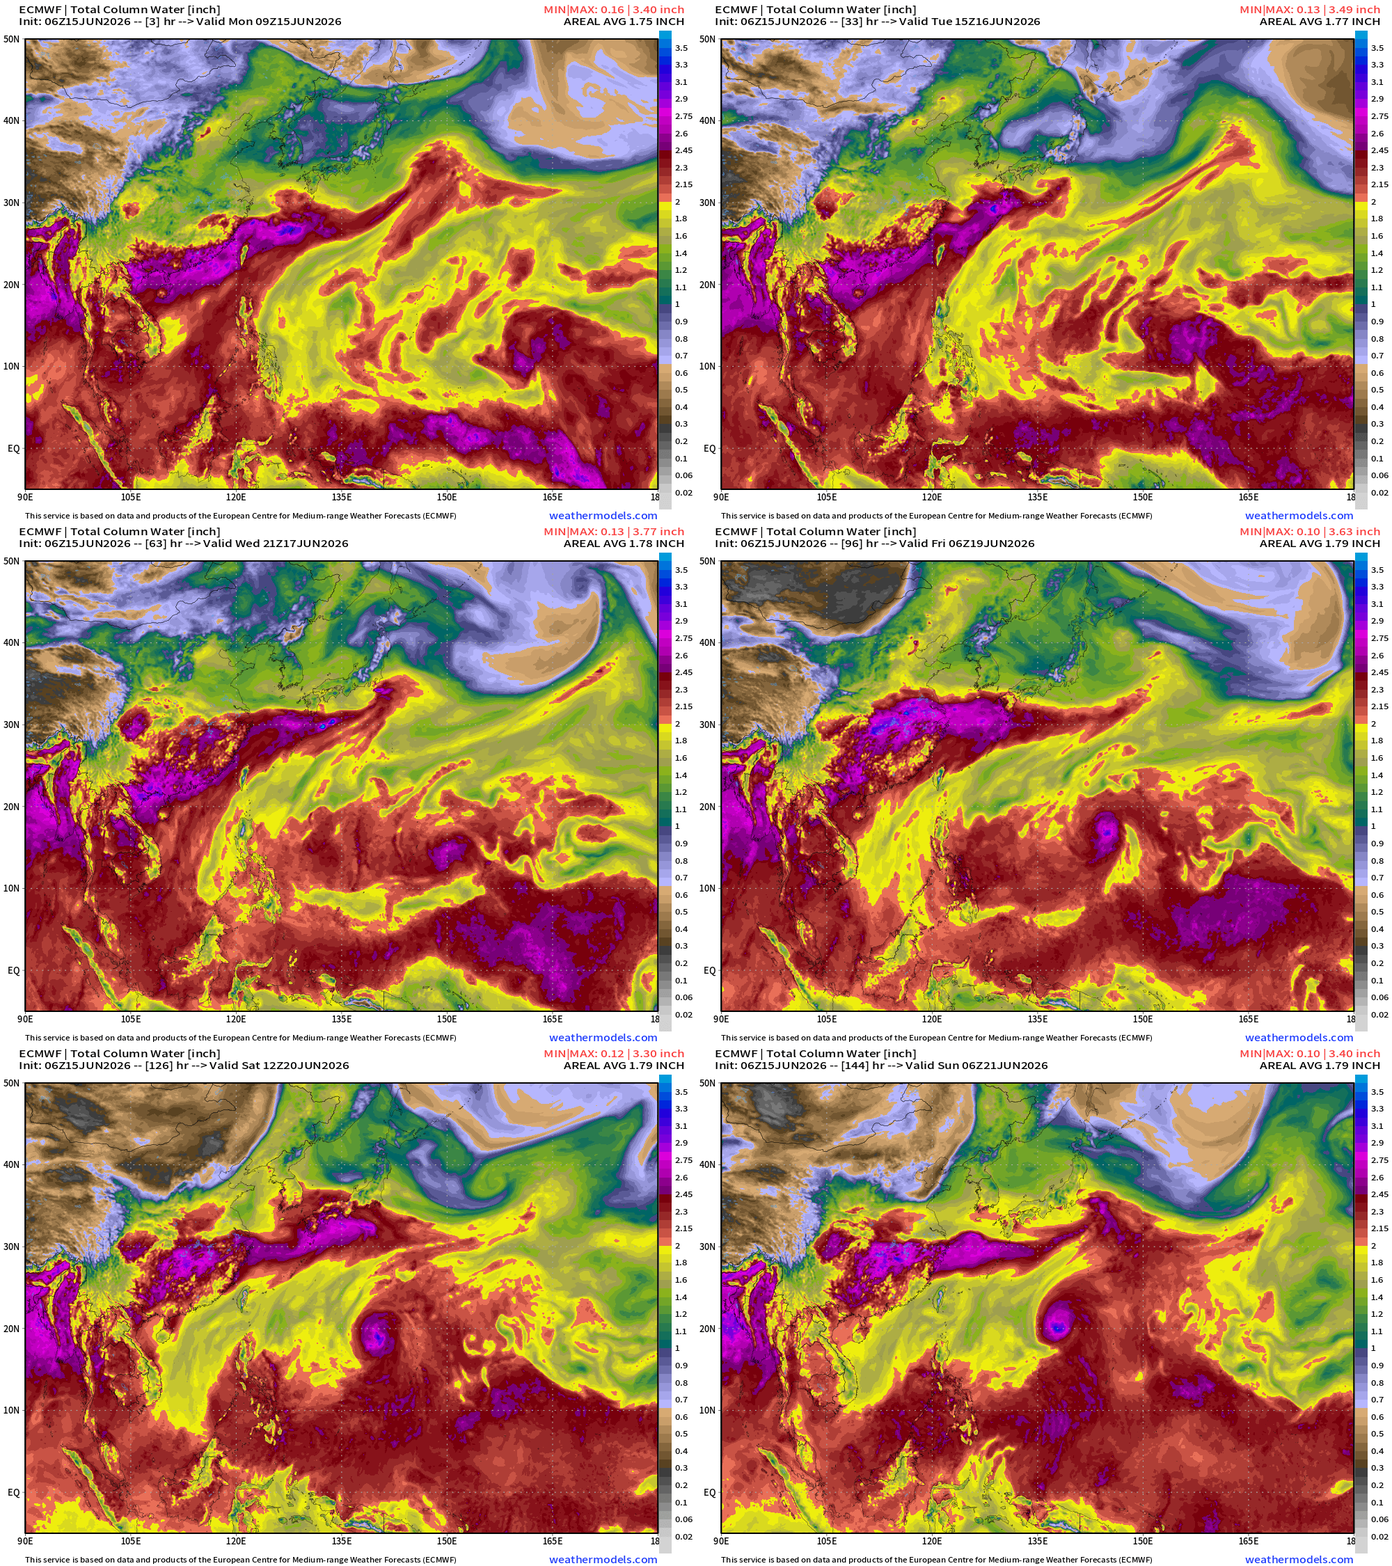
Full physics model through 6-days, roughly 50% chance of storm formation
AIFS-Single 06z through 10-days —> typhoon
AIFS-Ensemble Tracks through 6-days — higher chance and more westward track before recurving northward in 7-8 days
Thank you for reaching the end of this post! Hopefully you enjoyed the beautiful weather maps. Please help increase the visibility of Weather Trader on Substack: Share or Like!
Help support this newsletter (nearing post 1,000!) —> June 2026 Coupon
Maps sourced from weathermodels.com designed and innovated by yours truly! Please subscribe there for real-time access to the newest maps, charts from all of the weather models including ECMWF and AIFS, and NOAA GFS/GEFS, HRRR/RRFS and Blend of Models (NBM). NOAA WPC and SPC for fronts/convective outlooks.
My Atlantic Hurricane Season Forecast (2026)
From April 7, 2026: Atlantic Seasonal Hurricane Forecast: (11/5/2)
9-13 Named Storms (11 most likely)
4-7 Hurricanes (5 or 6 most likely)
1-3 Major Hurricanes (2 most likely)
Accumulated Cyclone Energy: 75-85 (well below normal)
NOAA 2026 Atlantic Hurricane Season Forecast
- Milepost
- 959 · laid 2026-06-15T14:13:06.901000Z
- Source
- https://weather.substack.com/p/june-15-2026-monday-tropical-moisture
- Digest
- 73ff87afcf1c2e9be4ae99070a50341decf1d04edd556c27e263473ccae55cff
- Machine
- JSON