February 19, 2026 Winter Storm Watch
Model differences leave some uncertainty about potential of major East Coast snowstorm
February 2026 was the 4th-warmest February in the 132-year national record (1895–2026), at 40.3°F against a 1991–2020 normal of 35.6°F (+4.6°F).
February 2026 was the 5th-driest February in the 132-year national record (1895–2026), at 1.4in against a 1991–2020 normal of 2.1in (-0.7in).
NOAA/NCEI Climate at a Glance, contiguous United States. This is the observed record for the month, not a score of anything said in this piece — the forecast ledger begins 2026-08-17 and cannot reach earlier posts.

Quick update to show what’s happened overnight with the ECMWF and NOAA GFS weather modeling suites — not much has changed as we have 2 distinct solutions.
I am still heavily leaning to the ECMWF IFS and EPS (ensemble) solution for this mid-Atlantic / Nor’easter but can’t entirely discount the GFS until it decides to give up.
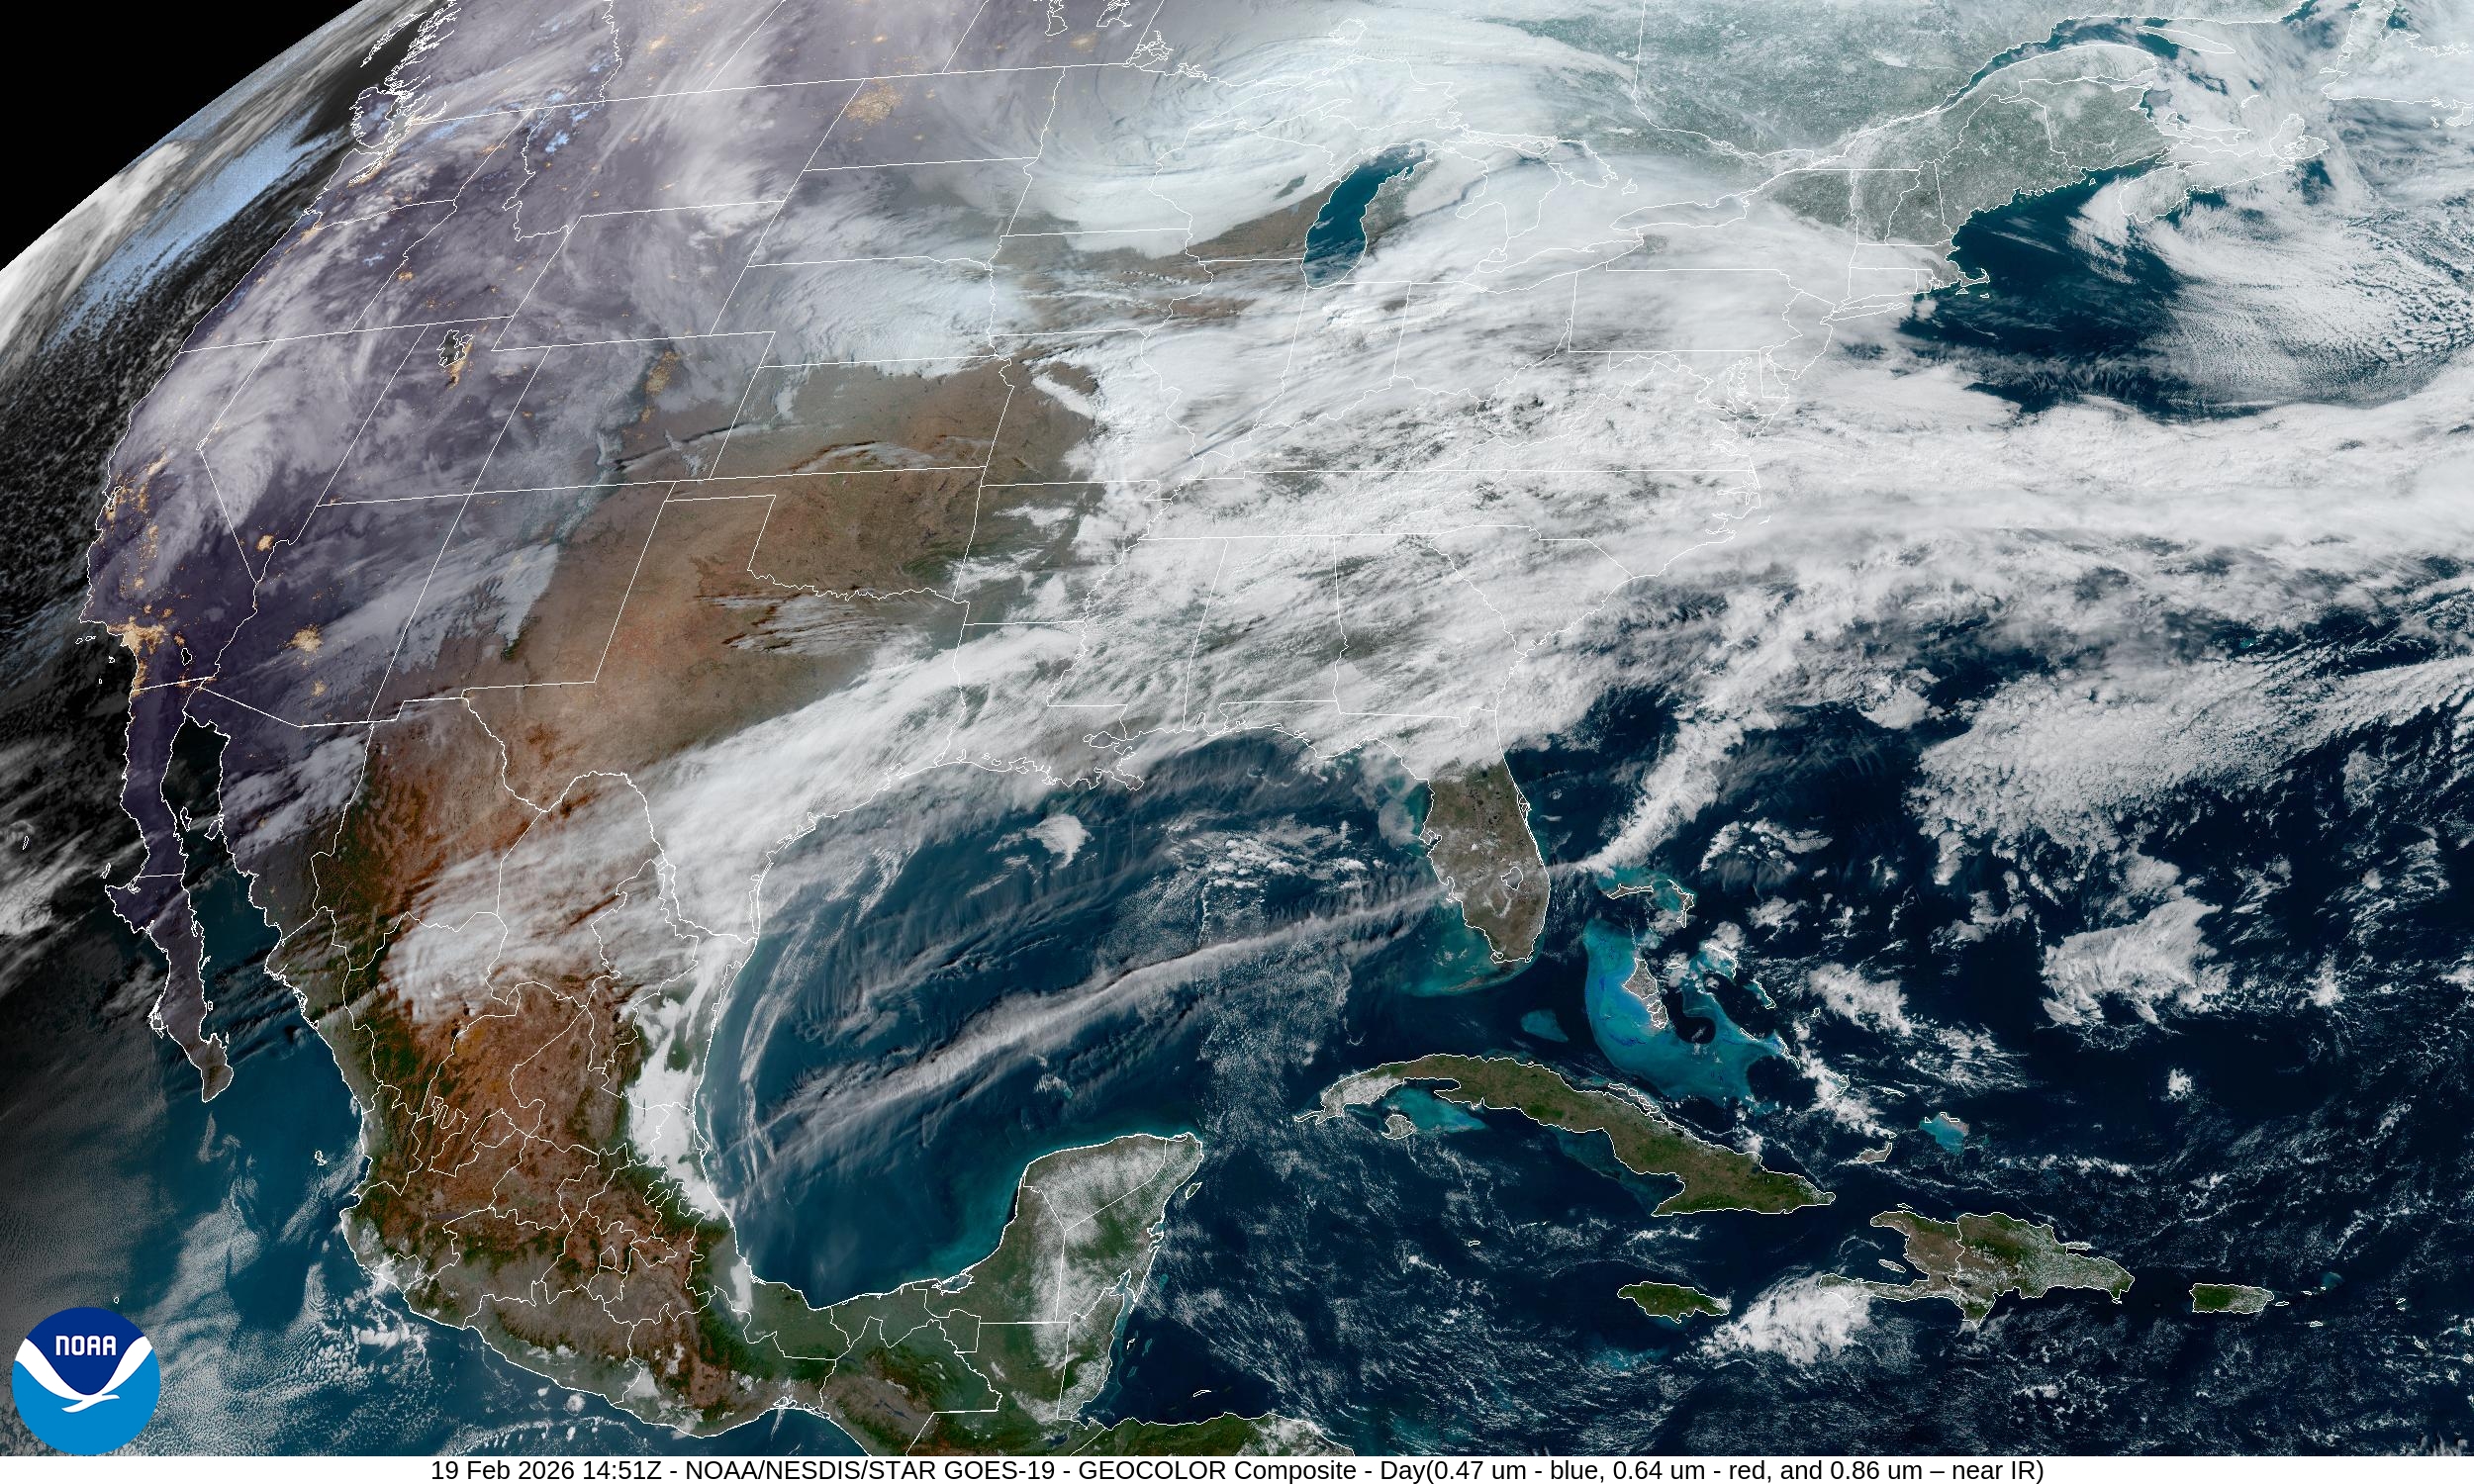
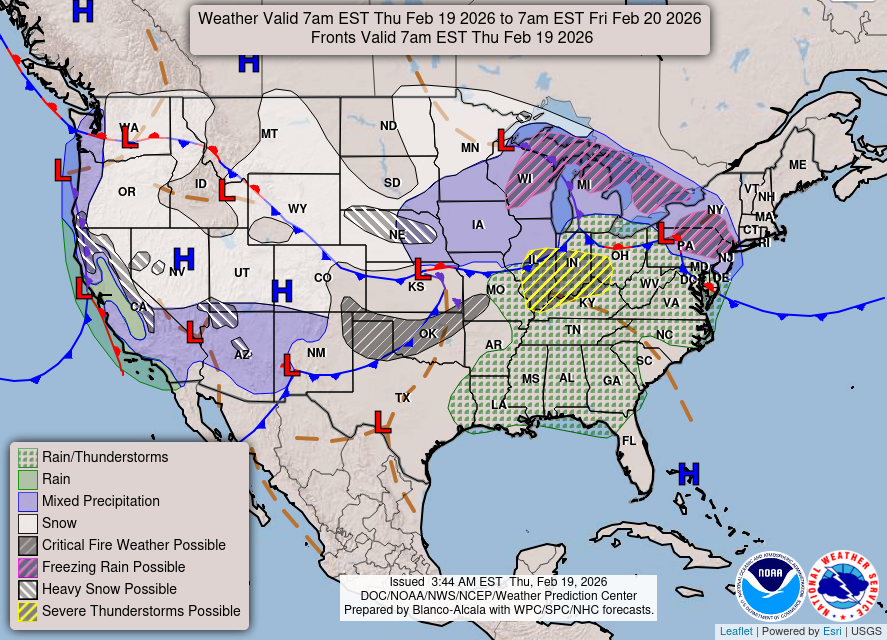
Severe Weather (Enhanced Risk) with storm system spinning in the Great Lakes
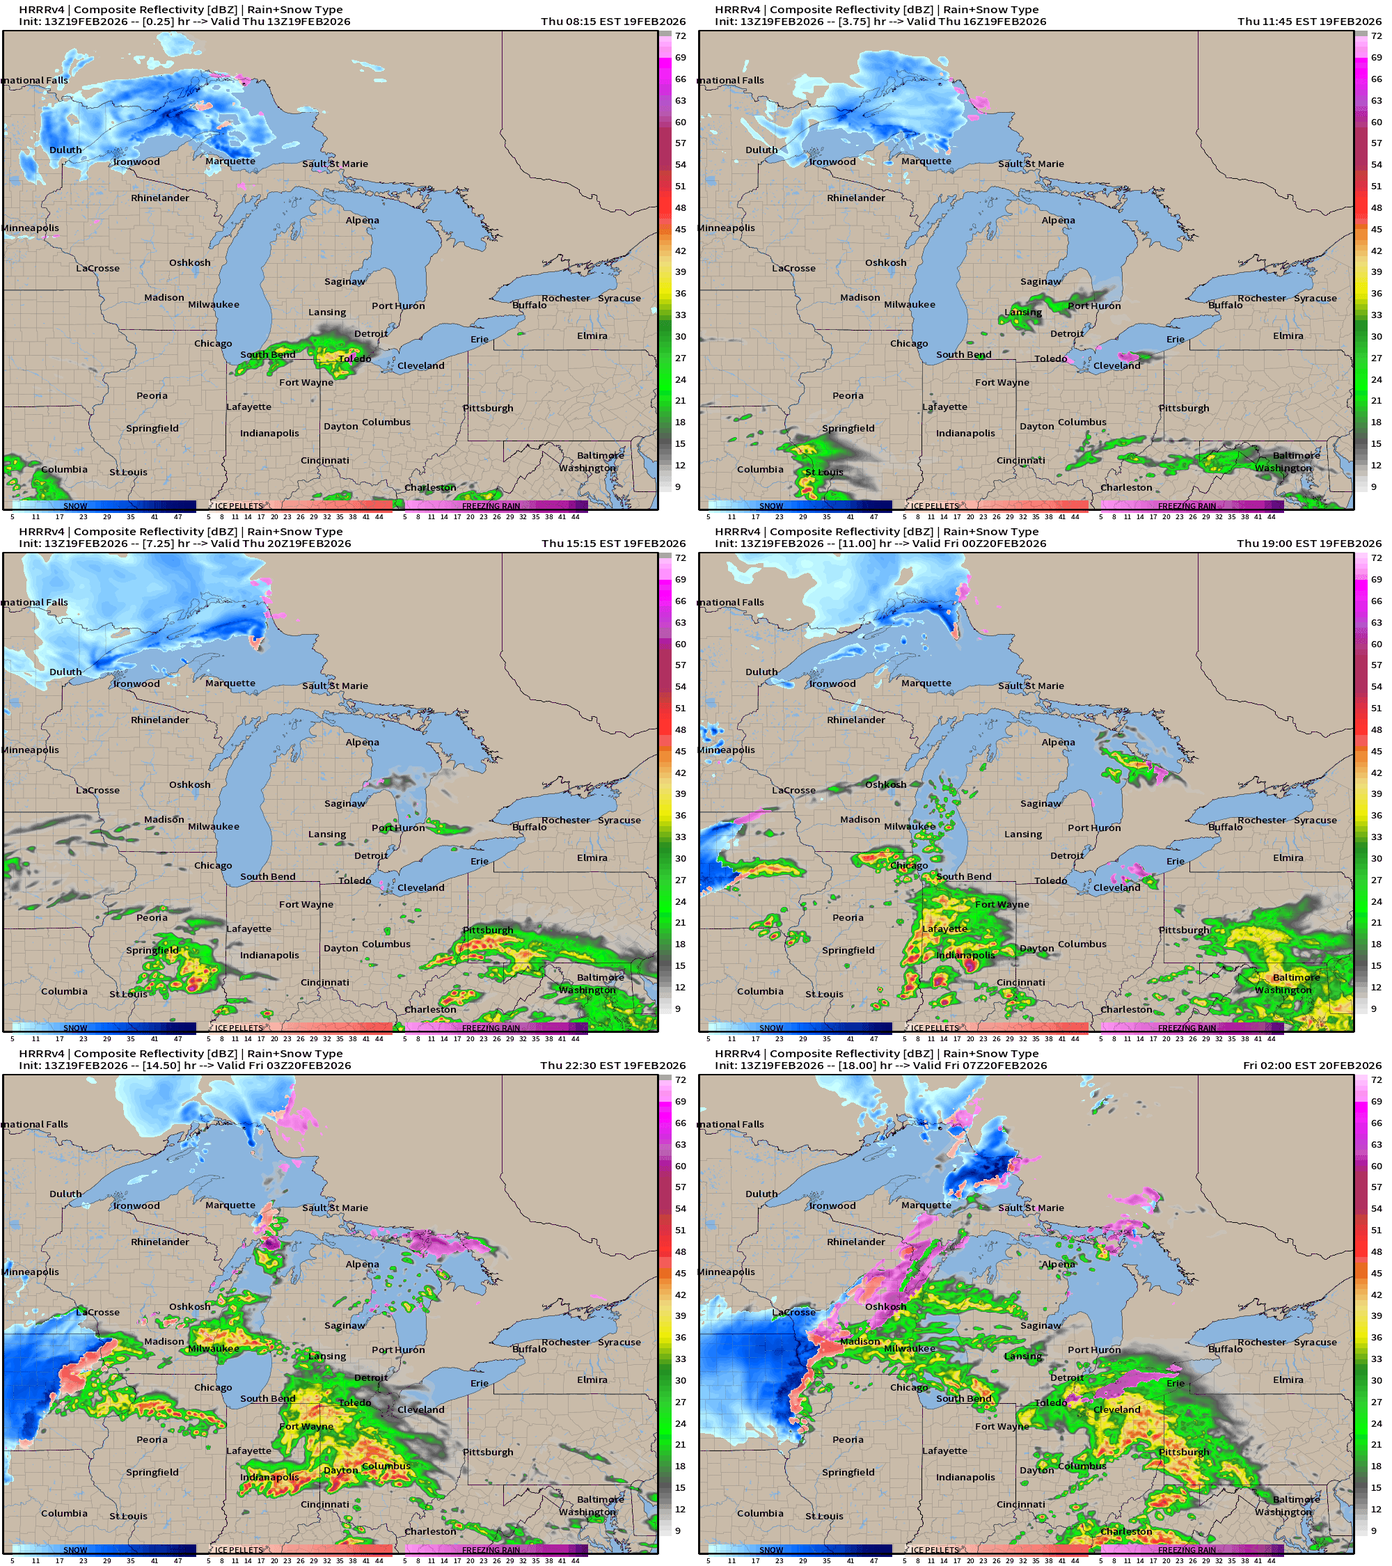
Long lifecycle supercells may form in Illinois and head through central Indiana into Ohio with risk of damaging winds, large hail, and even EF2+ tornadoes. Radar simulation (HRRR) next 18-hours until Friday 2 AM ET
SPC Convective Risk Today — Enhanced
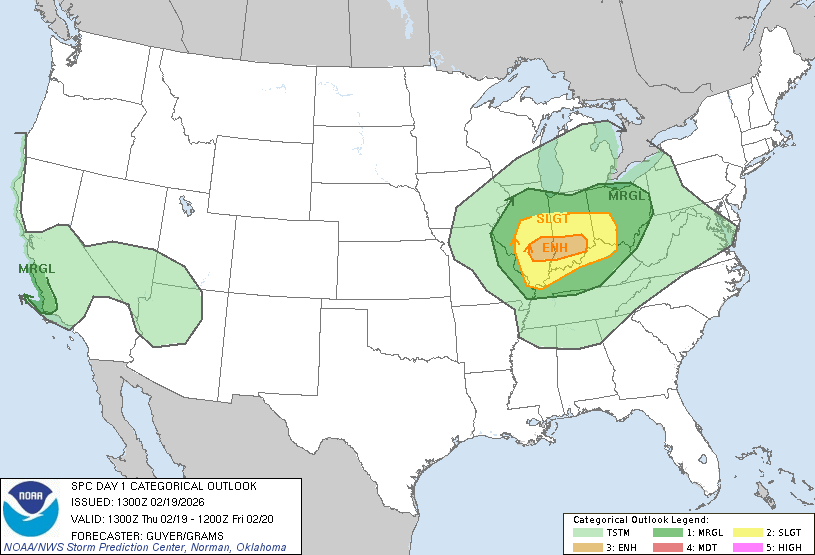
SPC Discussion: Severe thunderstorms including a few tornadoes, large hail and damaging wind gusts are expected across parts of the Midwest and lower Ohio Valley today.
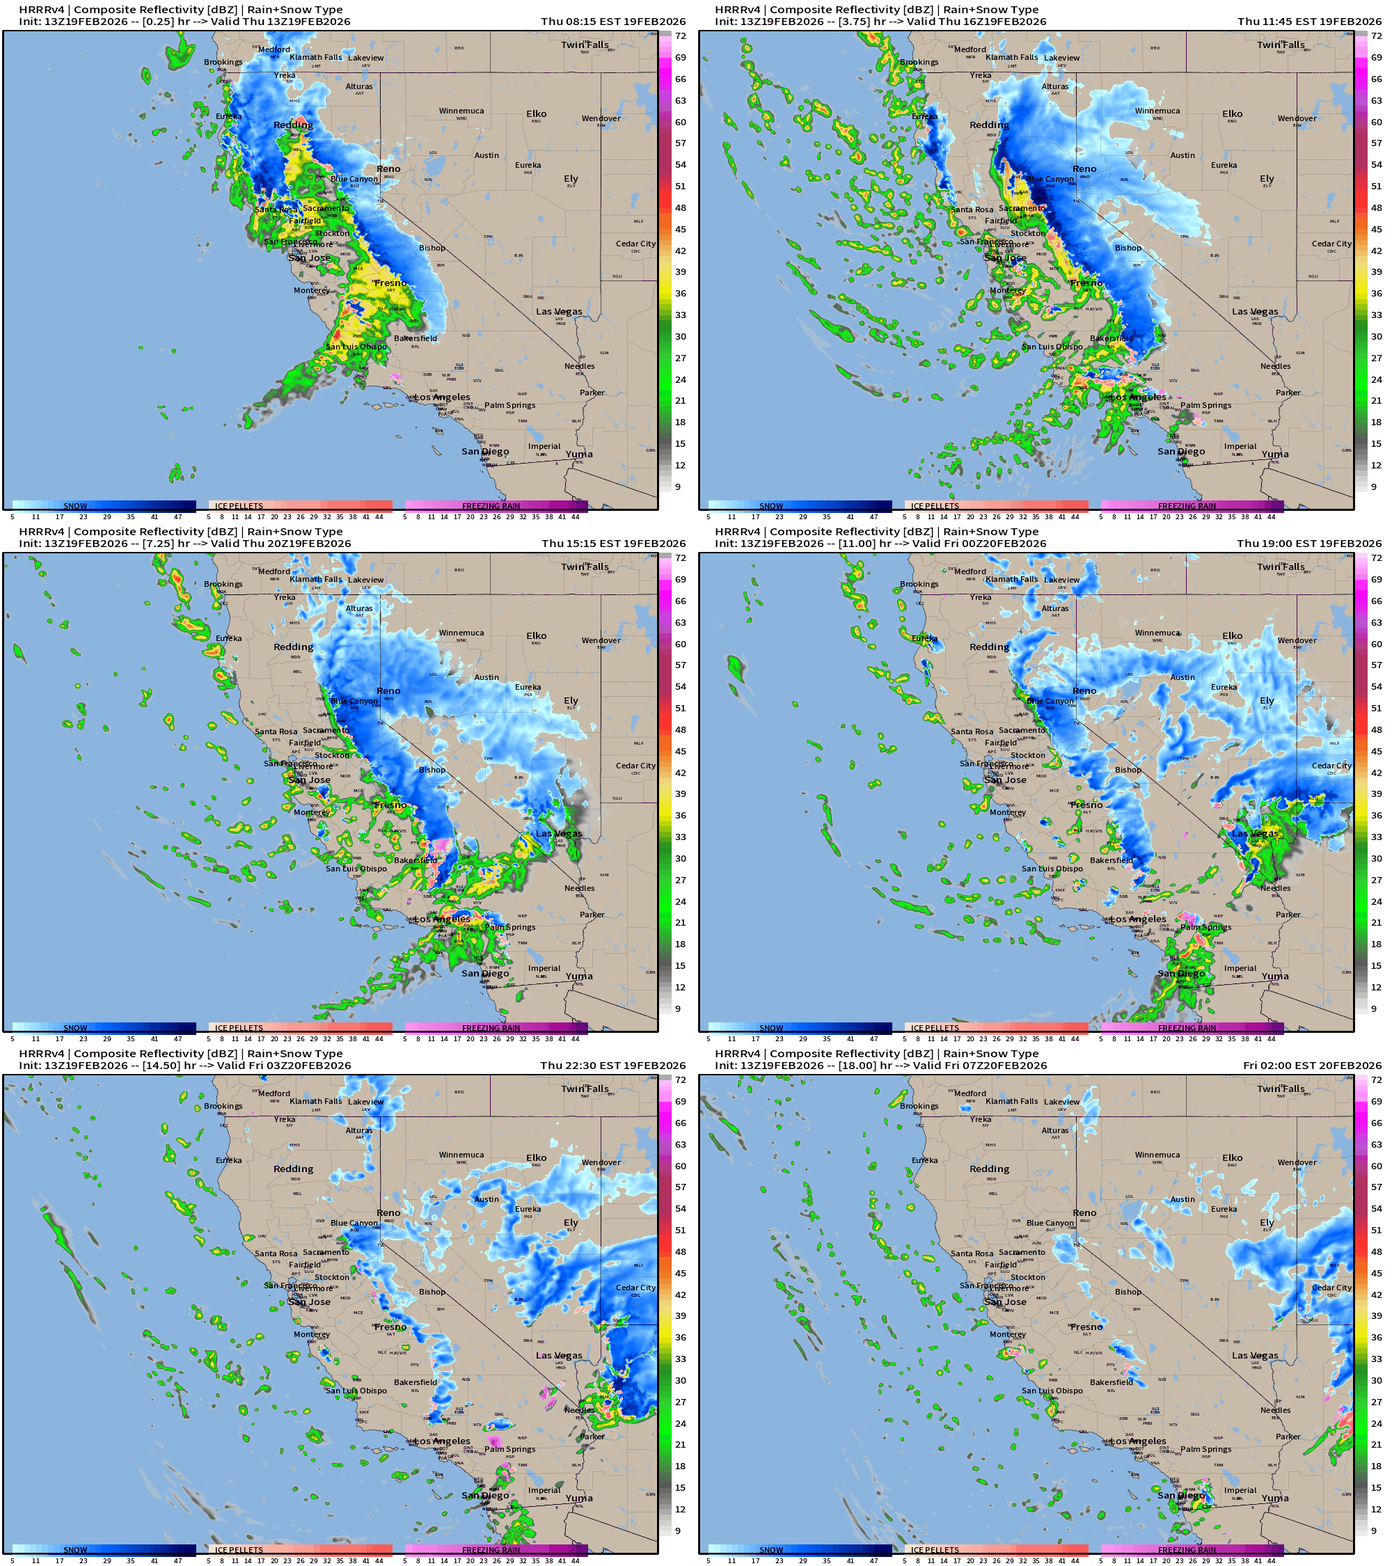
California storm system winds down later this evening, finally a break in the sequence of winter storms. Heavy Sierra snow continues to pile up!
Weather Trader is an entirely reader-supported publication into its 3rd year. To receive all new posts daily, and support our work, consider becoming a paid subscriber — All content is generated by Ryan (not A.I.) including the maps.
East Coast Storm System — Mid-Atlantic + Nor’easter Watch
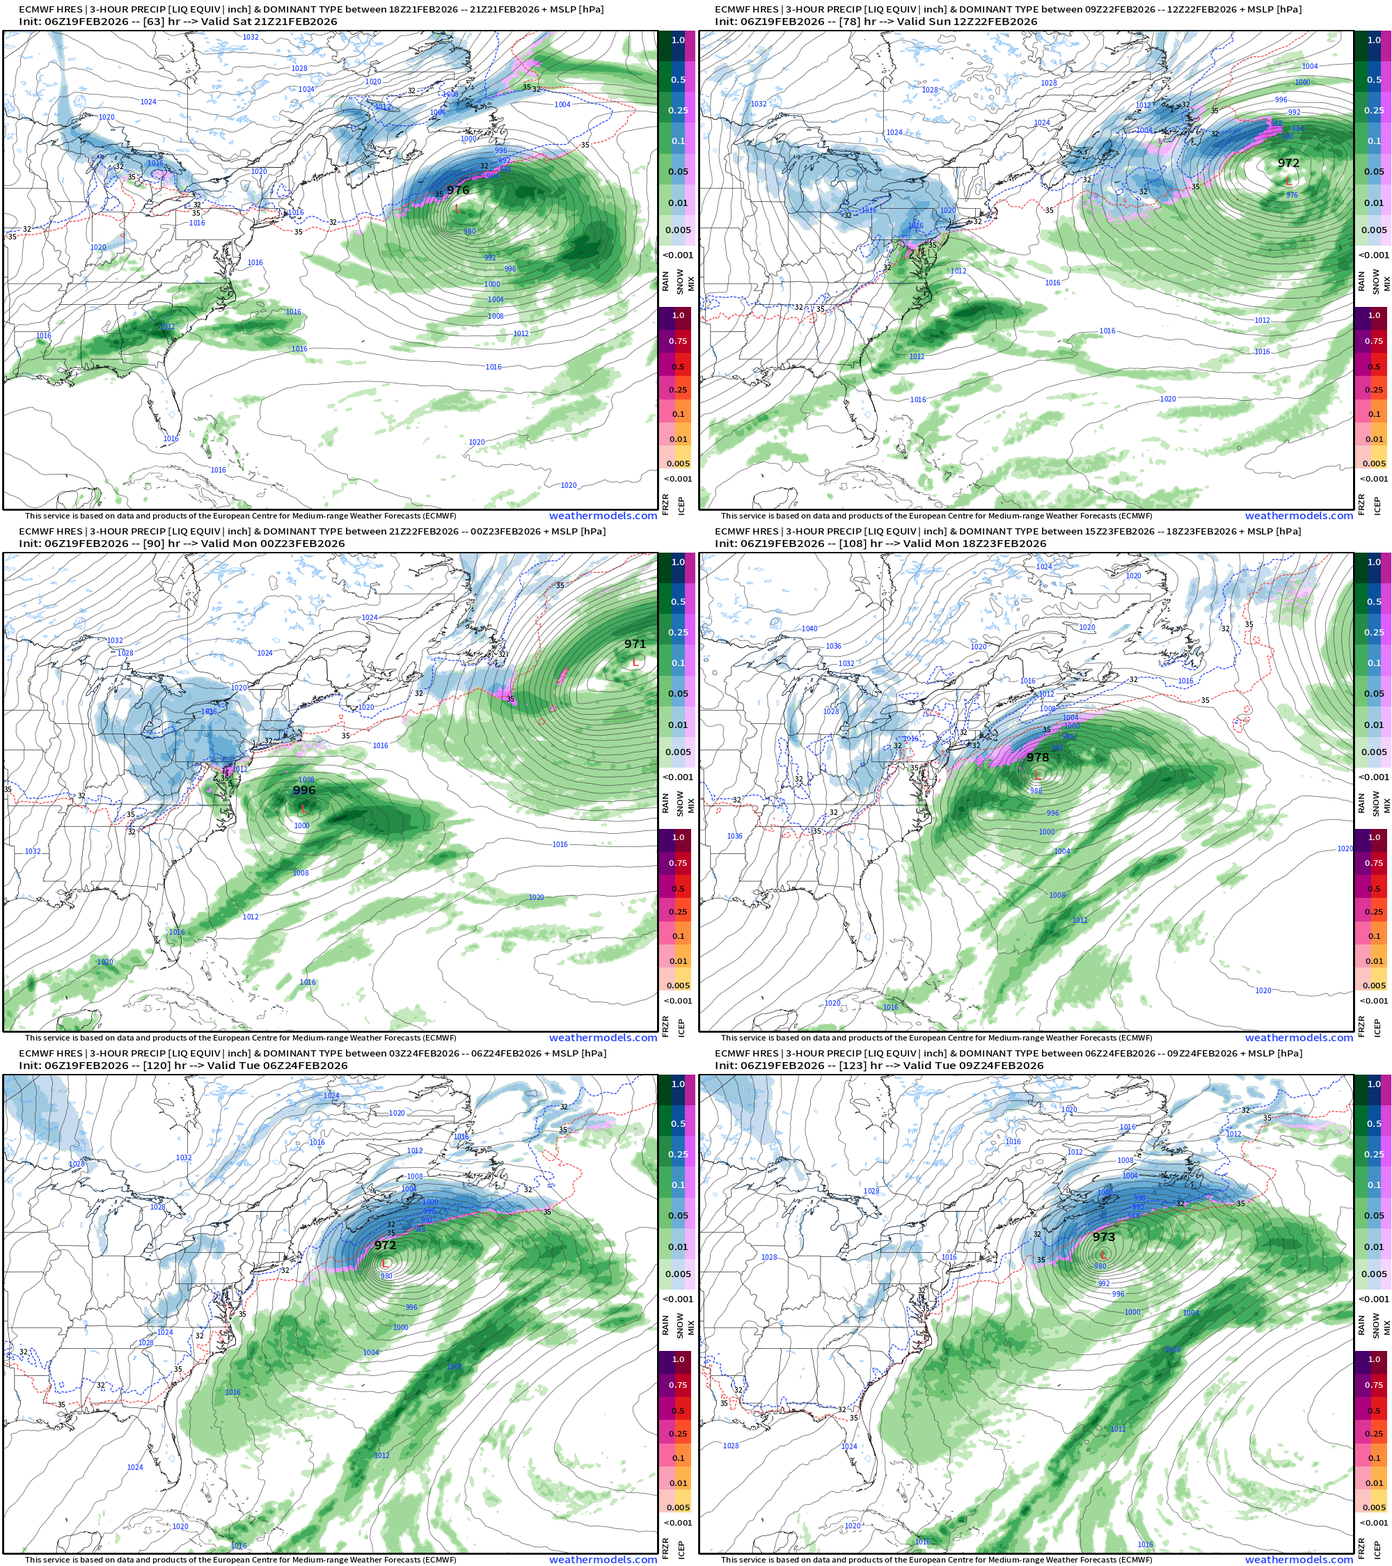
Updated ECMWF 06z shows the low pressure center waiting to rapidly intensify or “bomb out” until late Sunday into Monday — missing the opportunity for the backside of the circulation to dump snowfall on the coast. The northeast track keeps the low pressure away from New England as well.
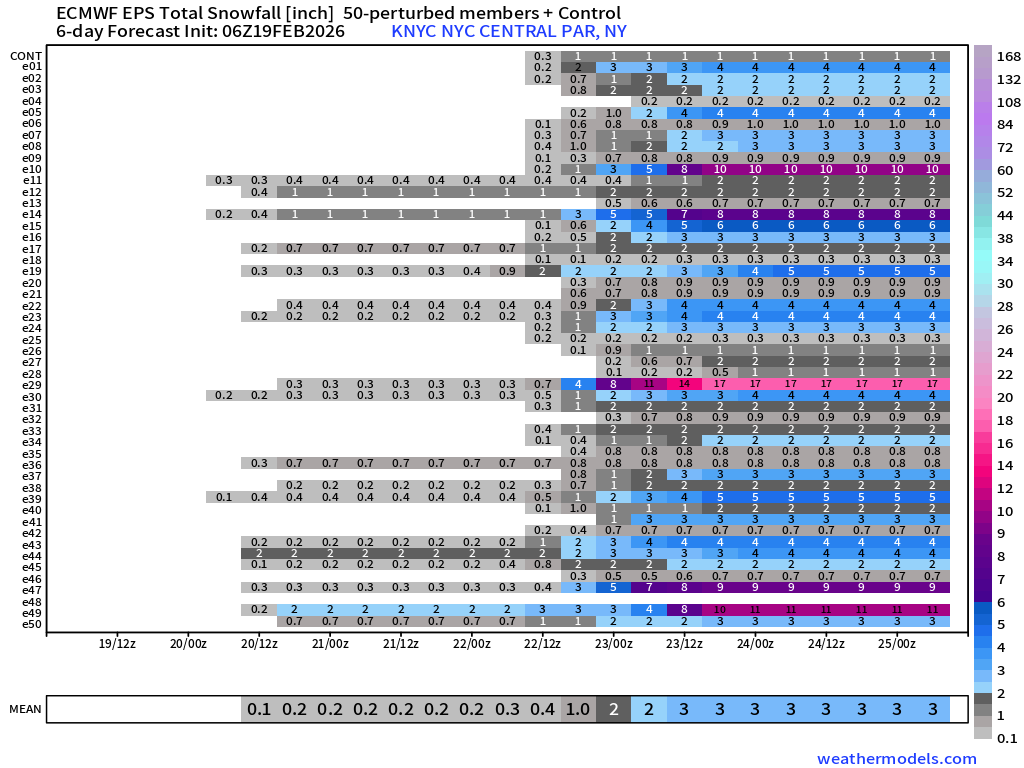
Ensembles: The ECMWF EPS at 06z (median) still NOT interested in the coastal storm having major impacts to the Mid-Atlantic or the Northeast.
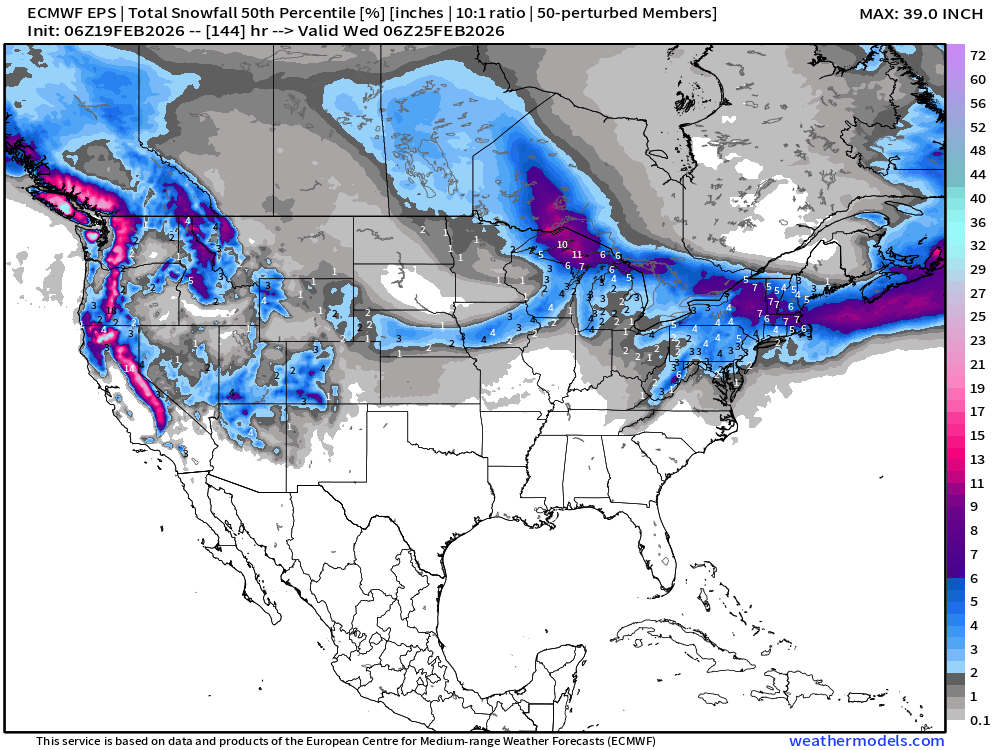
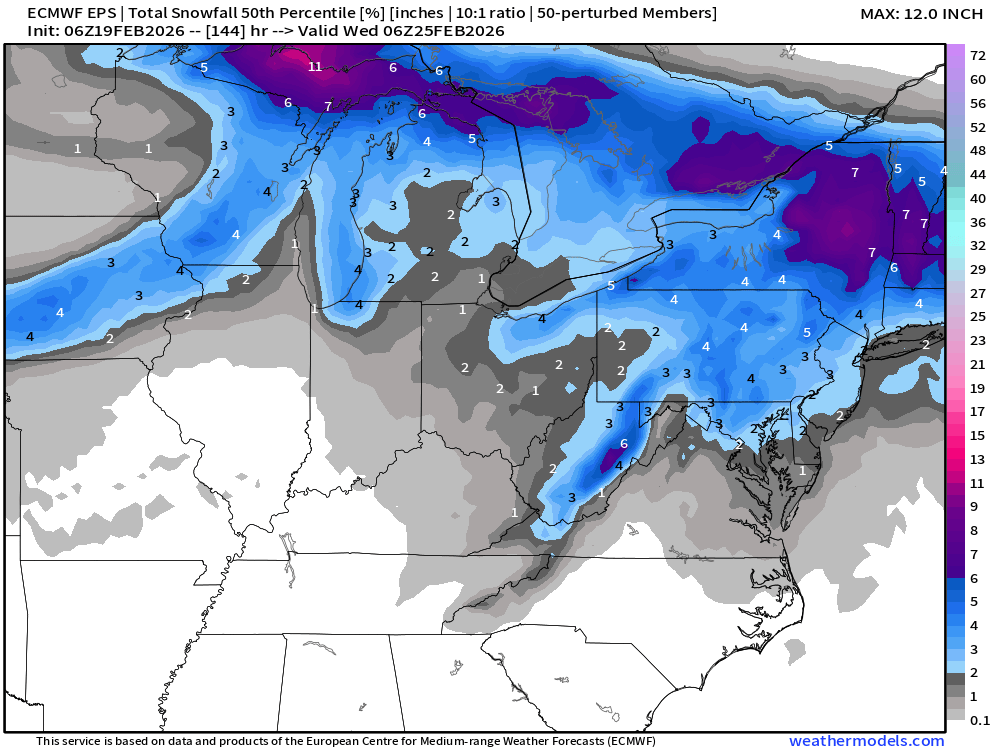
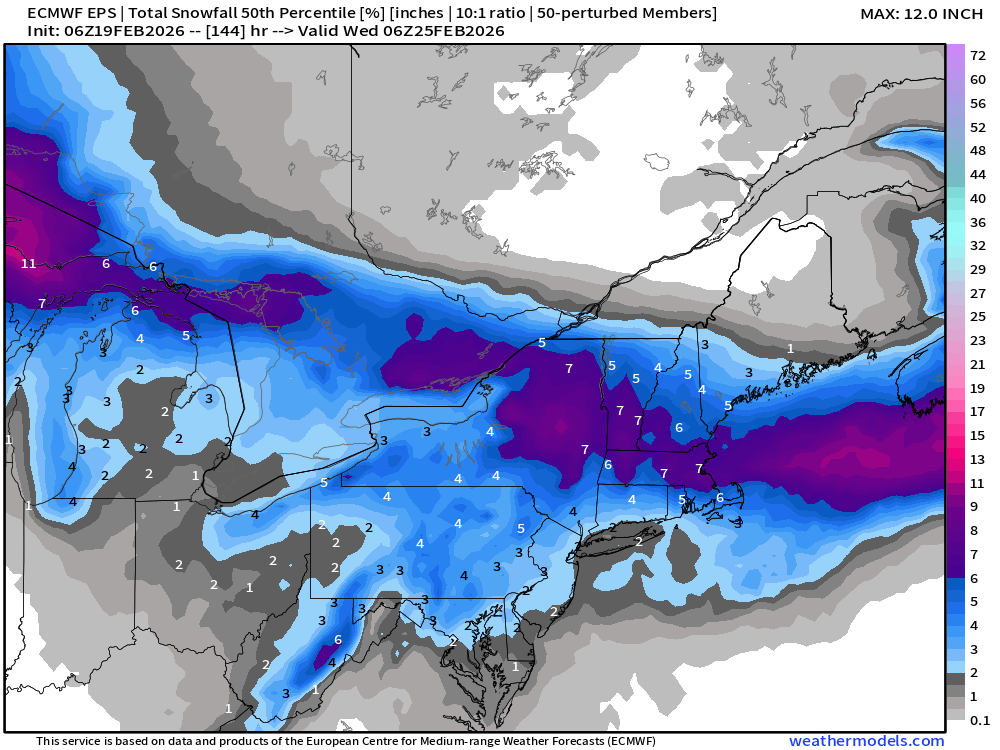
No change from Wednesday evening: The back side of the low pressure system will have moisture in cold-enough air on Monday, but the total QPF (amount of precipitation) would be too low to provide “blockbuster” storm snowfall totals. Instead, we’re currently in the 2” to 4” category as the highest probability outcome.
Ensemble Probability of 3-inches of snow — about a coin flip from Washington D.C. to Philly and New York City
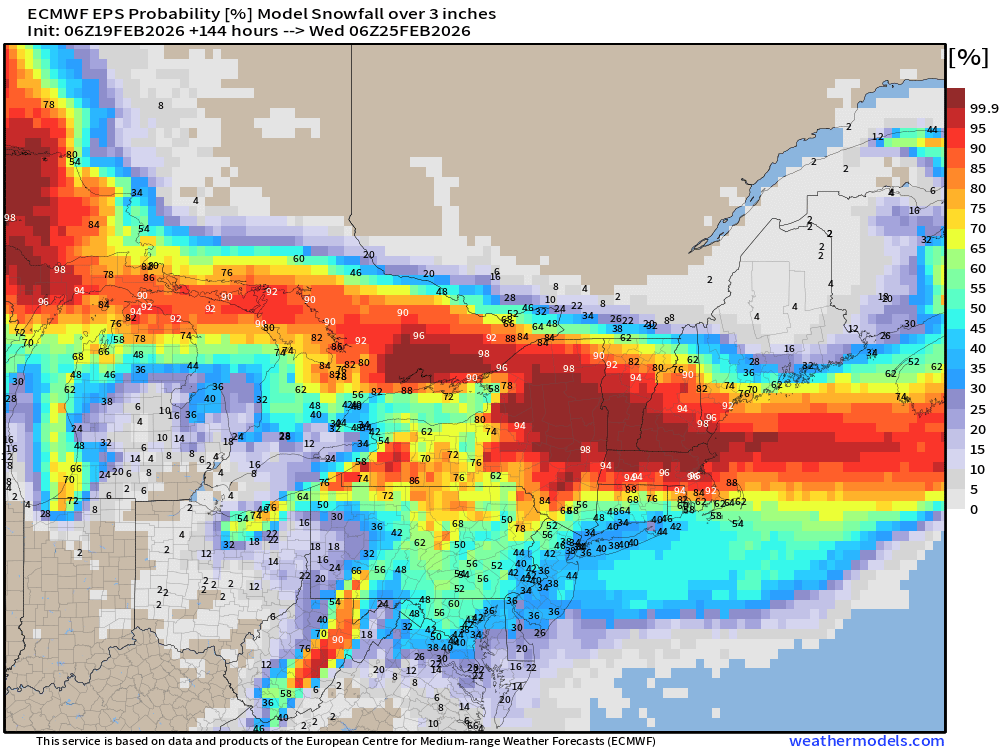
Bumping up to 6” probability of snowfall into Wednesday … not much here.
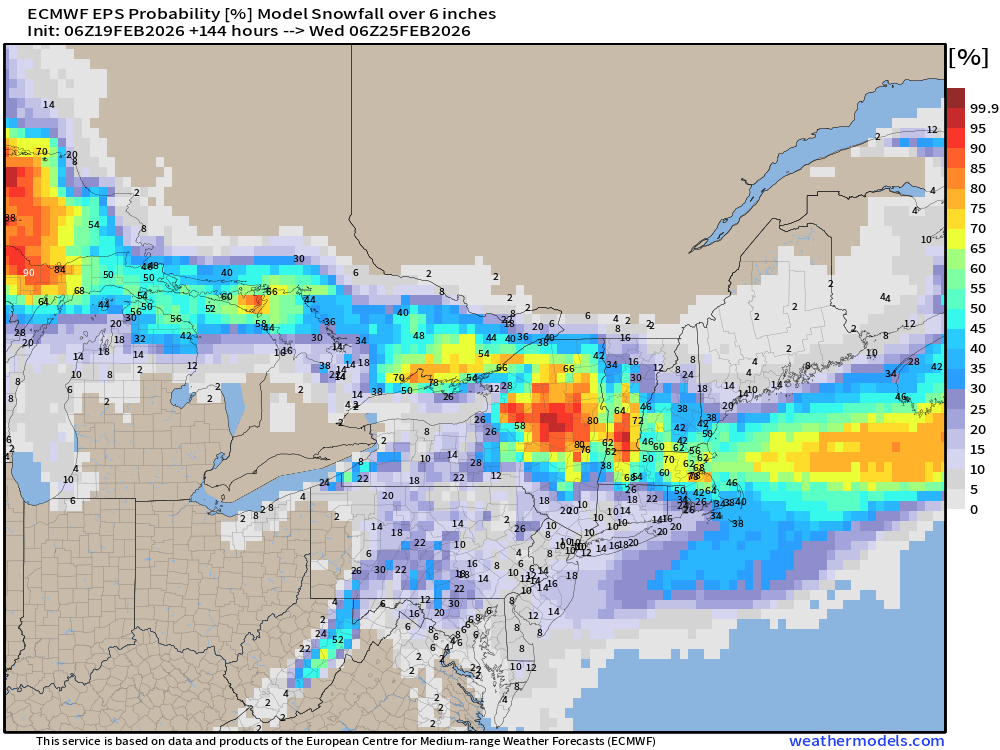
And, we have 1 in 12 chance of seeing at least 6” of snowfall along the I-95 corridor from DC/Philly/NYC. Most solution in Washington D.C. around 4” with a few > 6” out of a total of 51.
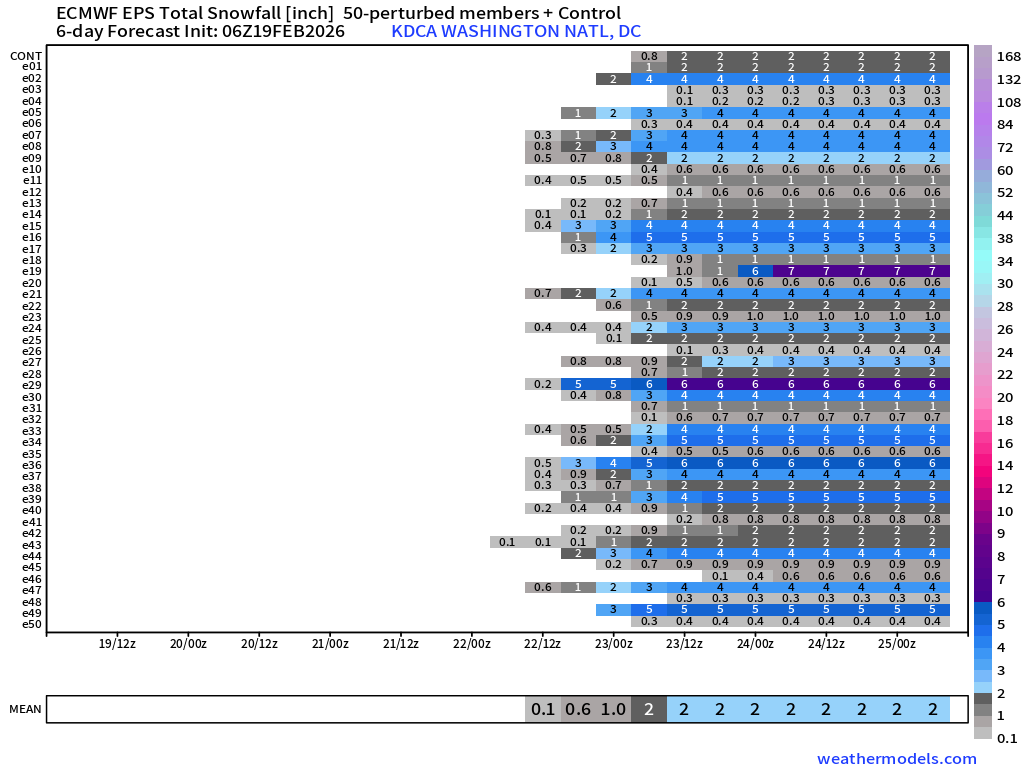
Better opportunity for higher-end snowfall totals in New York City, but still ~10% outcome
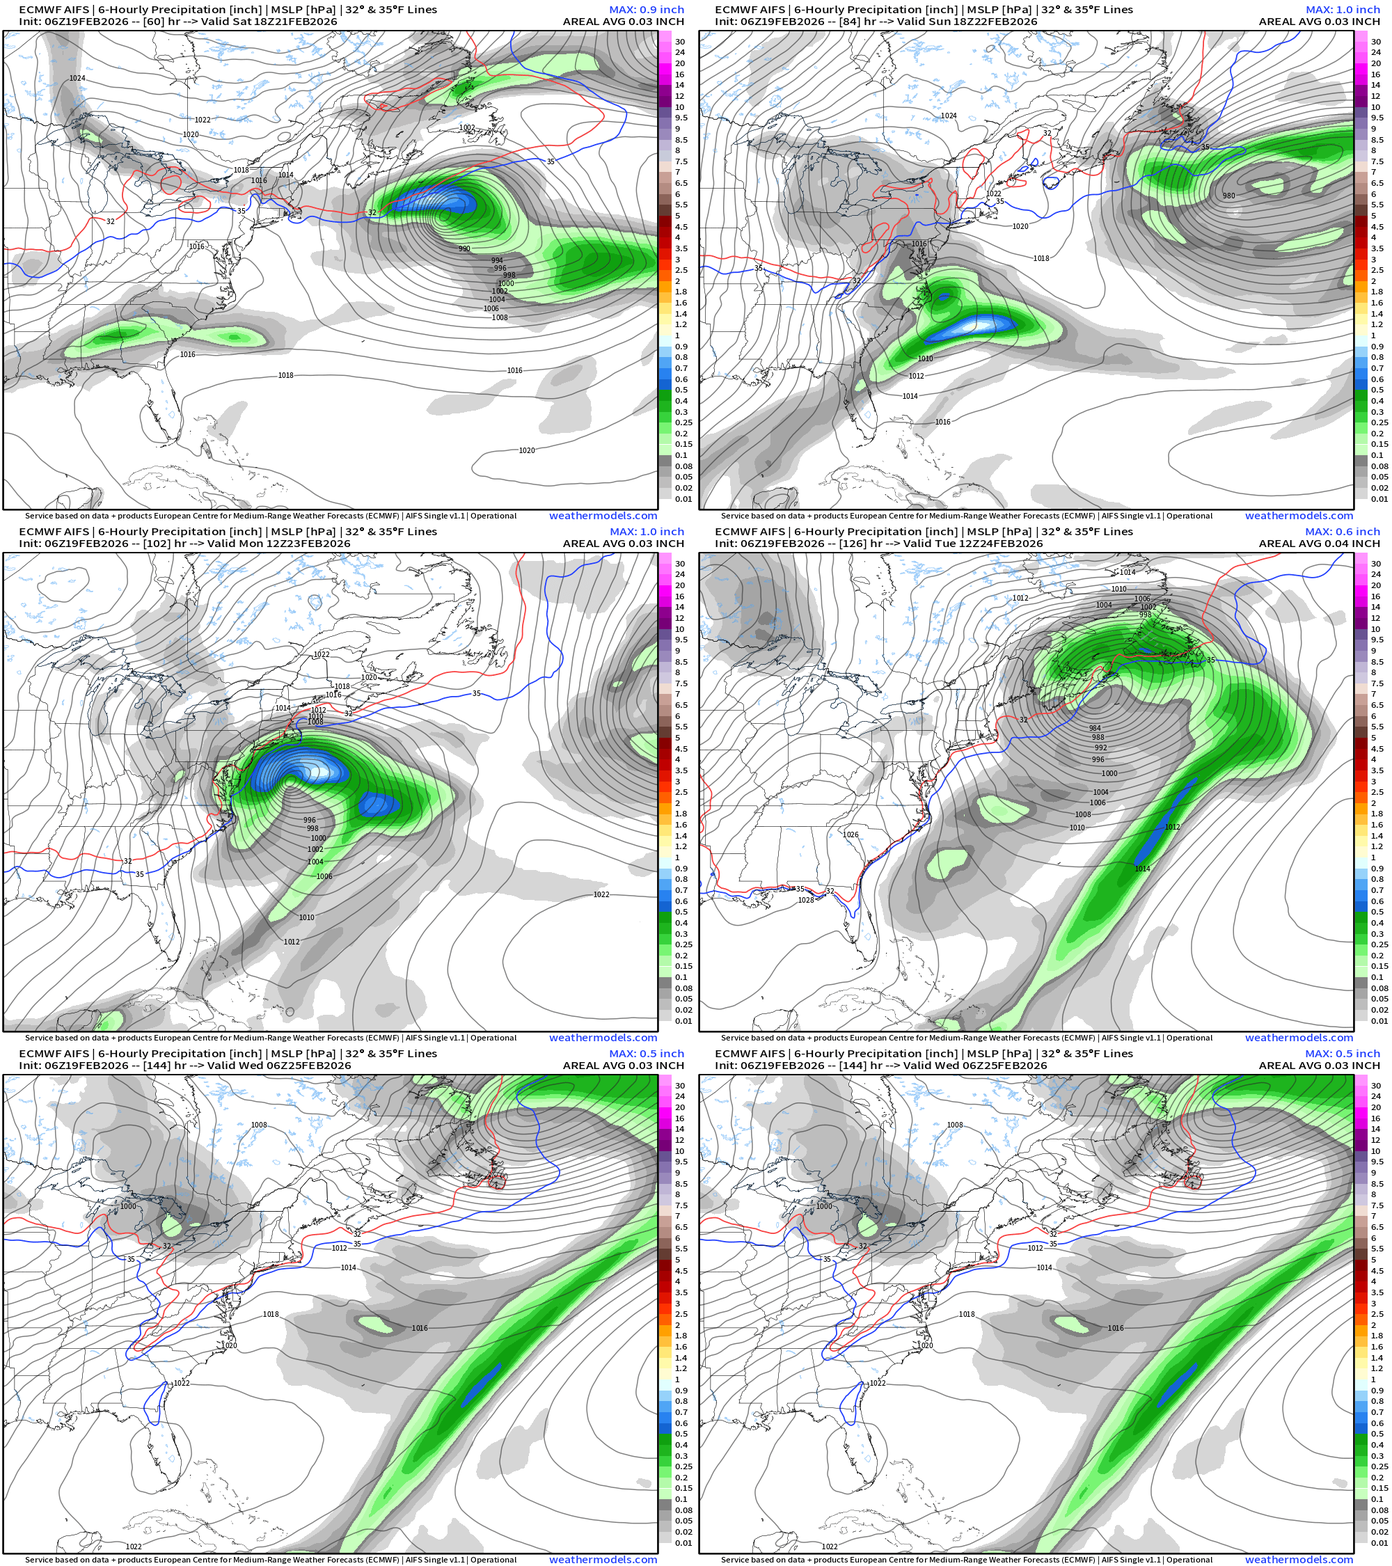
Updated ECMWF AIFS-Single 06z for late Sunday into Monday evening is closer to the coast than IFS (full physics) … and wraps much more moisture around the center into New England including Boston.
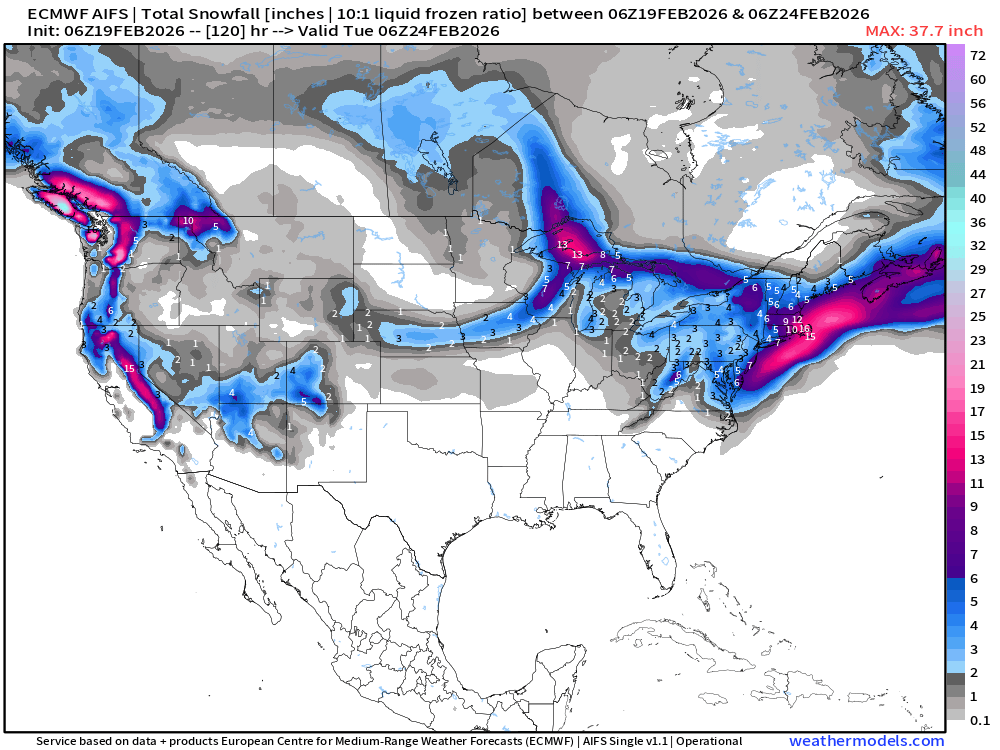
ECMWF AIFS Single 06z — Snowfall Next 5-days
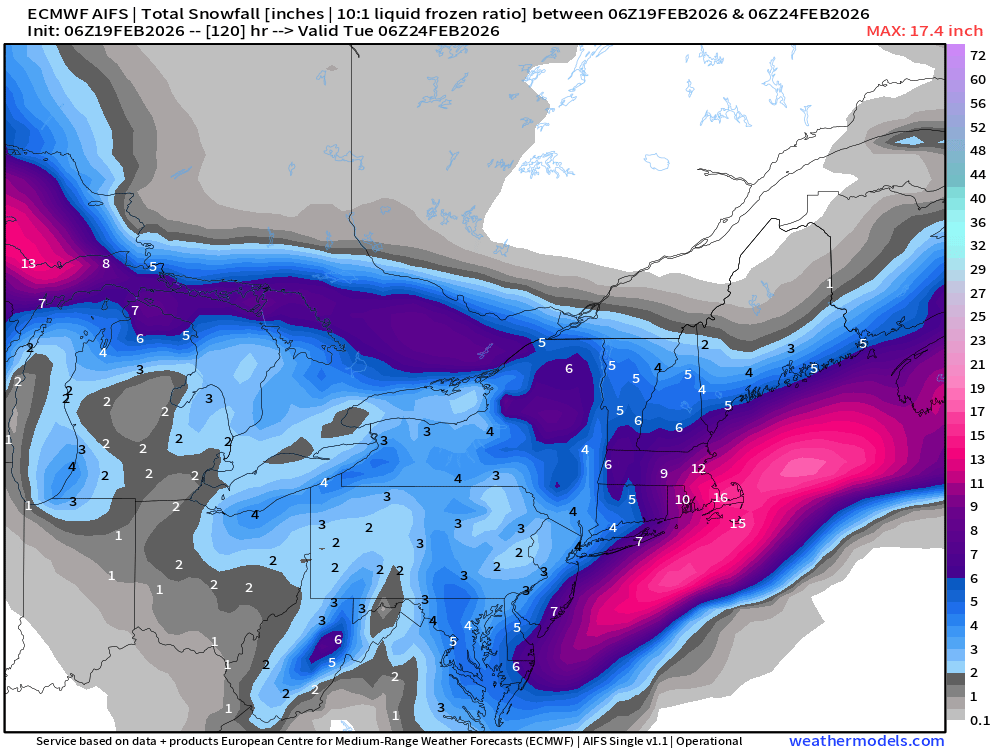
4” to 6” from Washington D.C. to NYC … but heavier accumulations along immediate Atlantic coast … with 12” to 16” in Southeast New England.
Small differences in timing of “rapid intensification” determine subsequent track and impacts
Compare ECMWF IFS (left, 983 mb) and it's Ensemble Mean (right)
Quite similar.
ECMWF AIFS Single and AIFS Ensemble (mean)
AIFS-Single is to the west — closer to the coast while the AIFS-ENS mean is slightly east.
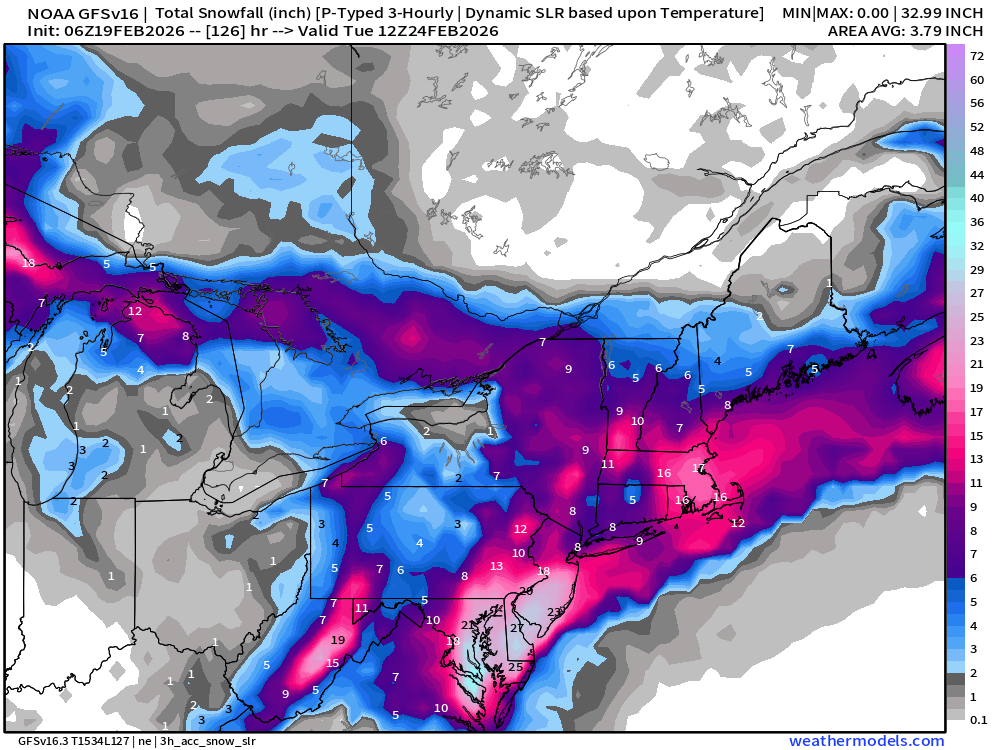
GFS 06z — continues to rapidly intensify the storm along the immediate coast.
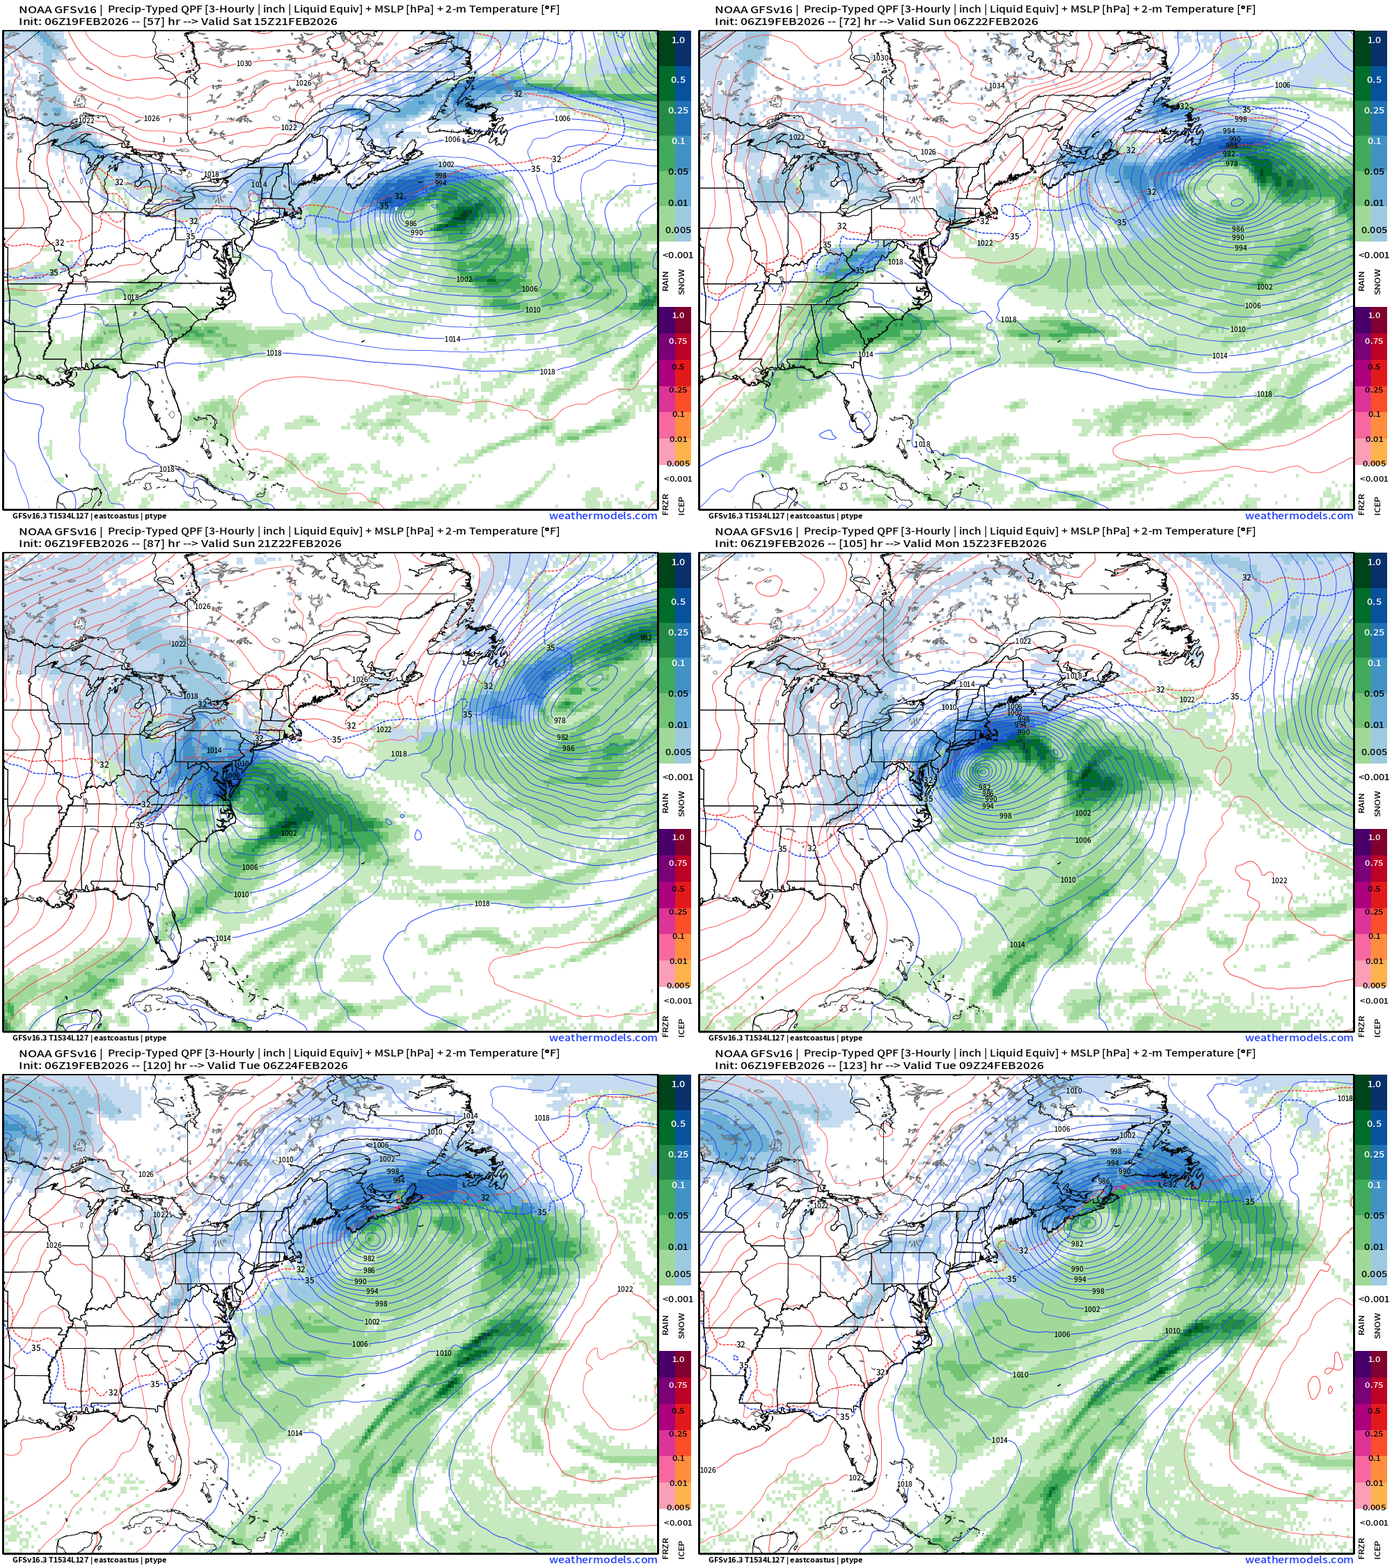
GFS 06z Heavy Snowfall for the Chesapeake Bay environs including D.C. and Philly — however, this is still an outlier solution!
Enormous amounts of QPF > 3” available as QPF would be 2 to 3+ feet of snowfall, which is unbelievable.
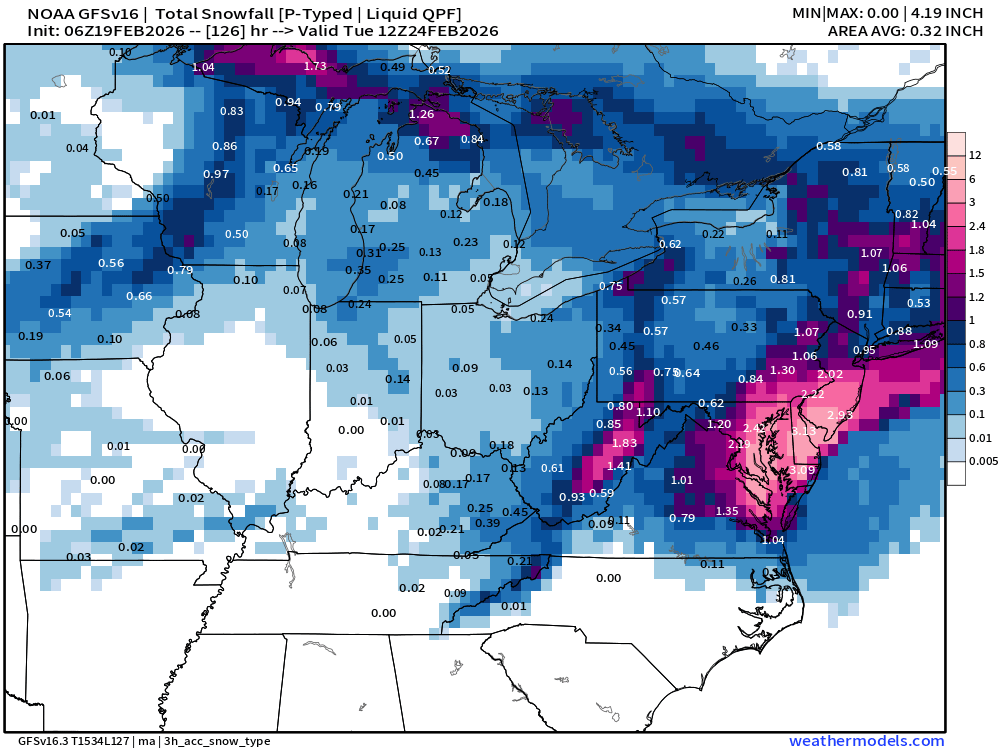
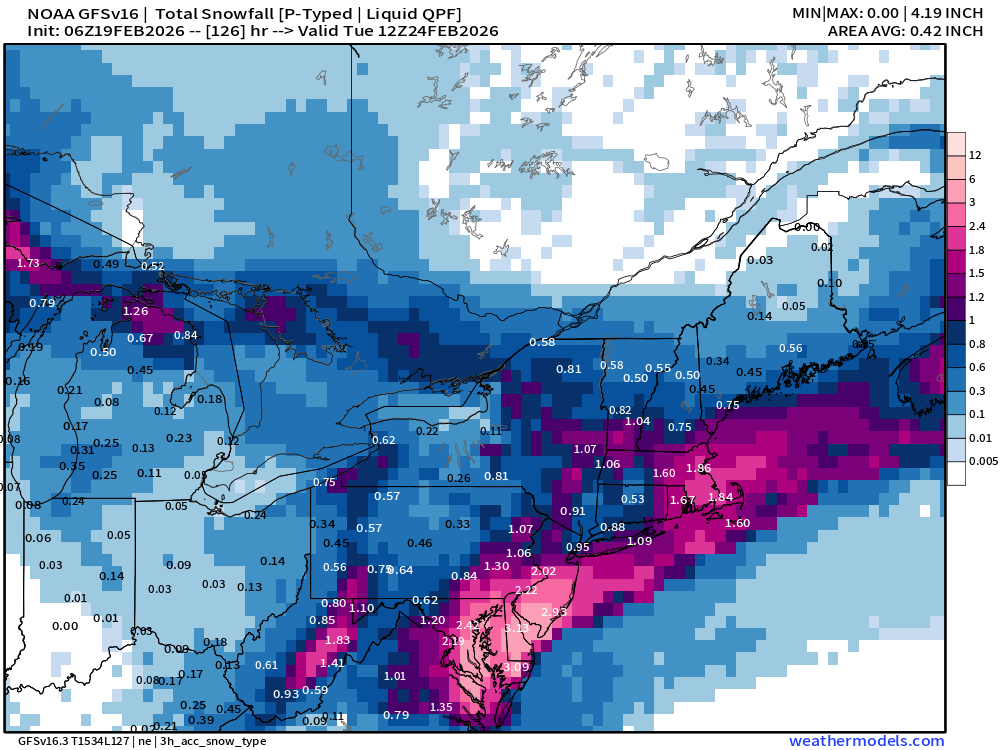
GFS shows a major mid-Atlantic snow storm but the ECMWF suite of guidance is not on board. We are at 10% range for a “blockbuster” with the GFS model holding out with major impacts.
Subtle Difference in Intensity and tilt of the 500 mb Vorticity Maximum (trough axis) — ECMWF left / GFS right
ECMWF left / GFS right
ECMWF is flatter, less amplified, and thus will not “phase” immediately with the surface low pressure center — delaying intensifying until well east of the mid-Atlantic coast. However, GFS lights the fuse sooner and “bombs out” right along the coast = major impacts.
As you probably can guess, I am not a fan of the “model comparisons” but it’s worthwhile to understand why each model is generating a given solution.
CONUS Radar Simulation through early morning Saturday (7 AM ET)
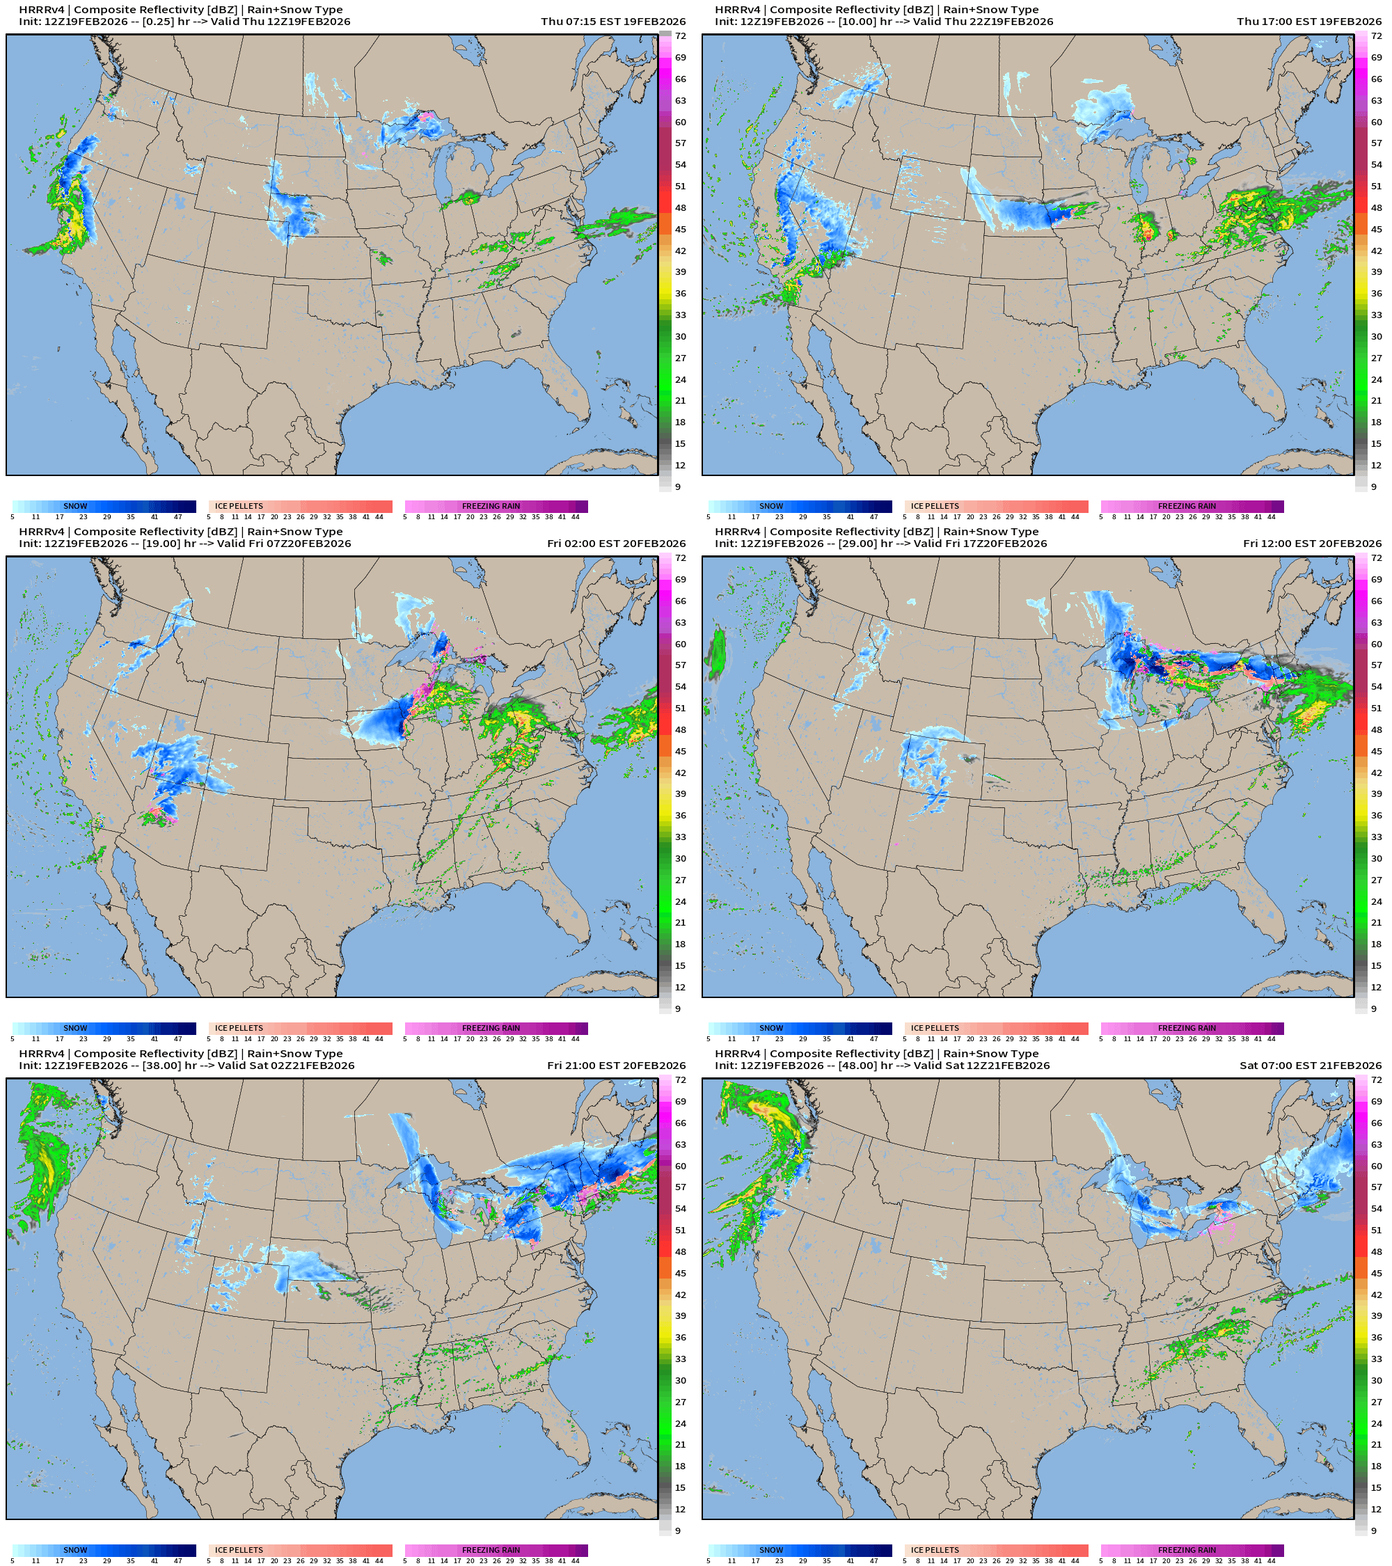
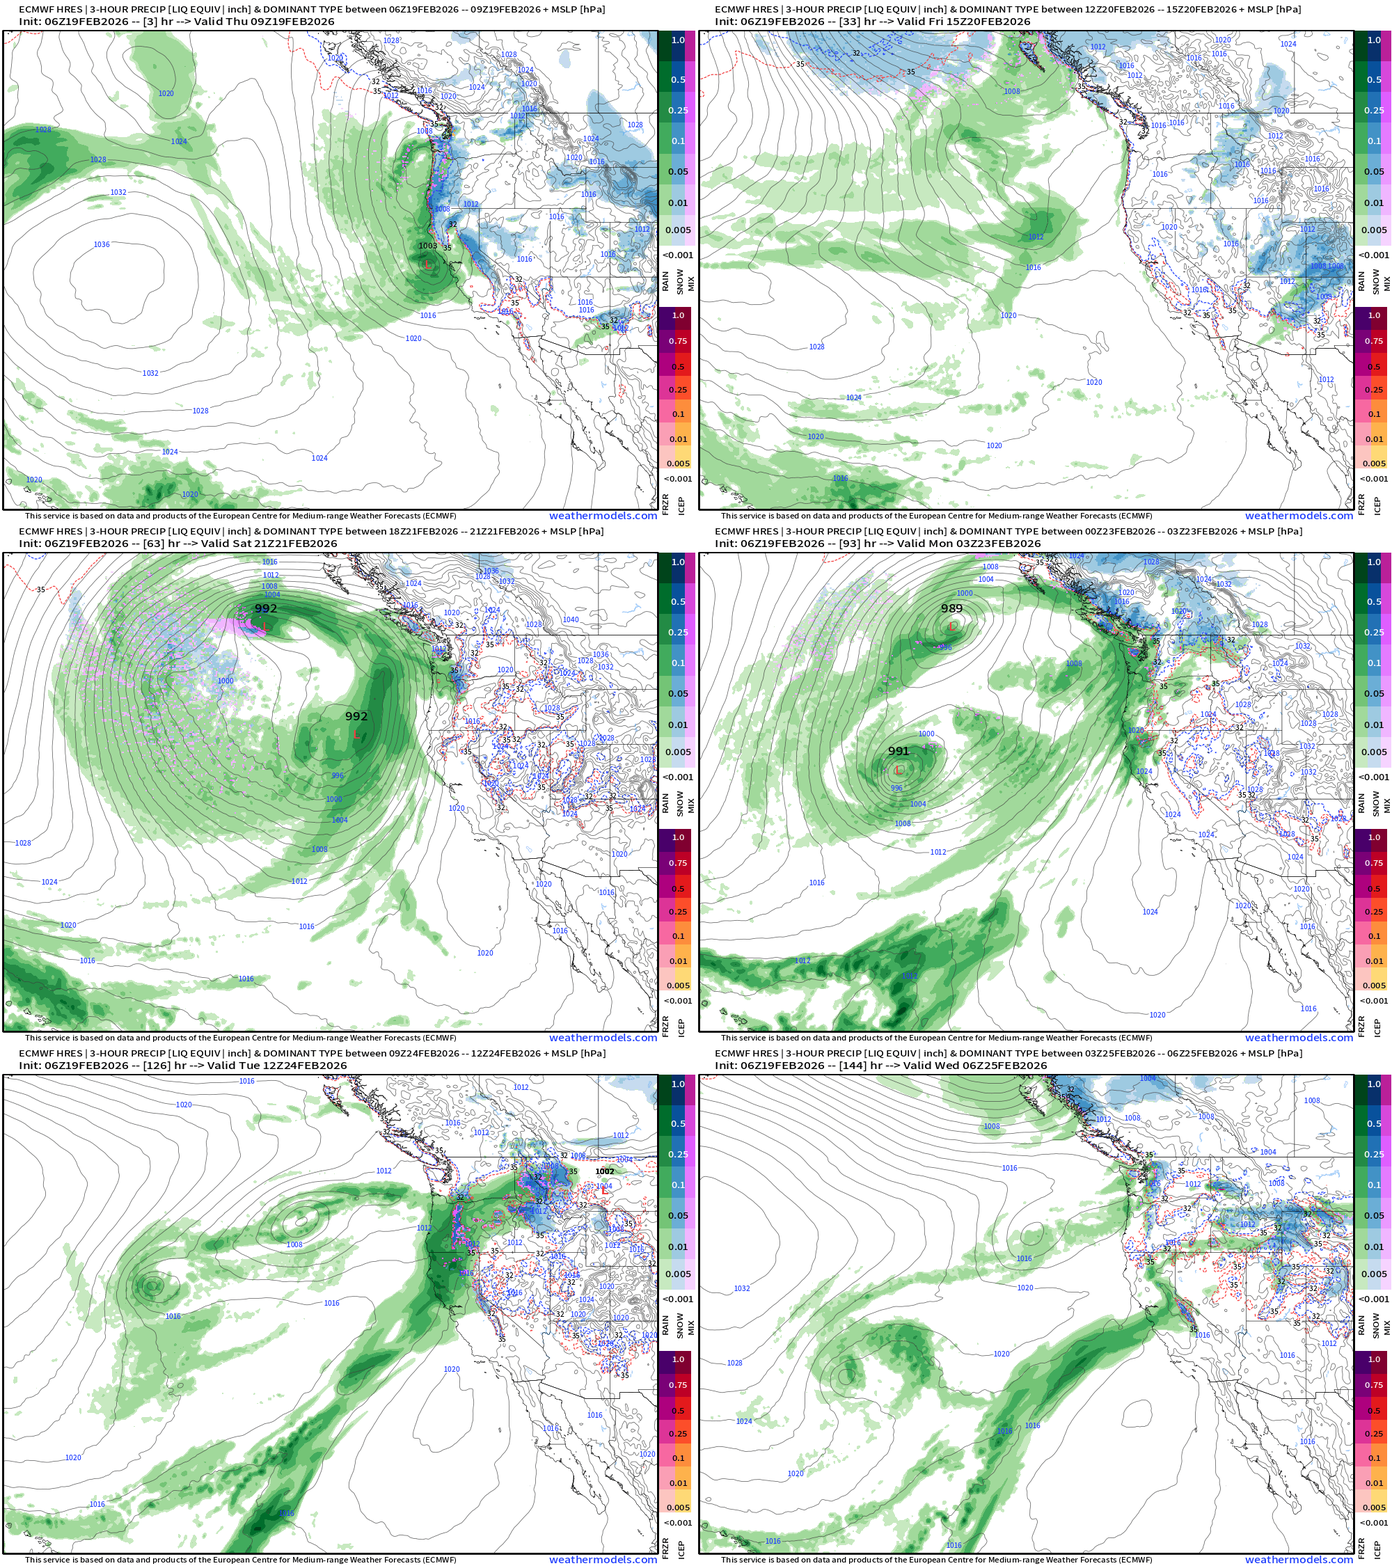
California gets a break after Thursday’s storm … while the next one rolls into the Pacific Northwest on Friday.
Severe weather (Enhanced risk) in the warm sector centered upon Indianapolis on Thursday
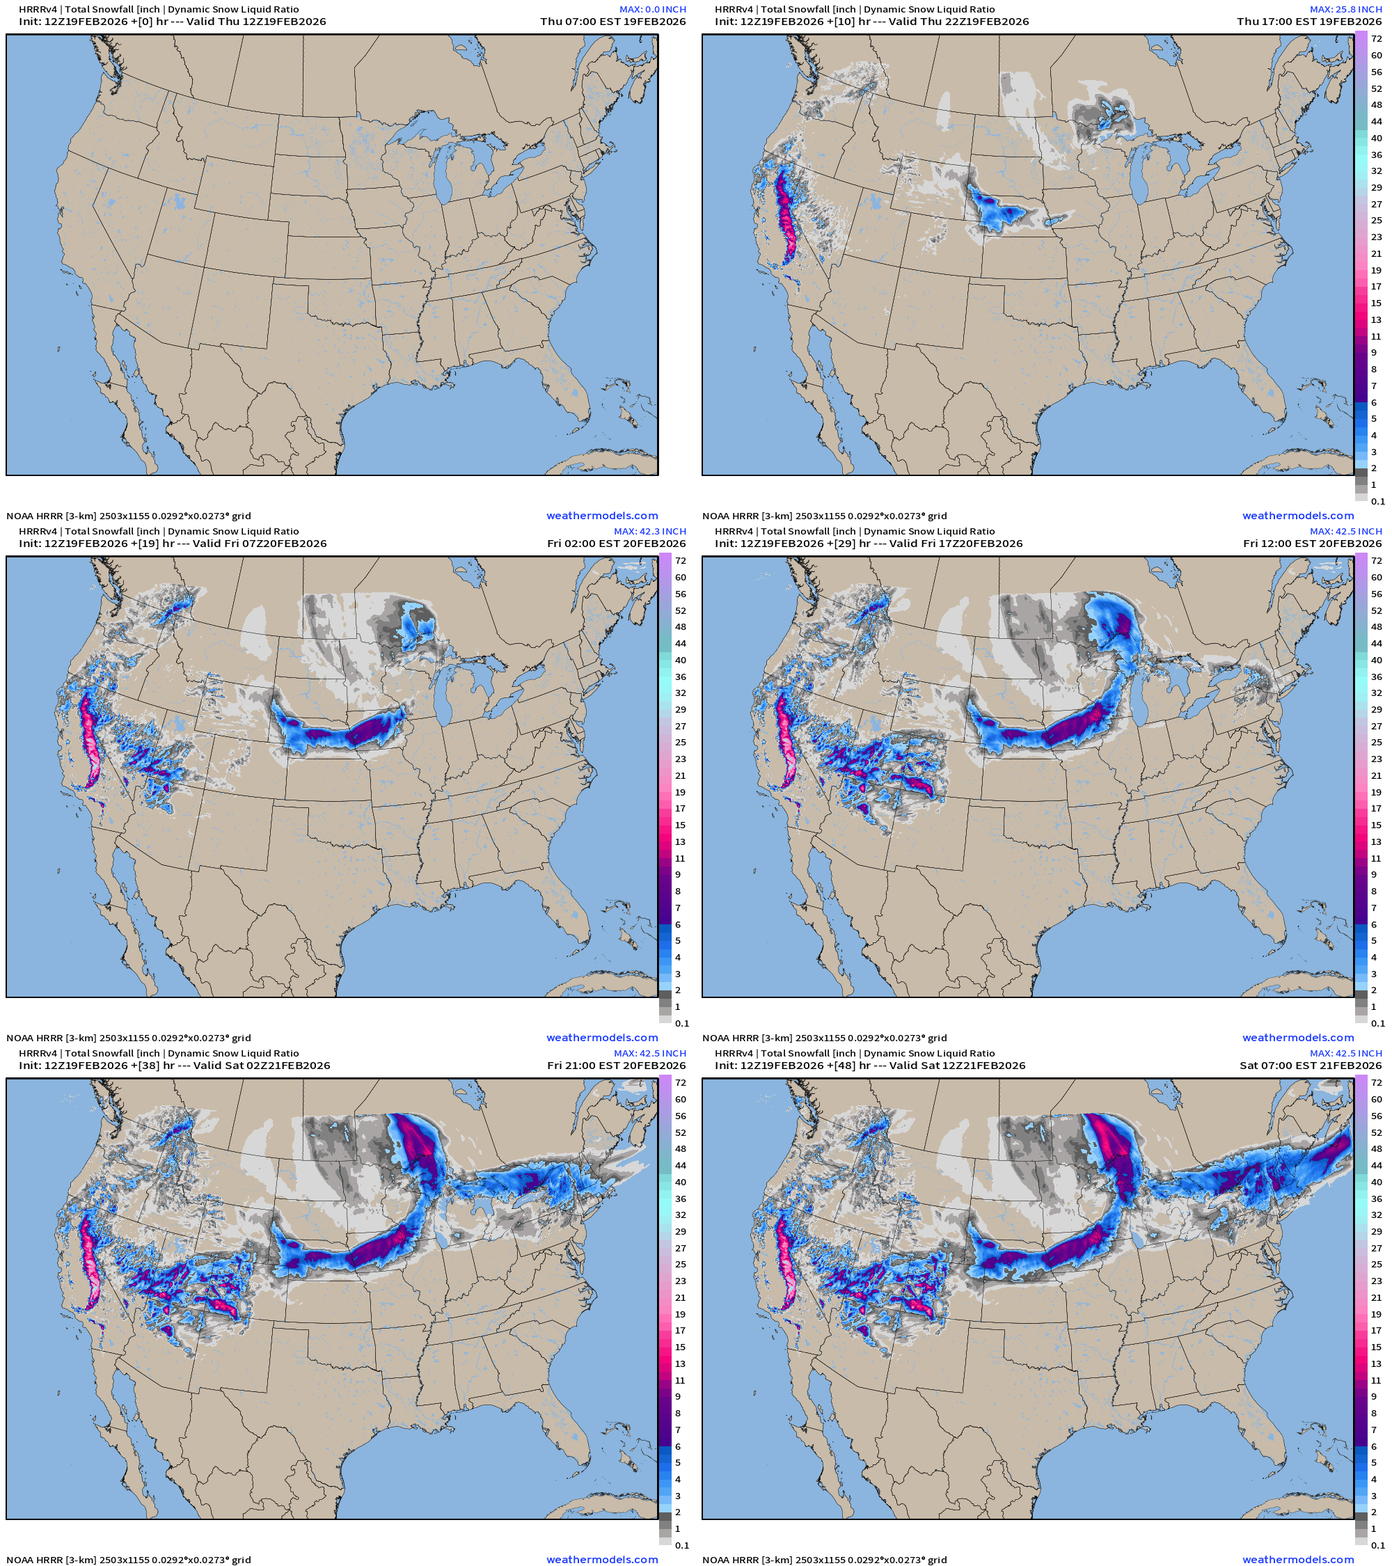
Snowfall on backside of the Great Lakes storm — and then into New England within the colder air
Snowfall Next 48-hours
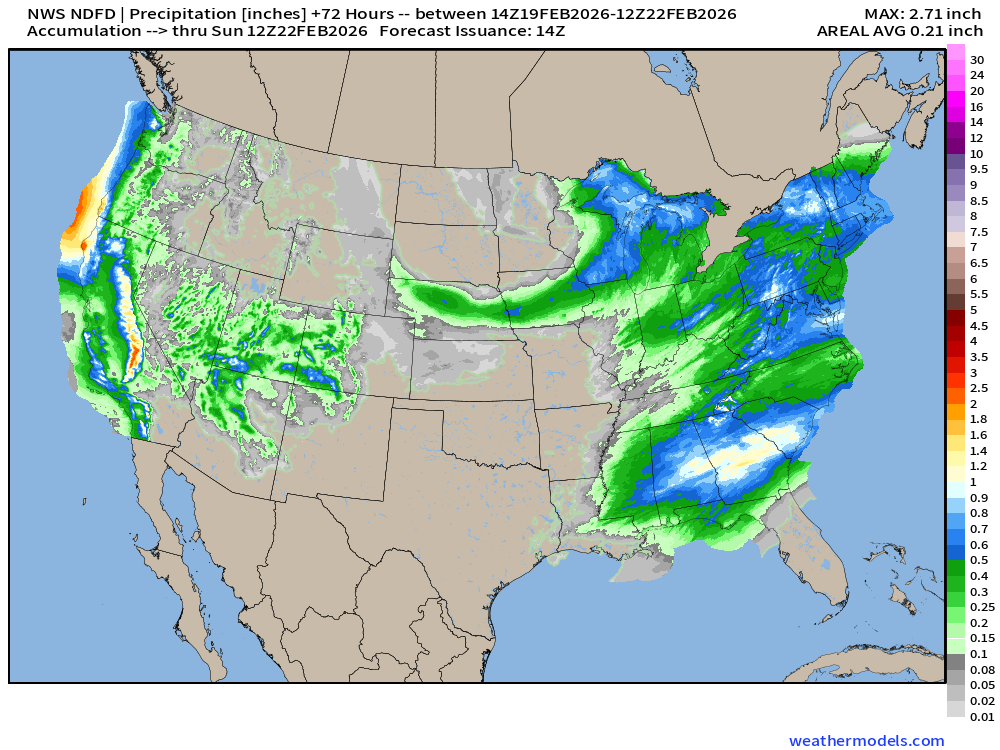
NDFD NWS Total Precipitation Next 72-hours
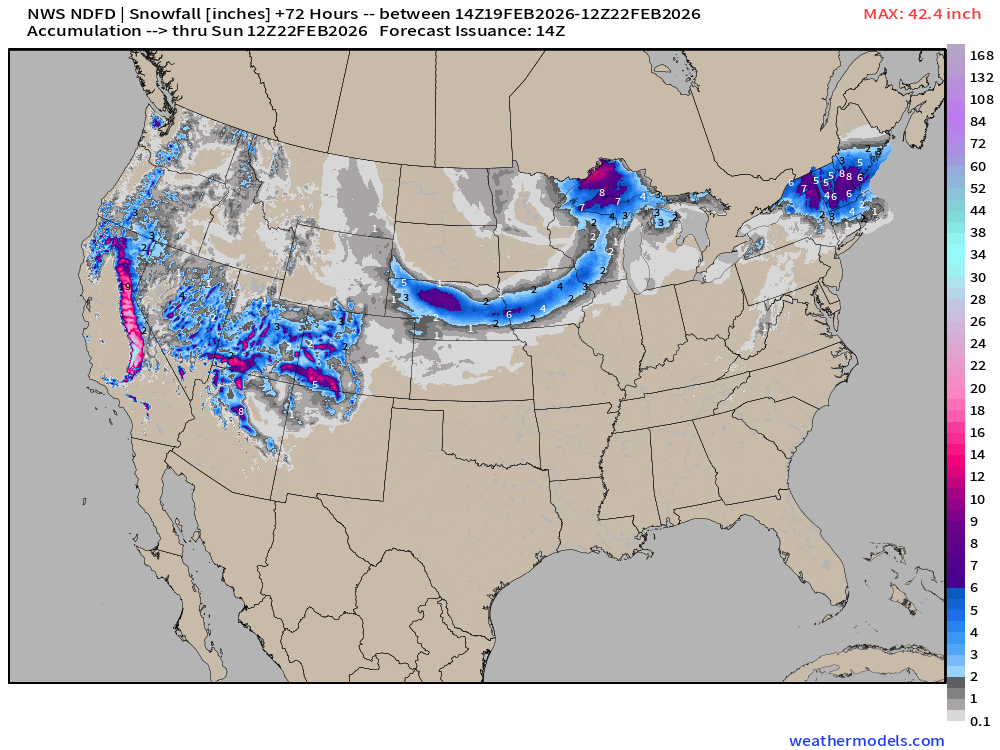
NDFD NWS Total Snowfall Next 72-hours
ECMWF 06z Precipitation Type + Intensity | Next 6-days
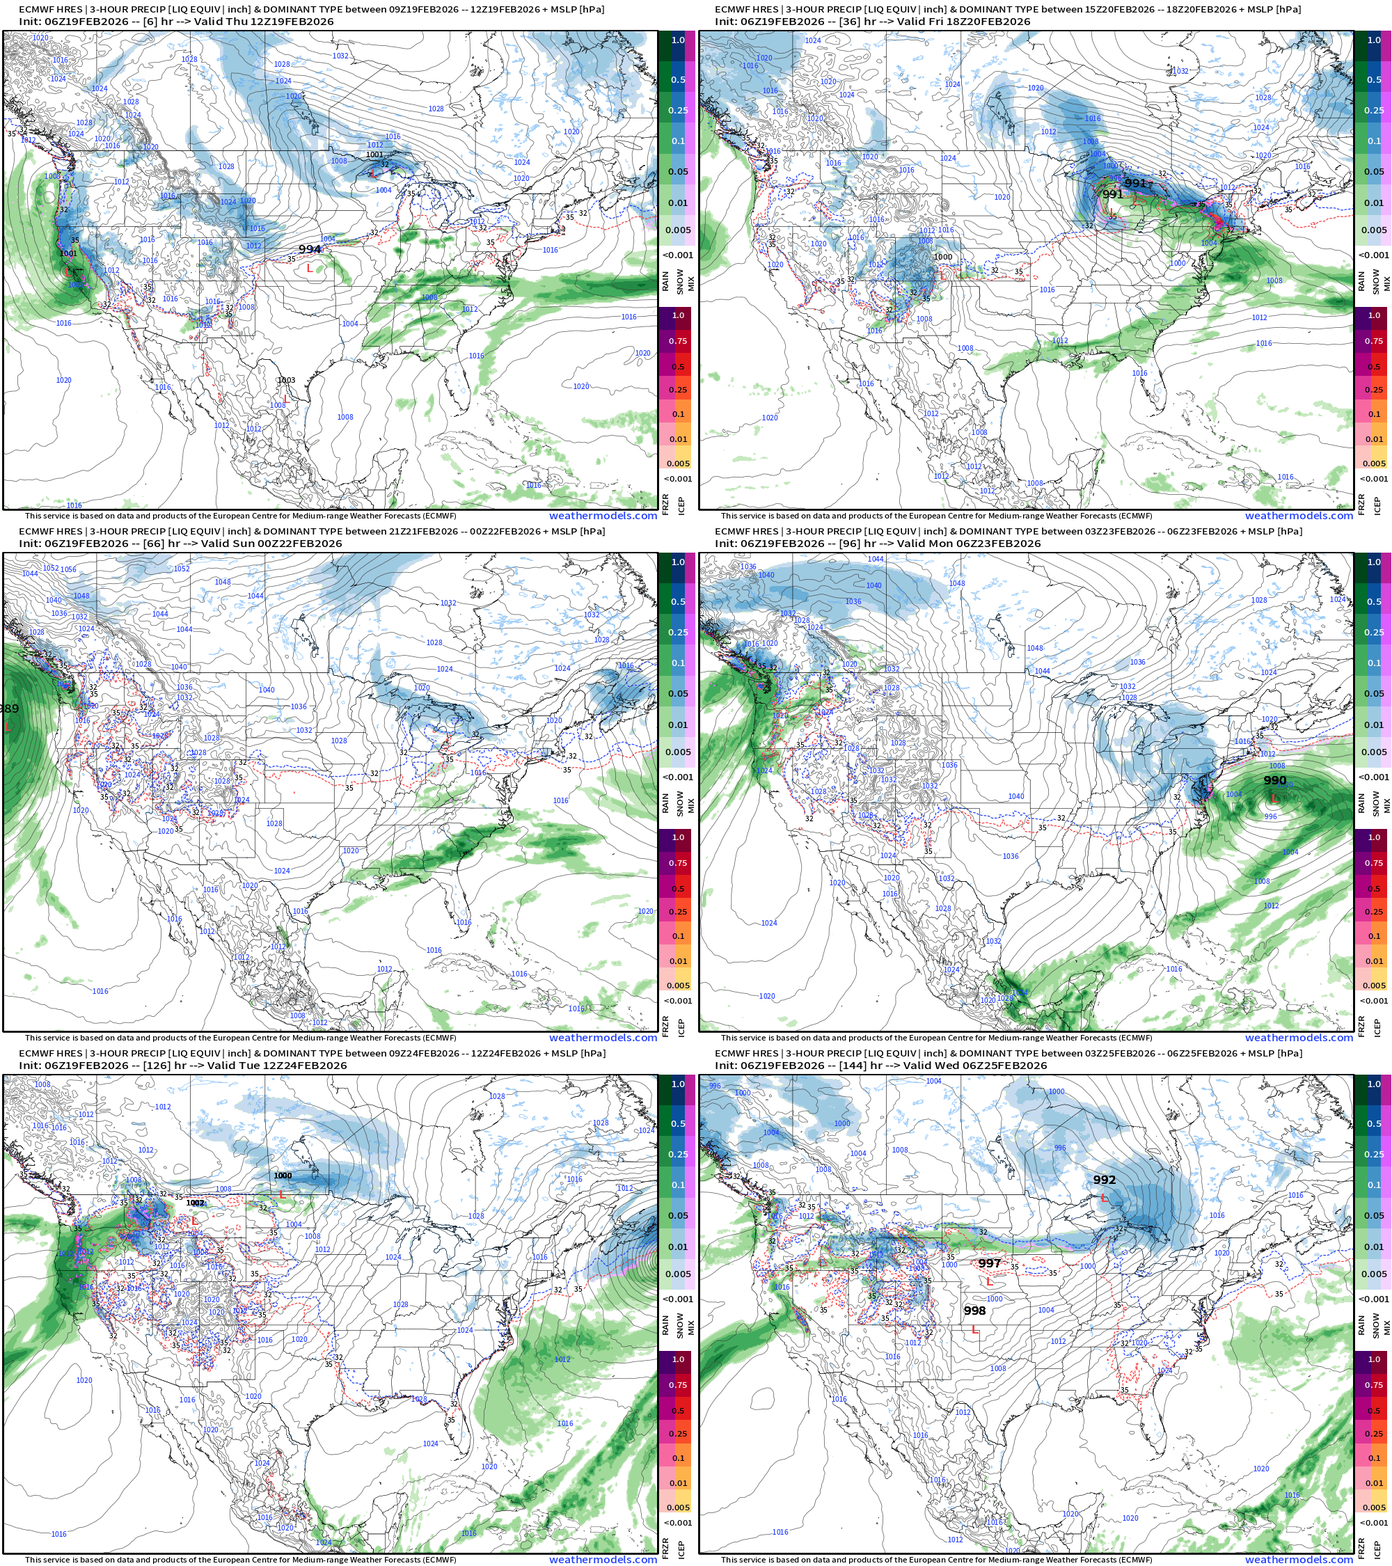
Eastern U.S. Next 6-days storm systems | ECMWF 06z
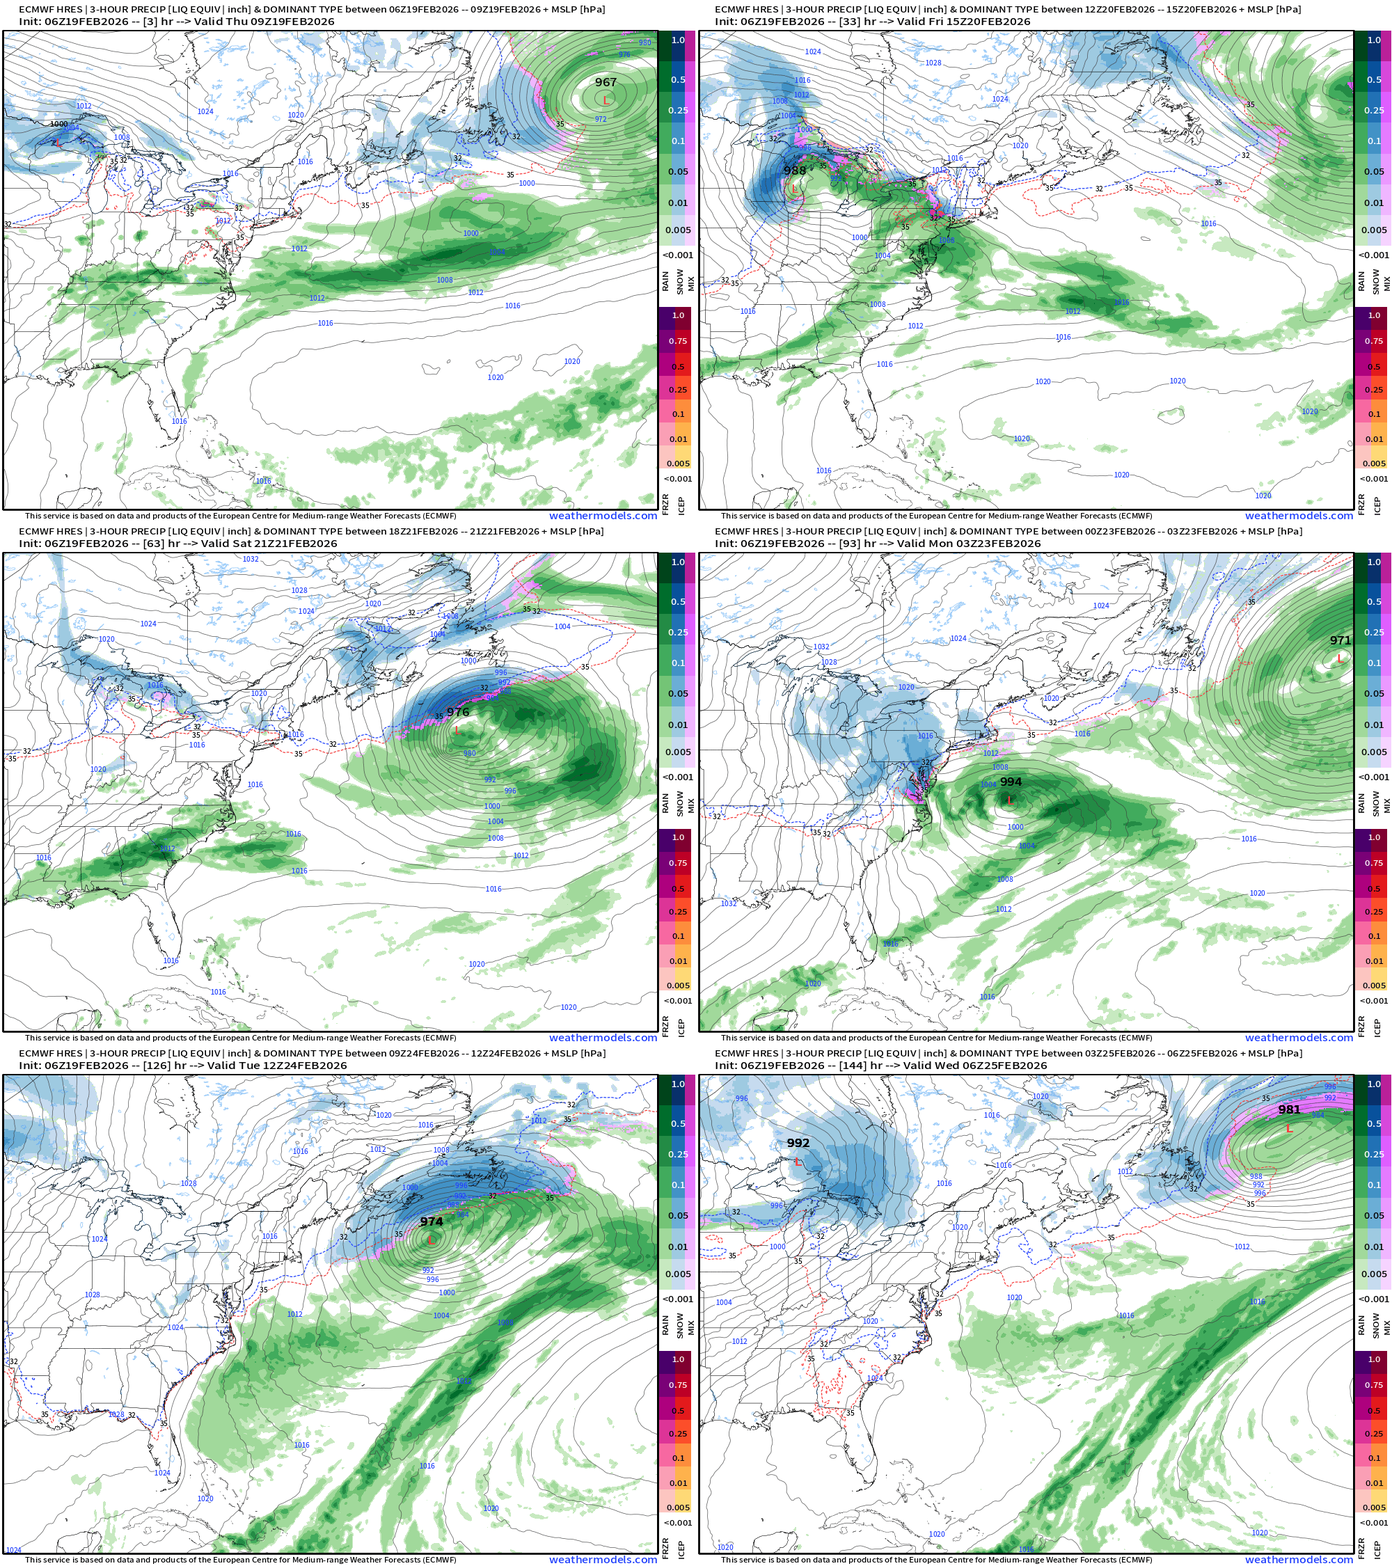
Nor’easter Watch Sunday-Monday — but sufficiently offshore to avoid major impacts — except for NOAA GFS
Western U.S. Storm Systems — only short break Fri-Sat for California
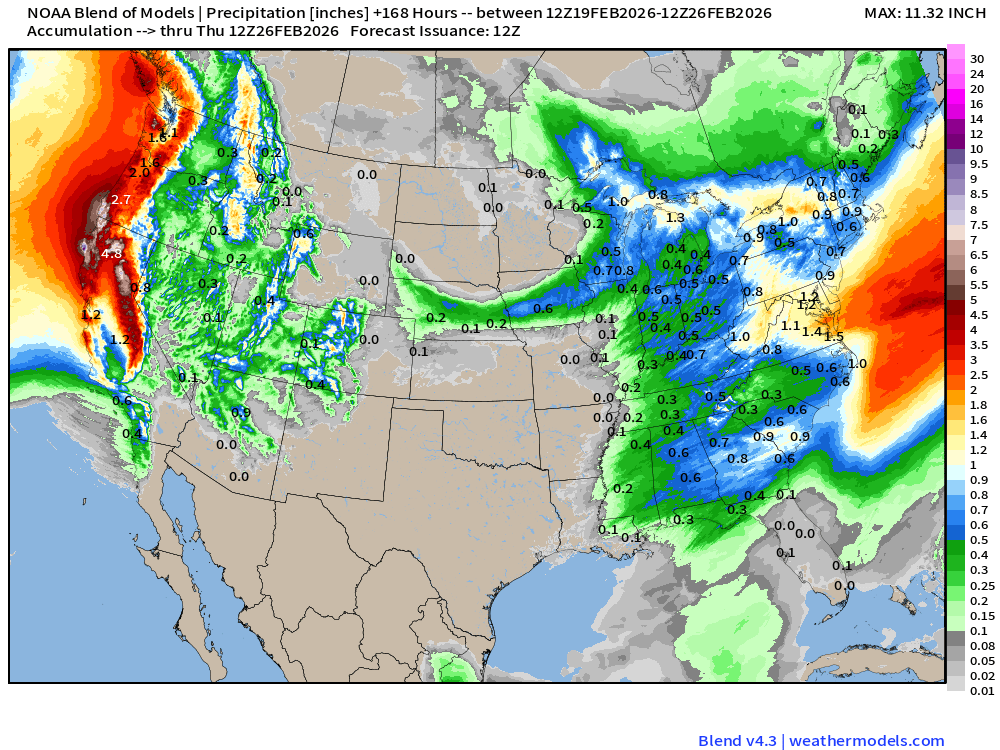
Blend of Models | 7 Days Precipitation Total
Blend of Models | Total Snowfall Next 7-Days
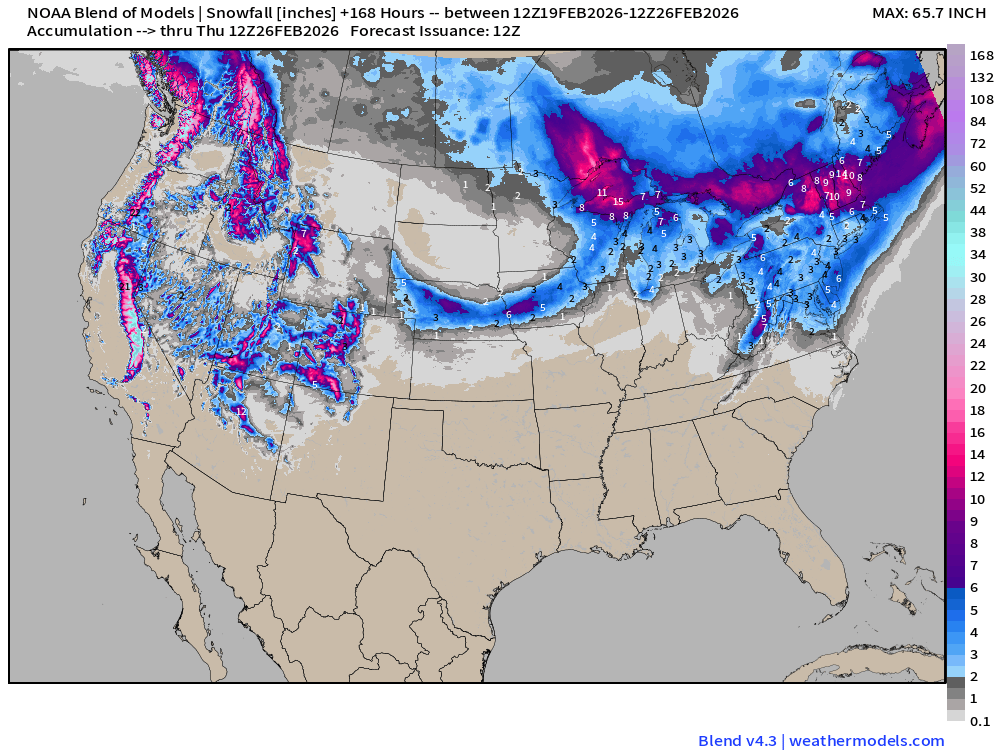
Blend of Models ~4” range for the Mid-Atlantic matching ECMWF
Significant snowfall for the Mountains continue!
ECMWF IFS 06z | Precipitable Water Next 6-days
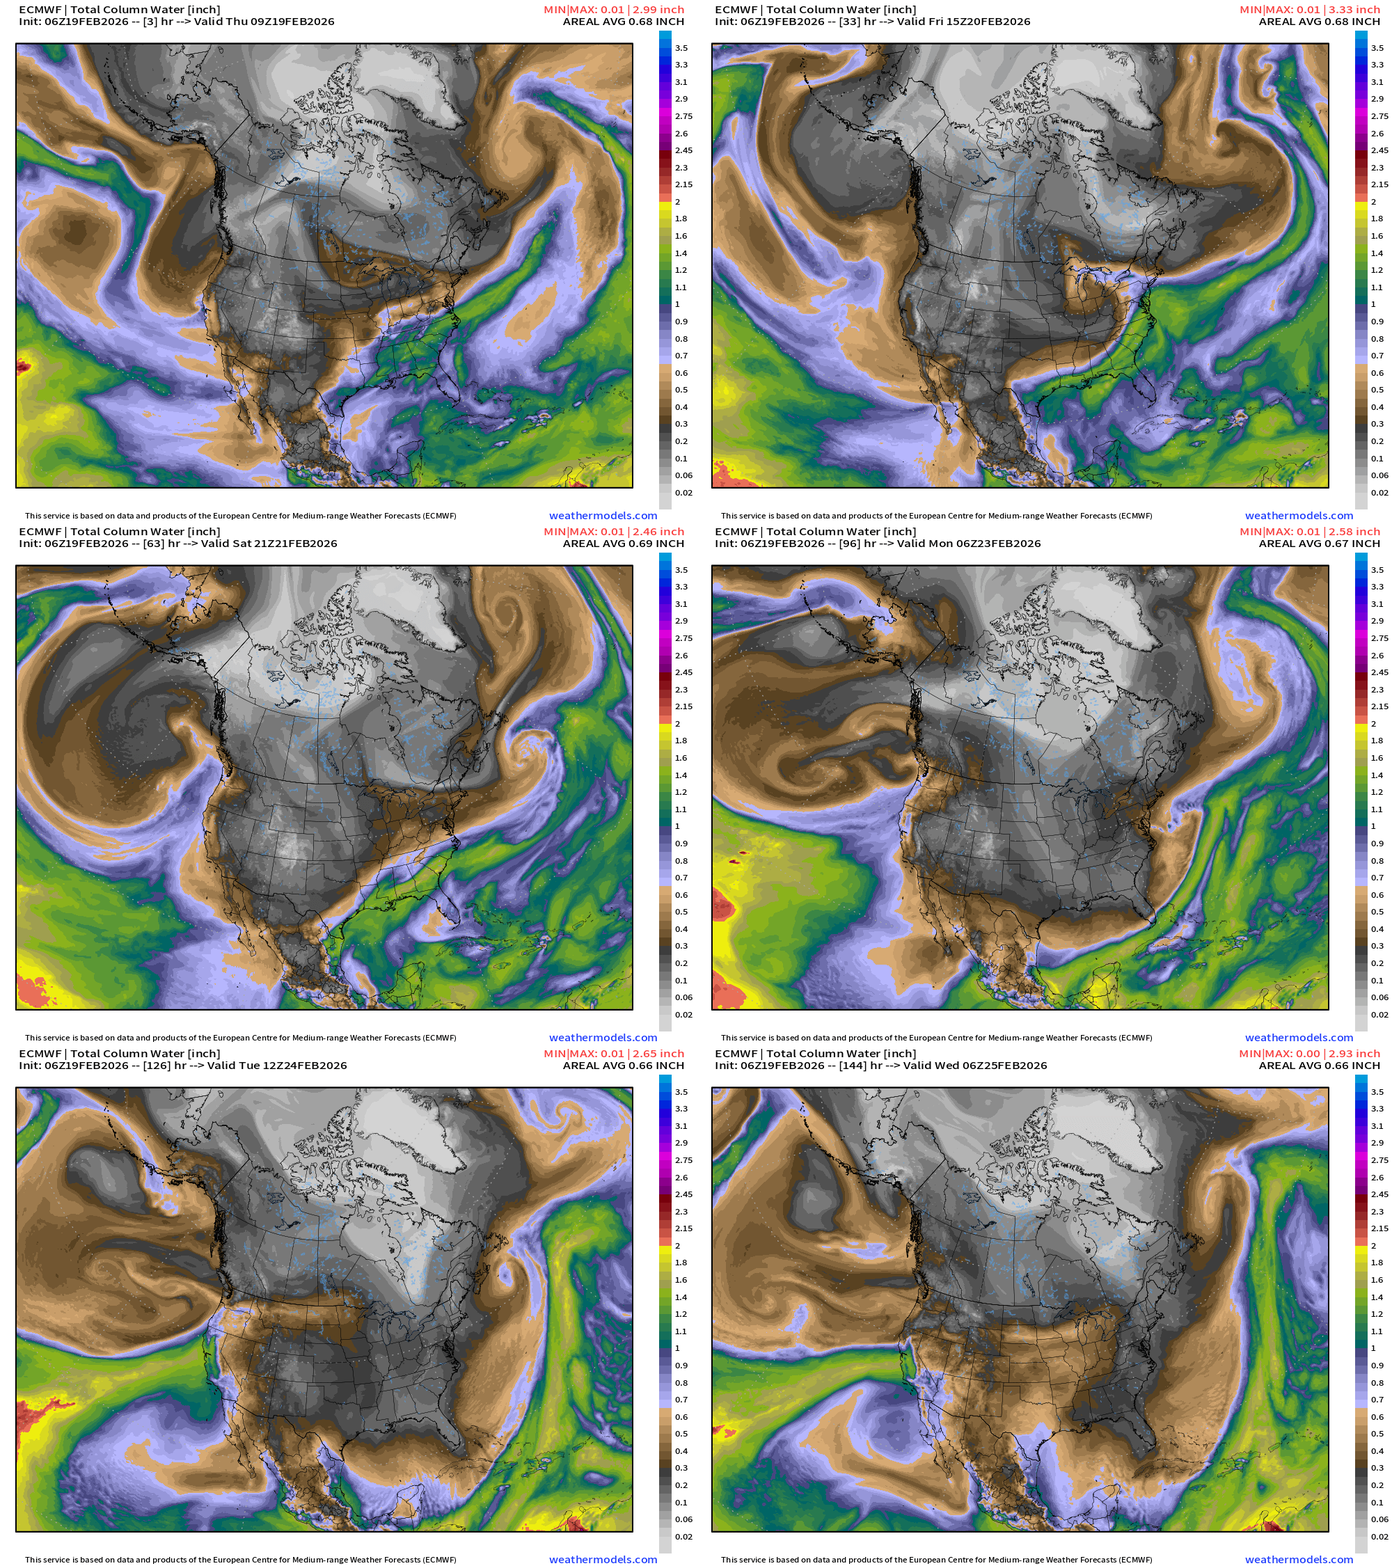
Temperature Anomaly | Next 15-days | ECMWF EPS 00z
5-Day Chunk #1 | Temperature Anomaly | Feb 19 - Feb 23
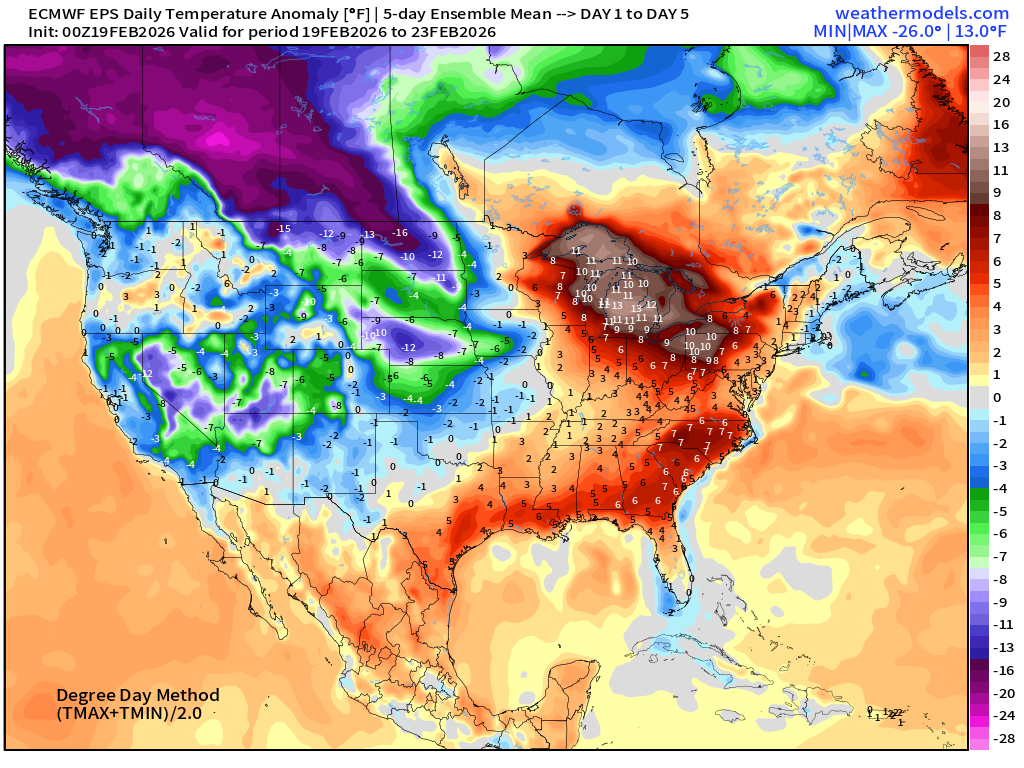
5-Day Chunk #2 | Temperature Anomaly | Feb 24 - Feb 28
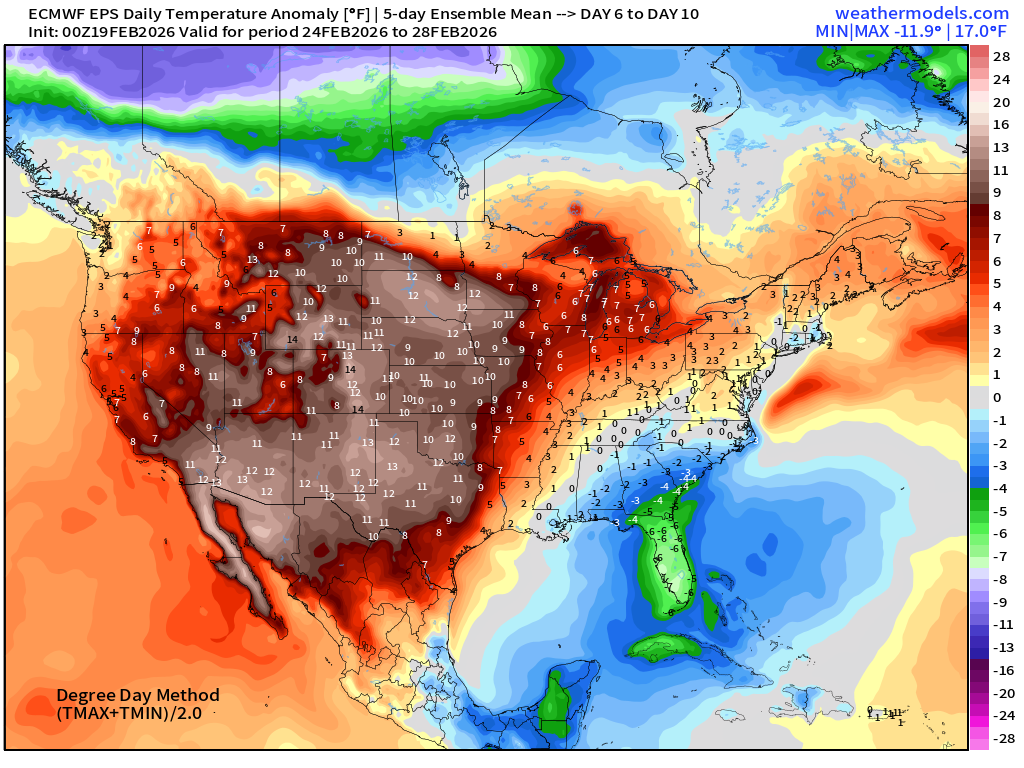
5-Day Chunk #3 | Temperature Anomaly | March 1 - March 5
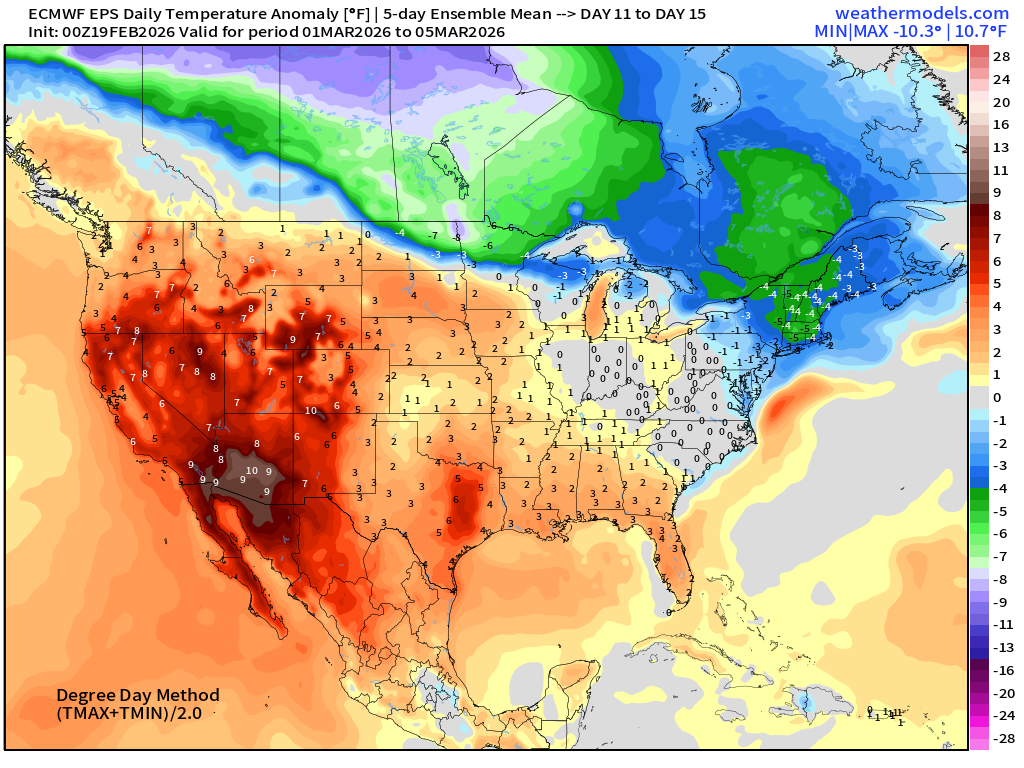
Maps sourced from weathermodels.com designed and innovated by yours truly! Please subscribe there for real-time access to the newest maps, charts from all of the weather models including ECMWF and AIFS, and NOAA GFS/GEFS.
- Milepost
- 875 · laid 2026-02-19T15:50:12.187000Z
- Source
- https://weather.substack.com/p/february-19-2026-winter-storm-watch
- Digest
- a0fe83ac91e645db2924bebf233a54dbfcf1a946c3a38ffcf22d642674d2faff
- Machine
- JSON