February 11, 2026 Wednesday Evening Update
Mid-February thaw into next week will feel incredible for frozen Americans
February 2026 was the 4th-warmest February in the 132-year national record (1895–2026), at 40.3°F against a 1991–2020 normal of 35.6°F (+4.6°F).
February 2026 was the 5th-driest February in the 132-year national record (1895–2026), at 1.4in against a 1991–2020 normal of 2.1in (-0.7in).
NOAA/NCEI Climate at a Glance, contiguous United States. This is the observed record for the month, not a score of anything said in this piece — the forecast ledger begins 2026-08-17 and cannot reach earlier posts.

Turning the corner on winter? At least east of the Rockies, we are warming up with the Polar Vortex mainly kept locked up in northern Arctic Canada. That’s good news also more of a subtropical moisture feed can help dent the growing drought conditions from Texas into the Southeast including Florida.
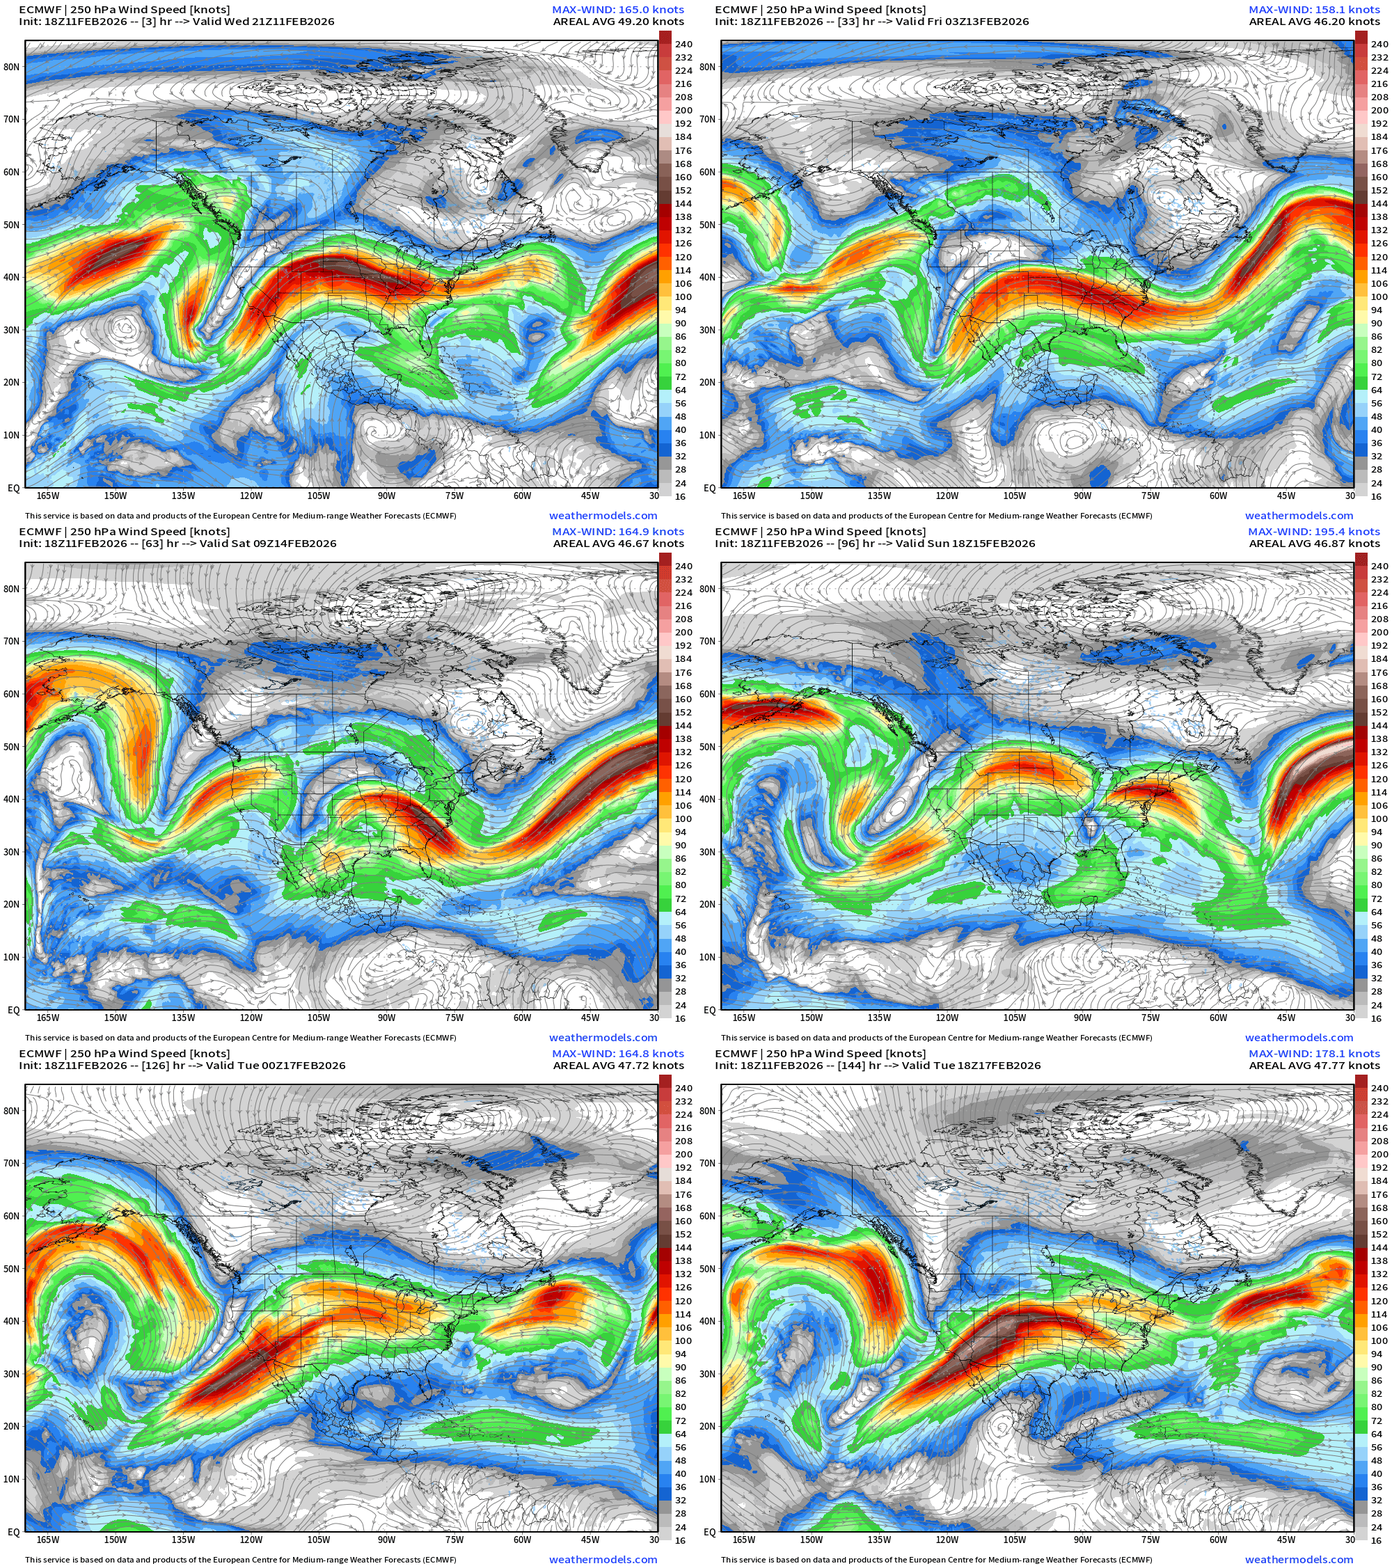
The Jet Stream buckles off the U.S. West Coast, dips southward, and then streaks eastward with subtropical moisture. This will cool off California and unsettle the west coast with bouts of rain and snowfall for the mountains. —> Pattern flip!
Jet Stream Next 6-days
Warmer Temperatures into Next Week — Highs through next Friday
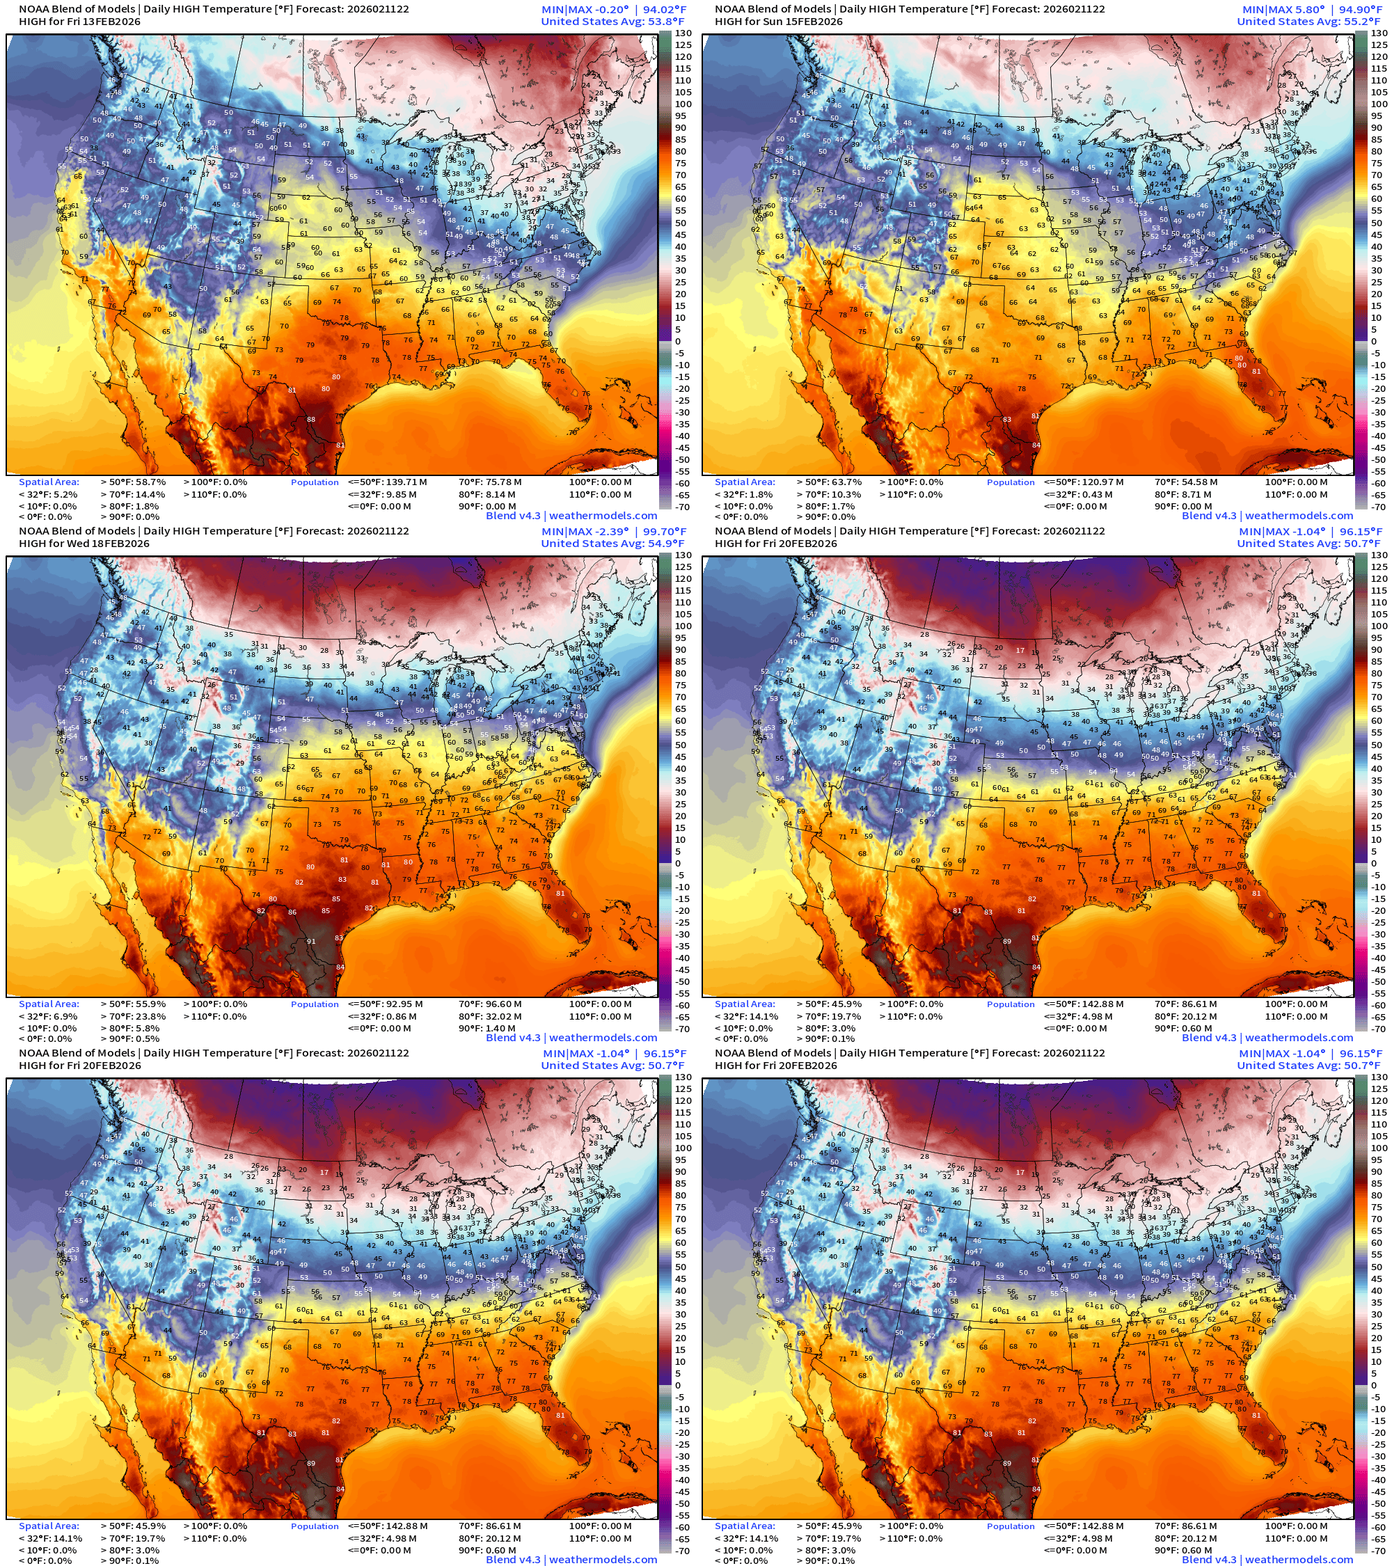
Good news — daytime highs above freezing for almost entire Lower 48 population during the next 8-days meaning decent thawing with higher mid-to-late February sun angle.
Update on the potential Presidents’ Day Nor’easter: out to sea & limited development! ECMWF 18z update
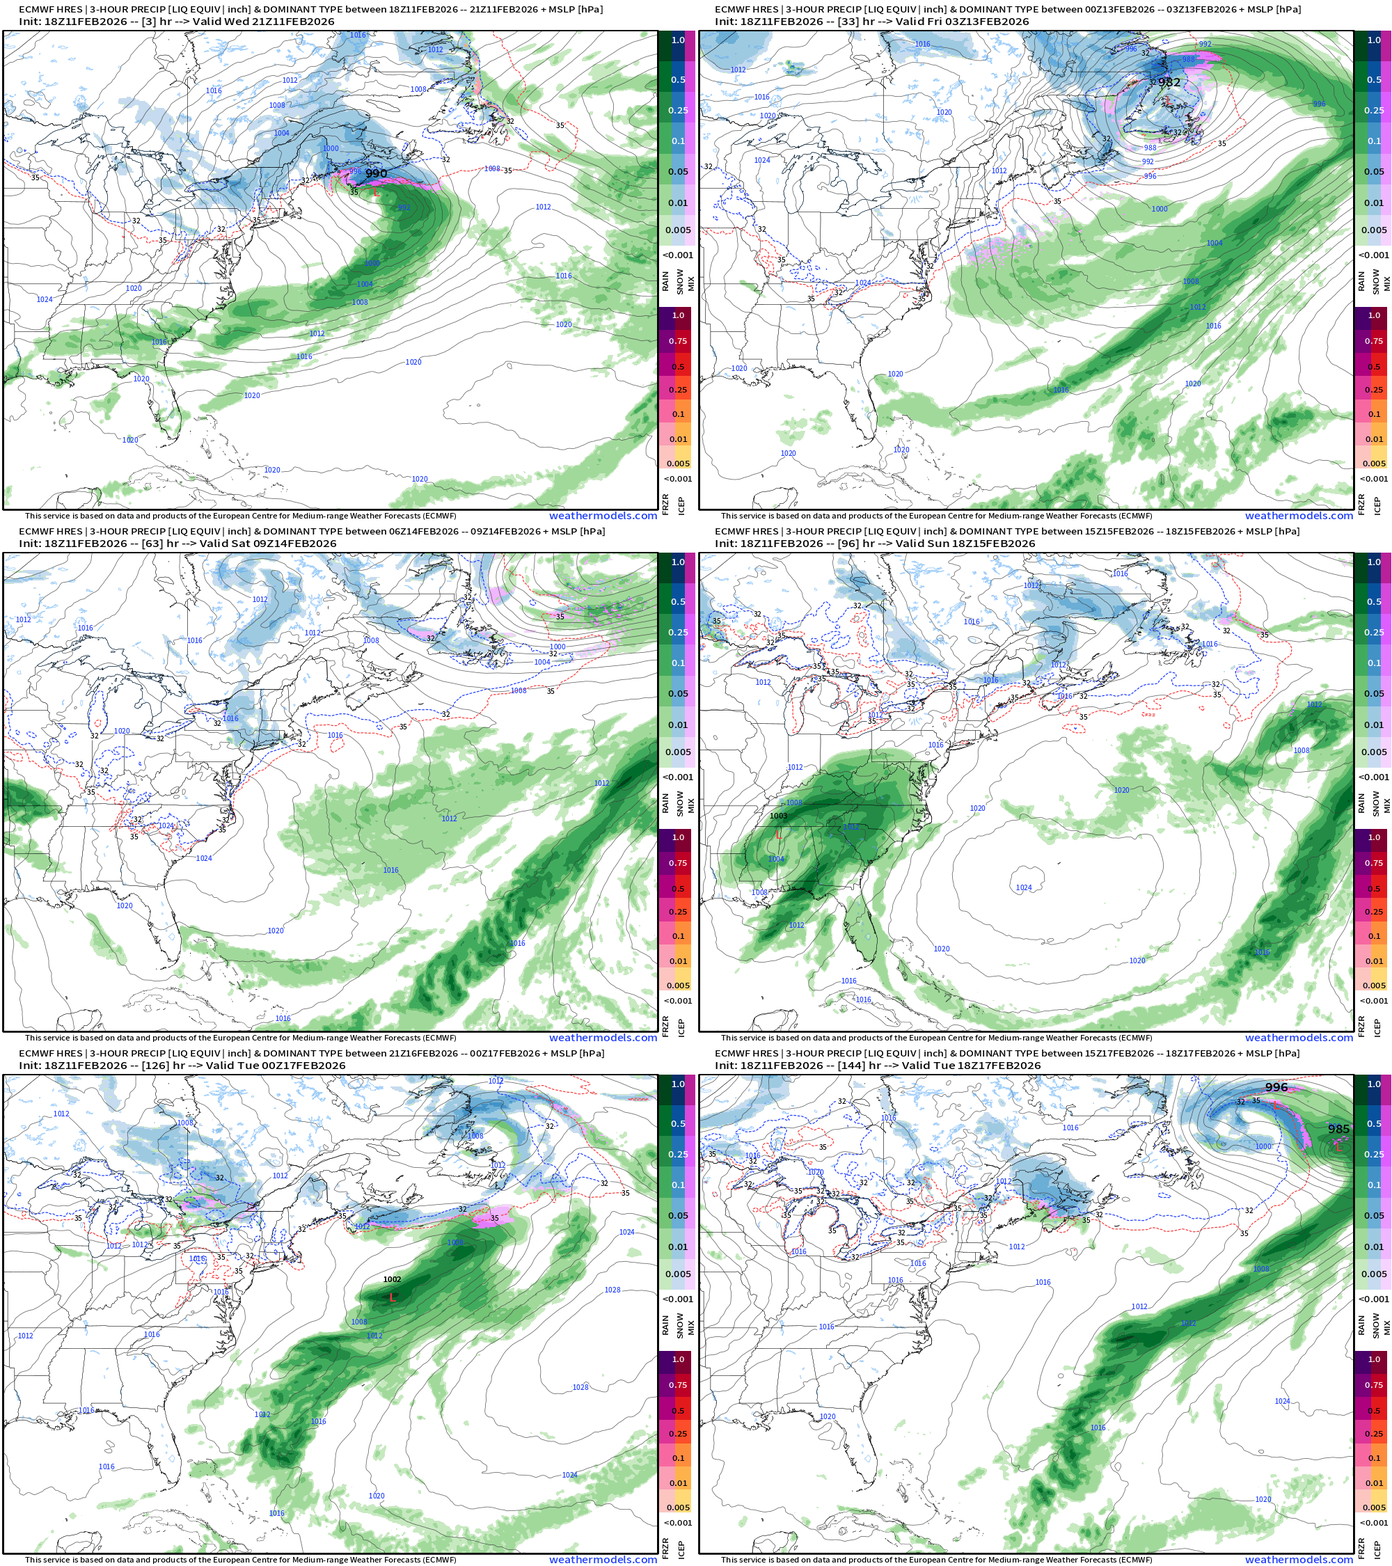
I think we can foreclose potential of a major snowstorm across the Northeast due to lack of phasing of the surface low with the upper-level trough and not enough cold air. So, the precipitation will be rain.
Ensemble probability of 6-inches + Snowfall (18Z EPS)
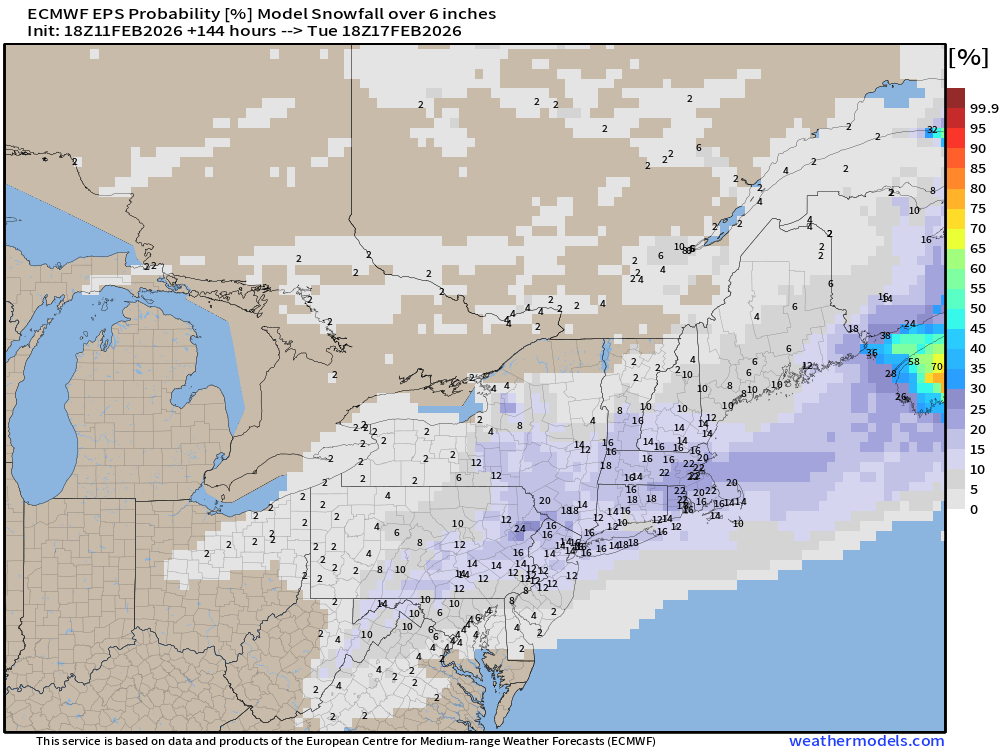
1 in 6 chance of > 6” in New York City and 1 in 5 chance in Boston from the ensembles with many members showing zero. Also, another excellent exhibit why the ensemble mean is misleading.
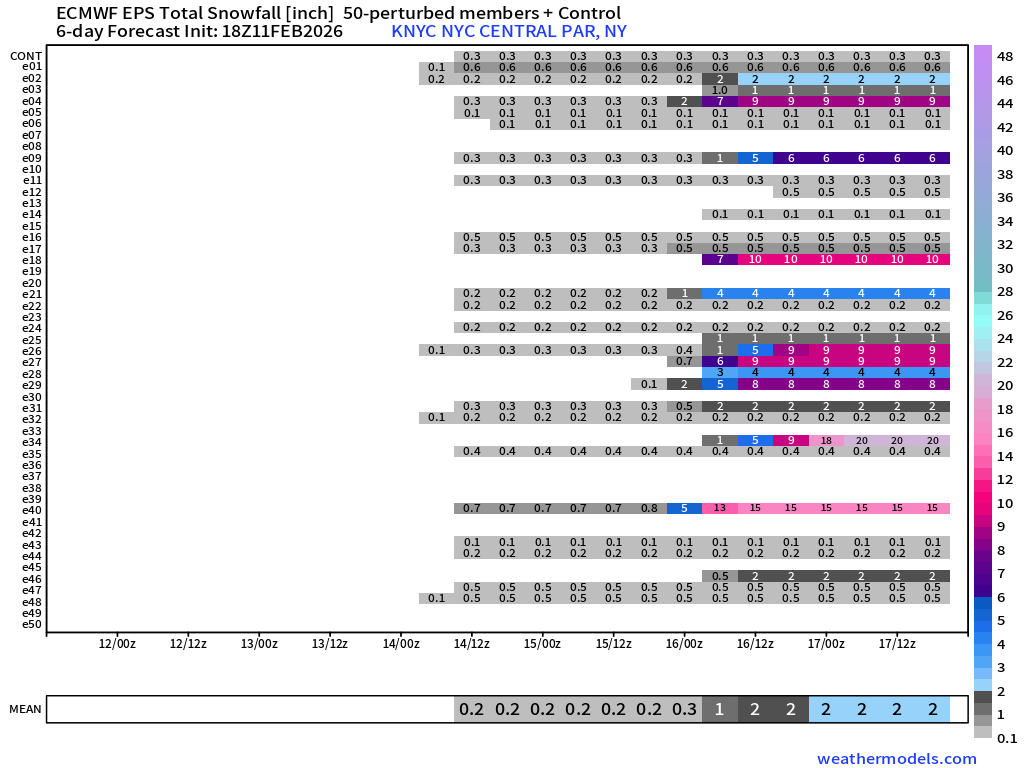
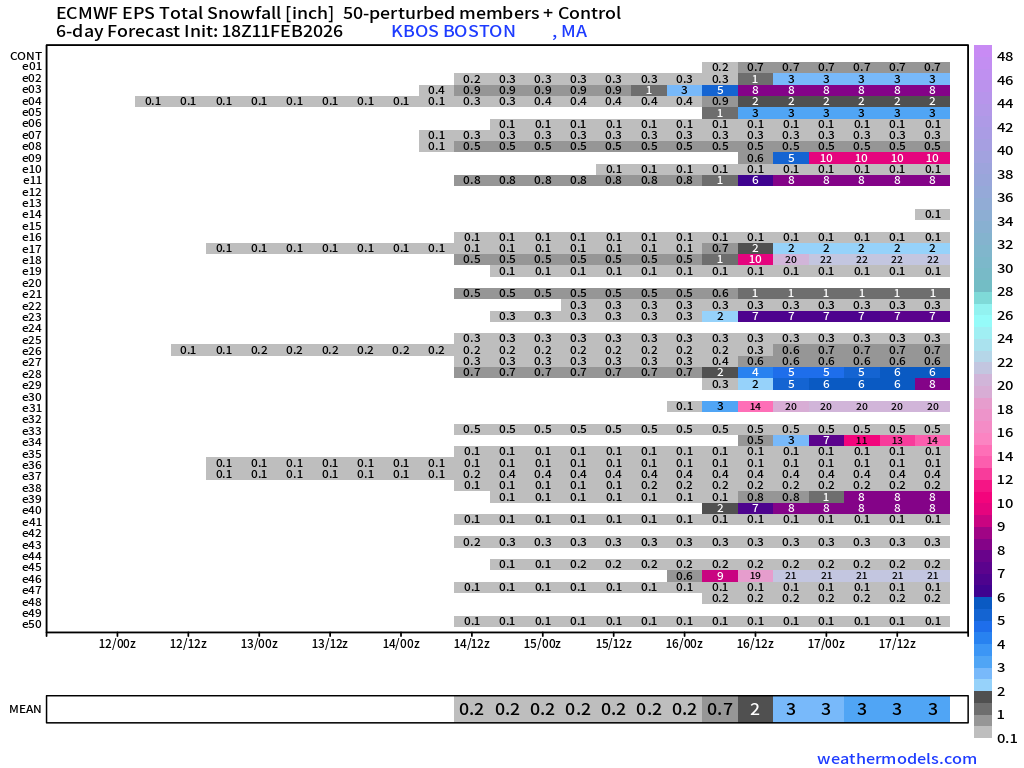
Chance of a “big ticket” snowstorm for Presidents’ Day is low ~10% and not likely.
Headlines this Wednesday:
Major warming trend for much of the Lower 48 relative to the frigidity we saw over the past 2 weeks.
Upper-level pattern change — more western moisture (and now colder) with the jet stream bending into the U.S. Southwest and connecting subtropical moisture and warmth for the southern U.S.
Major Canadian Arctic cold pool intensifies into late February waiting for an opportunity to plunge southward. Are we done with the “Polar Vortex” for this winter or one more dance? Still undetermined past Day 10!
Integrated Vapor Transport — Atmospheric Rivers next 6-days
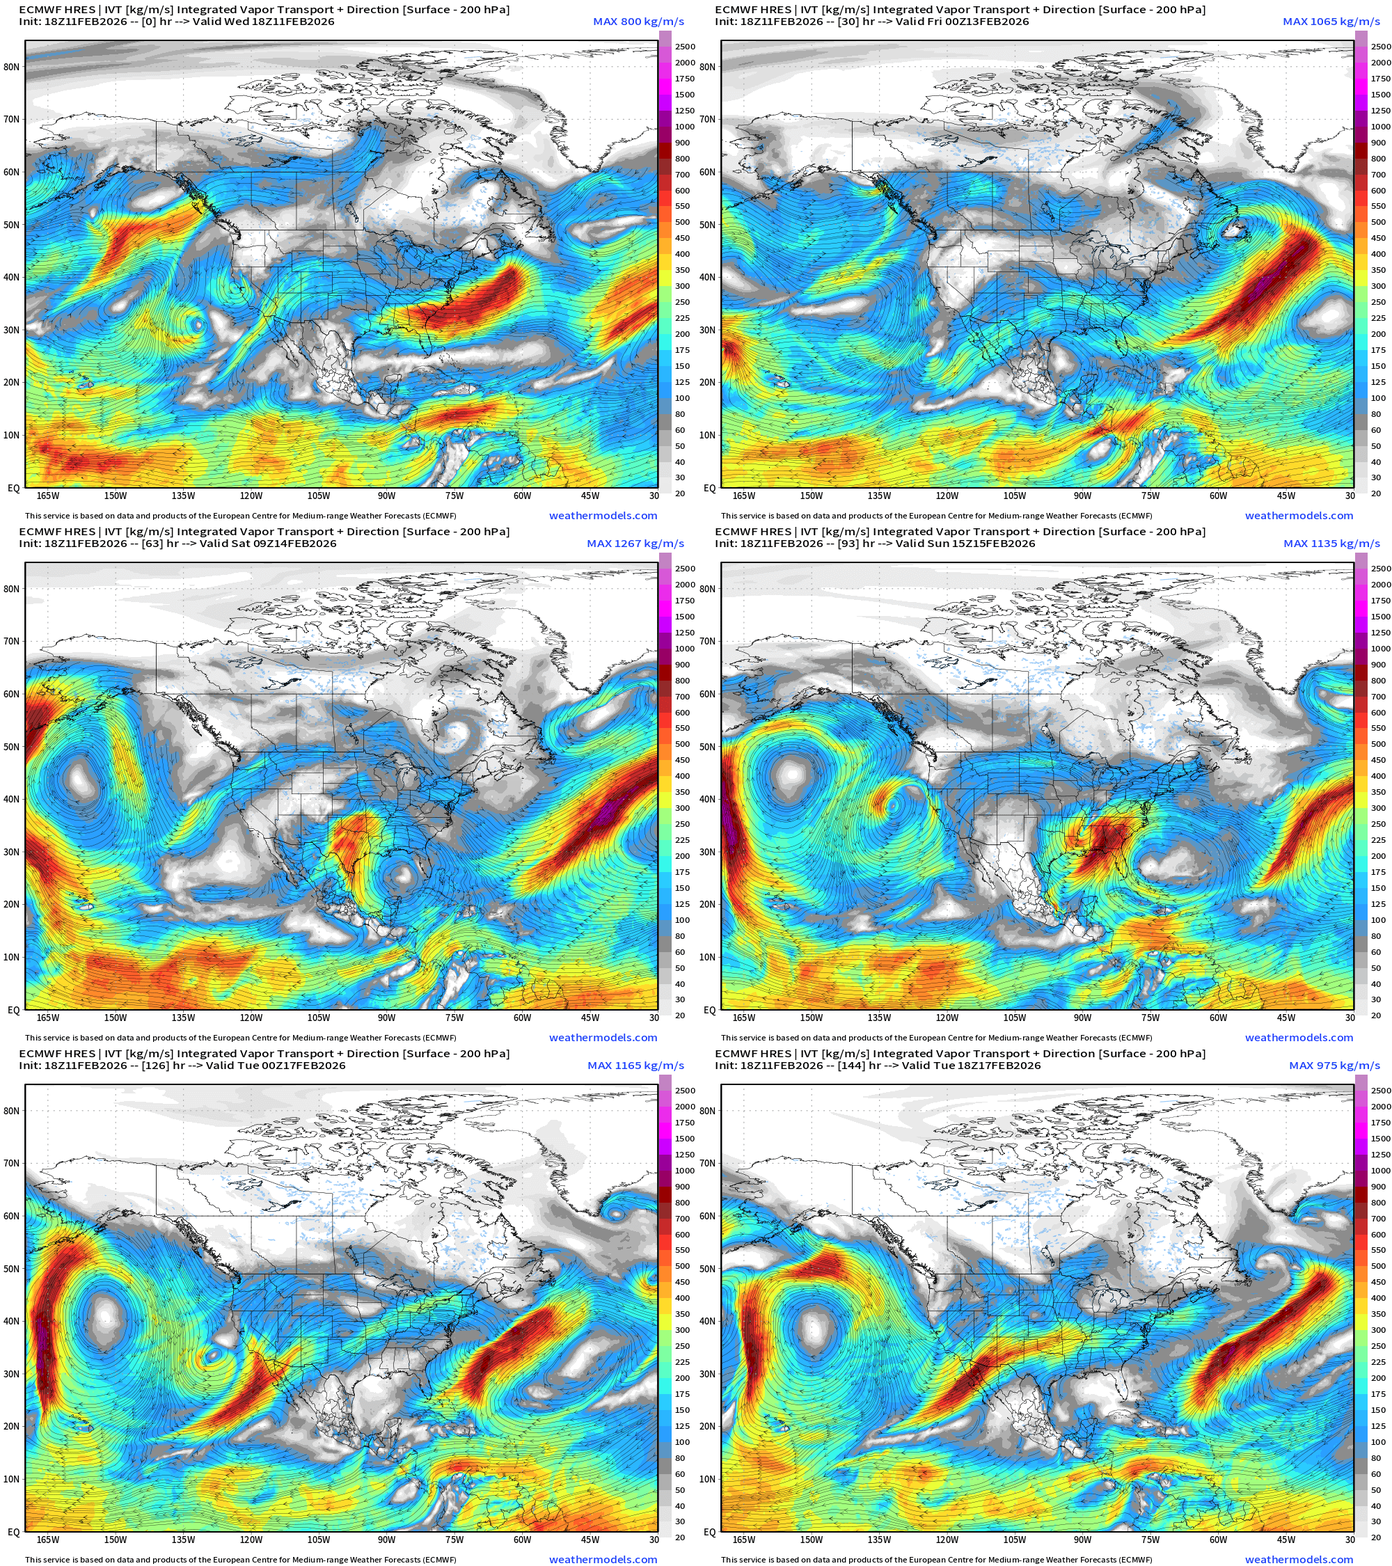
Subtropical moisture feeds out of the Pacific associated with areas of low pressure dipping southward along the U.S. West Coast from the Gulf of Alaska —. great for Rocky Mountain snowfall — and then downstream rain in Texas and the Southeast. Overall this a more active weather pattern with the main polar vortex northerly flow shut off for the next week.
Weather Trader is an entirely reader-supported publication into its third year. To receive daily new posts and support our work, consider becoming a free or paid subscriber. All content is generated by the author including the maps!
Flagship ECMWF 12z EPS | Temperature Anomaly | Next 15-days
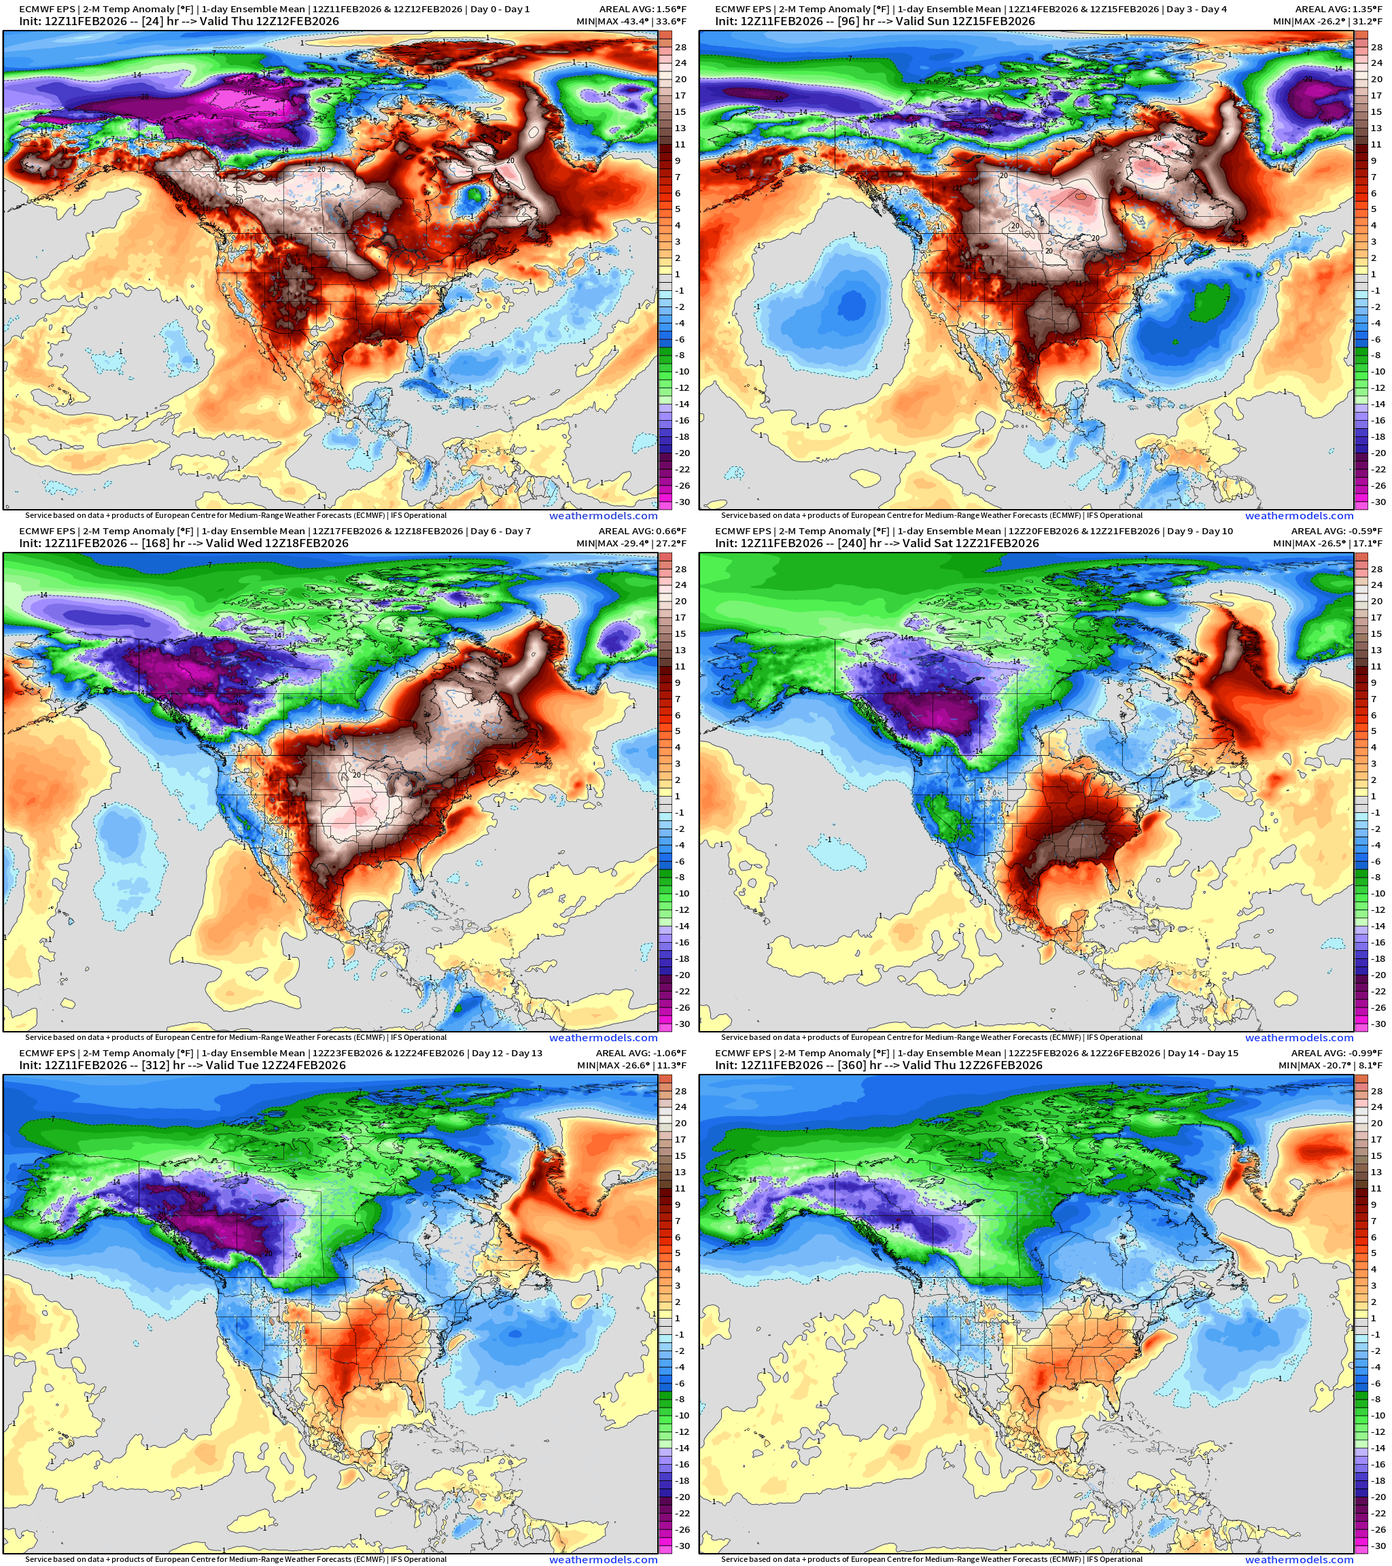
Major warming trend for the next 7-12 days across the Lower 48 with only exception being the West Coast. You can see the major Alaska + Western Canada cold pool intensify but largely remain stuck through the end of February.
ECMWF IFS 18z | Precipitable Water Next 6-days
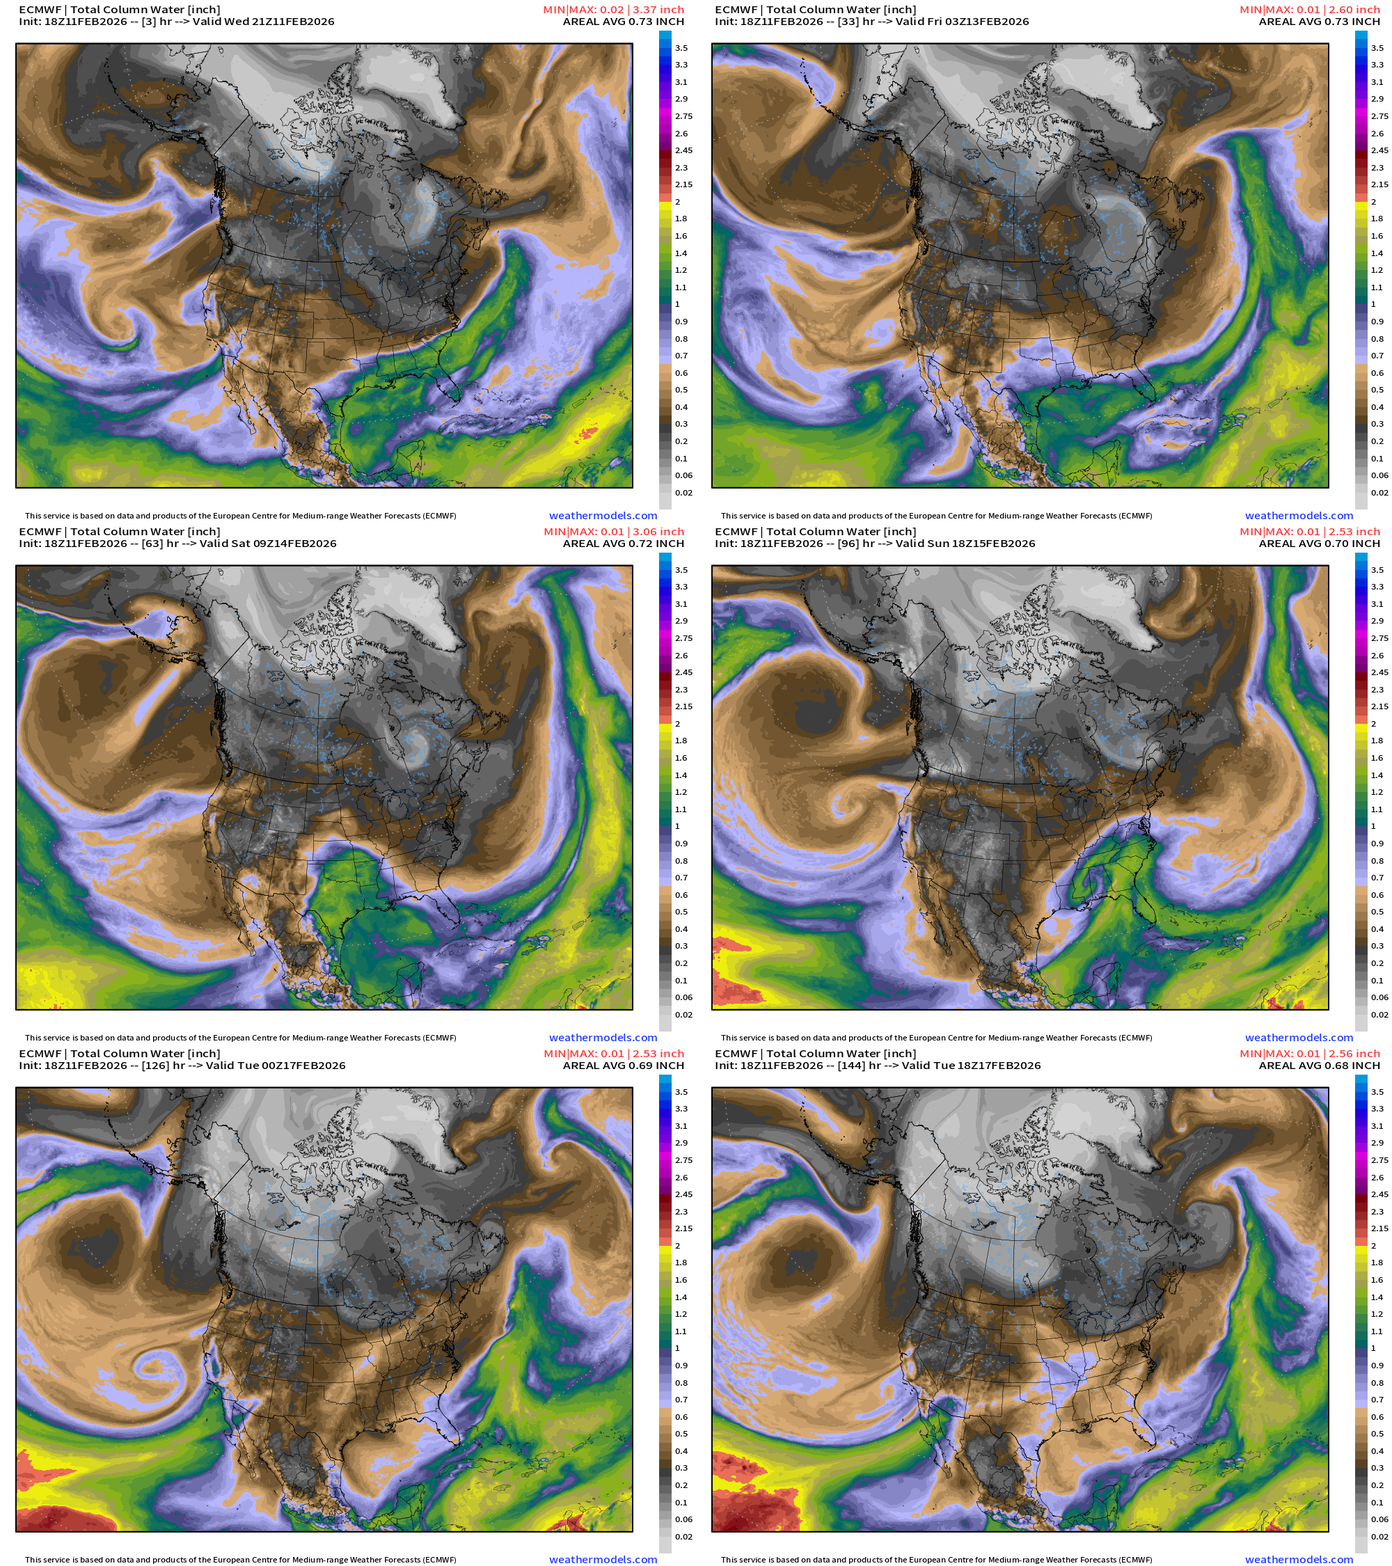
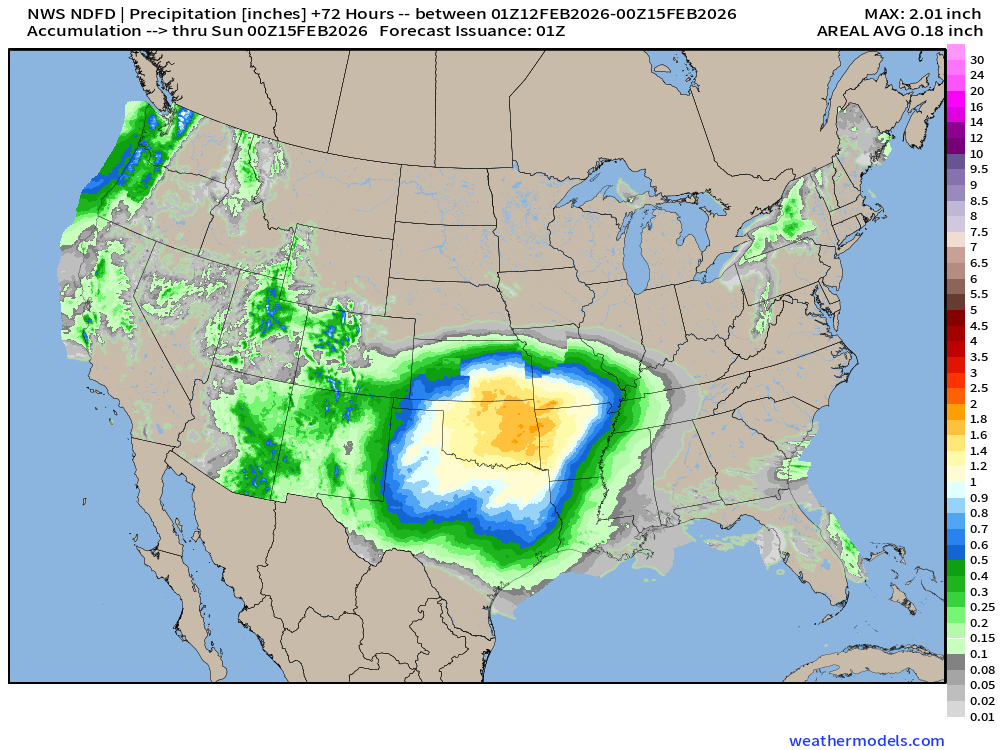
Storm system across Texas into the Southeast from Saturday - Monday unlikely to become a major Nor’easter. However, heavy rainfall (welcome) across the south.
ECMWF 18z Temperature Anomaly | Next 6-days
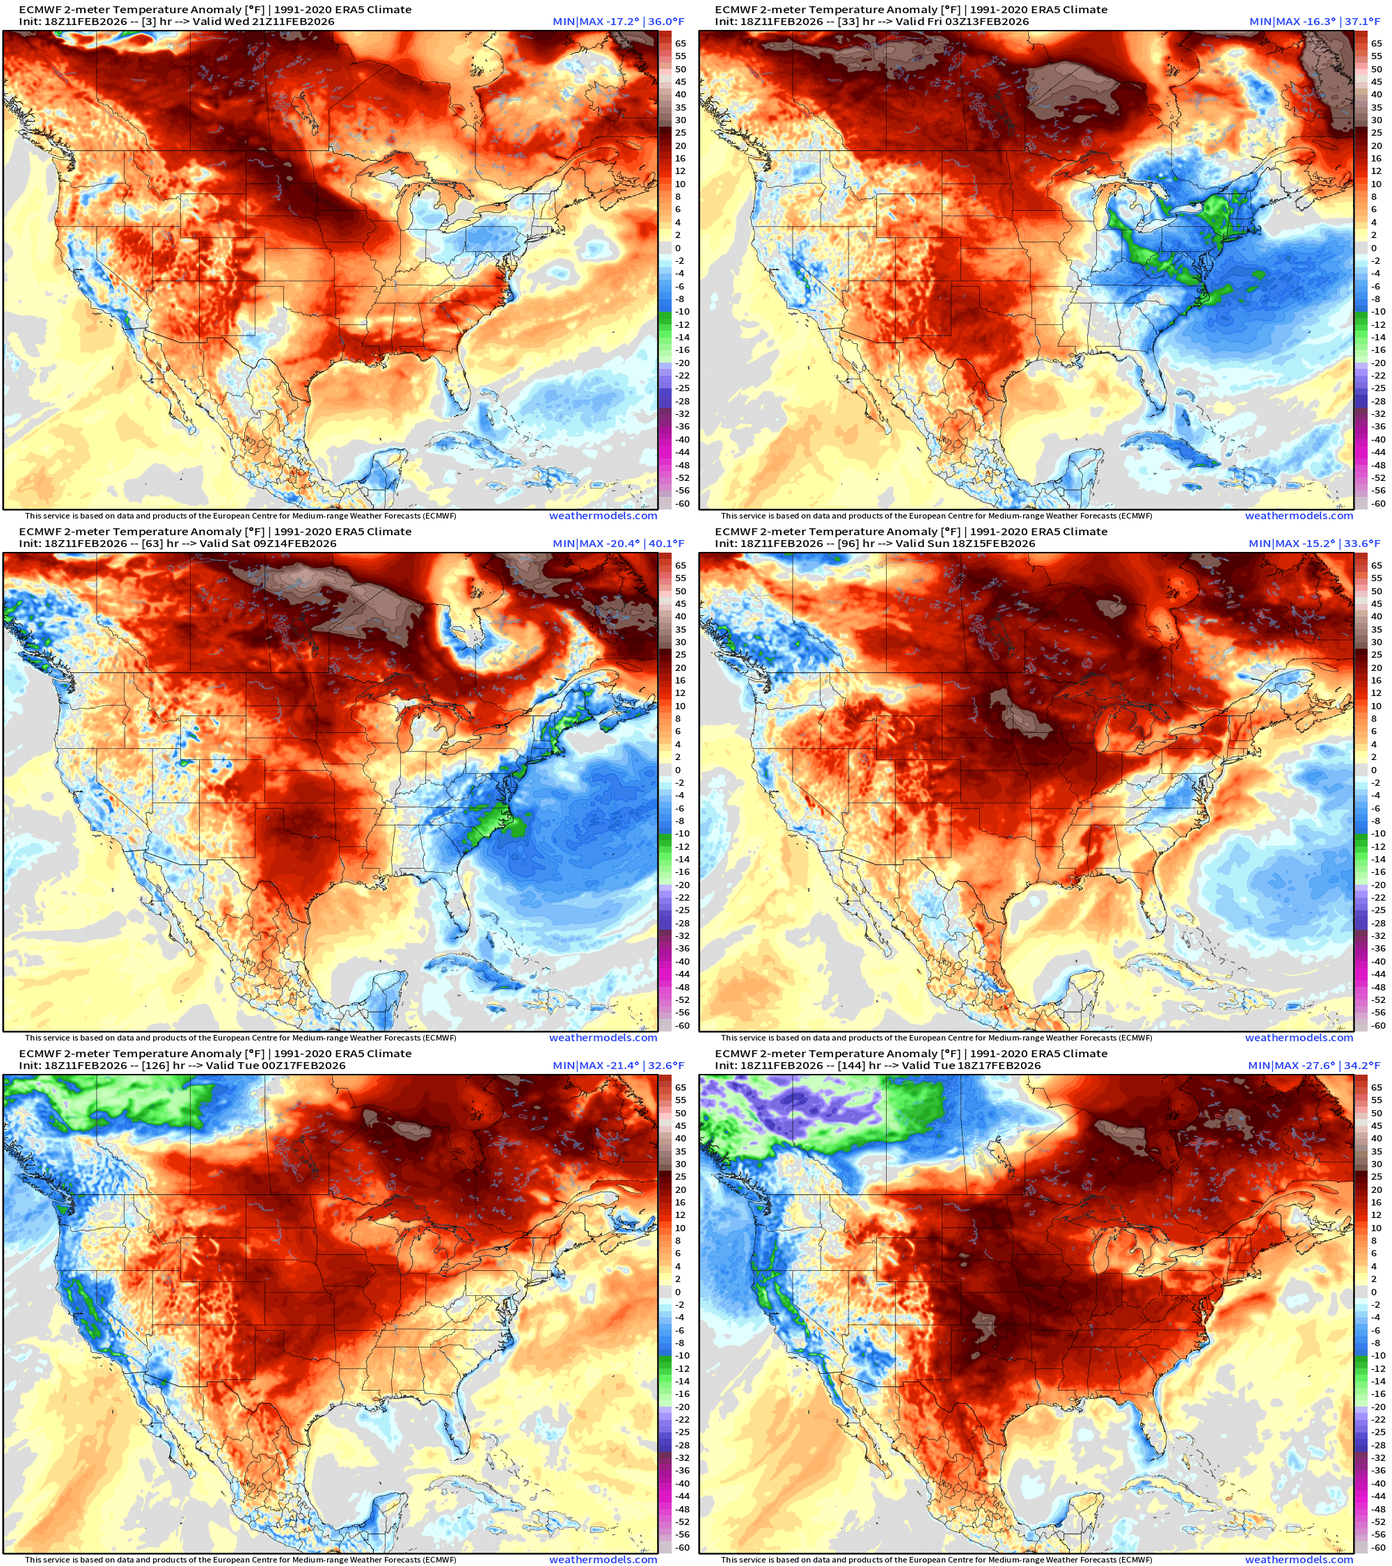
Warm — Red across the Lower 48 by this weekend — intensifying into next week.
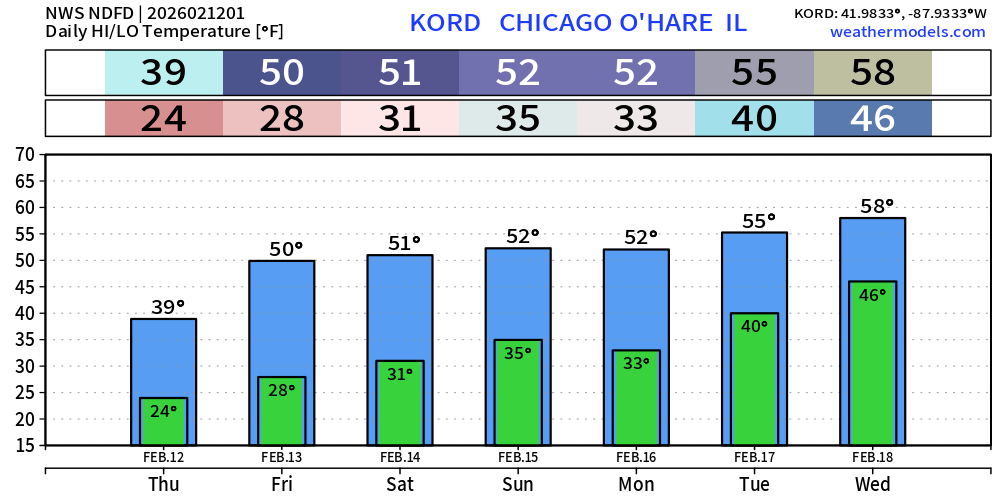
Chicago 7-day Forecast — 50s to maybe close to 60°F next Wednesday
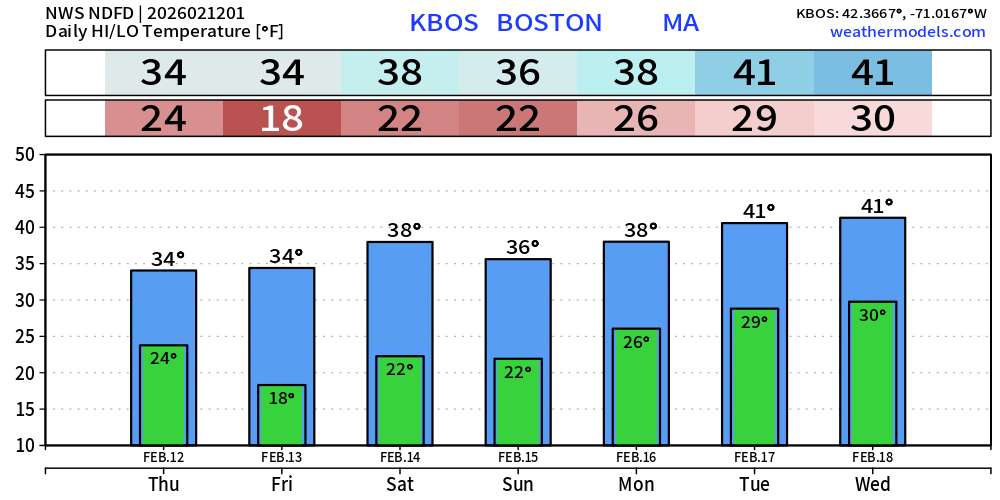
Boston into the upper-30s and 40s — slow progress!
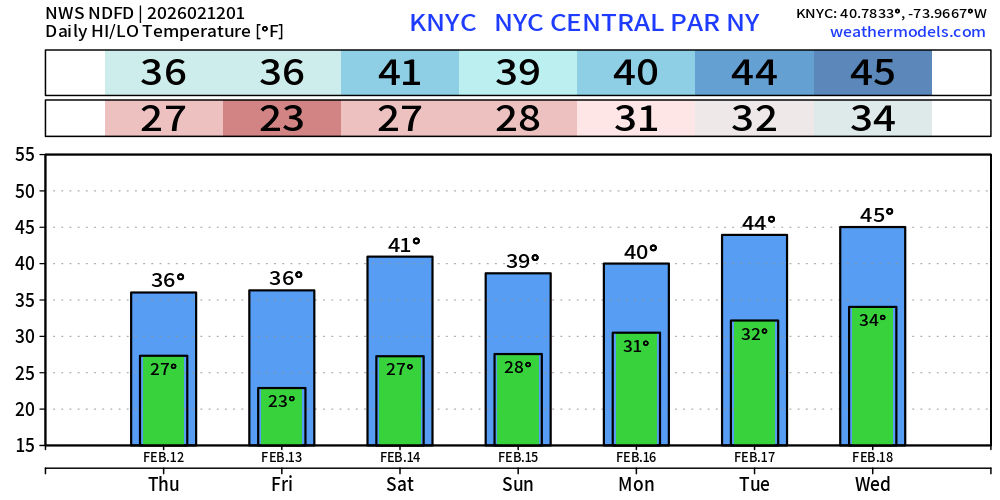
New York City 7-Day Forecast: 40s next week
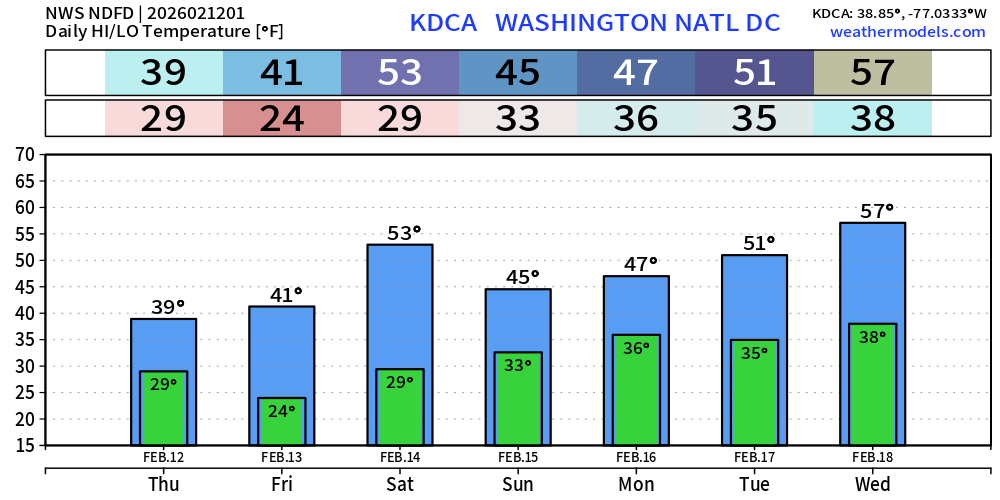
Washington D.C. 7-Day Forecast: 50s again on Saturday will feel like a heat wave
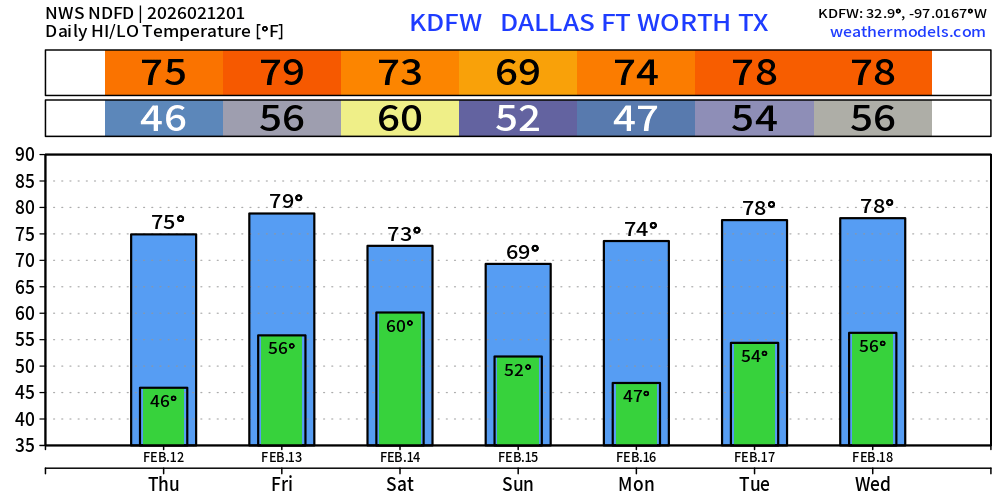
Dallas Fort Worth 7-Day Forecast: 70s and maybe 80°F
ECMWF 18z Precipitation Type + Intensity | Next 6-days
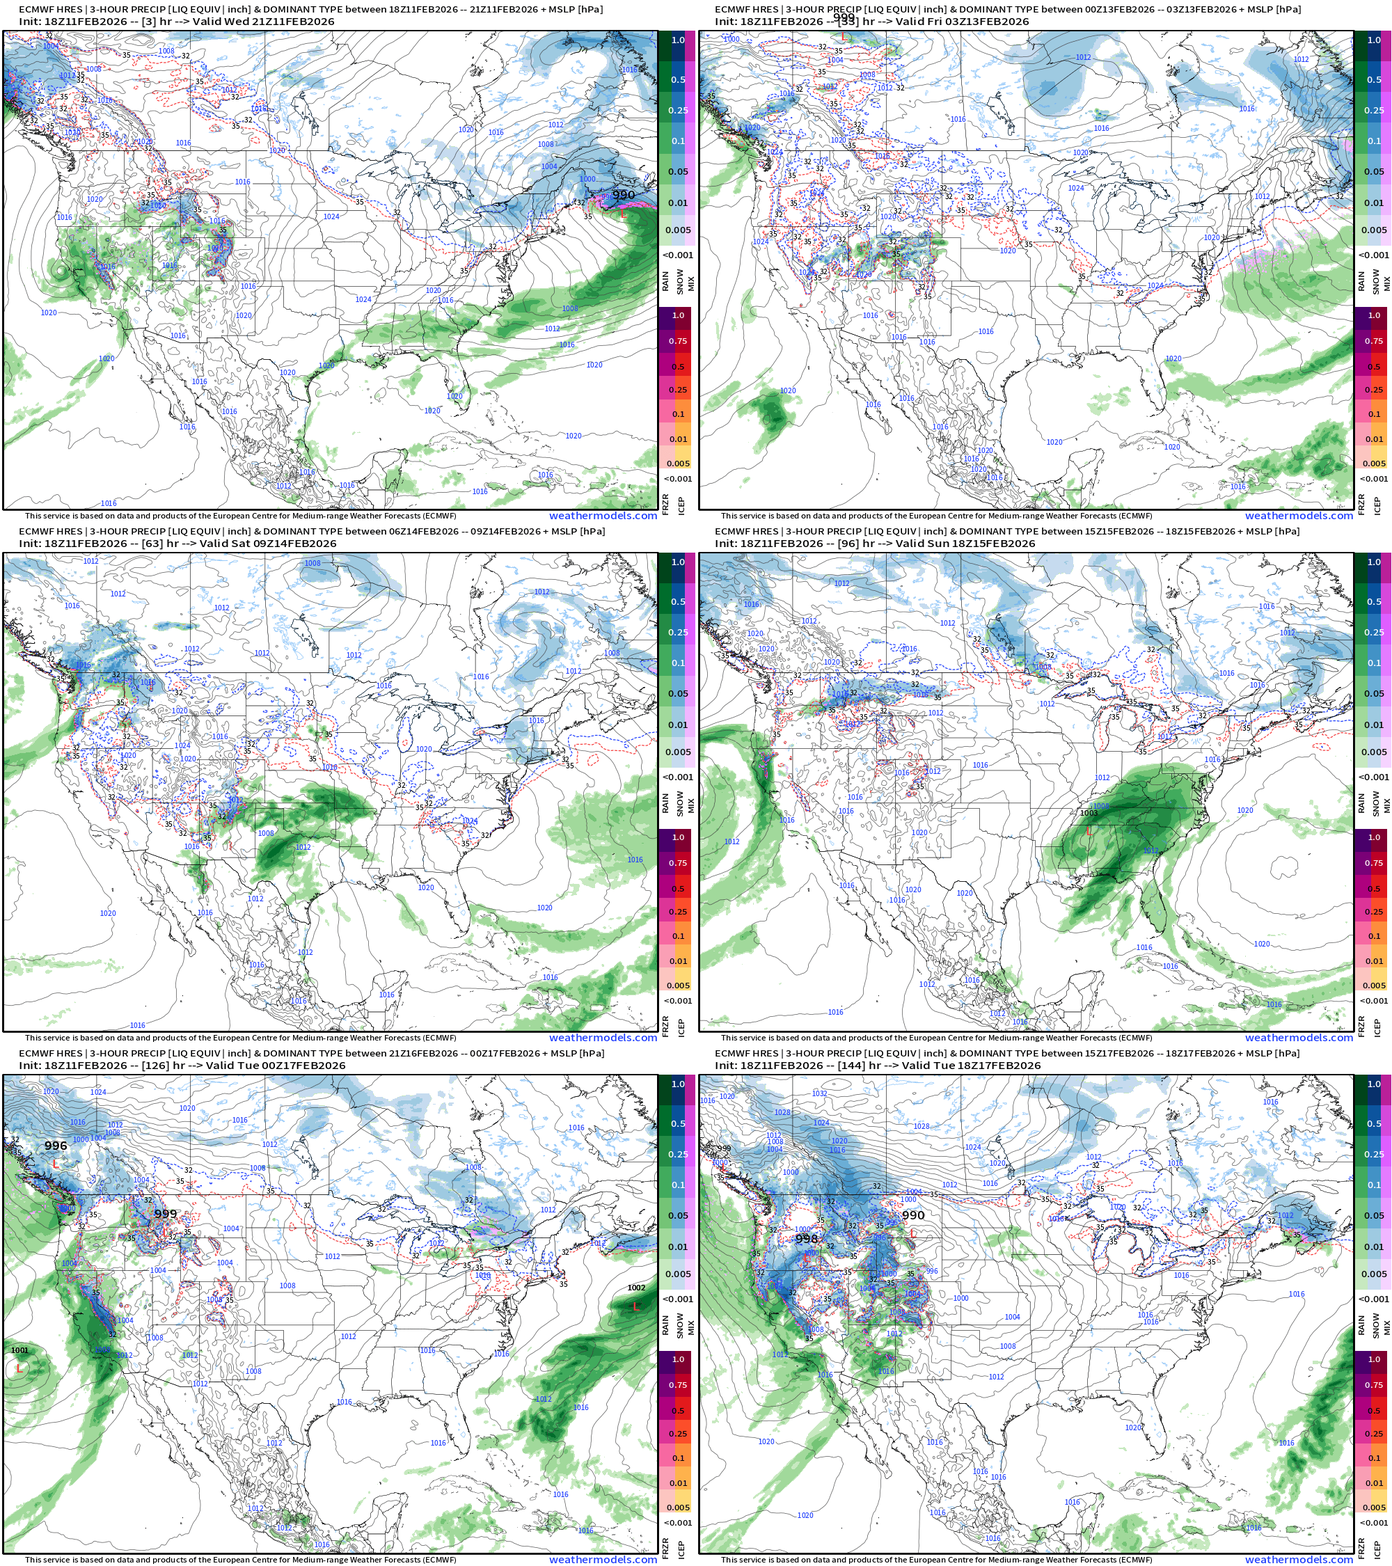
Central U.S. storm system gathers strength on Sat/Sun in Texas and then largely tracks due east with reformation off the Mid-Atlantic coast, but does not phase with the upper-level trough = near miss Nor’easter
West Coast USA Zoom | Next 6-days
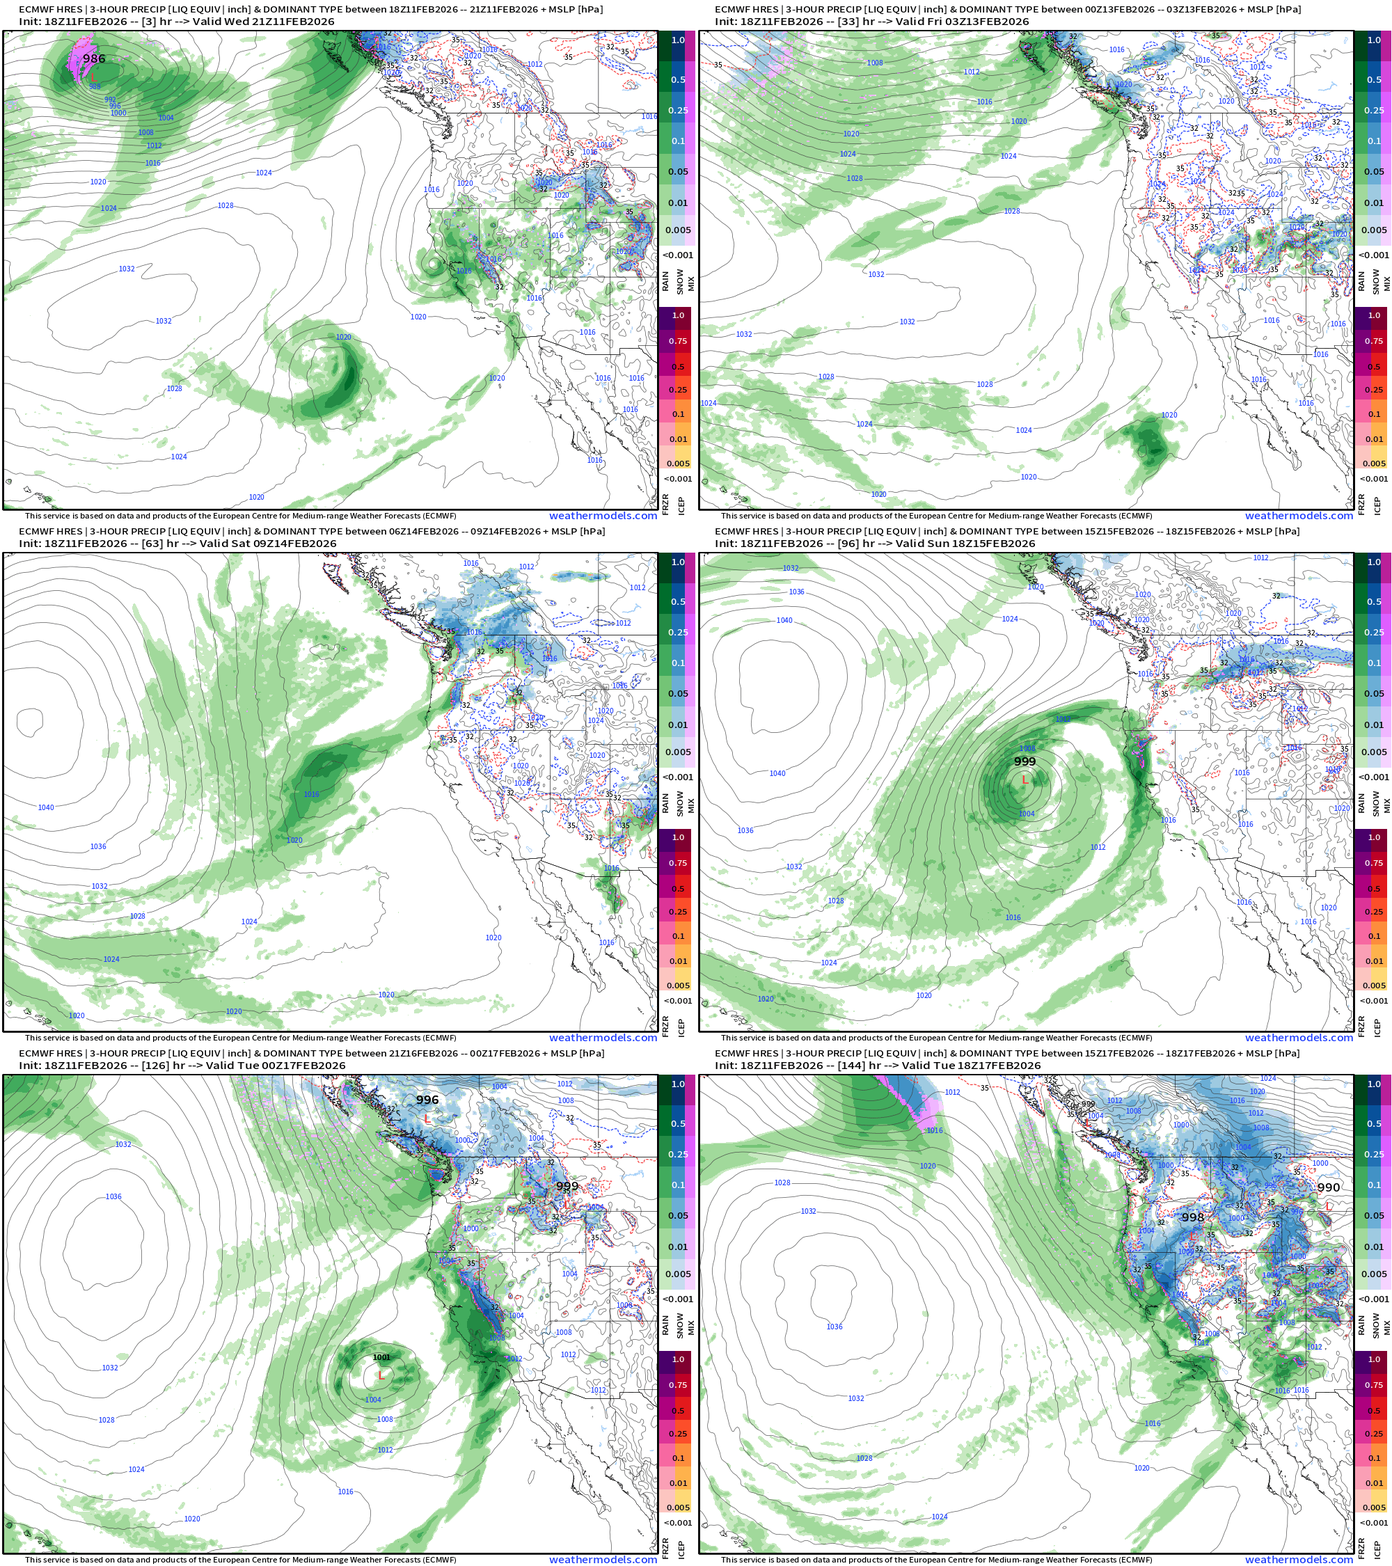
Next winter storm takes shape Sunday into next week
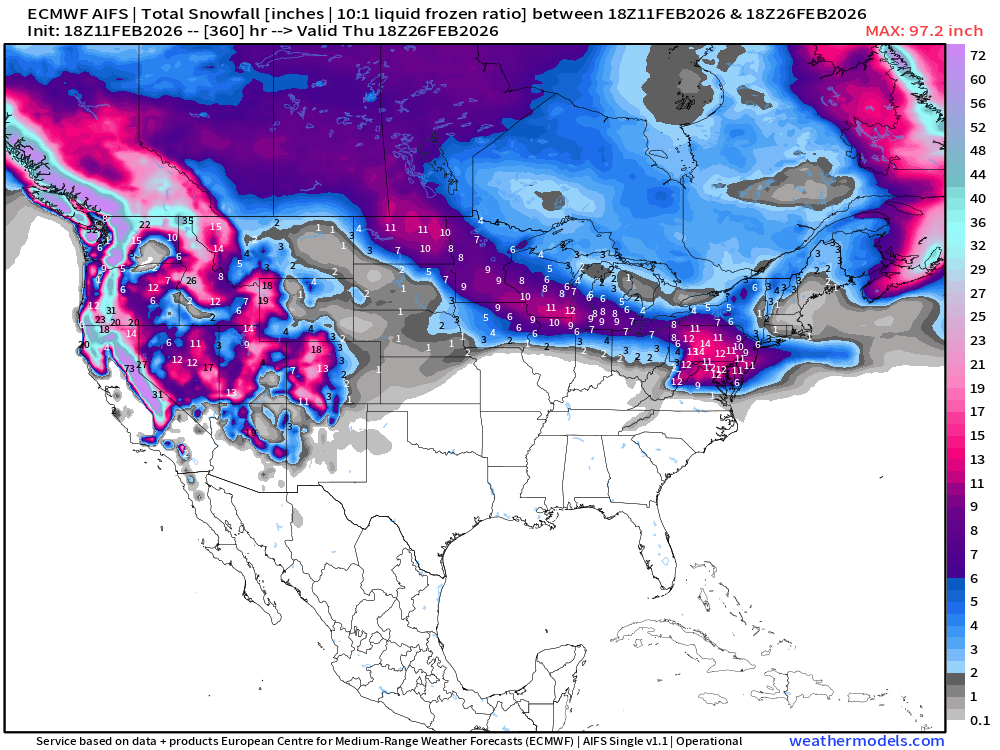
15-day Snowfall (Long Range) ECMWF AIFS 18z
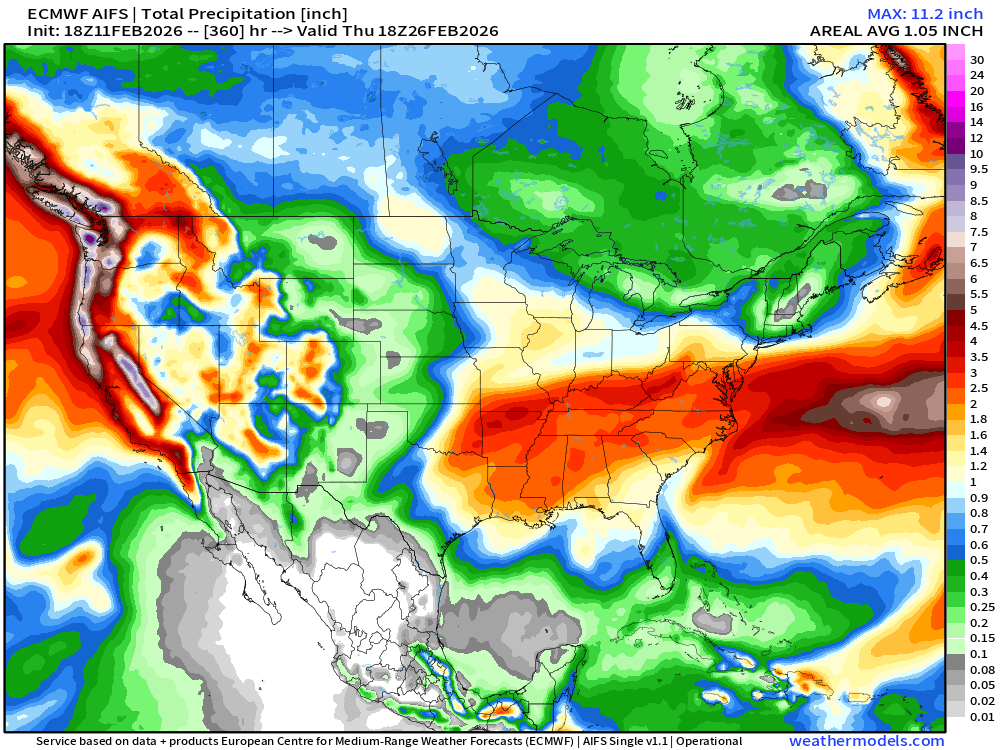
15-day Precipitation (Long Range) ECMWF AIFS 18z
HRRR Simulated Radar Next 48-hours
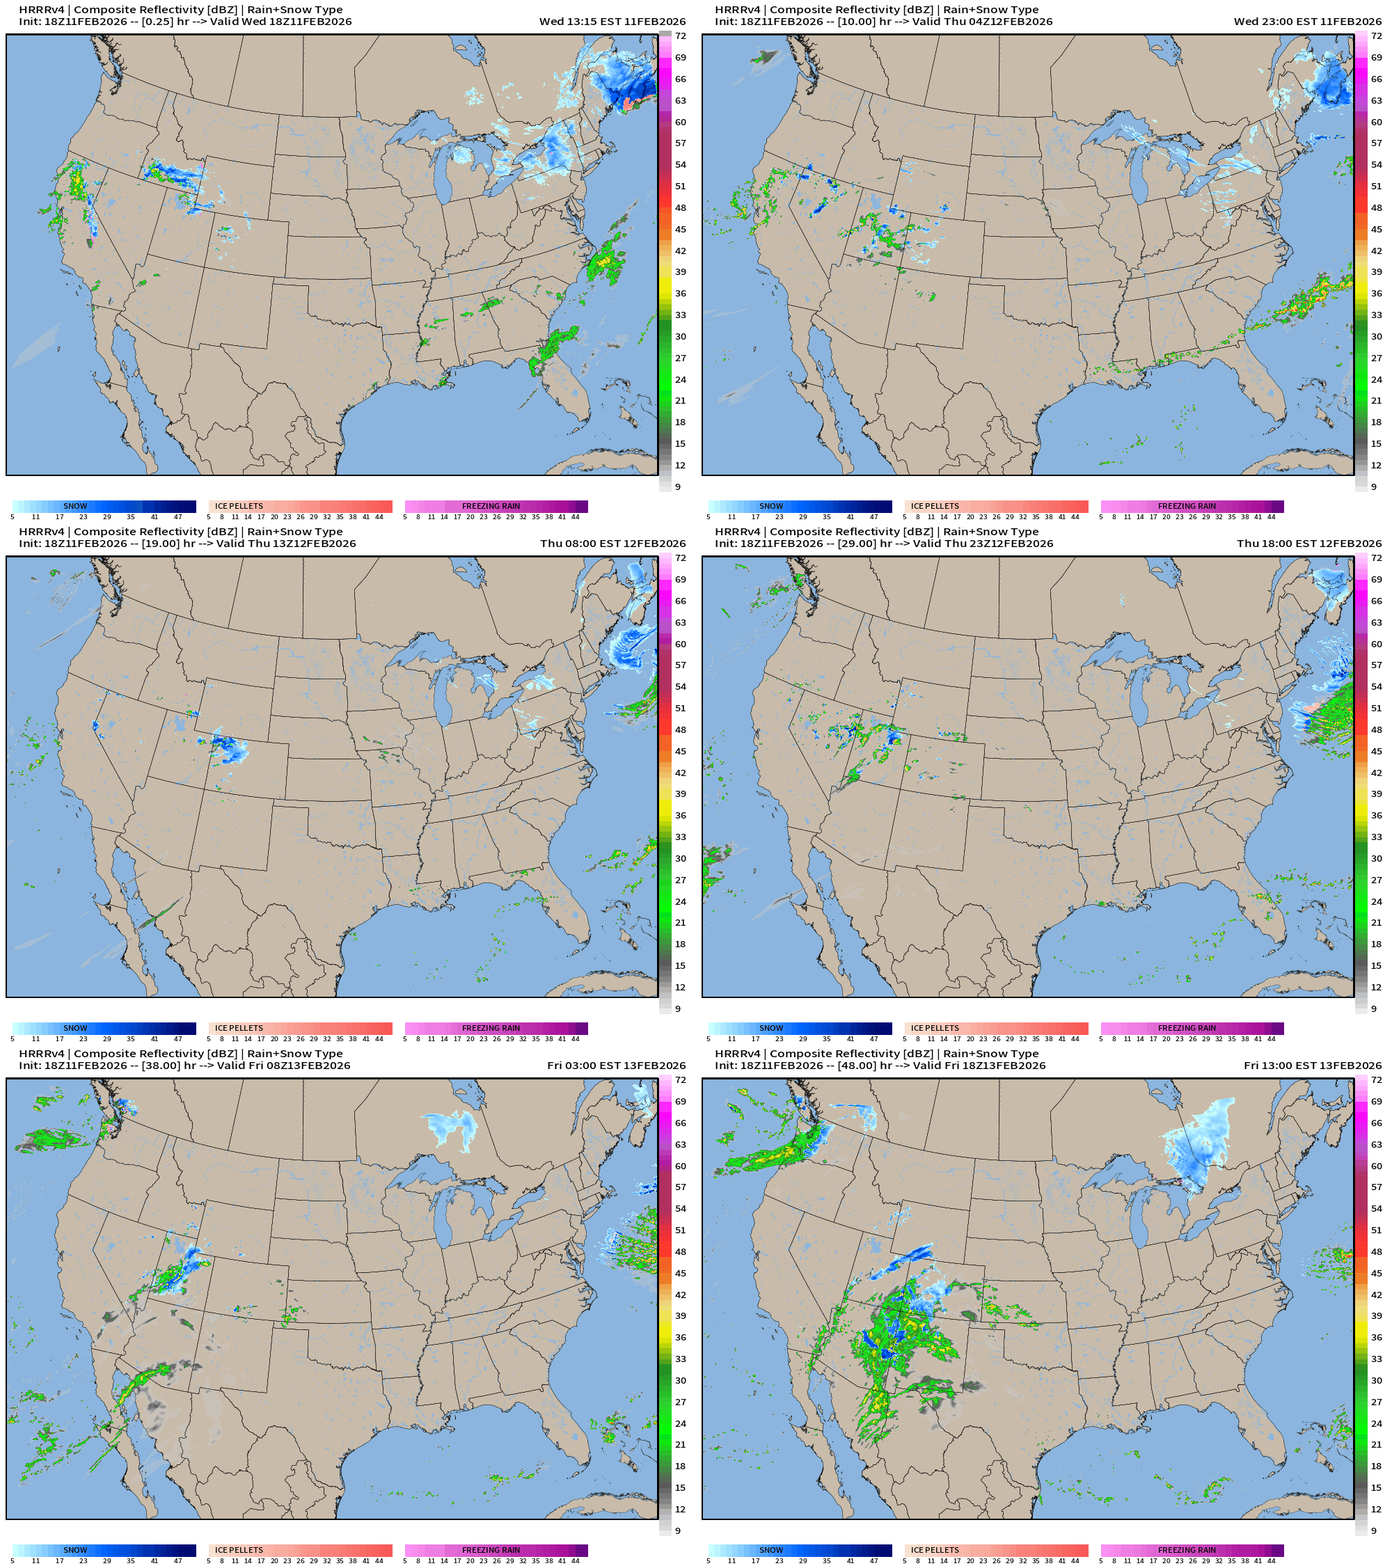
Quiet — until cut-off trough / storm system arrives in the Southwest — which will become the weather maker for Texas on Saturday and then push east.
NWS NDFD Snowfall next 3-days
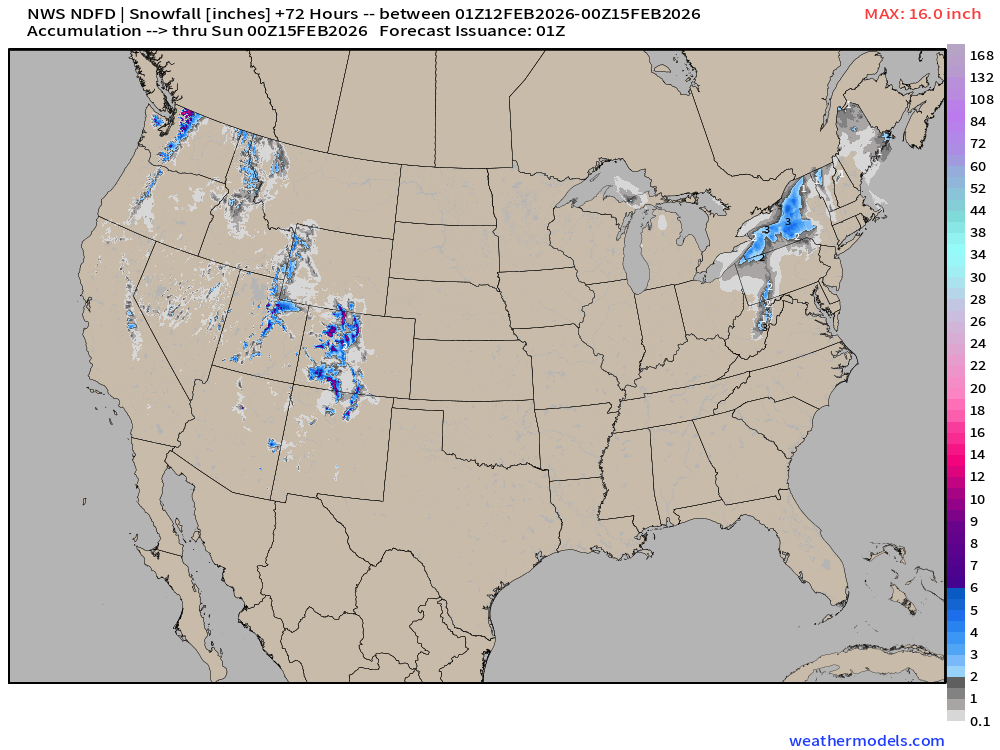
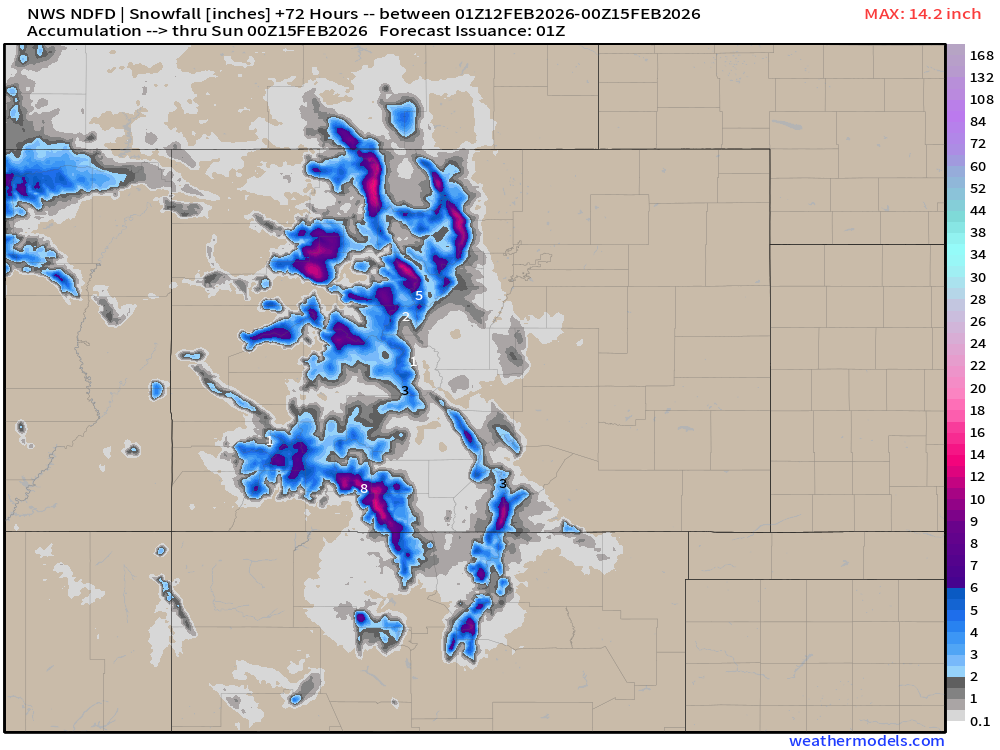
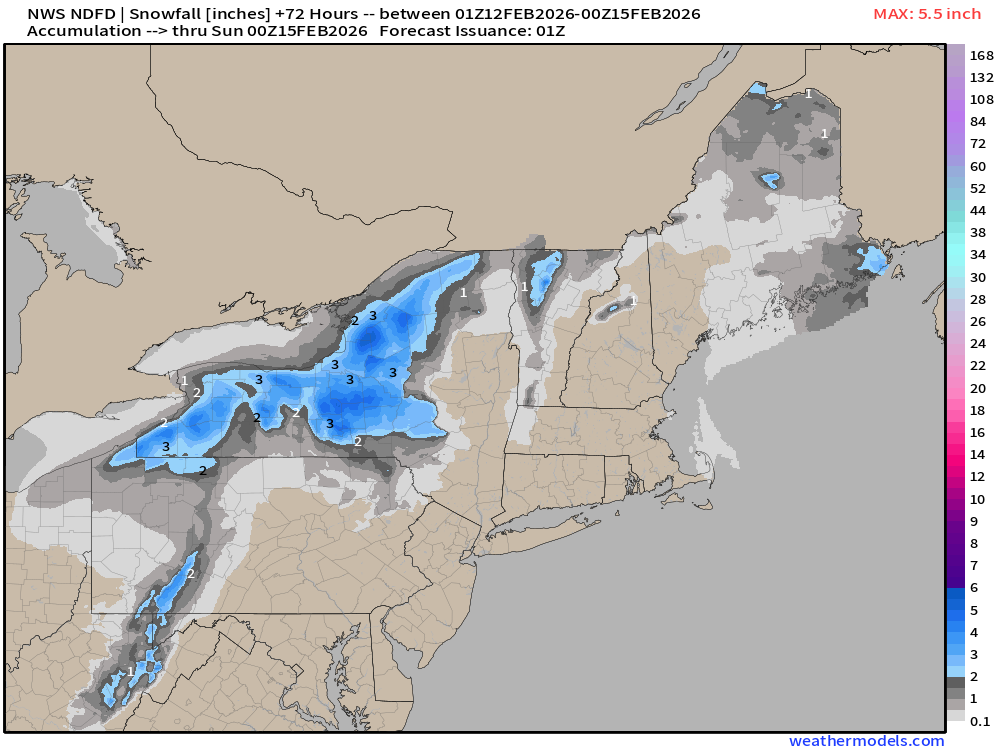
NWS NDFD Precipitation (QPF) next 3-days through Saturday evening
RTMA | Temperature Analysis | 8:00 PM ET
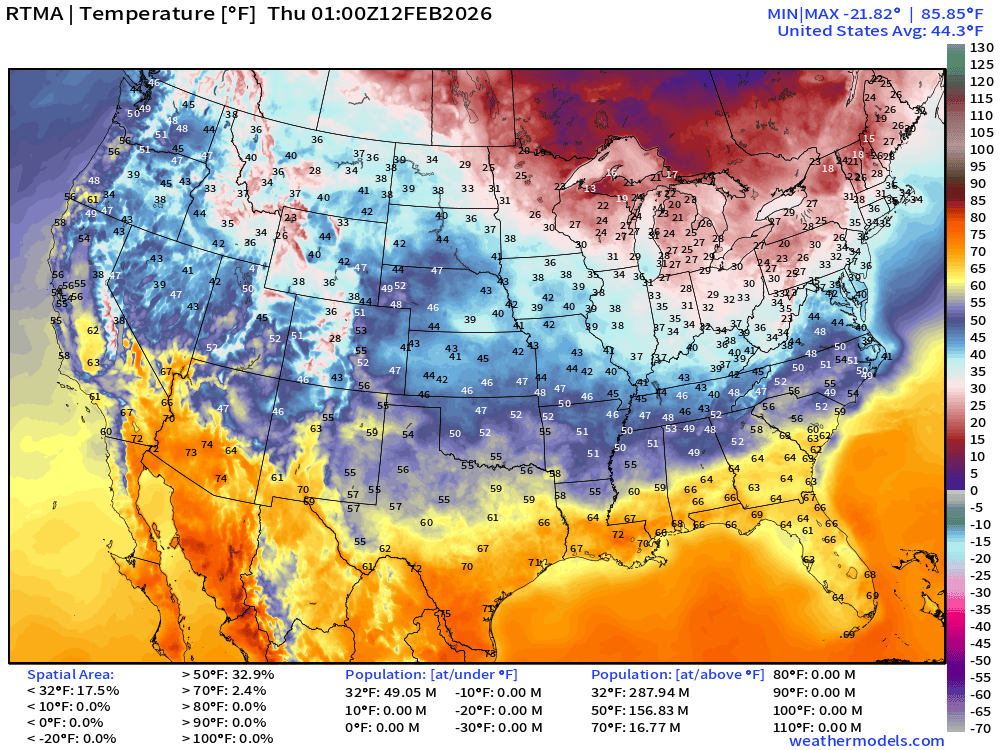
Avg Lower 48 temperature was 44.3°F — only 49 million below freezing.
Temperature Anomaly | 8:00 PM ET
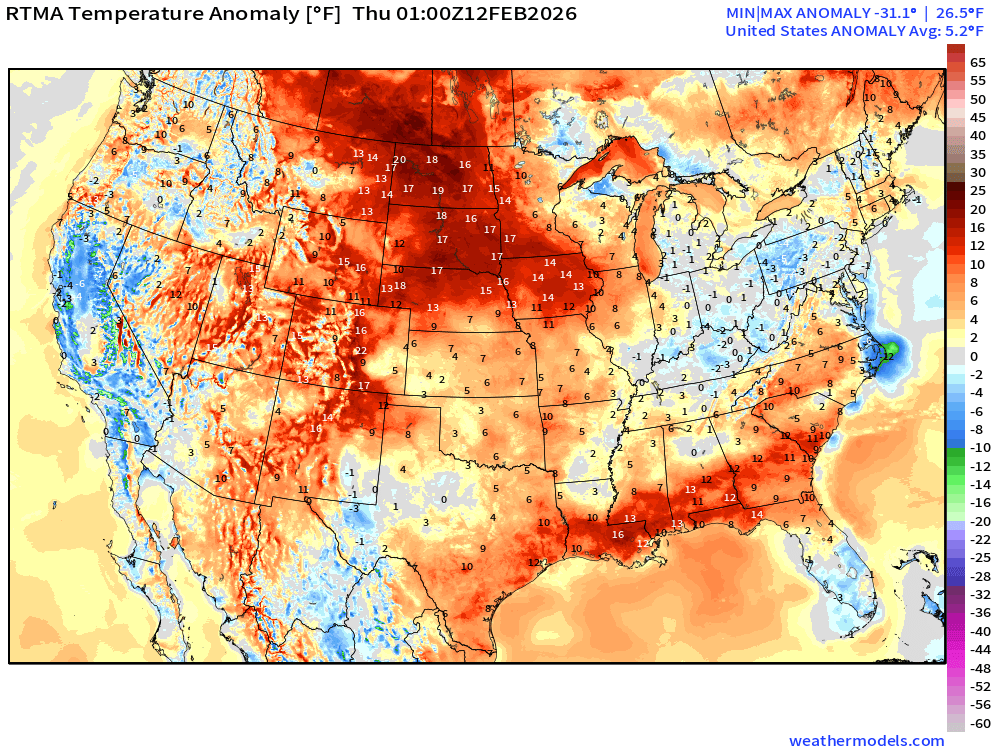
Lower 48 Temperature Anomaly above normal by 5.2°F
Low Temperatures on Thursday
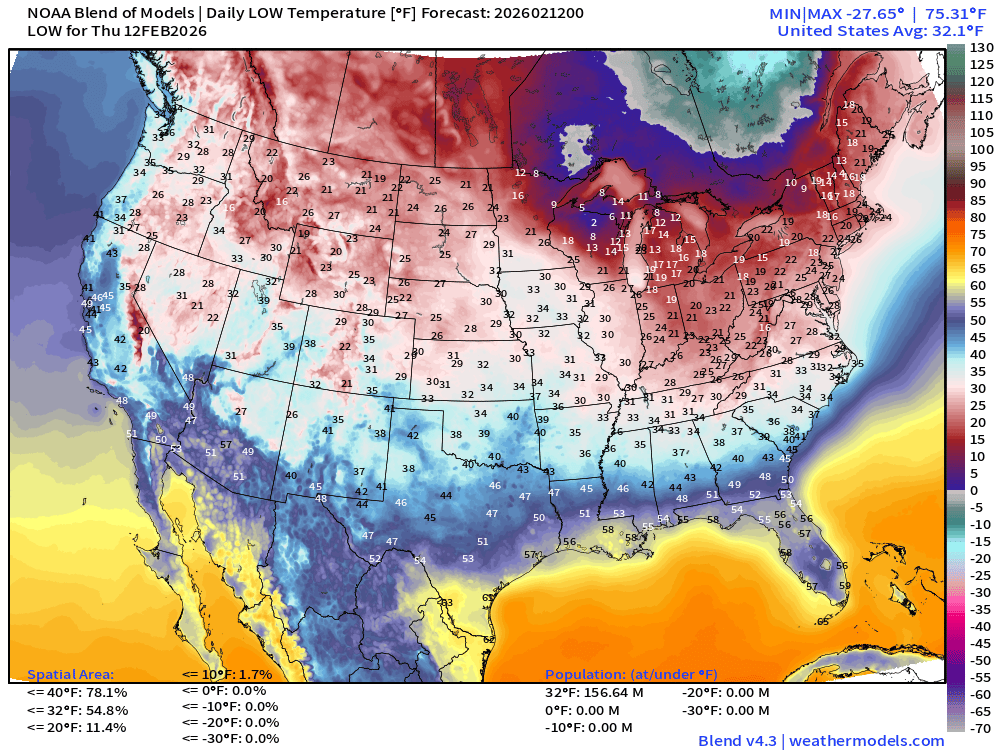
32.1°F average Lower 48 minimum - 156M below freezing and ZERO below 0°F
High Temperatures Thursday
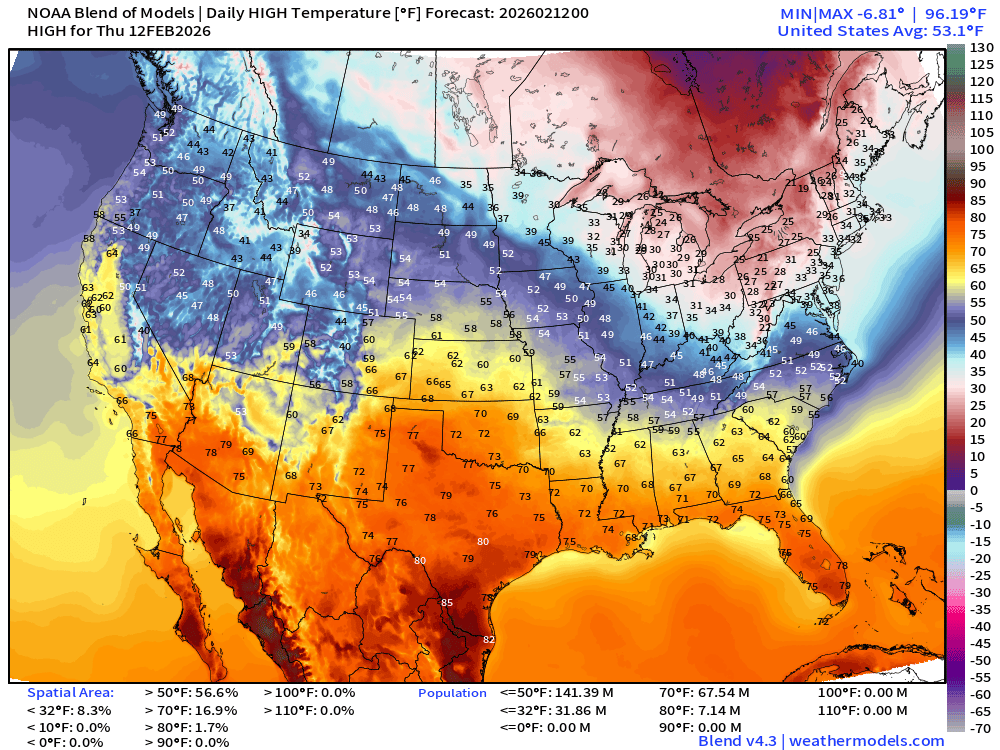
67 million above 70°F
ECMWF AIFS-Single 18z | Temperature (500 hPa) Next 10-days
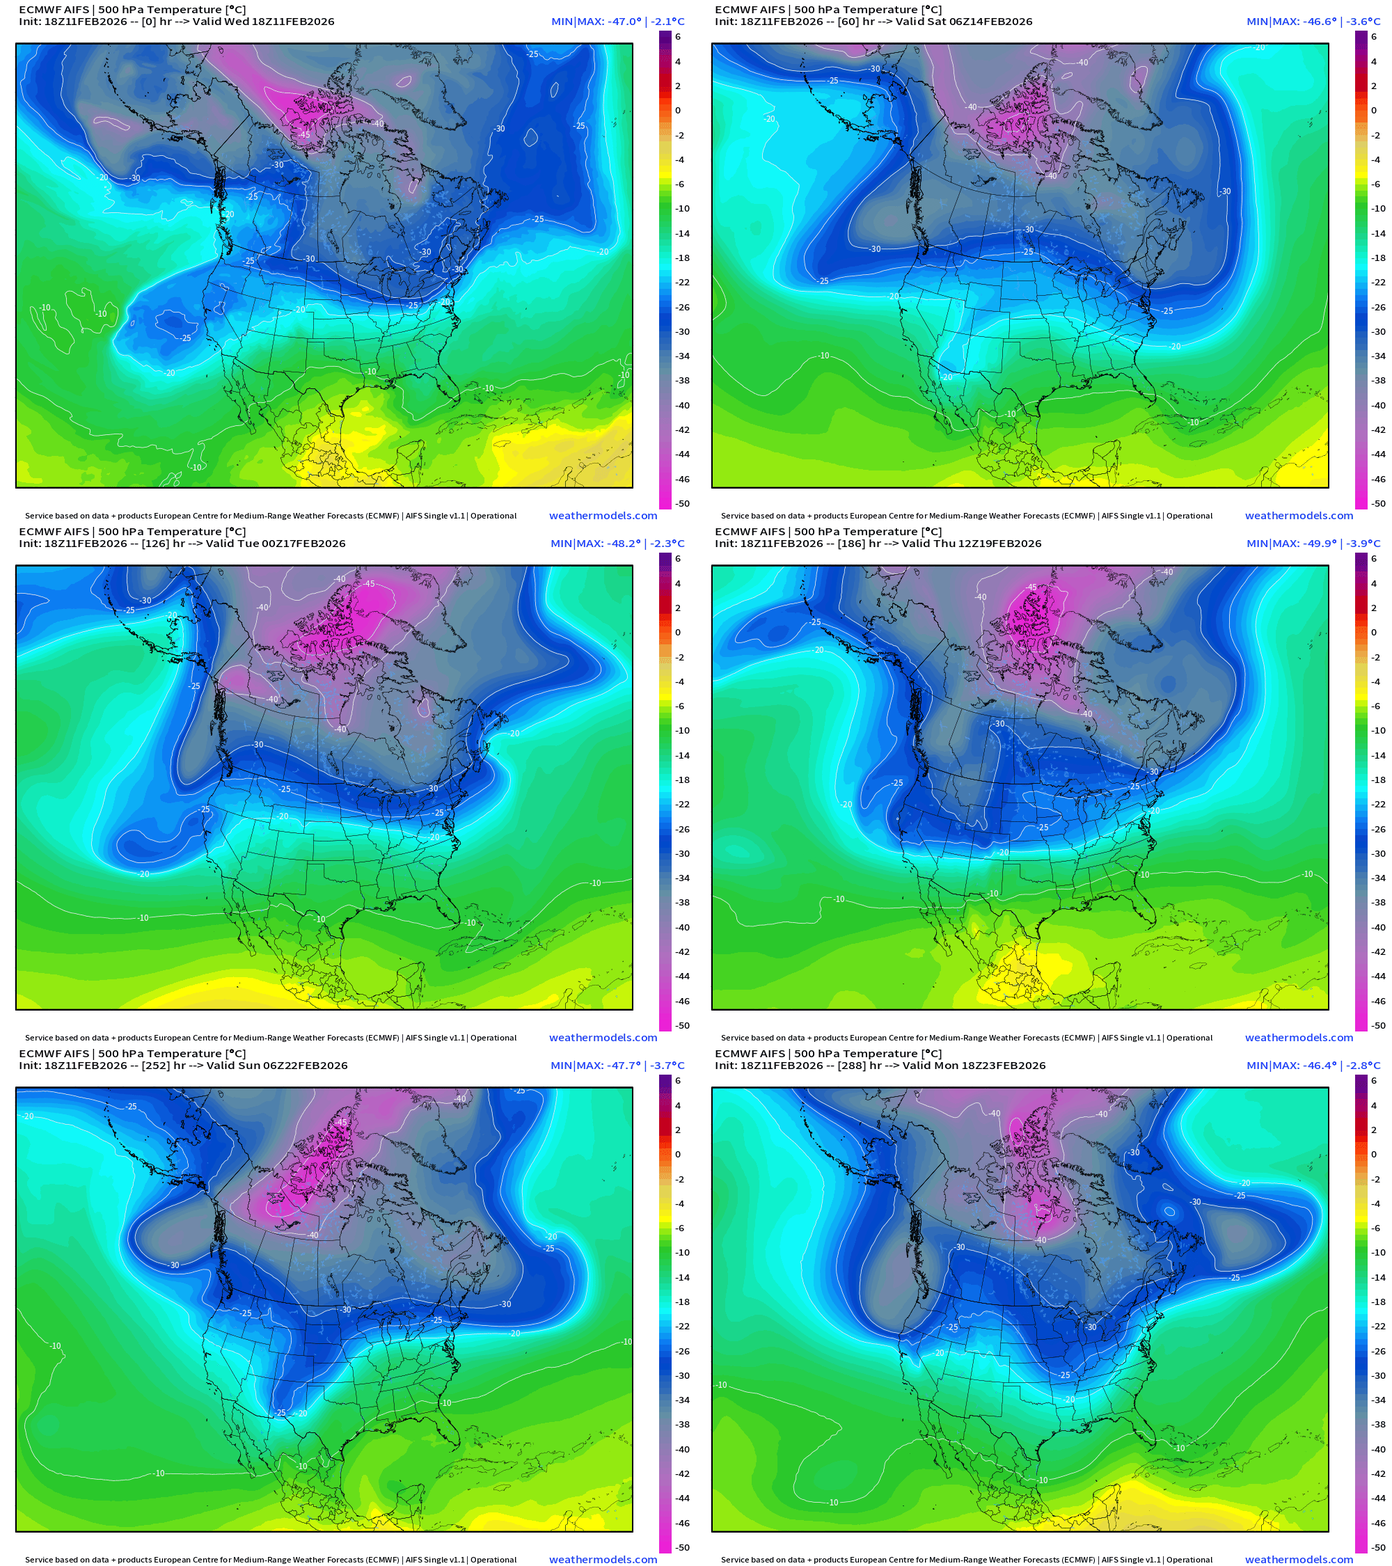
The temperature at 500 mb is the easiest way to highlight the “polar vortex” across North America with the coldest pool at -50°C (pink) with the -25°C contour usually associated with below freezing temperatures at 2-meters (surface).
Heading into the final week of February —> the main Polar Vortex cold pool reservoir remains largely locked up over Canada north of the Arctic Circle
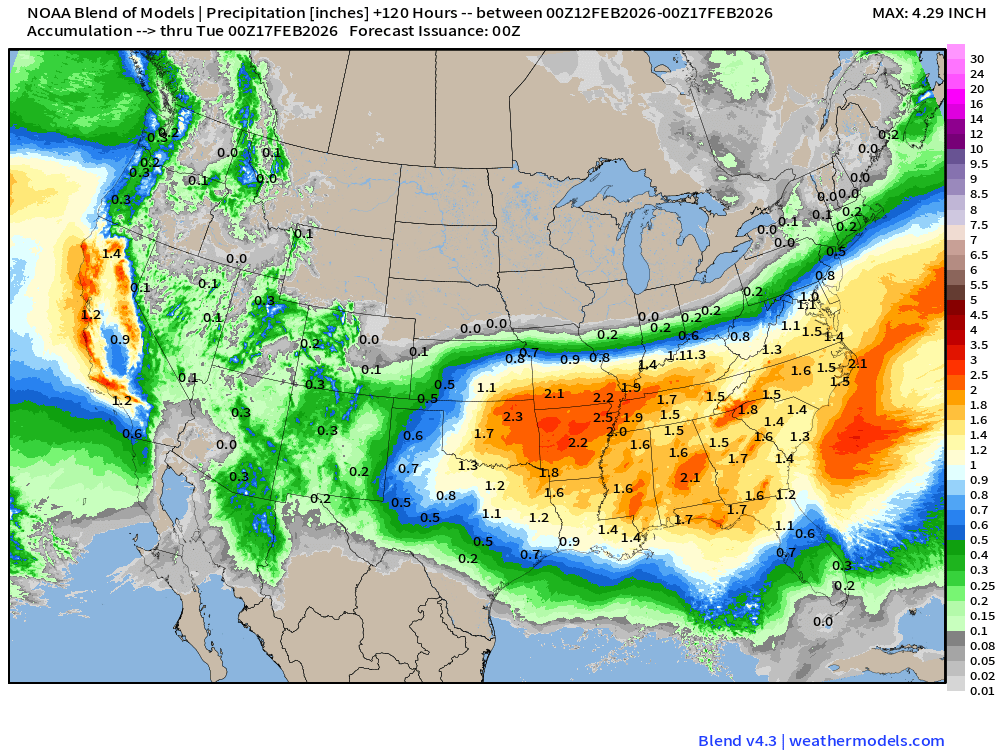
Blend of Models | 7 Days Precipitation Total
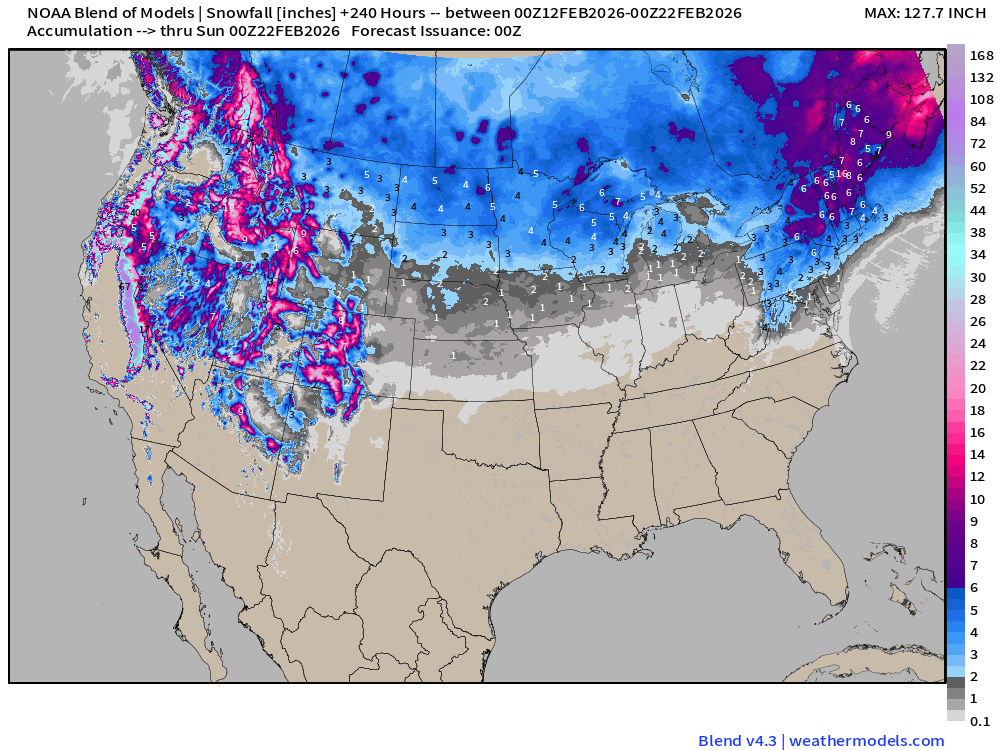
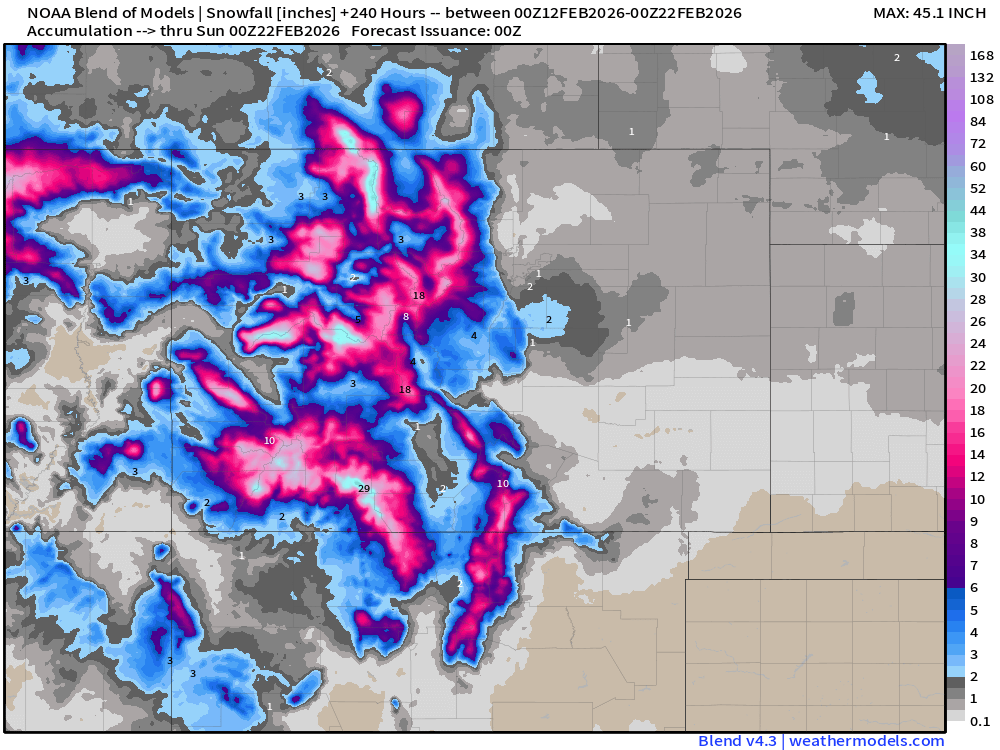
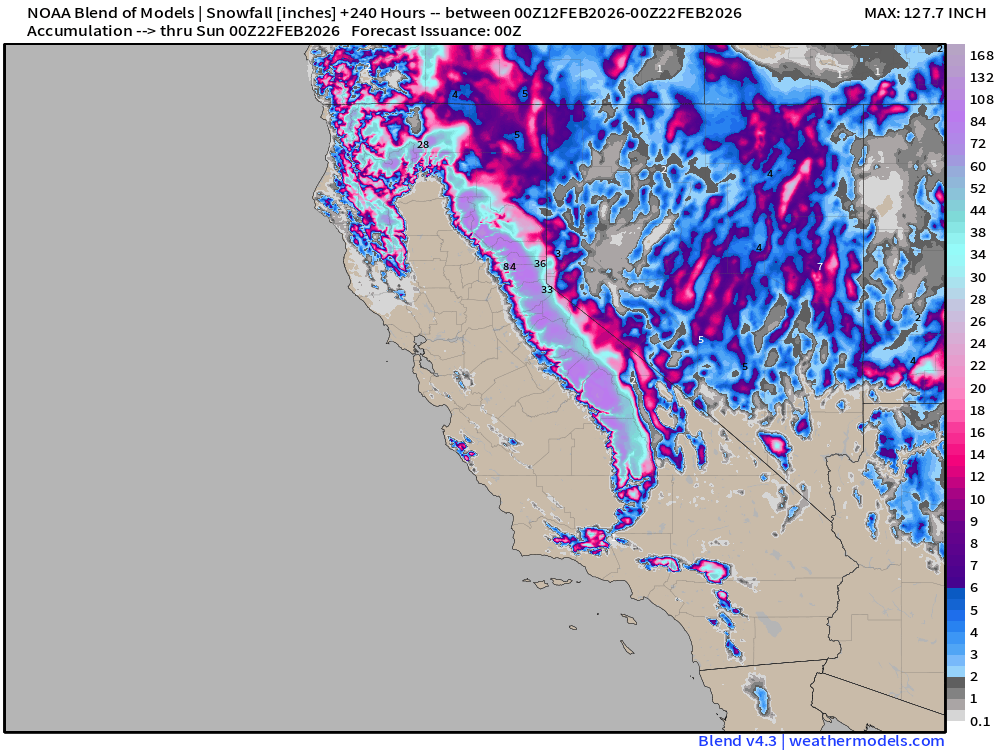
Blend of Models | Total Snowfall Next 10-Days
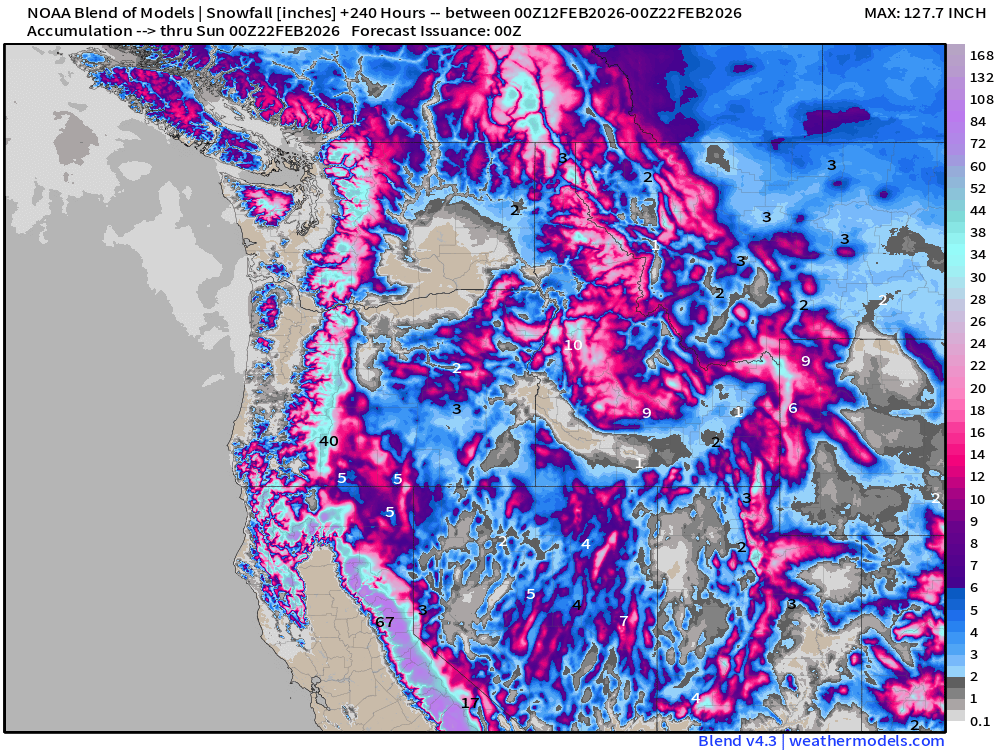
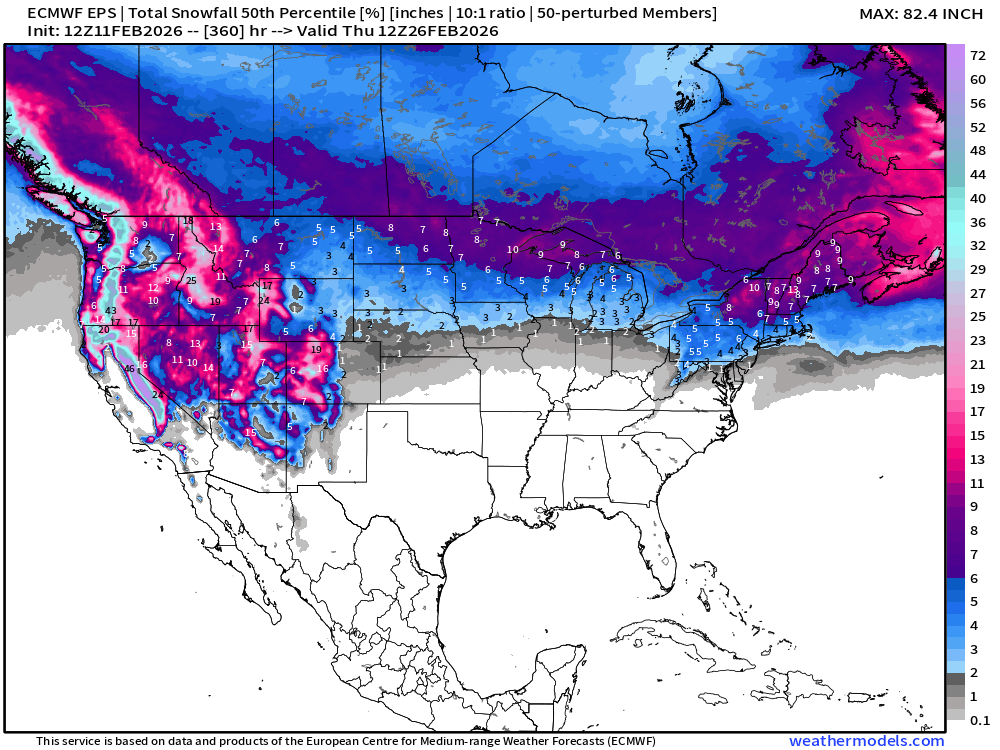
Long Range | Ensemble Median next 15-days Total Snowfall (ECMWF EPS 12z)
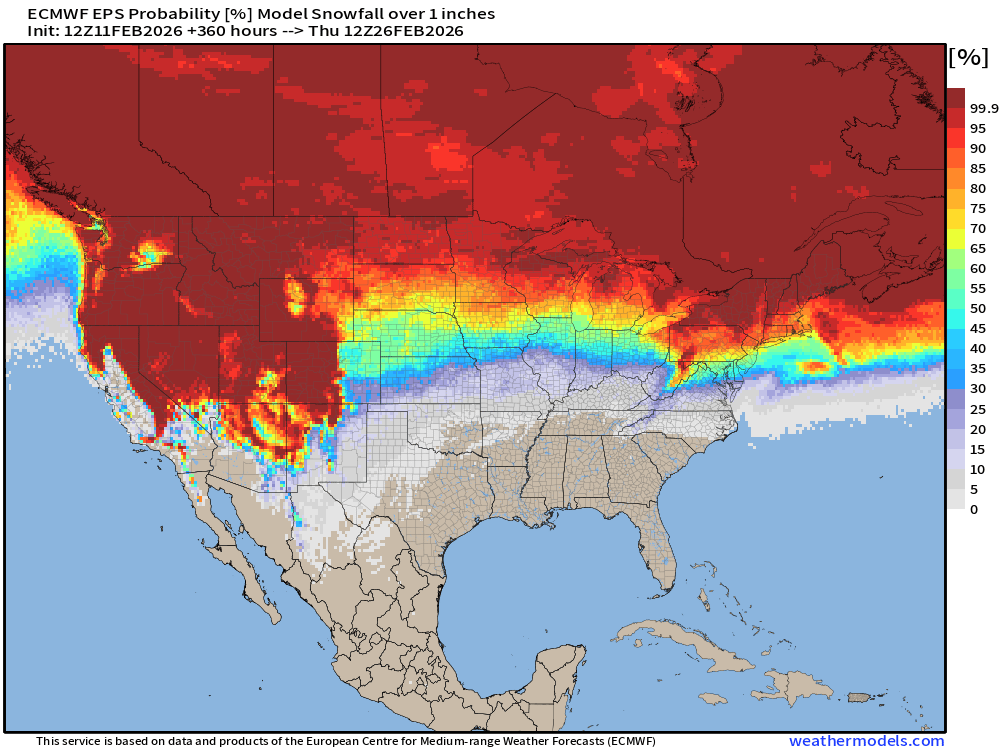
Probability of 1-inch of snowfall from the Ensembles (12z)
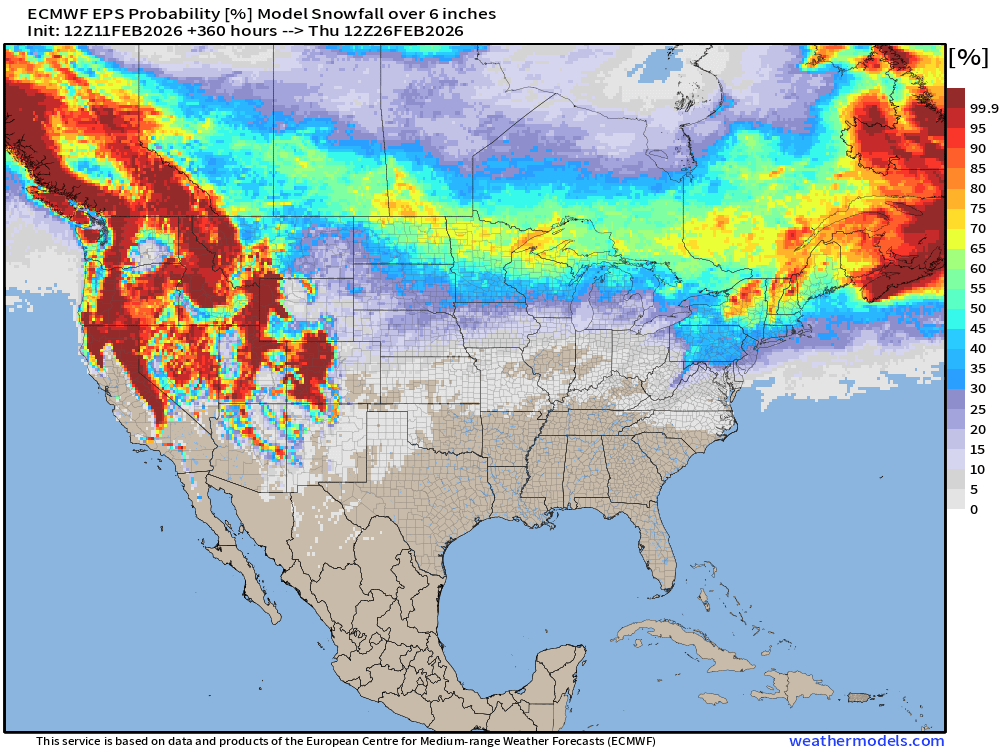
Probability of 6-inches of snowfall from the Ensembles (12z)
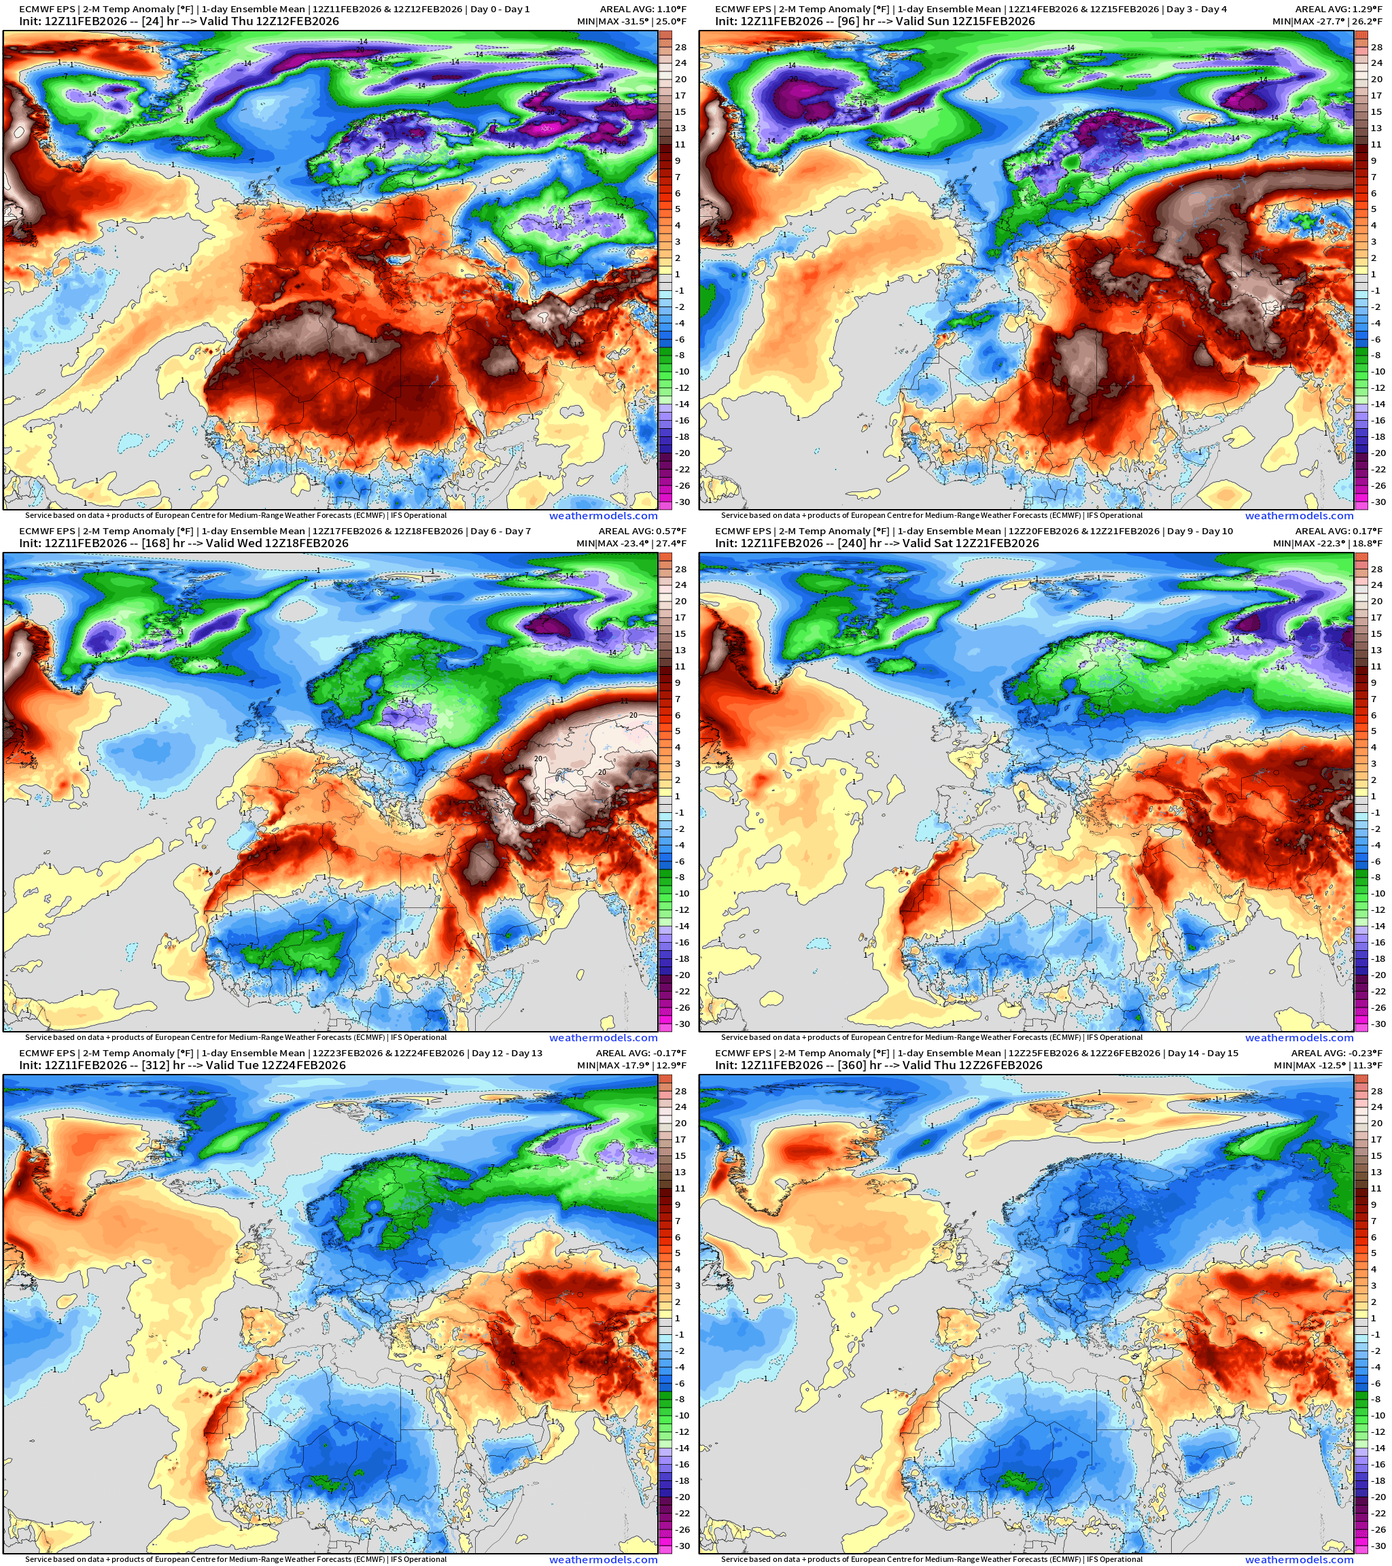
European Excursion — below normal temperatures settle across much of Europe into the final week of February — EPS 12z ensemble mean temperature anomaly next 15-days
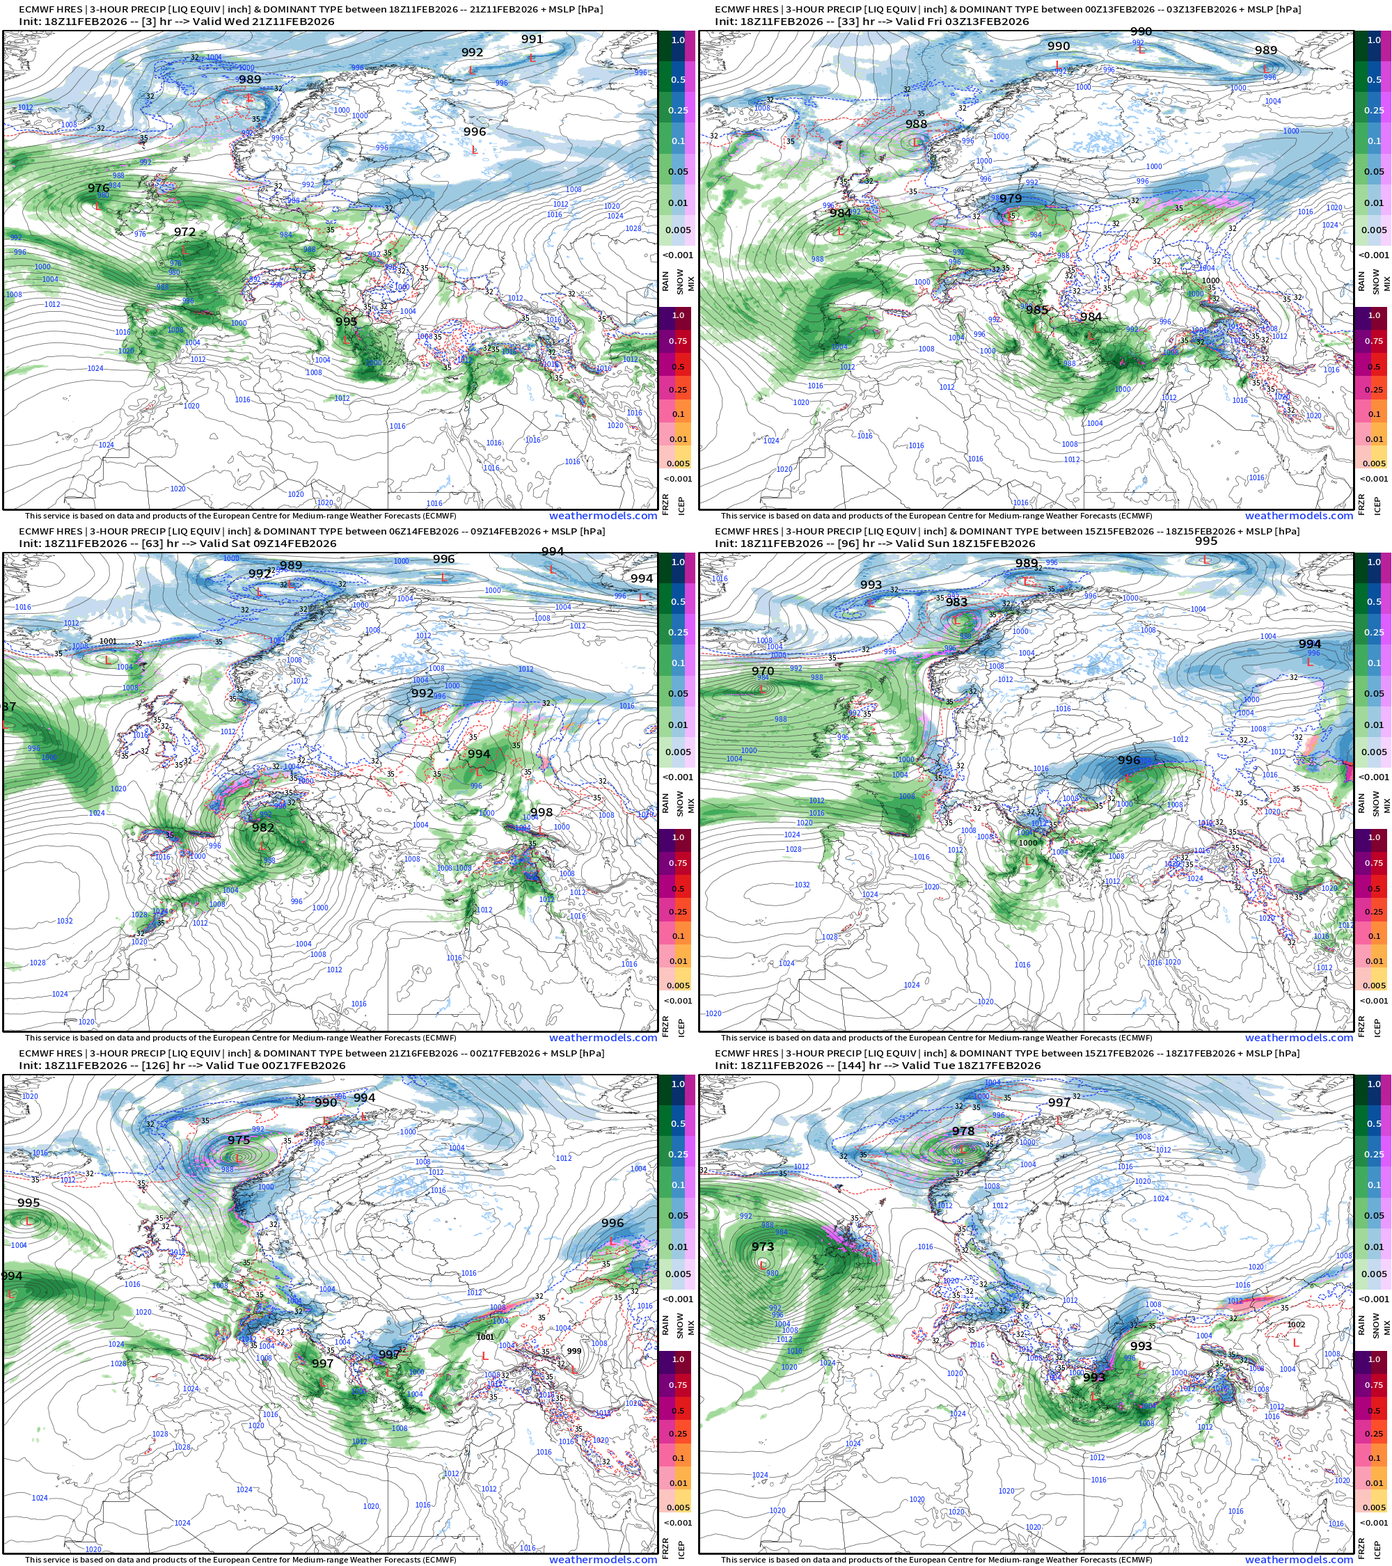
Weather Next 6-days — check out all of the storms — European weather is crazy busy lately.
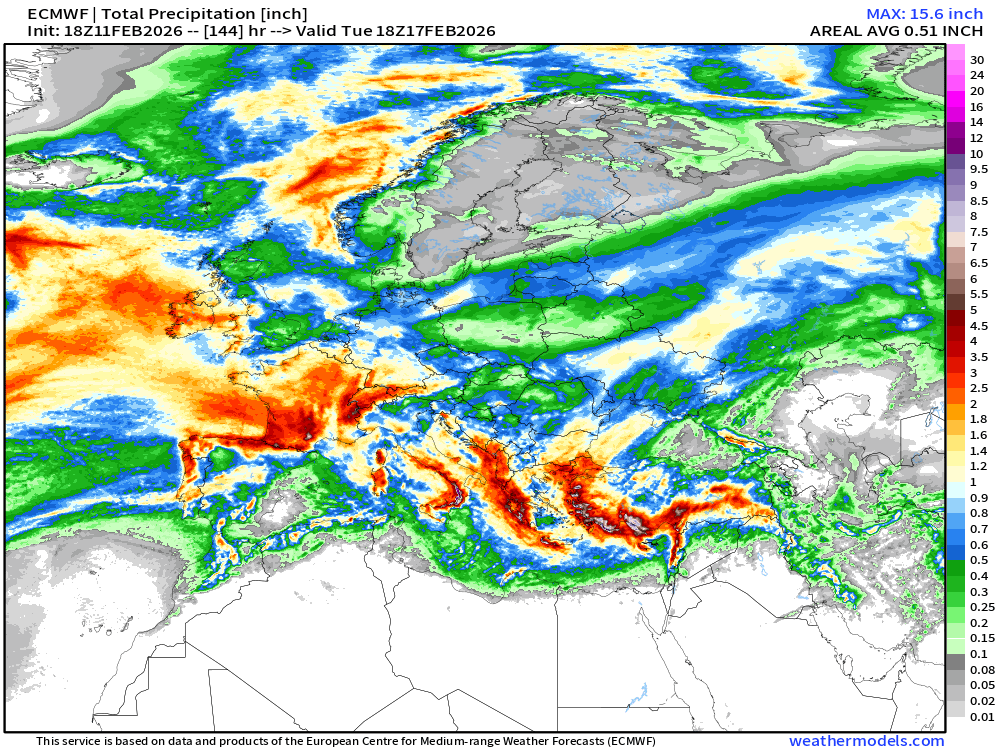
Precipitation Next 6-days — huge totals for northern Spain + France — and then eastward into the Mediterranean
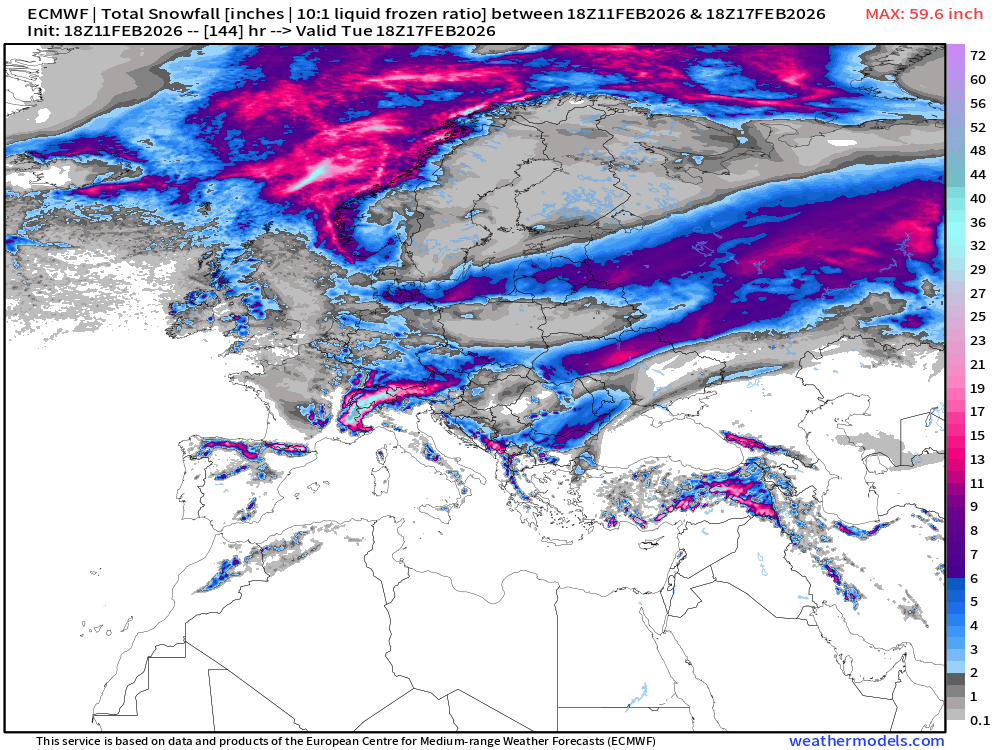
Total Snowfall Next 6-days
Temperature Anomaly | Next 15-days | ECMWF EPS 12z
5-Day Chunk #1 | Temperature Anomaly | Feb 11 - Feb 15
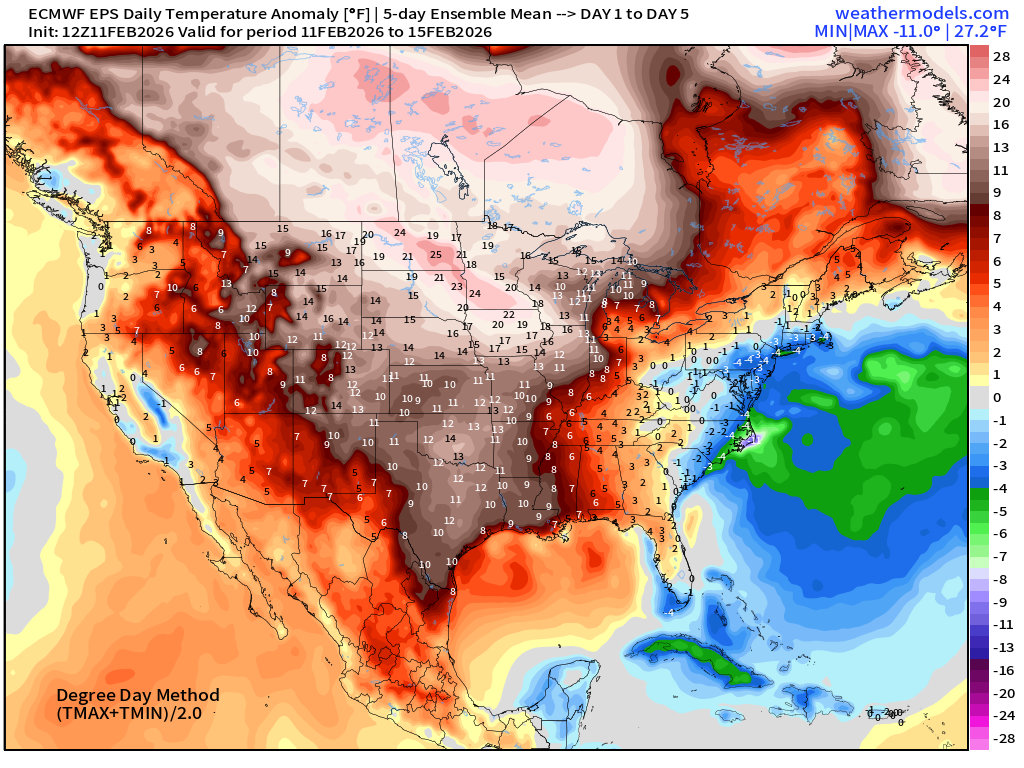
Up to 25°F above normal for upper Midwest for a 5-day chunk — fabulous for mid-February
5-Day Chunk #2 | Temperature Anomaly | Feb 16 - Feb 20
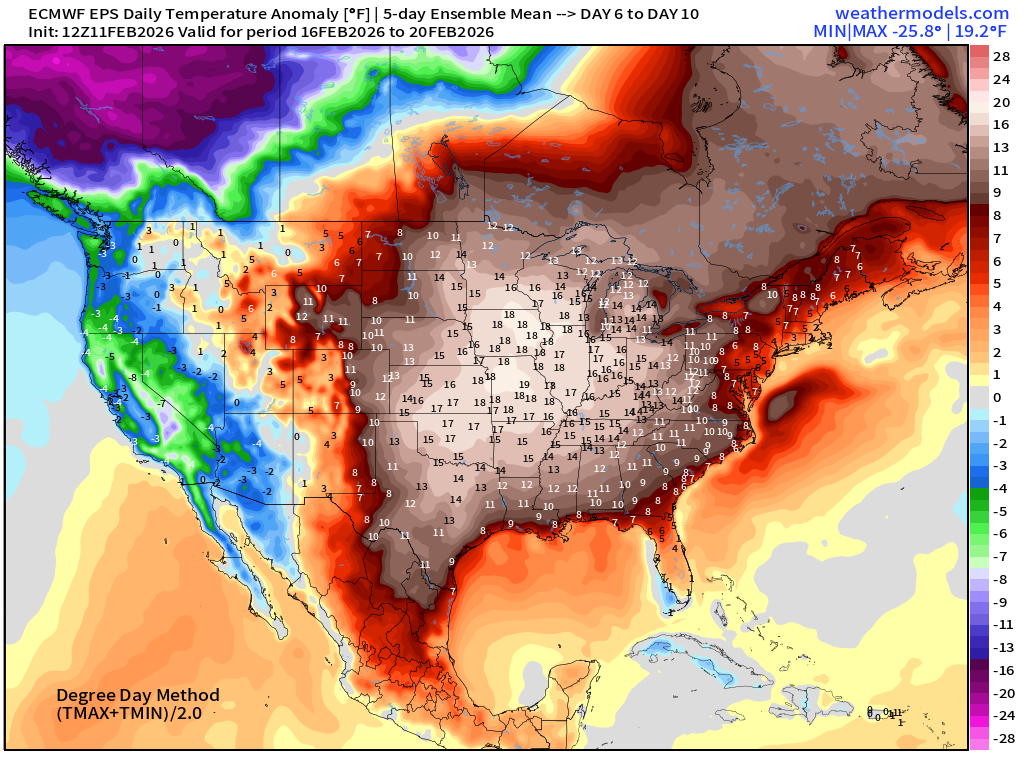
18°F + above normal anomaly in the Midwest centered upon Iowa
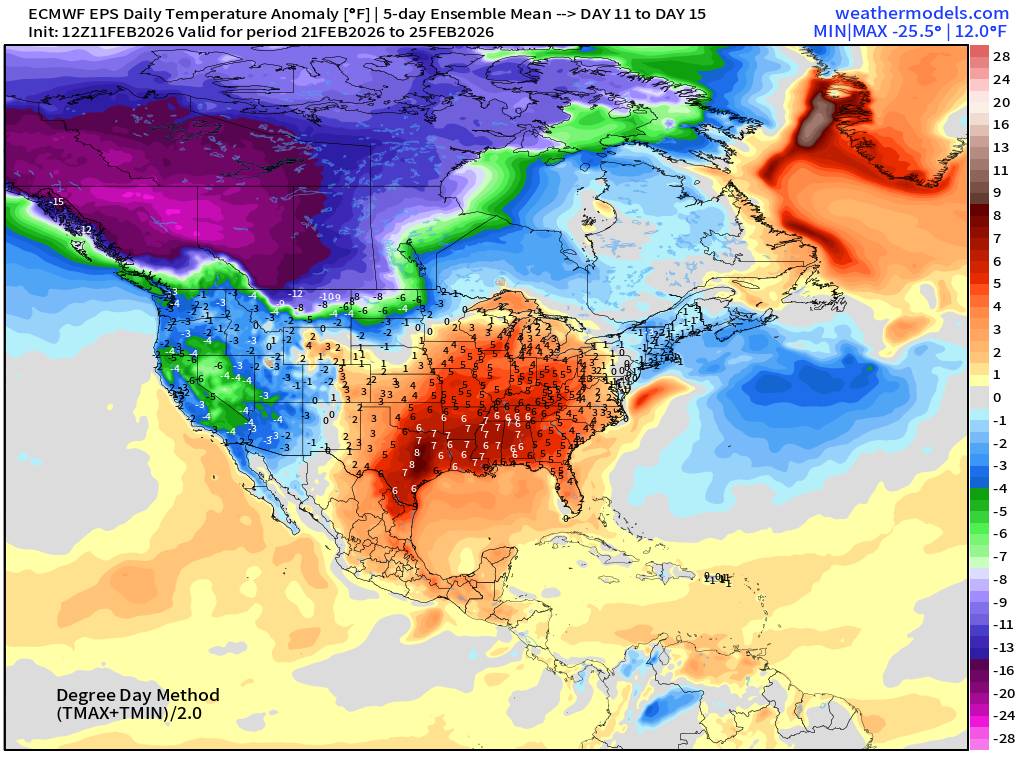
5-Day Chunk #3 | Temperature Anomaly | Feb 21 - Feb 25
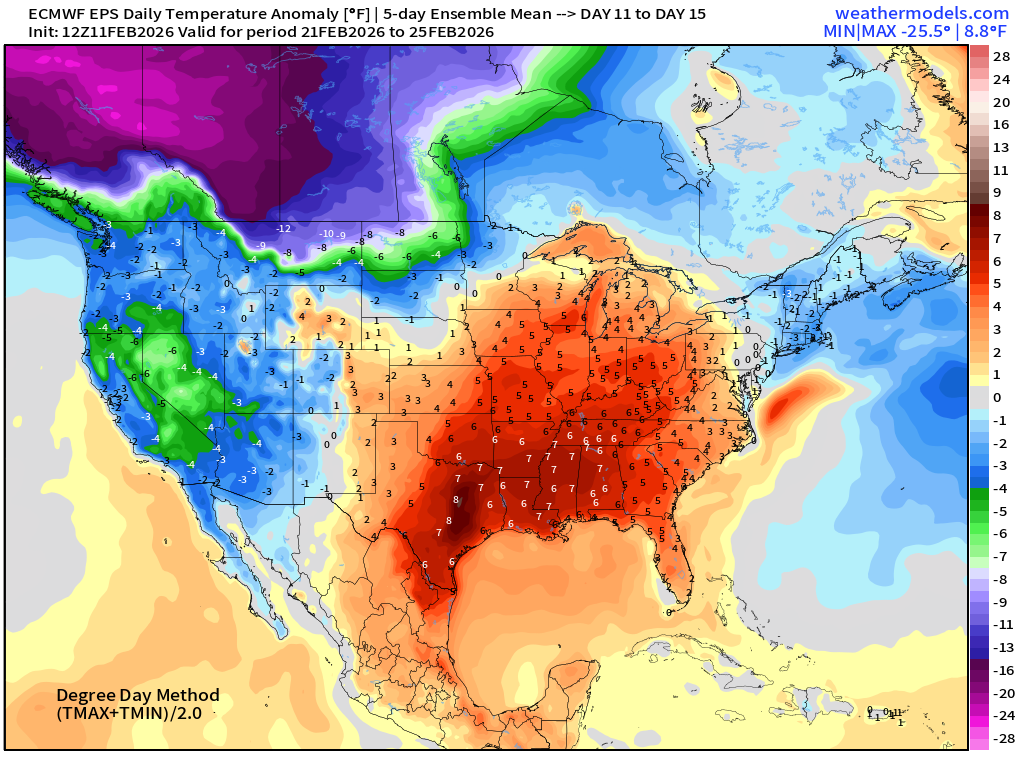
Shrinking above normal warmth in the center of the Lower 48 — looming / huge cold pool over Western Canada, and cooler air across California … zooming out to see it (note the map projection is flat)
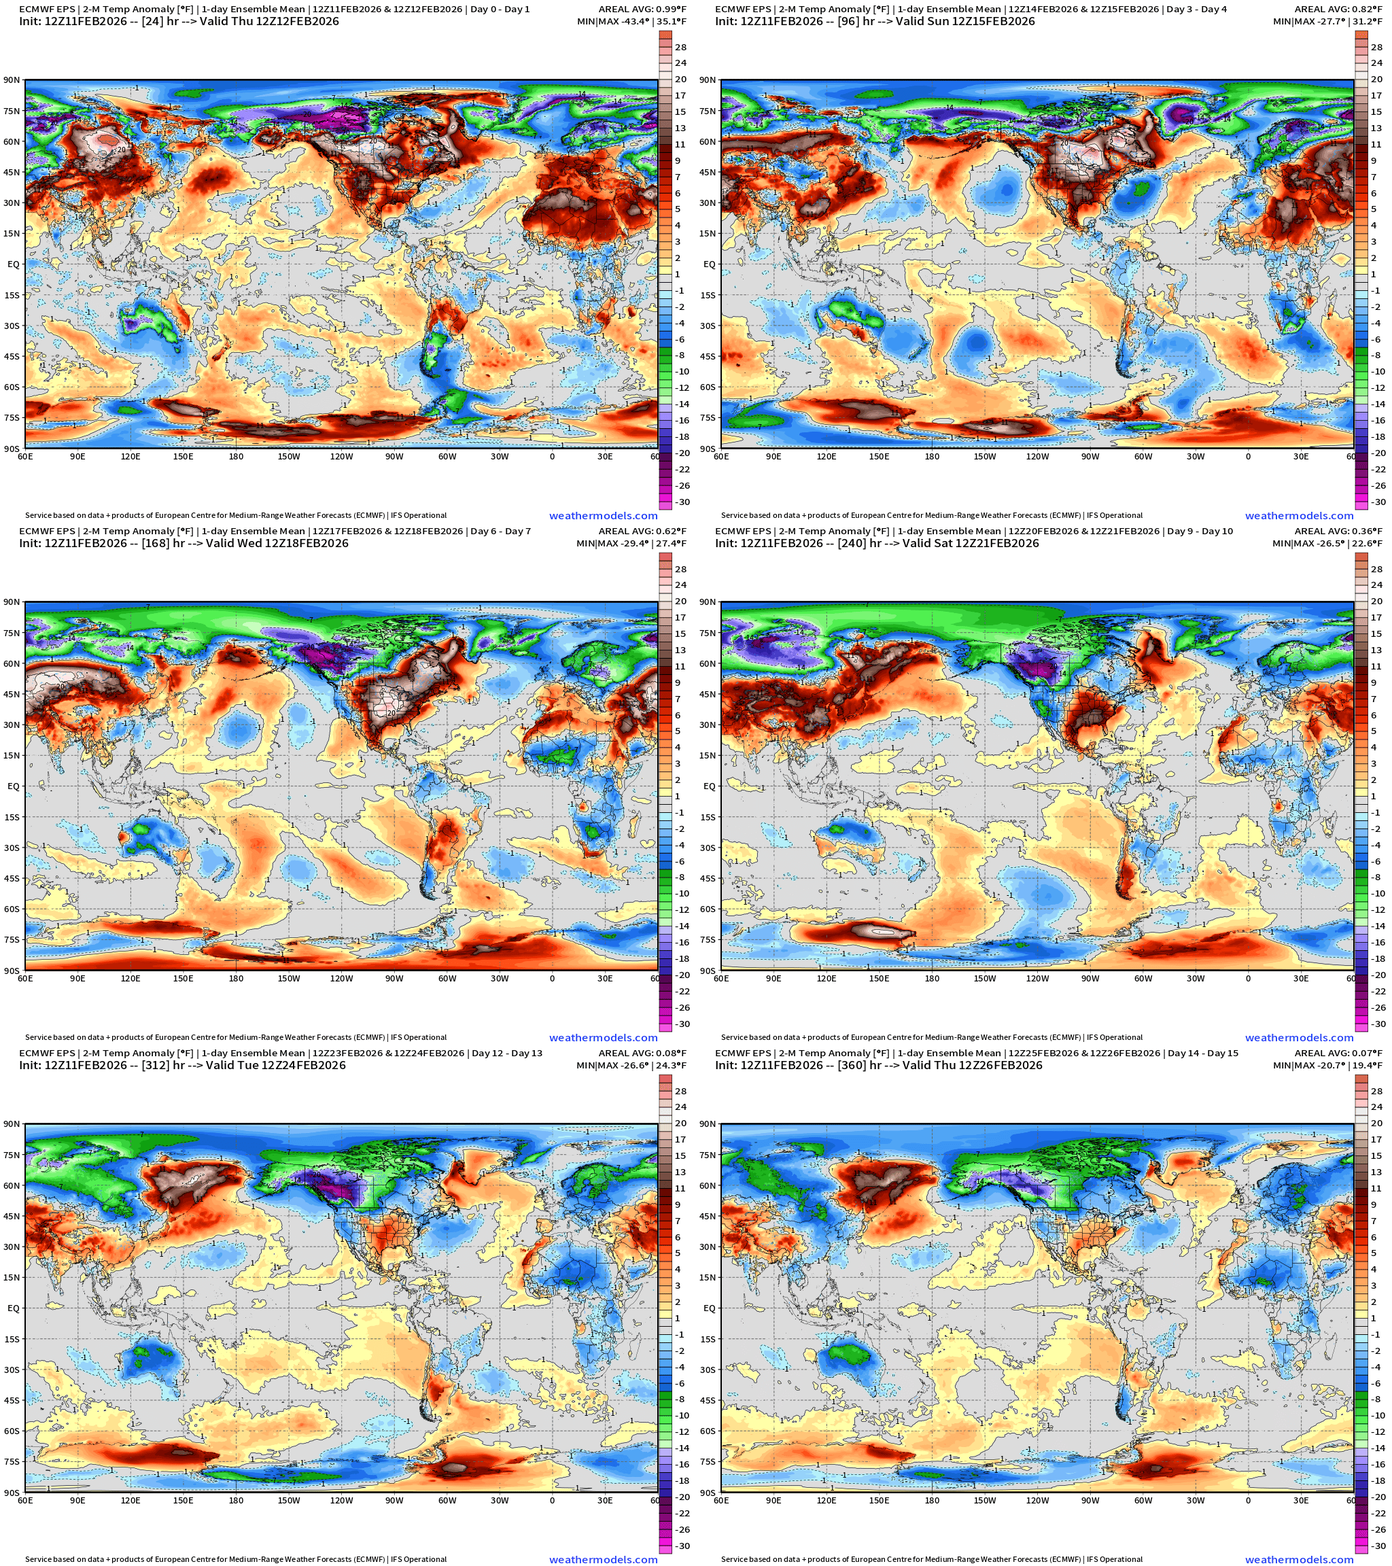
Normally the blog would be over! But there’s more because I am very curious about global temperatures over the next 2-weeks.
Using the Ensemble Mean from the EPS 2-meter temperatures (ECMWF 12z) you can see the “global areal average” in the upper right corner start out from +0.99°F at the beginning compared to the 30-year climatology (1991-2020) and drop all the way to +0.04°F in two weeks — loss of almost 1°F globally compared to climatology. How is that possible? Colder air over the continents = sensible heat loss = rapid radiational cooling due to albedo and reflection of the late February sun angle (in the NH) back to space —> Earth’s radiator.
Be back on Thursday!
Maps sourced from weathermodels.com designed and innovated by yours truly! Please subscribe there for real-time access to the newest maps, charts from all of the weather models including ECMWF and AIFS, NOAA AI-GFS/AI-GEFS
- Milepost
- 866 · laid 2026-02-12T02:39:00.392000Z
- Source
- https://weather.substack.com/p/february-11-2026-wednesday-evening
- Digest
- 8d3b806474dc07d8abecdc27b76242741bf46e4595f0697abfdc0b5bae9b15a9
- Machine
- JSON