January 28, 2026 Wednesday Evening Winter Weather
Blockbuster blizzard with hurricane force winds to lash Carolinas and New England
January 2026 was the 25th-warmest January in the 132-year national record (1895–2026), at 33.1°F against a 1991–2020 normal of 32.3°F (+0.8°F).
January 2026 was the 12th-driest January in the 132-year national record (1895–2026), at 1.6in against a 1991–2020 normal of 2.3in (-0.8in).
NOAA/NCEI Climate at a Glance, contiguous United States. This is the observed record for the month, not a score of anything said in this piece — the forecast ledger begins 2026-08-17 and cannot reach earlier posts.

Bomb Cyclone — actually a large gyre to with 2 main low pressure centers that undergo a binary interaction within the larger upper-level trough (polar vortex) mid-level environment.
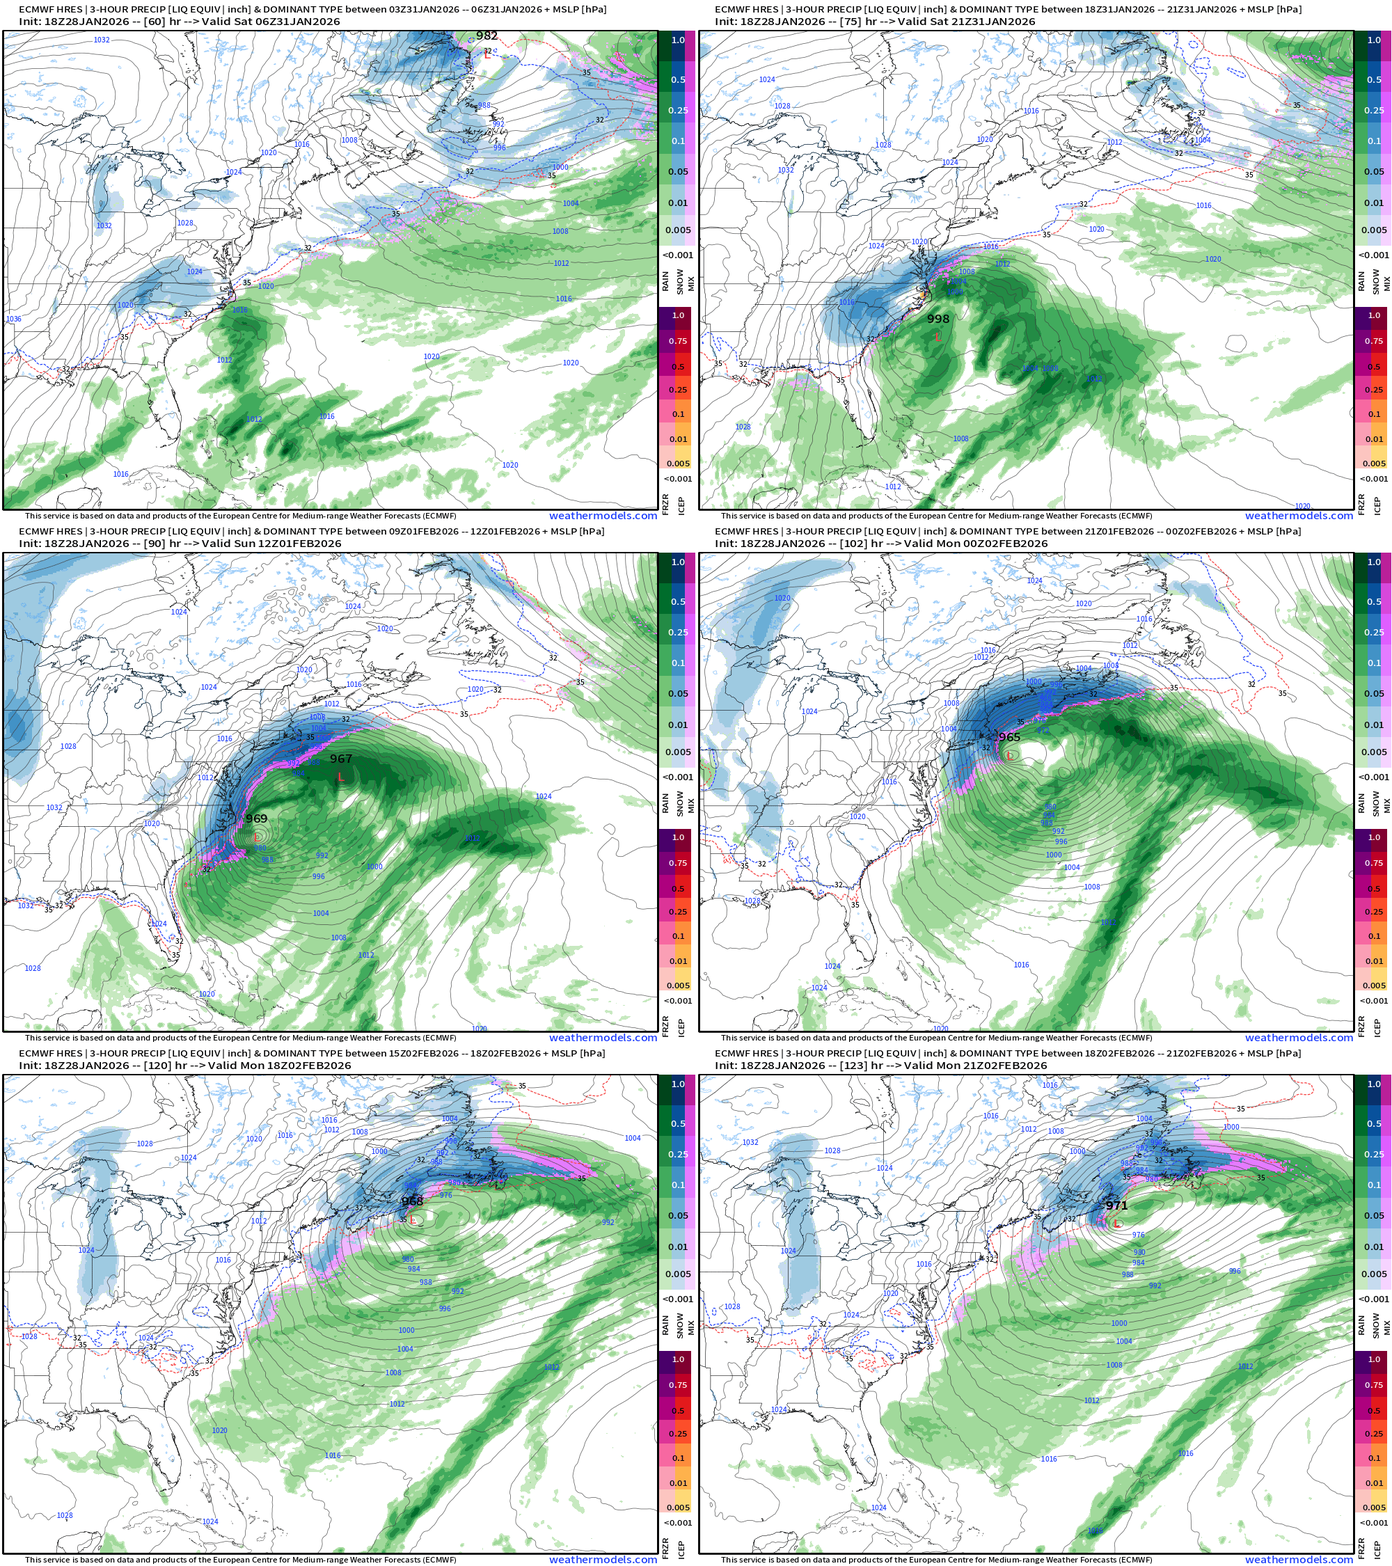
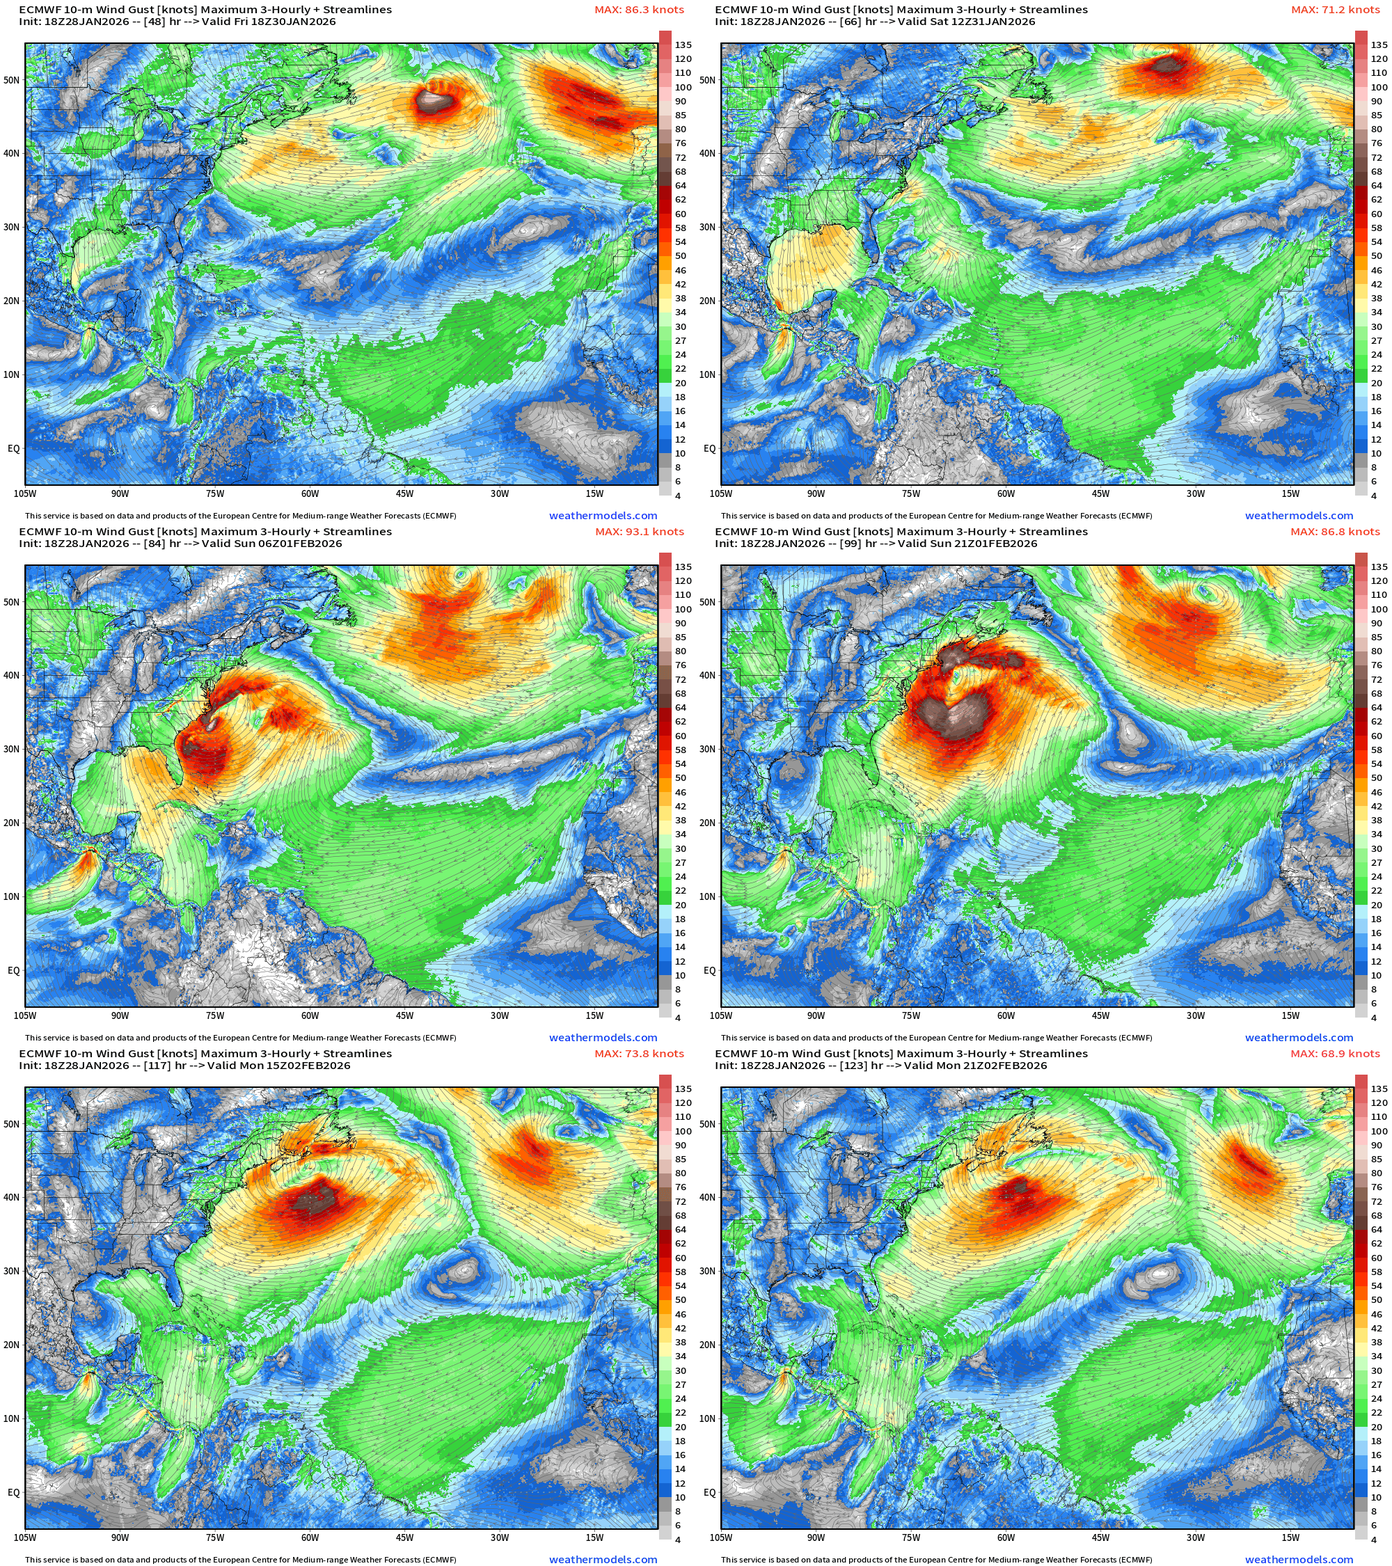
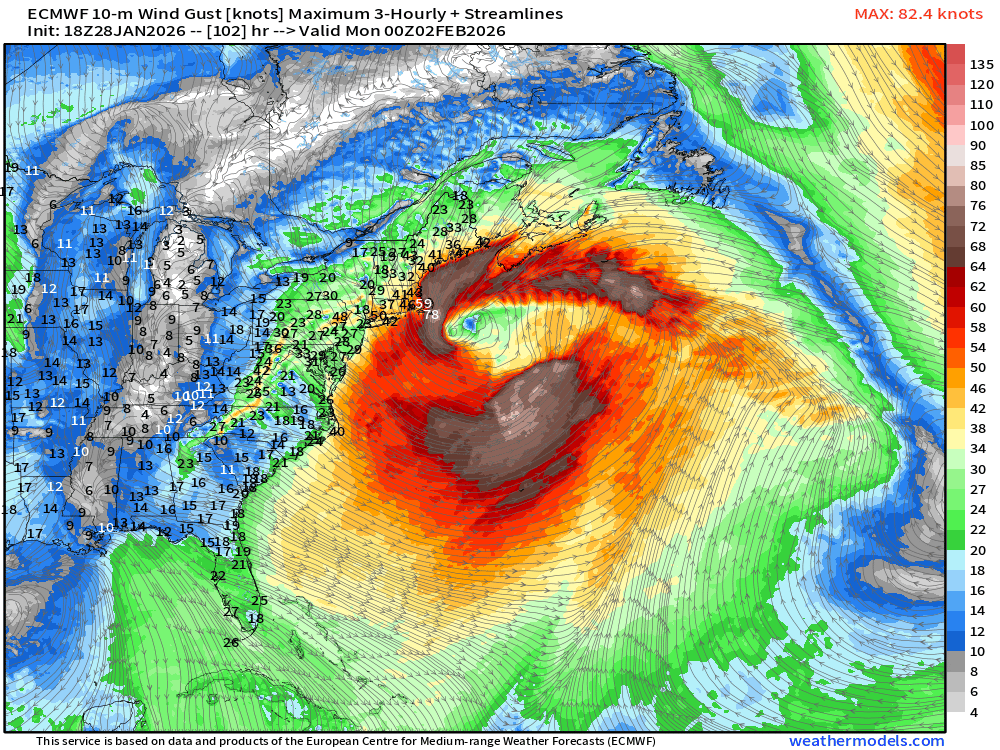
Truly Massive Cyclone with hurricane force wind gusts over a large area of western Atlantic along and off the East Coast.
If you are a first time visitor but not signed up to receive my daily update emails — please do!
Development of a massive coastal storm —> major impacts for Carolinas into the coastal Mid-Atlantic and New England including Boston
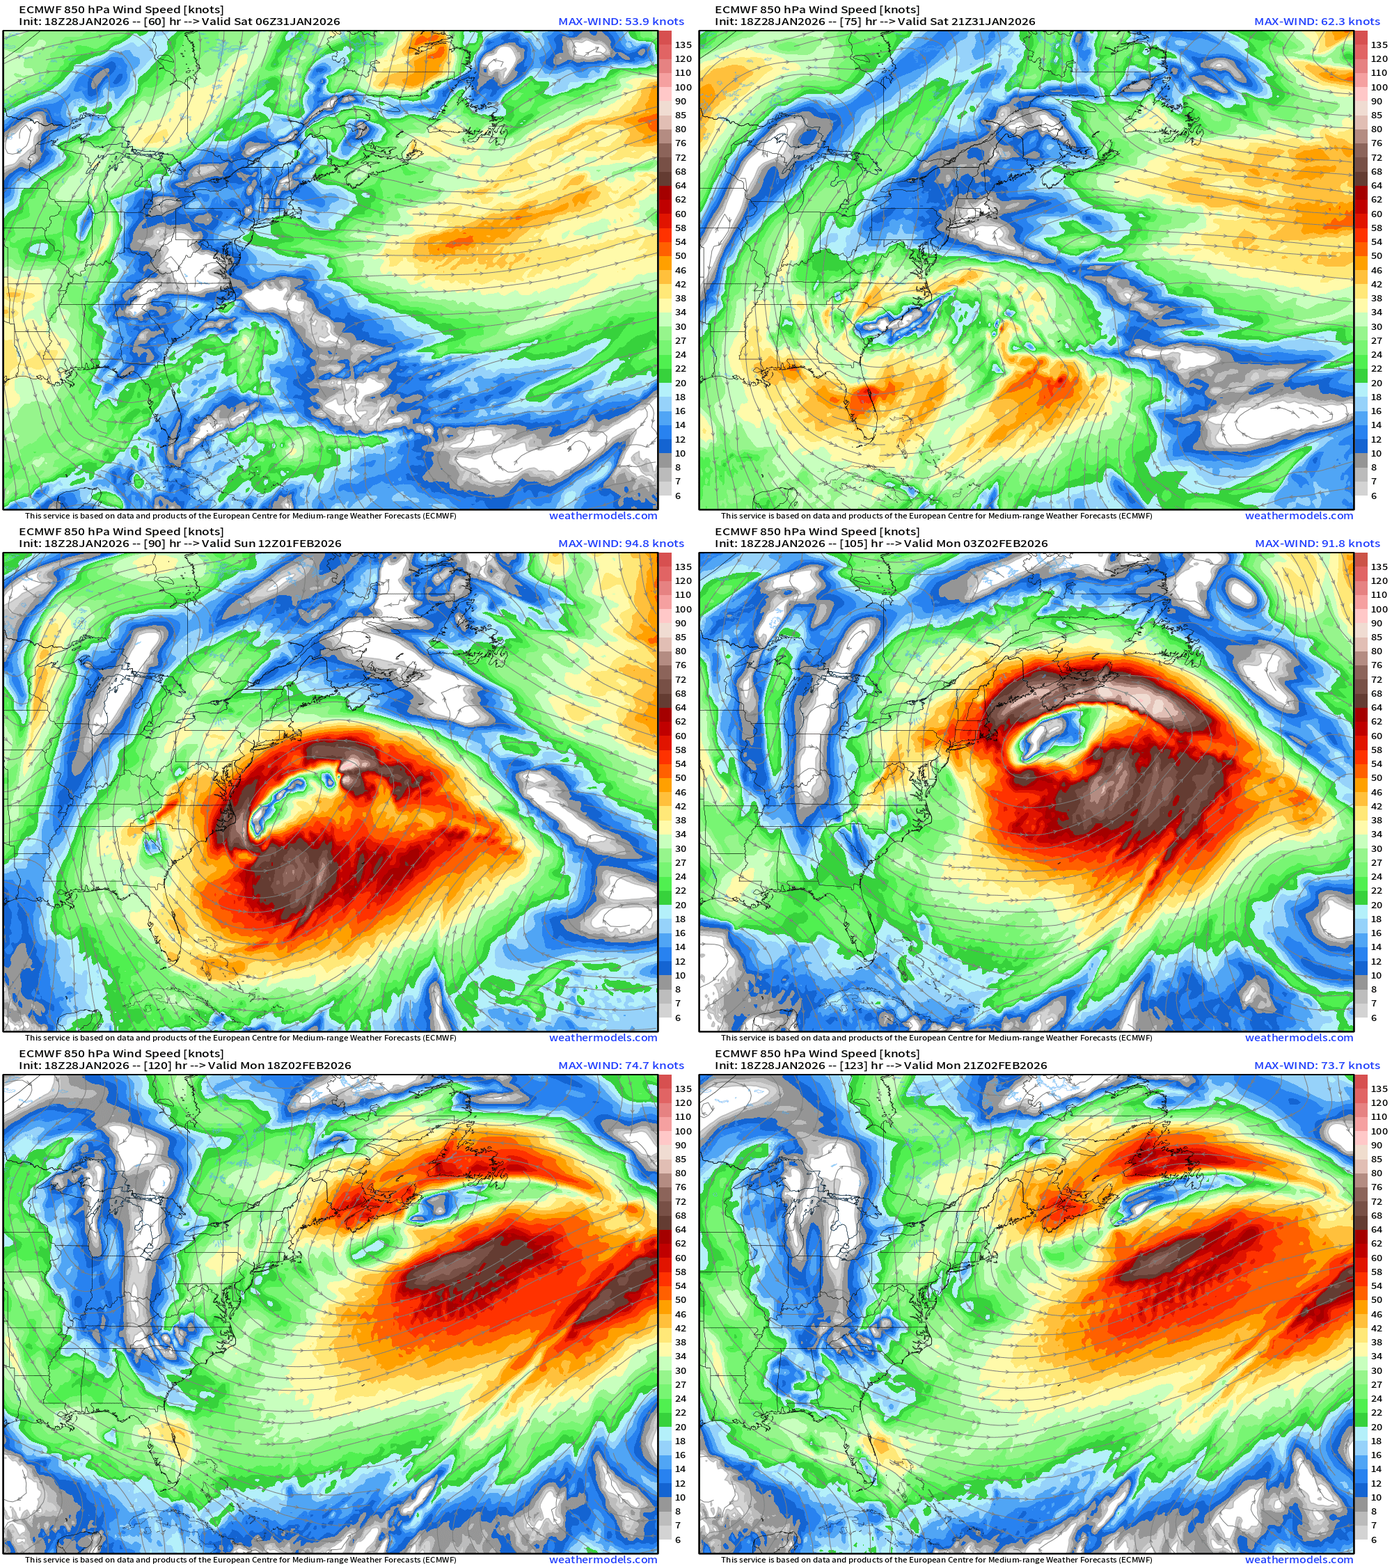
Massive wind maker — 850 mb winds show the energy — and likelihood of blizzard conditions along a long swath of the Atlantic coast from South Carolinas to New England. This isn’t wind gusts — but we can use a 80% factor to get them from this map — so we may may be talking about hurricane force?
92 knot wind gusts = 100 mph+ along the North Carolina Outer Banks
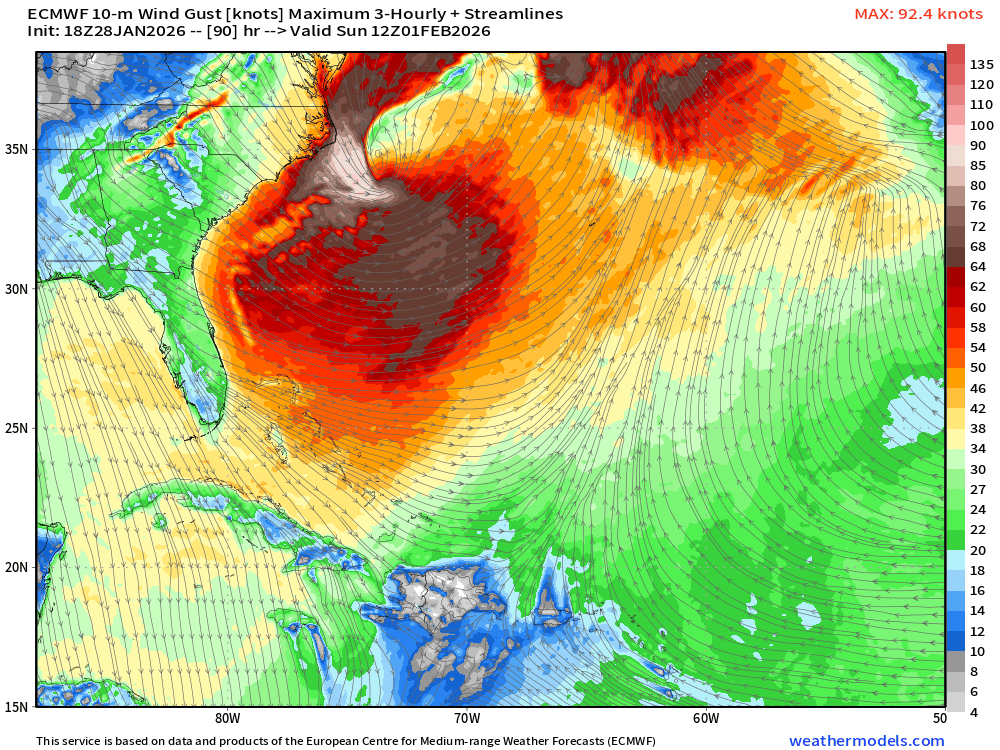
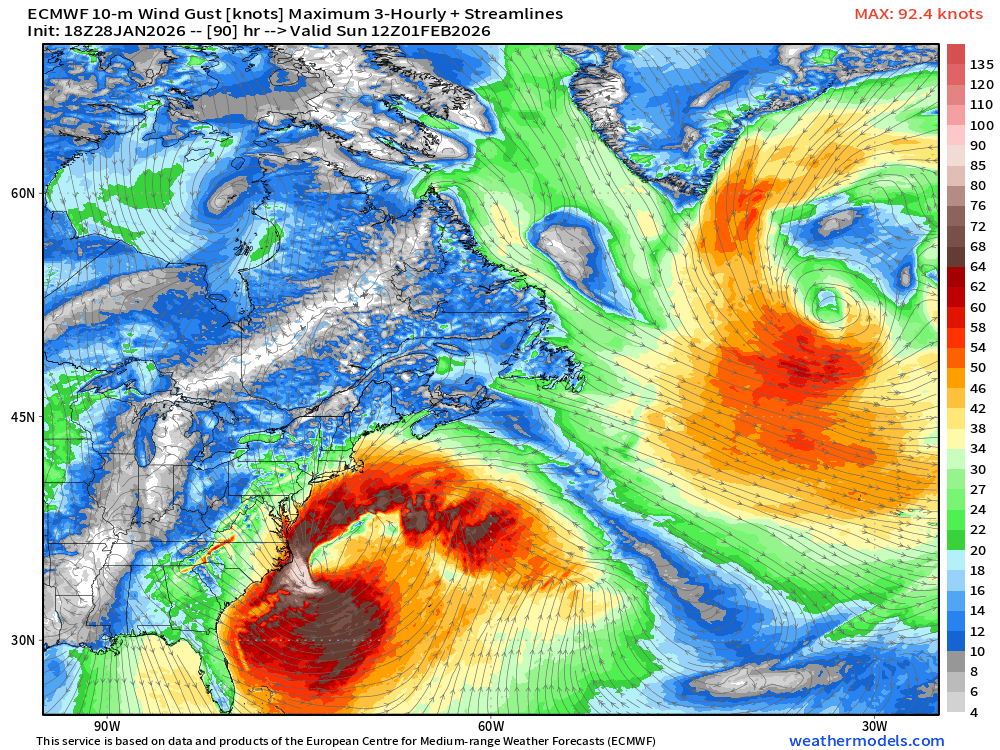
59 knots to 78 knots along the Cape in Mass. — again threat for hurricane force winds
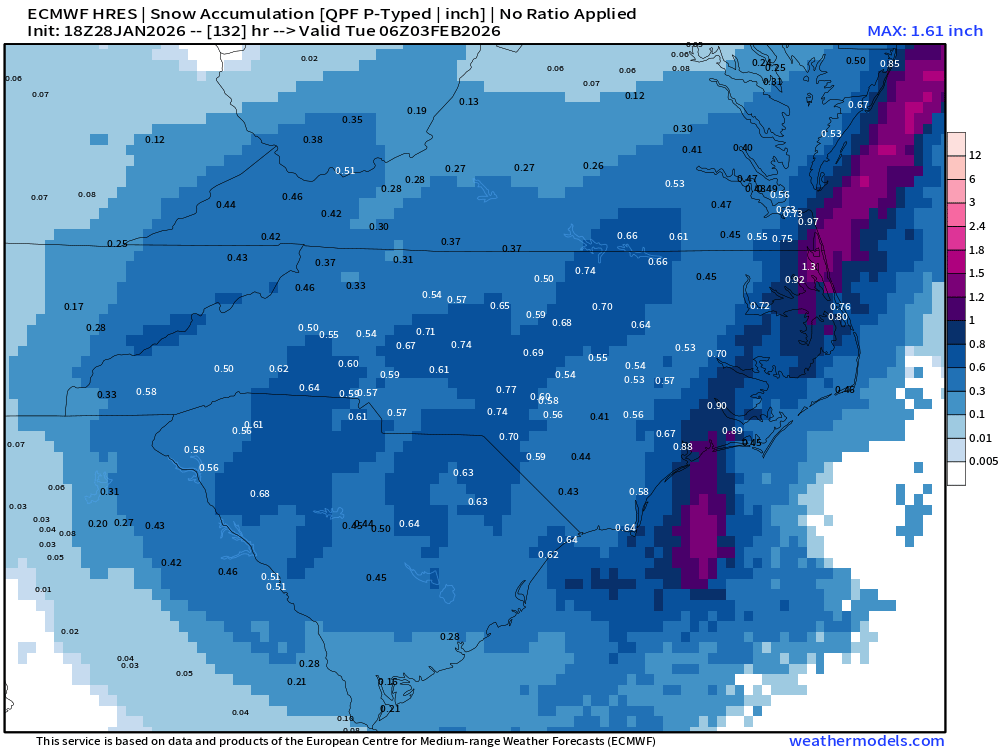
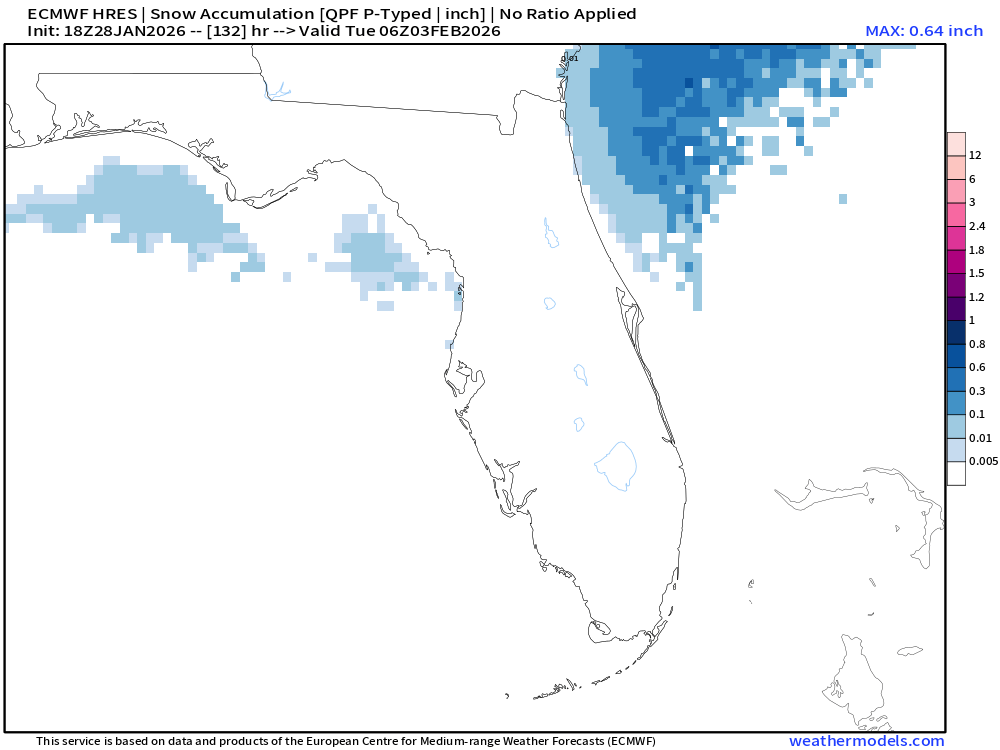
Snowfall Amounts from ECMWF IFS 18z | Next 6-days
QPF Precipitation Typed as Snowfall | No worry about freezing rain and sleet/ice
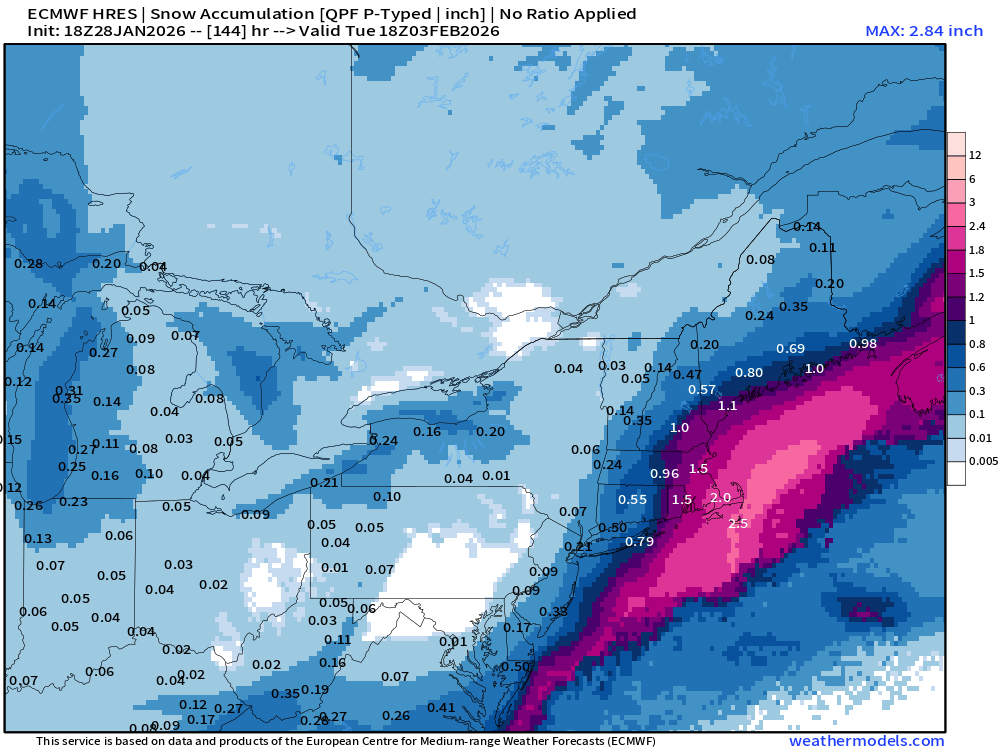
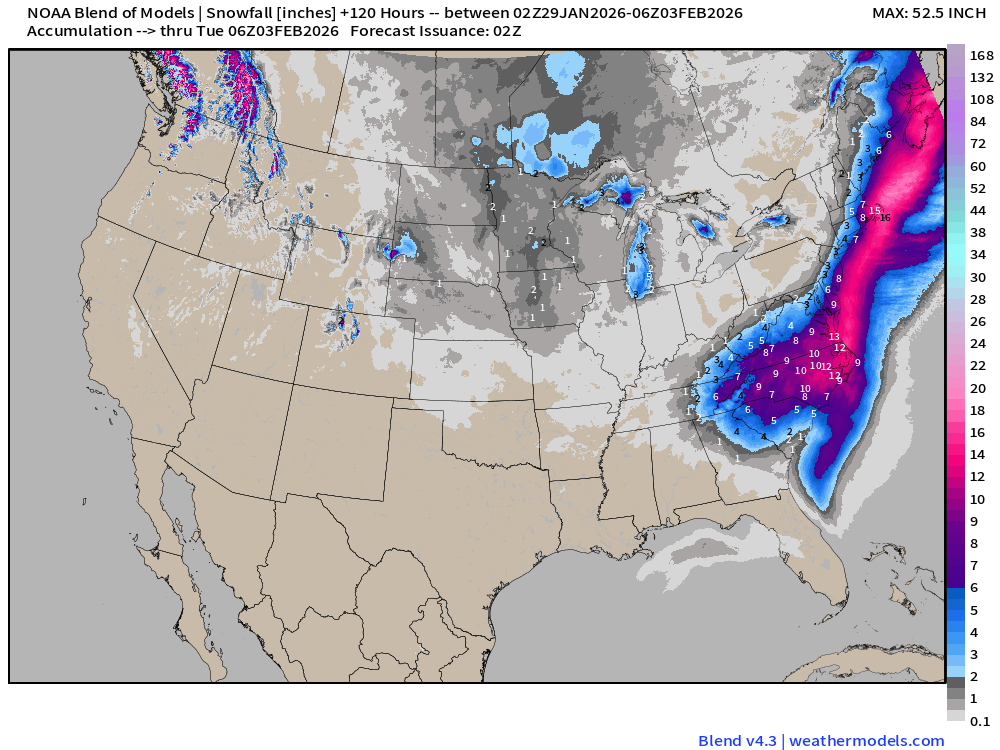
1.7” to 2.0” of QPF as snowfall would put eastern Mass in the 24” to 36” snowfall category with 15:1 to 18:1 Snow-to-liquid ratios … even more on Nantucket
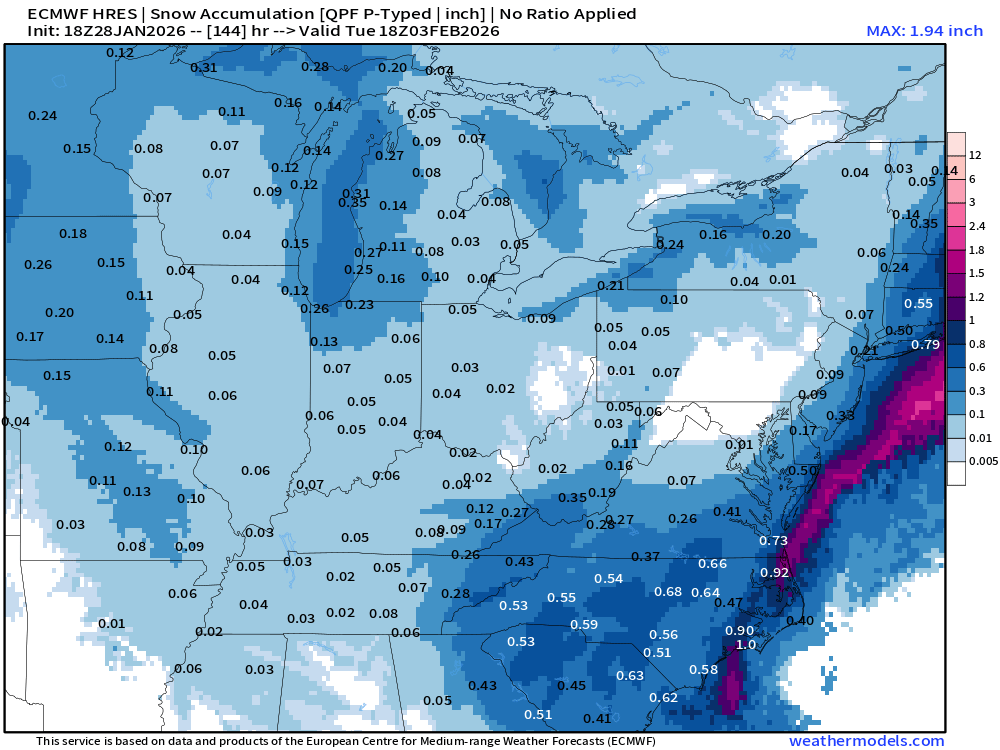
Plenty of QPF across the Carolinas for 6” to 12” interior and maybe 2-feet along Atlantic coast (whoa!)
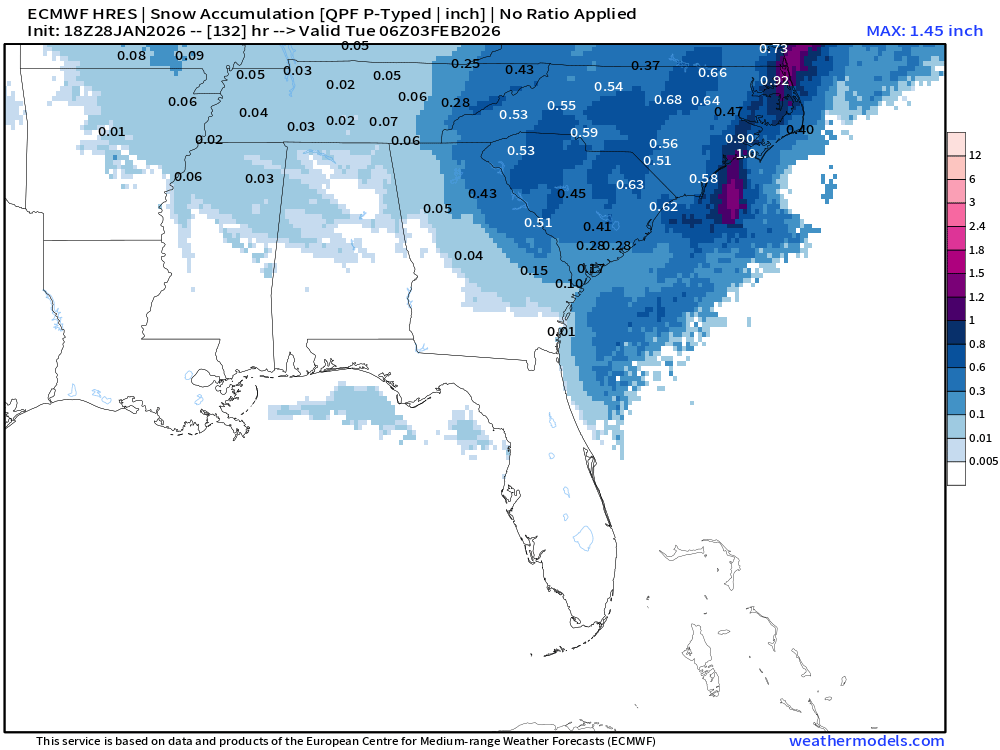
Florida: Very light snowfall amounts in the Gulf of Mexico — but those pixels are there so any moisture < 0.005” might not be indicated. Plenty more snow off Jax.
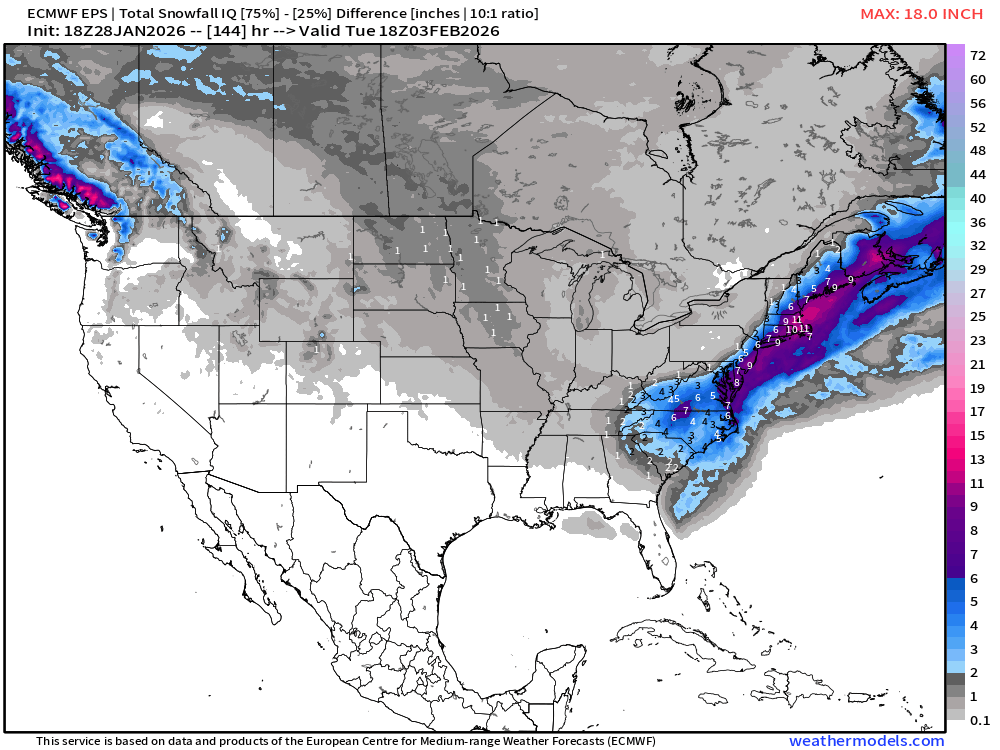
Variability in Snowfall Amounts Based Upon Track of Bomb Cyclone
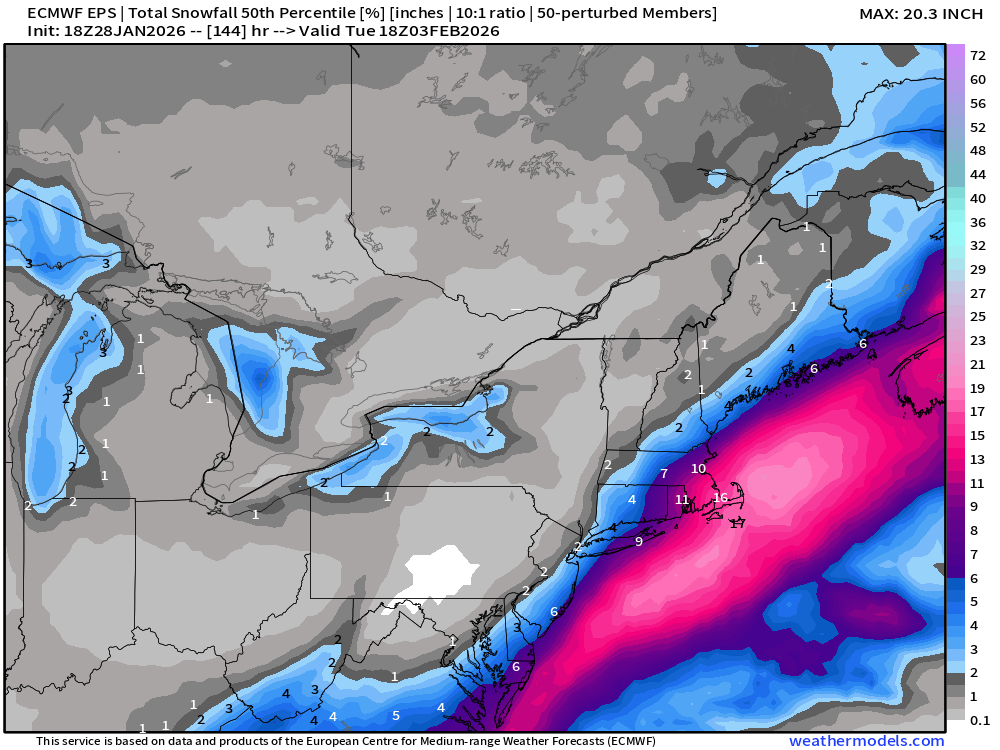
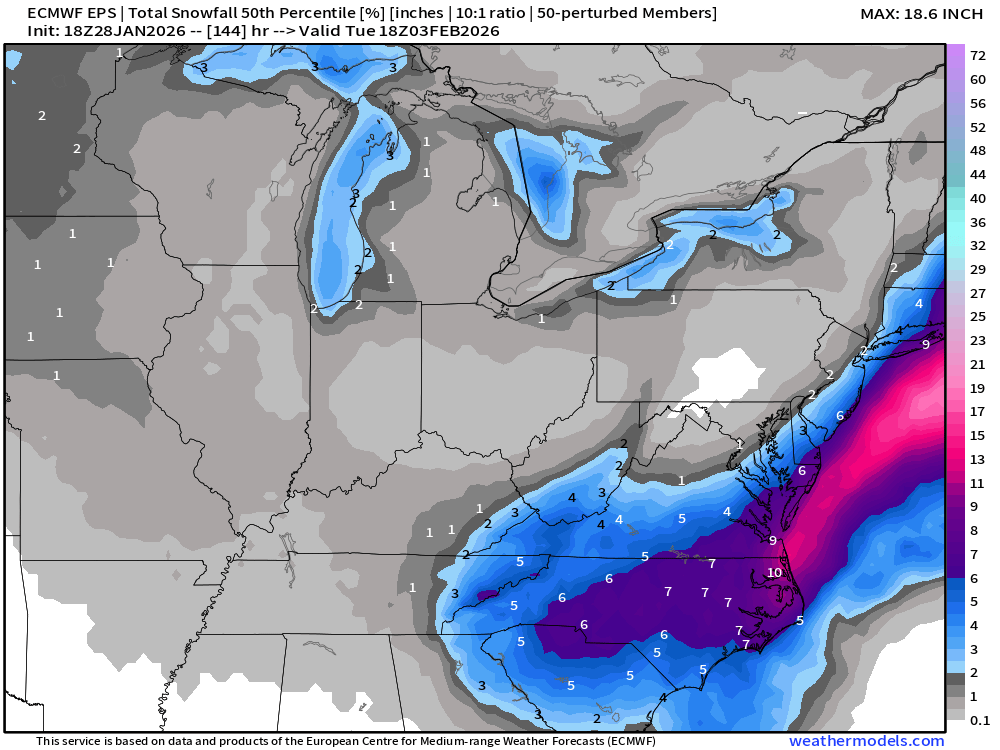
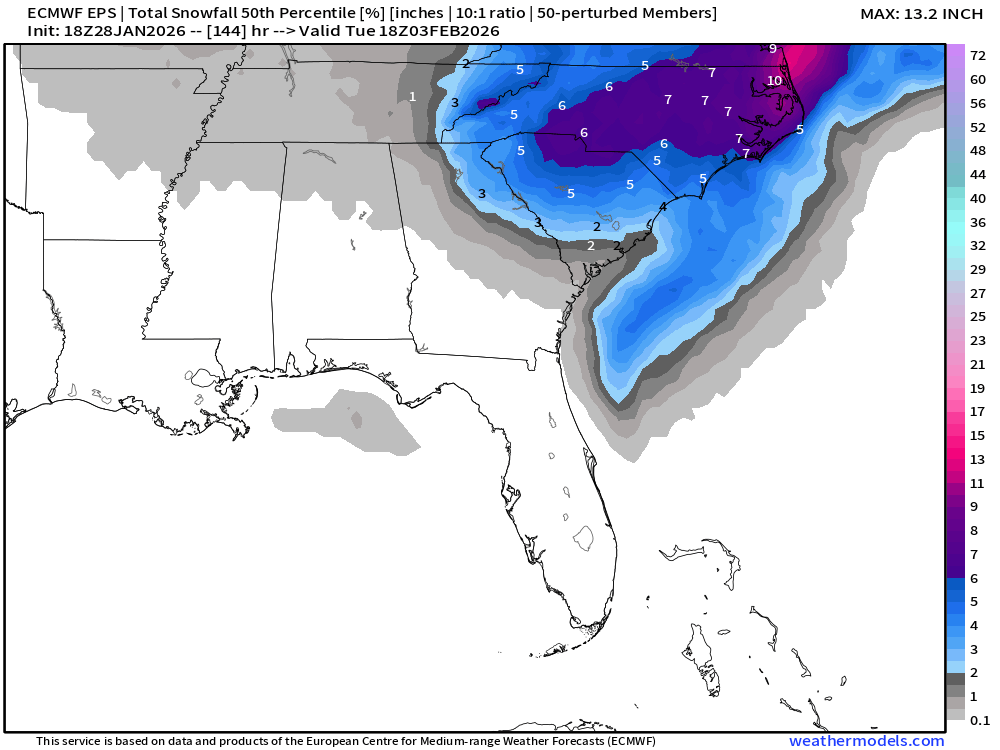
We use ensembles (here EPS 06z from ECMWF w/51 member) to show the median or the rest of the solution distribution at every grid point
The spread is often best shown by the 75th percentile minus 25th (interquartile range) from “box and whiskers” statistics
75th Percentile — note this is 10:1 ratios so multiply by 1.5 factor due to cold air
ECMWF AIFS Snowfall 18z | Next 6-days
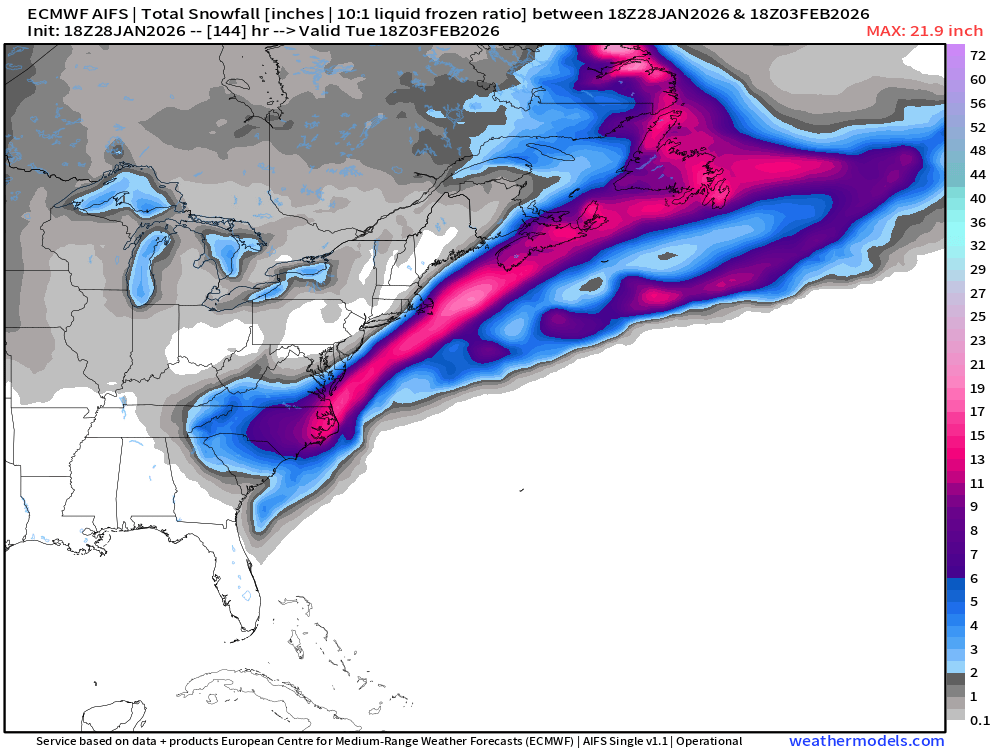
Westward track — so we have Carolinas getting rocked!
RTMA | Morning Temperature Analysis | 8 AM ET
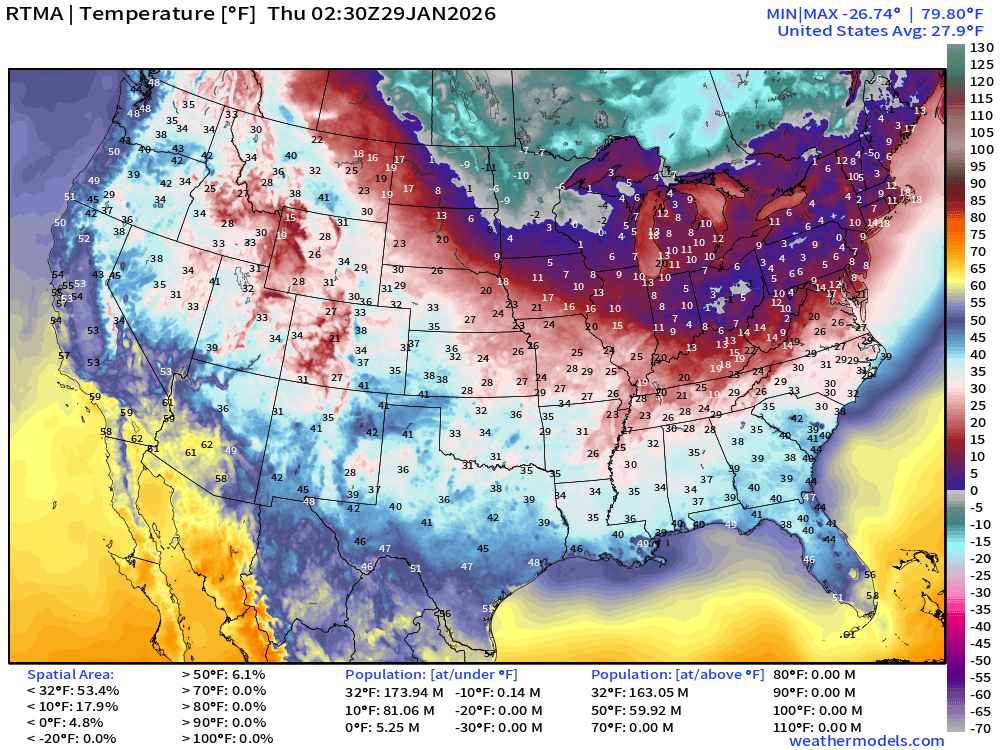
9:30 PM ET: Avg Lower 48 temperature was 27.9°F — 174 million below freezing.
Temperature Anomaly | 9:30 PM ET
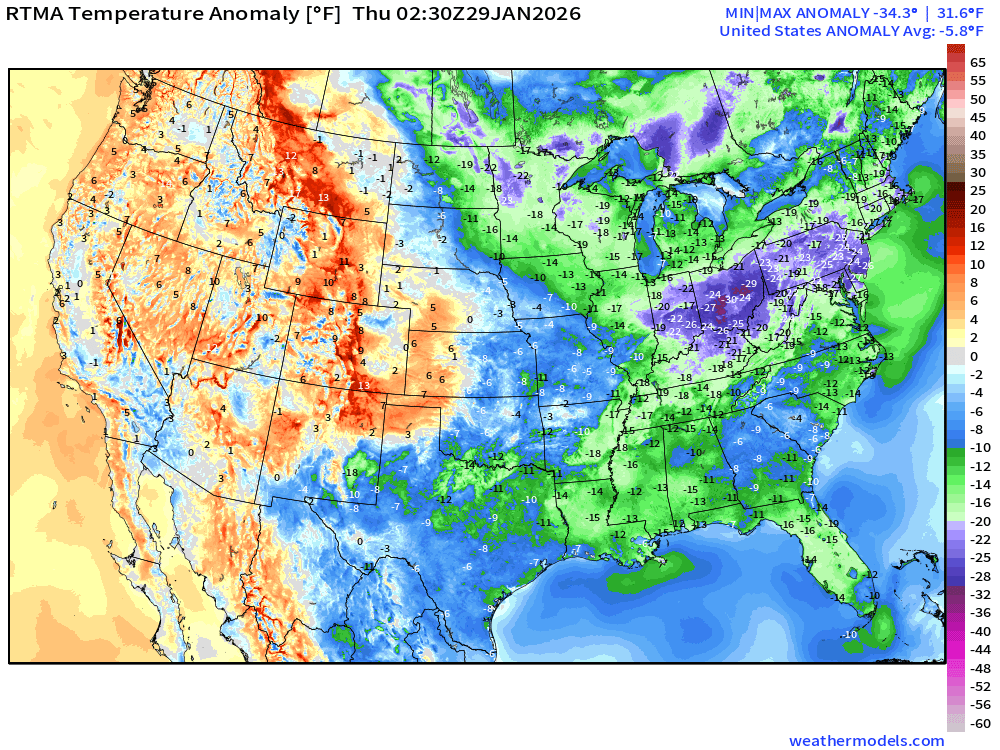
9:30 PM ET: Lower 48 Temperature Anomaly below normal by -5.8°F
NWS NDFD Snowfall next 3-days | Lake Effect until they freeze over
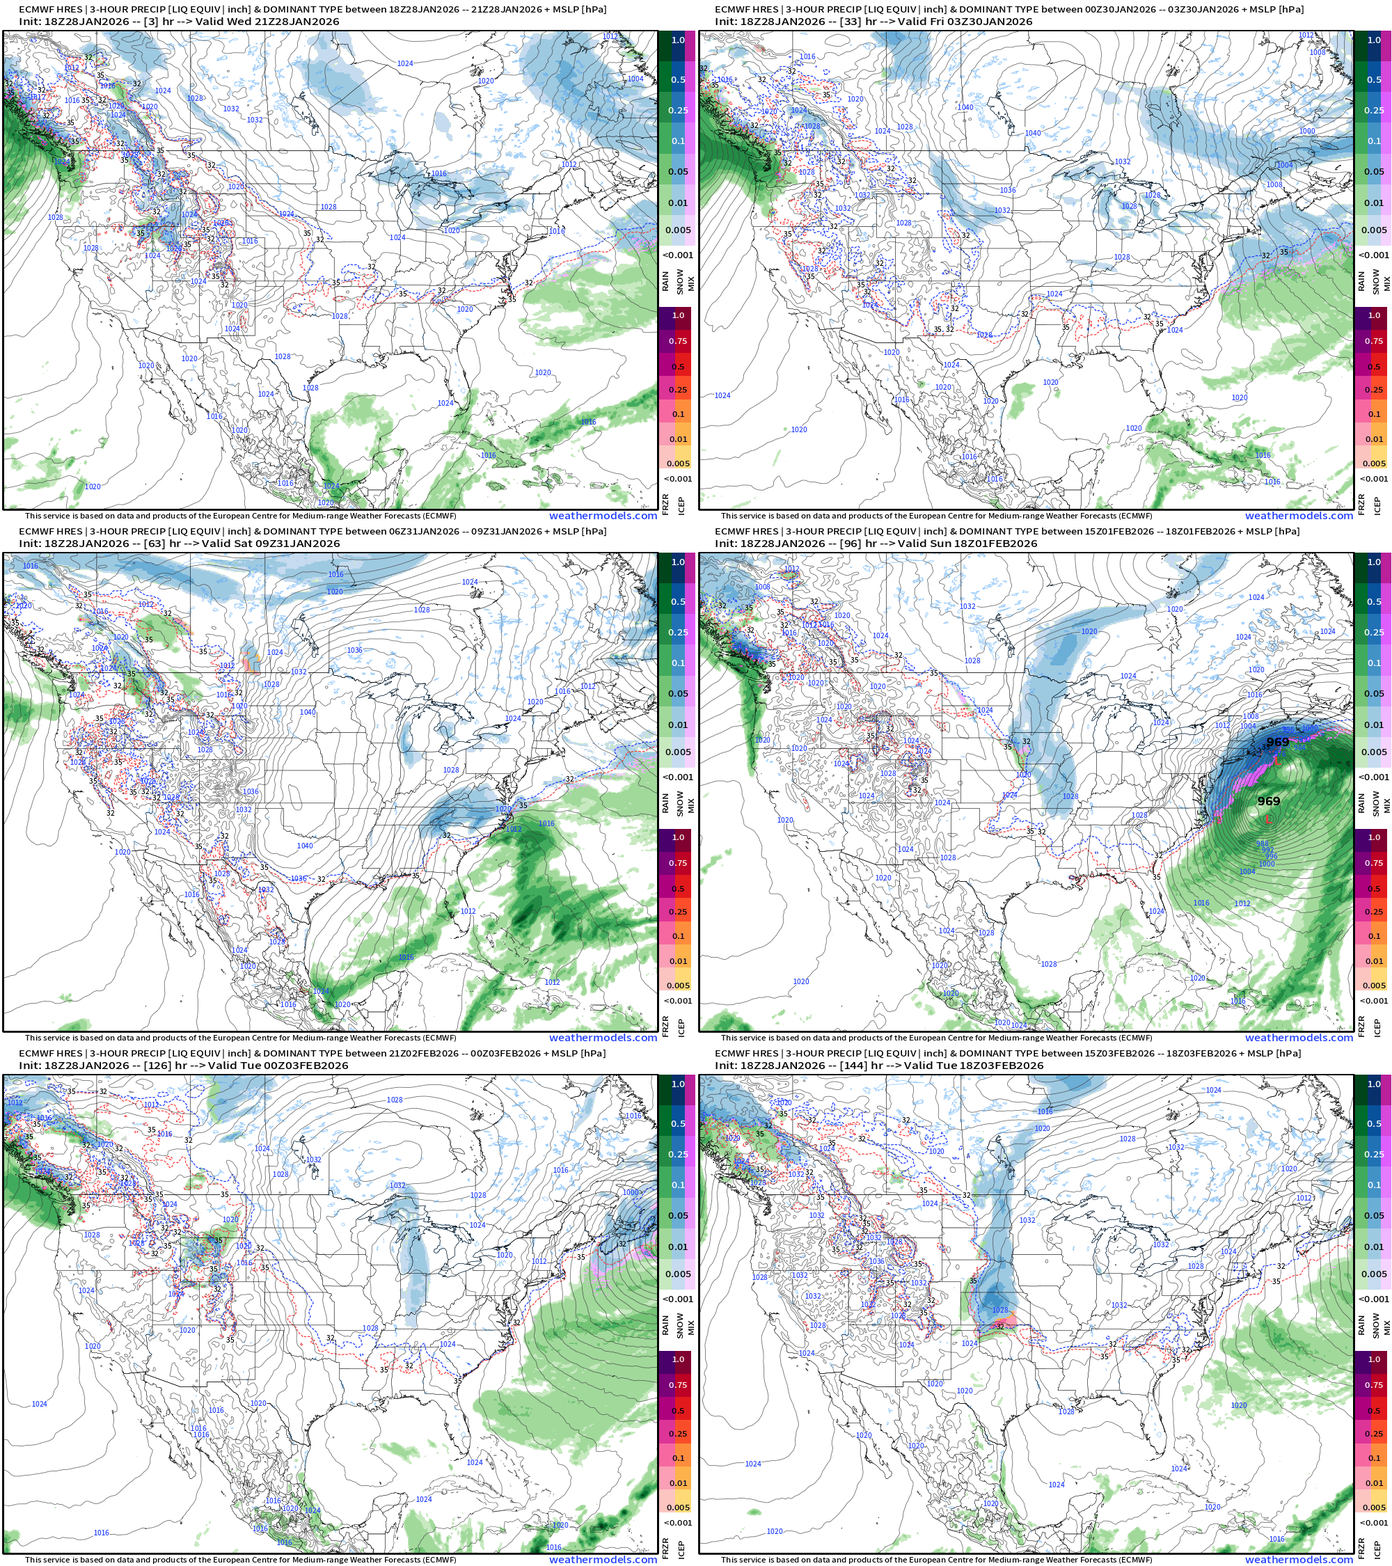
Also, starting to see the “bomb cyclone” initial stage develop snowfall in North Carolina showing up
Continuing Brutal Arctic Cold | Lows next 8-days
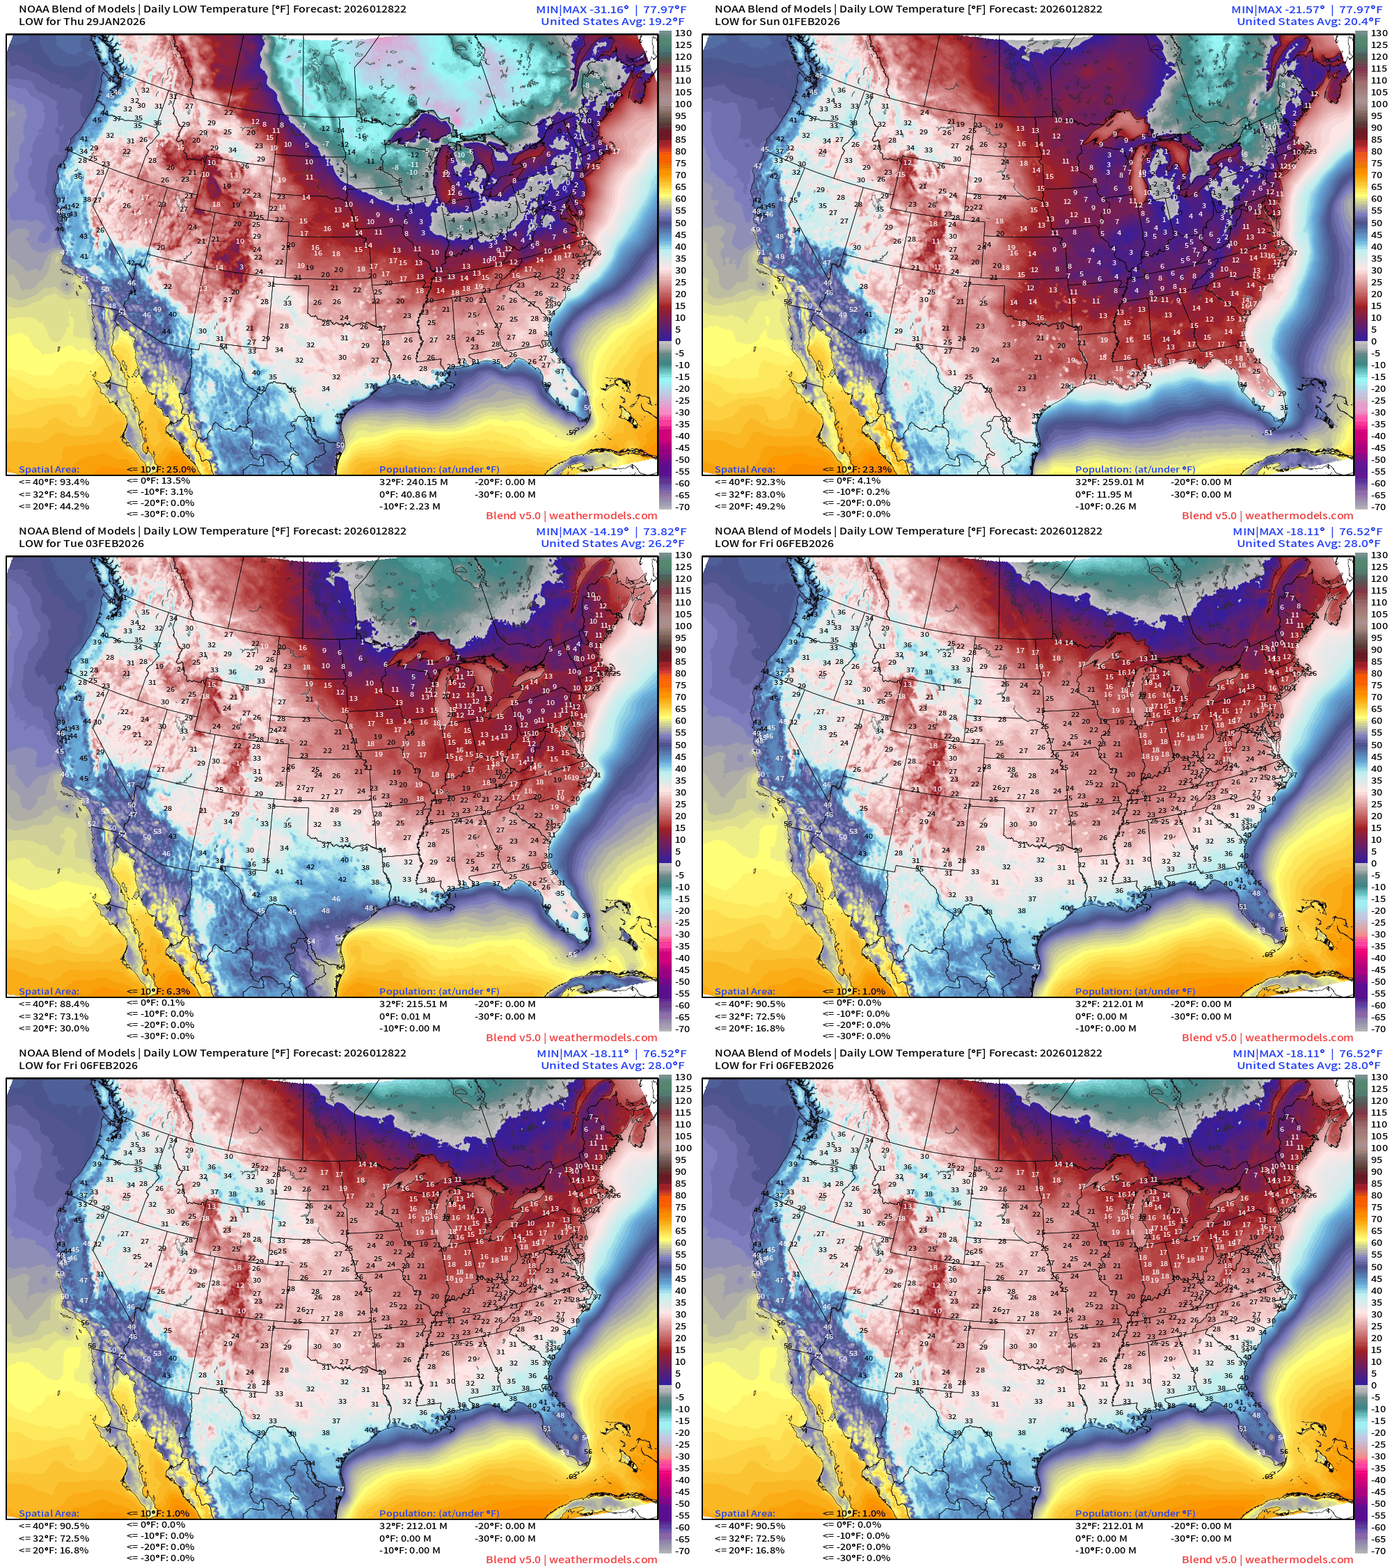
Low Temperatures Thursday
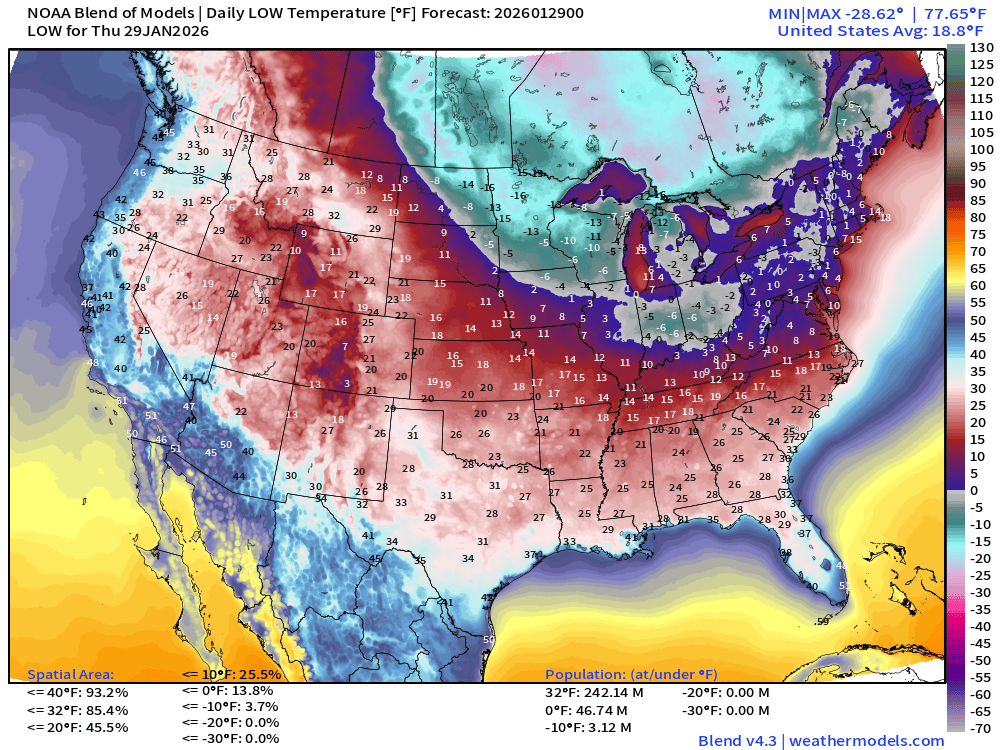
242 million below freeze — only average of 18.8°F
High Temperatures Thursday
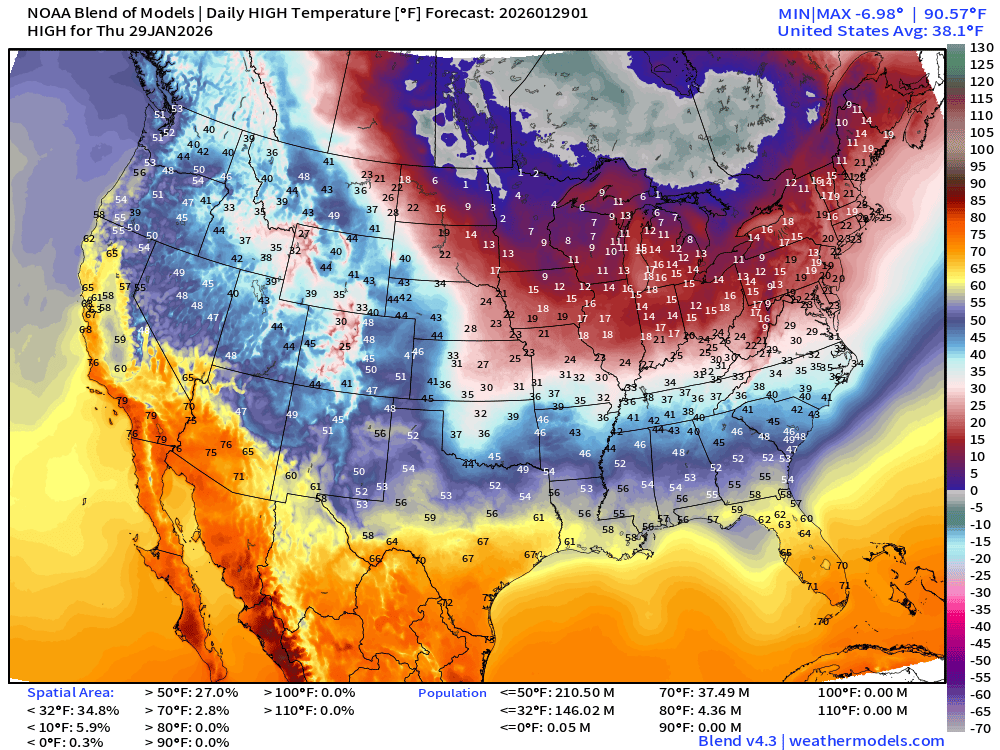
Still 146 million freezing during day, but warming continues across Texas and the South into the 40s and even 50s with sunshine. Now 37 million above 70°F with the Southwest nice and mild.
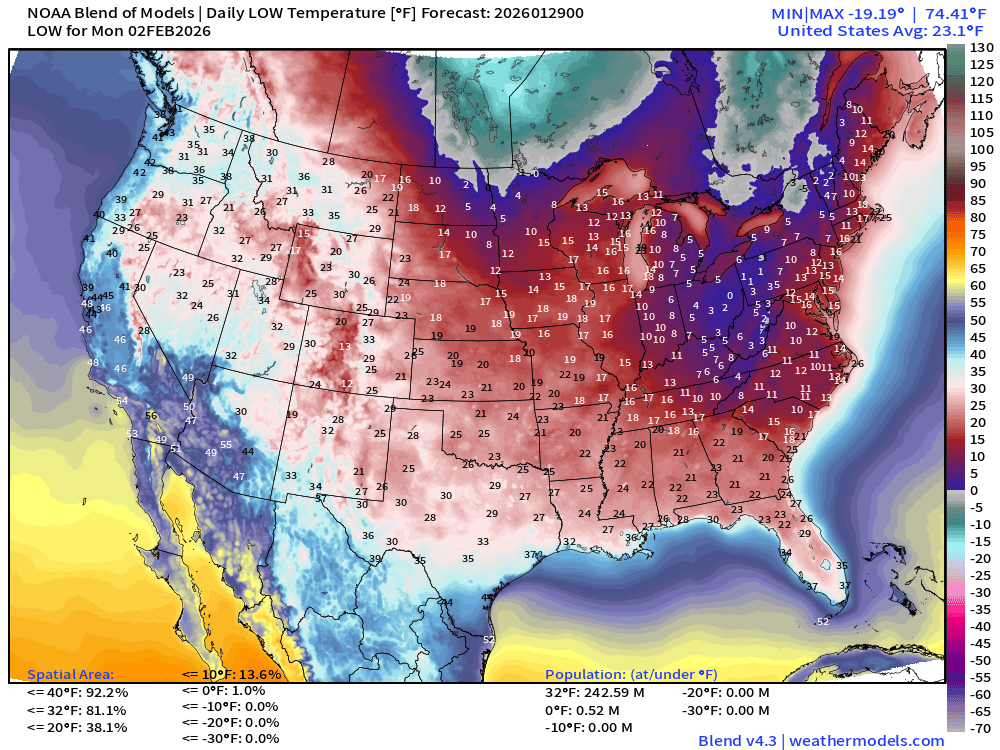
Record Lows for all of Florida Sun + Mon | Hard Freeze | Pipe Busting Cold
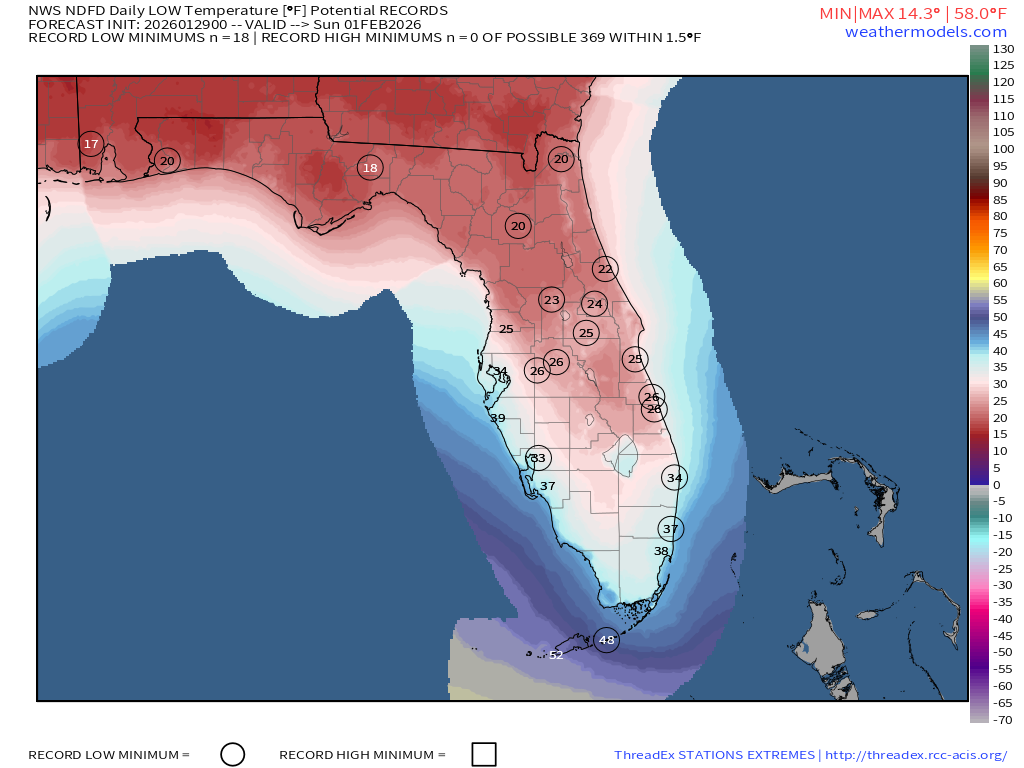
Sunday Morning Lows
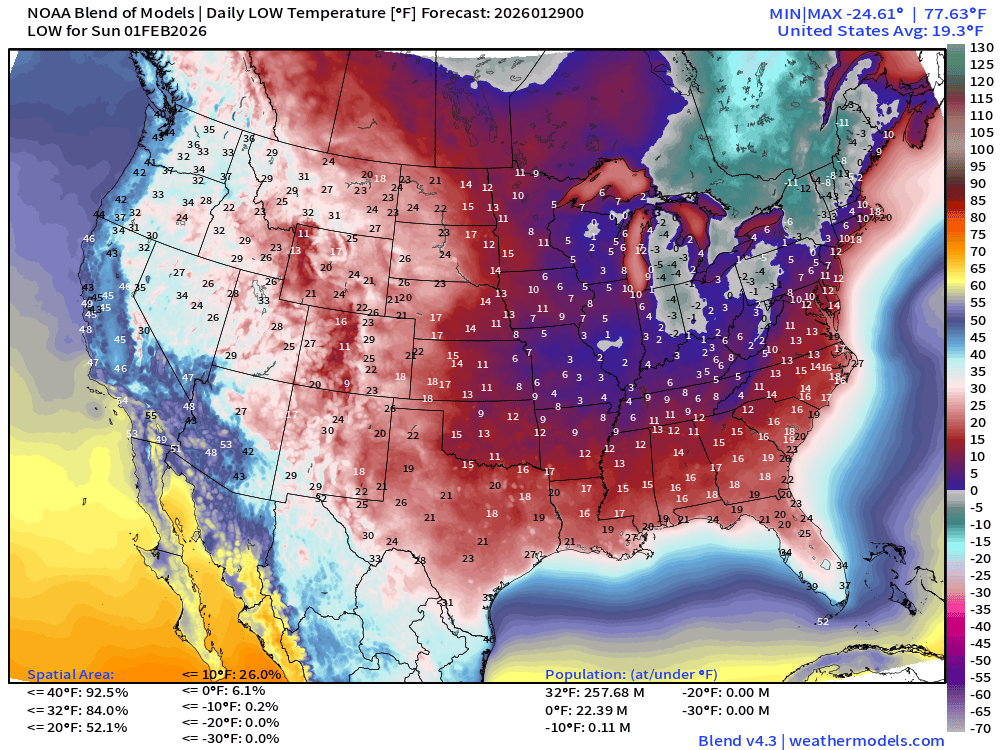
Monday Morning Lows
ECMWF IFS 18z | Precipitable Water Next 6-days
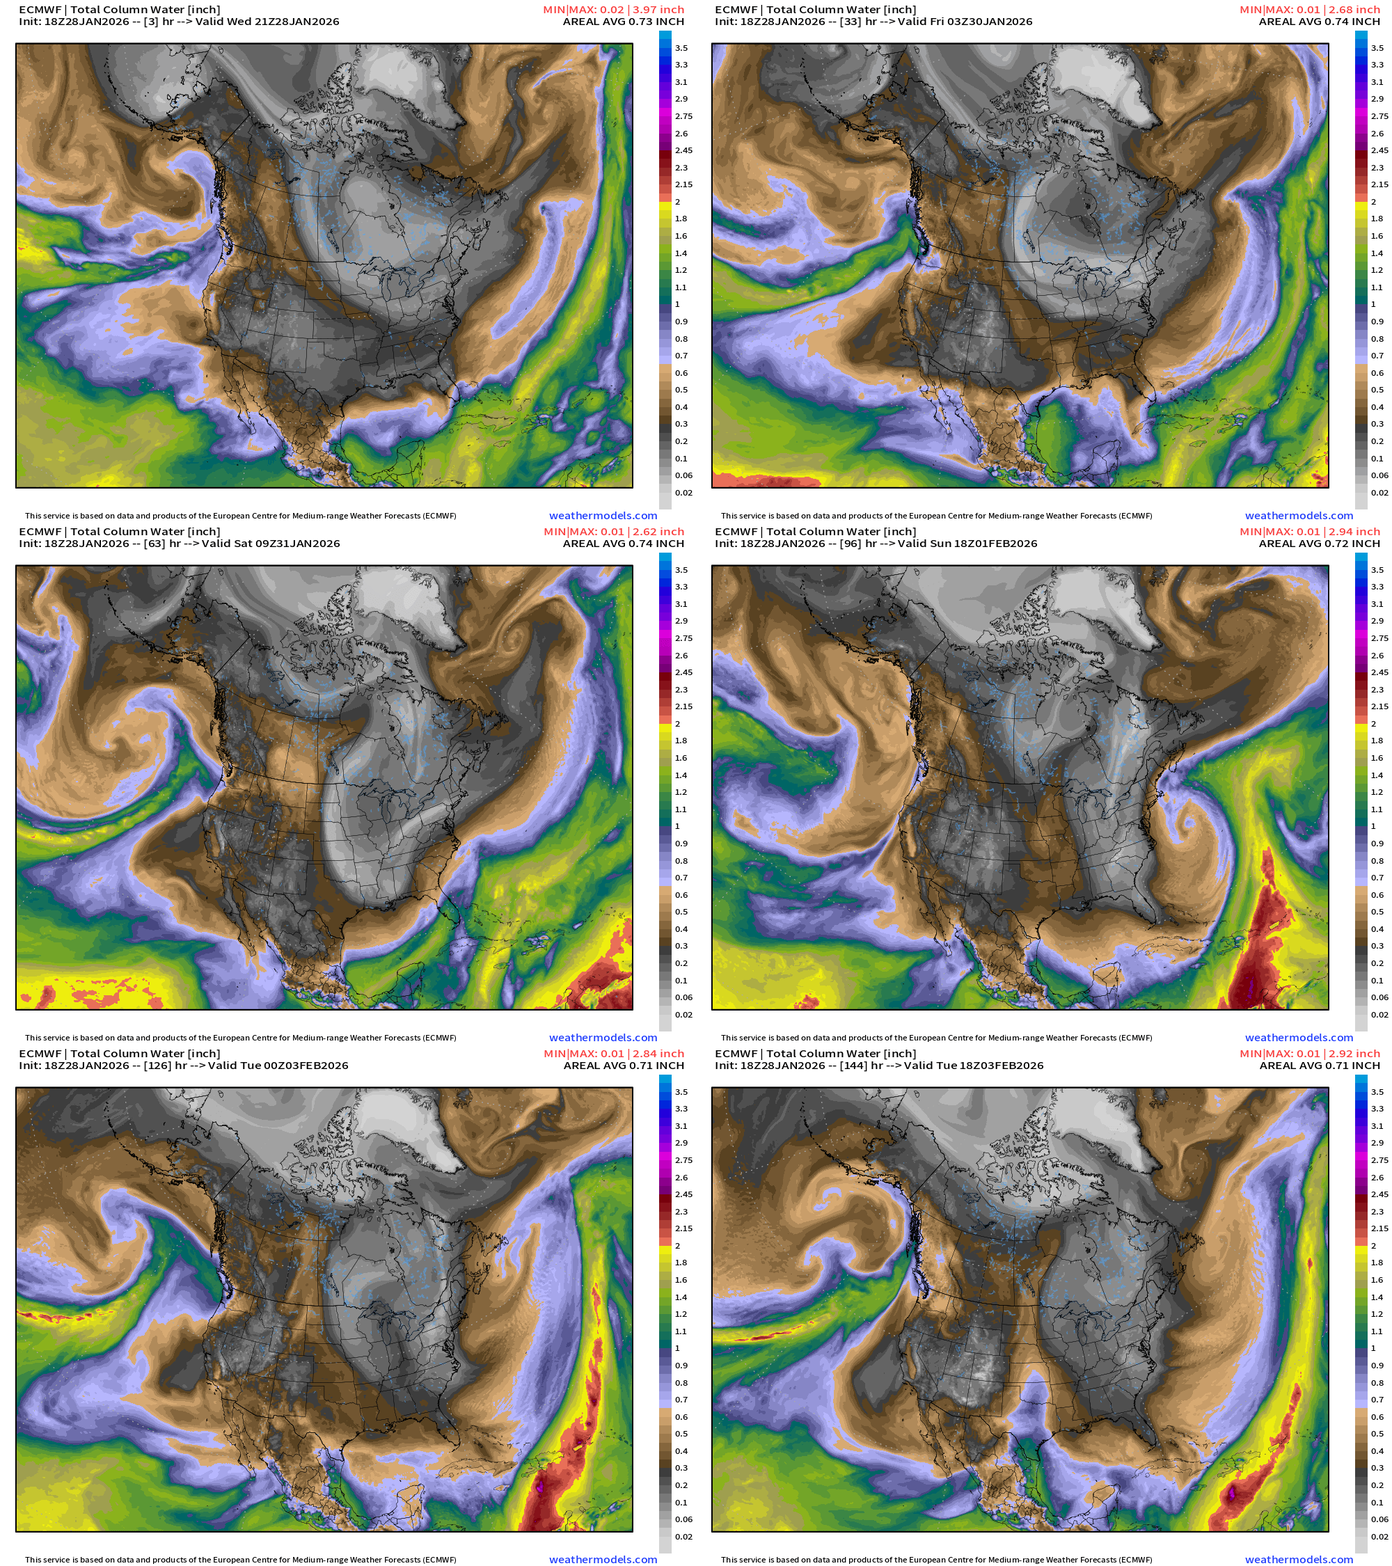
Moisture surges northward from the Gulf and Atlantic to fuel our “bomb cyclone” this weekend. Bone dry Arctic air mass “flushes” right through South Florida into Sunday with perhaps the perfect angle to bring a freeze quite far south into the Everglades.
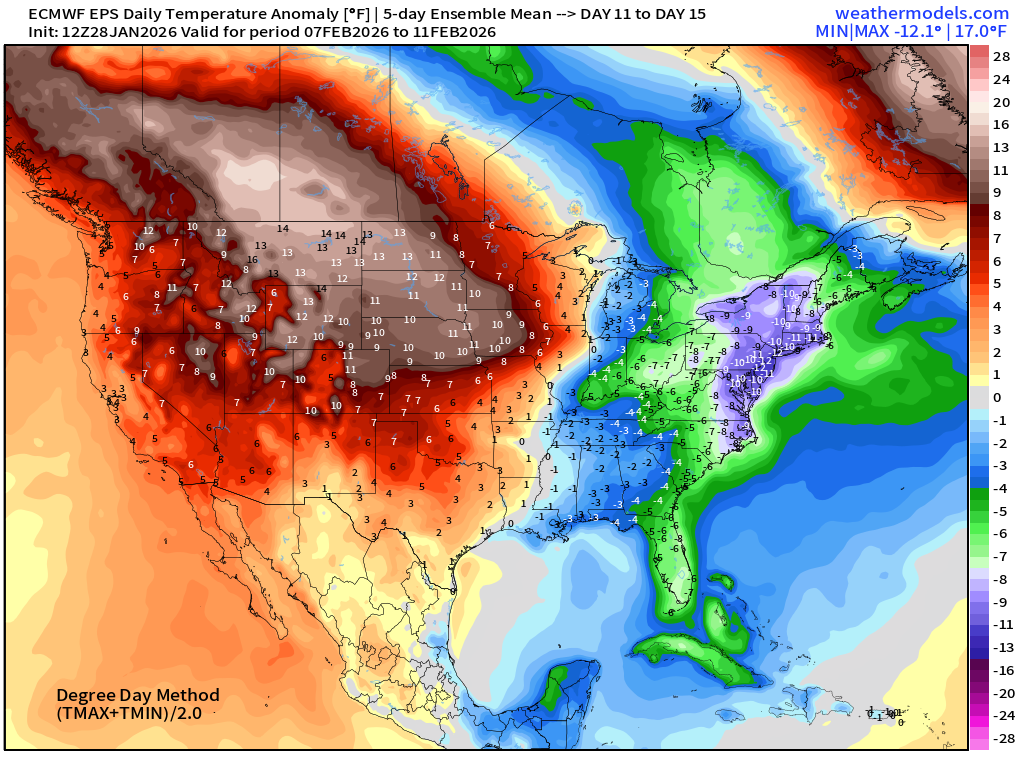
Flagship ECMWF 12z EPS | Temperature Anomaly | Next 15-days
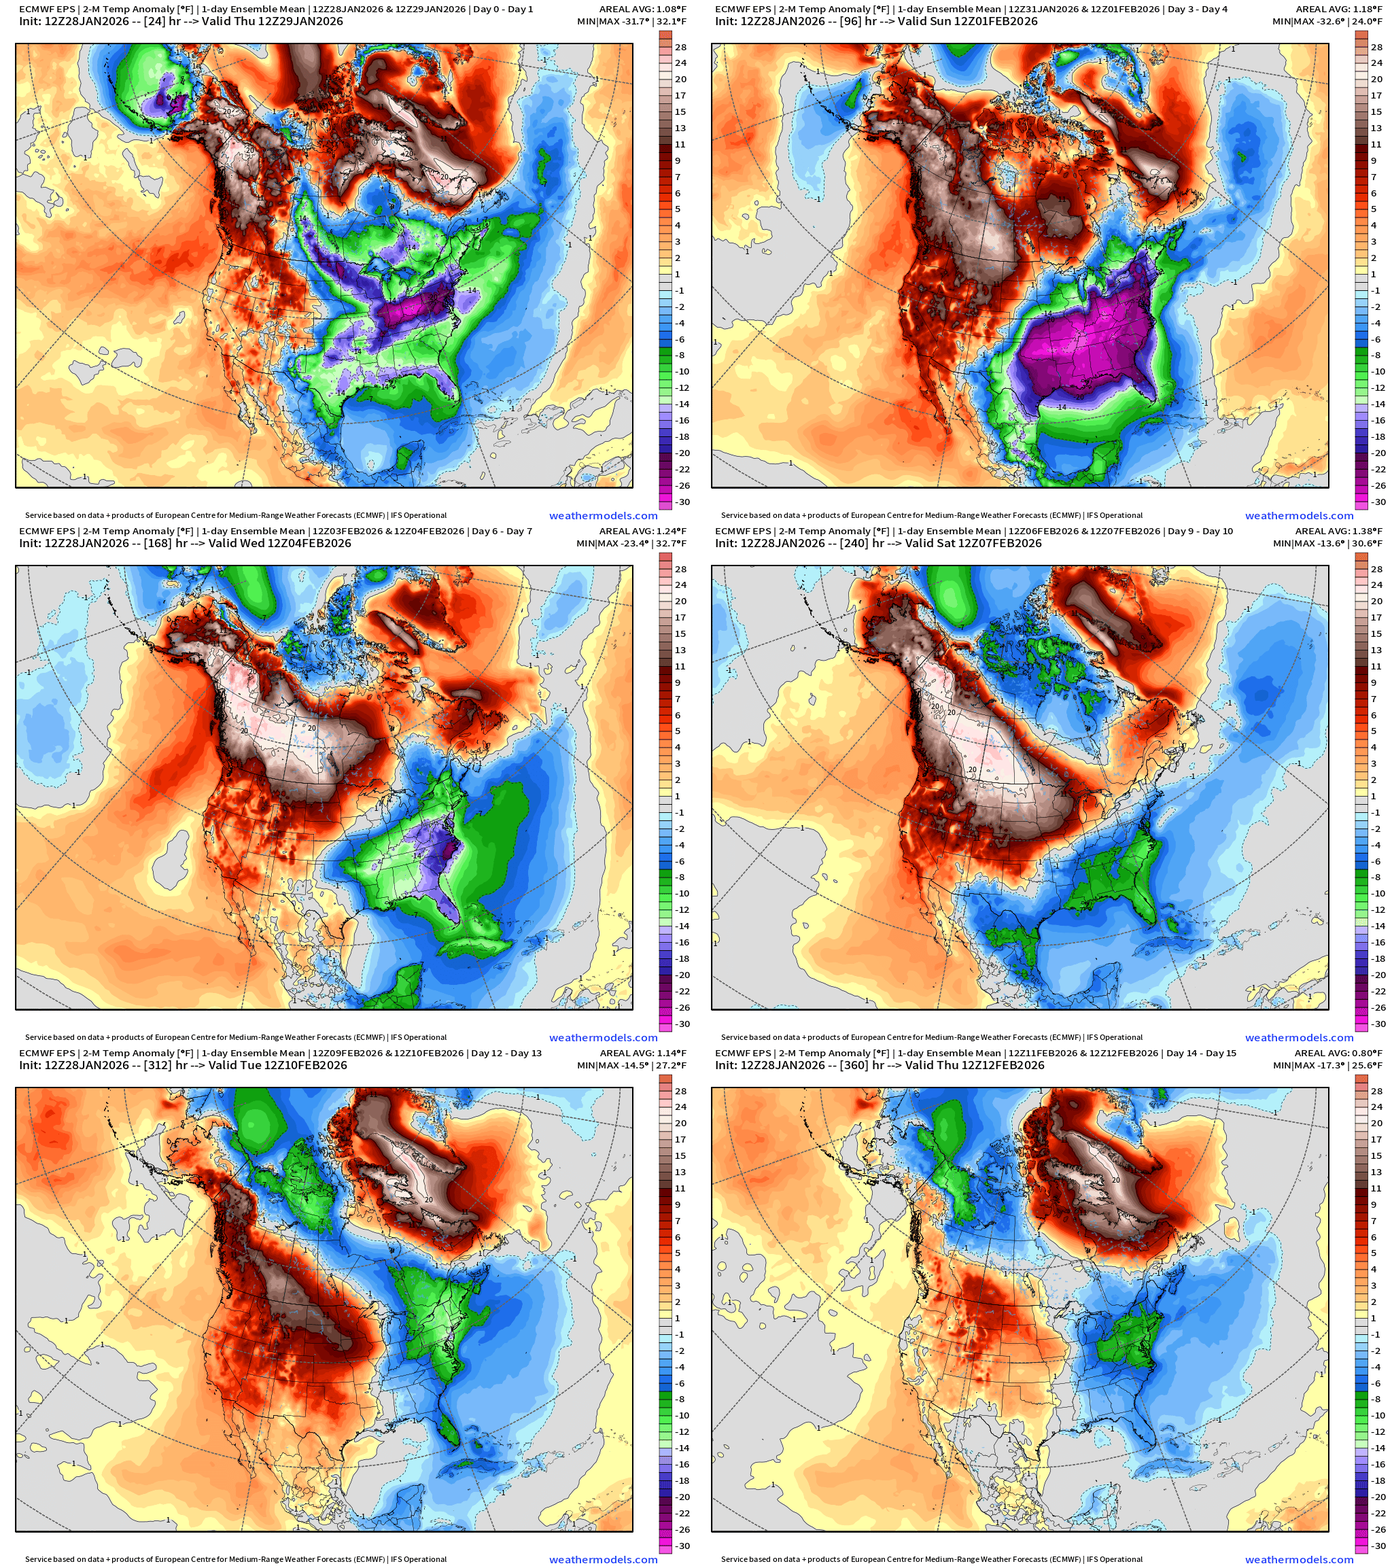
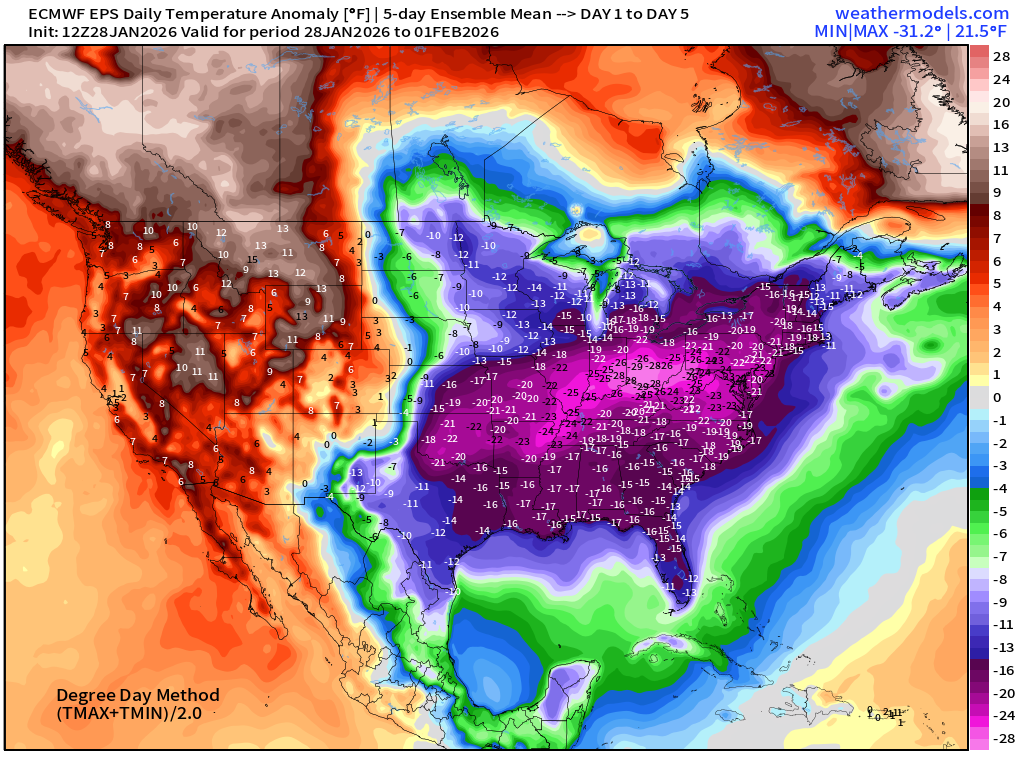
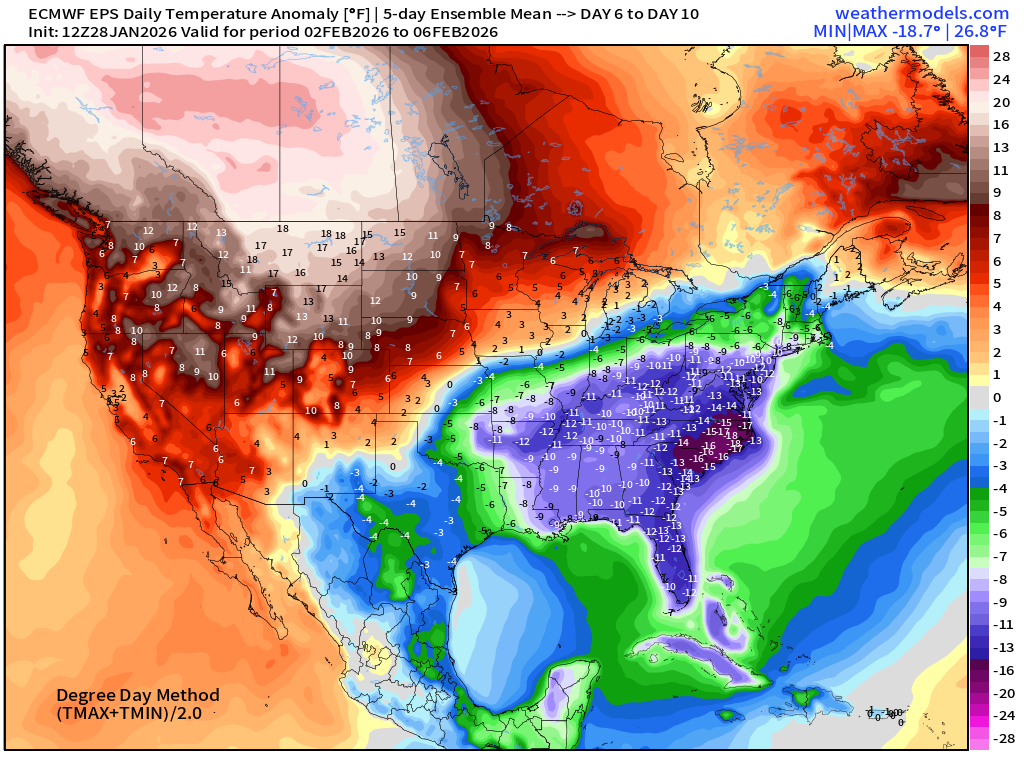
Below normal temperatures remain for all 15-days — decreasing intensity as the ensemble mean washed out — for the Mid-Atlantic and then Northeast.
ECMWF AIFS-Single 18z | Temperature (500 hPa) Next 15-days
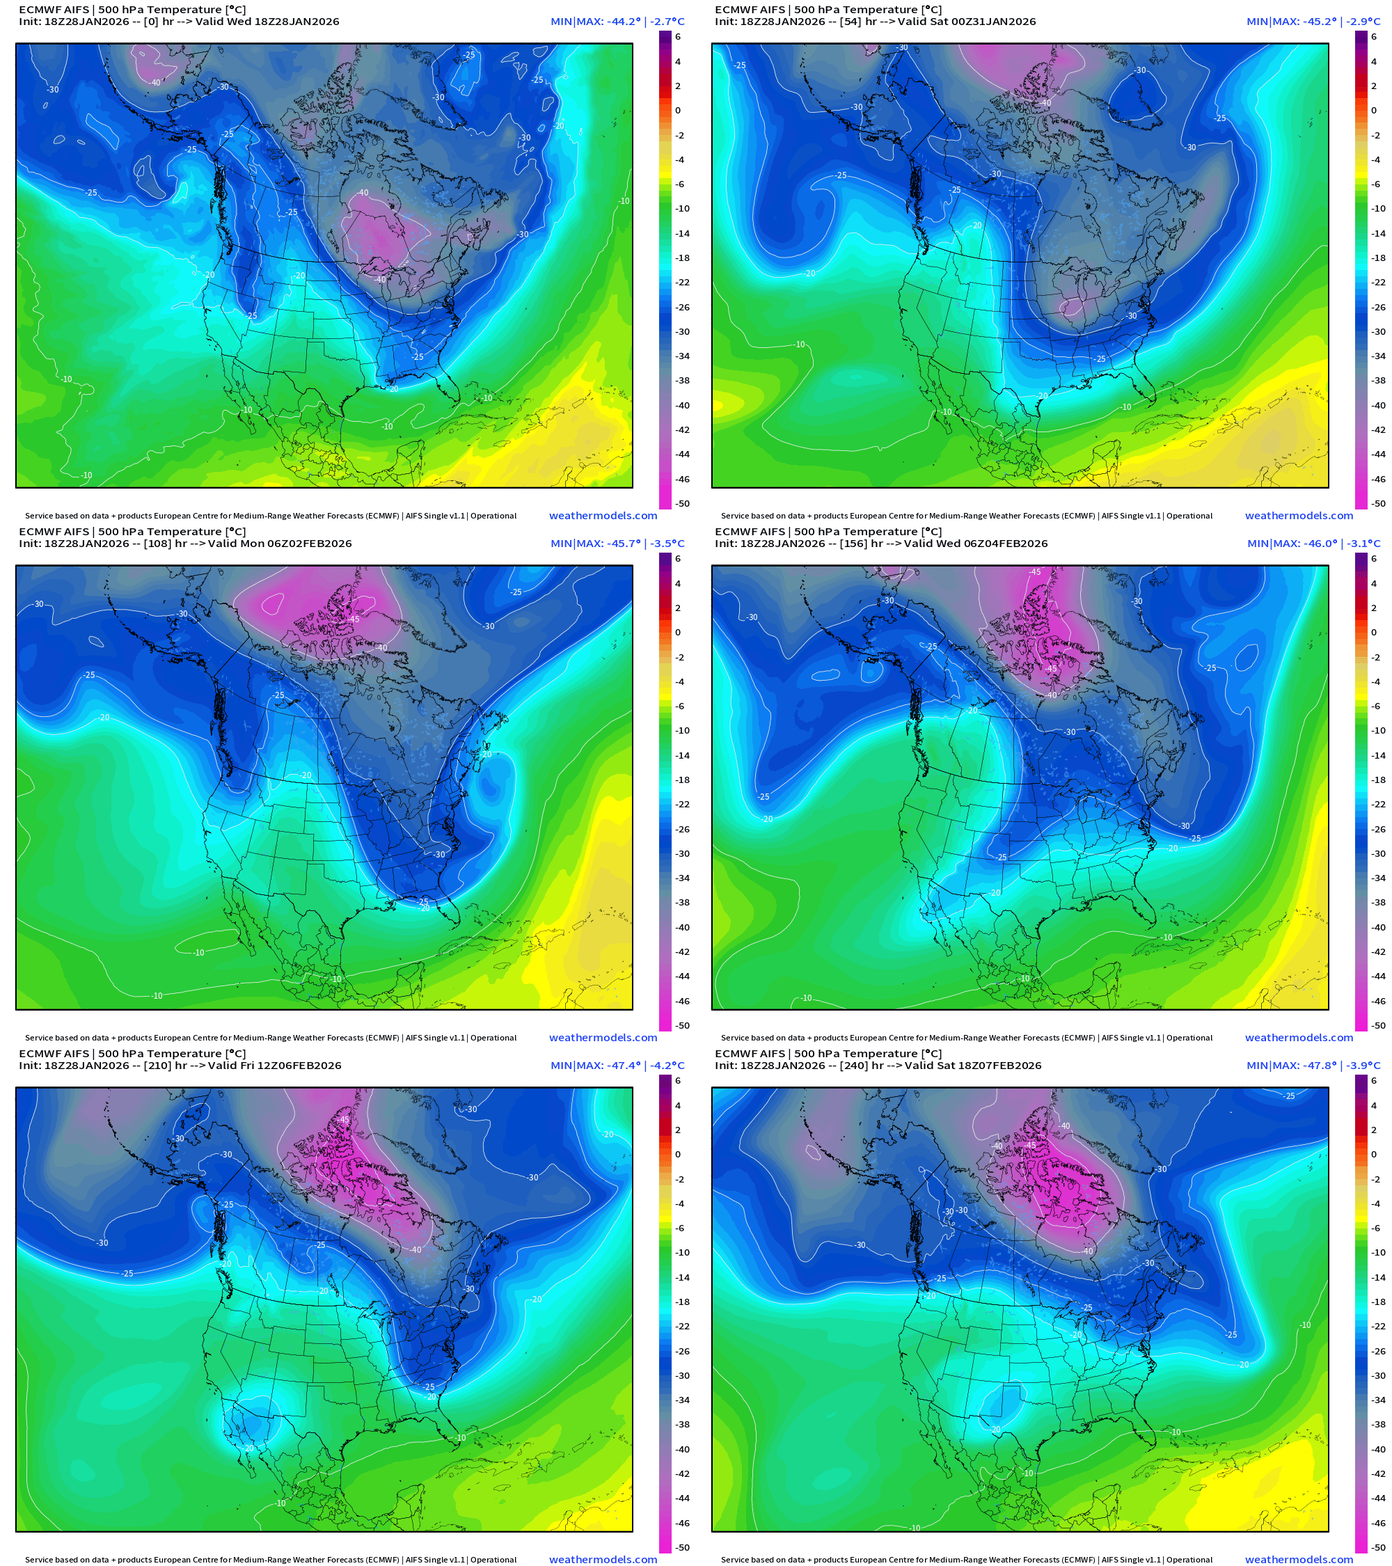
The temperature at 500 mb is the easiest way to highlight the “polar vortex” across North America with the coldest pool at -40°C (pink) with the -25°C contour usually associated with below freezing temperatures at 2-meters (surface).
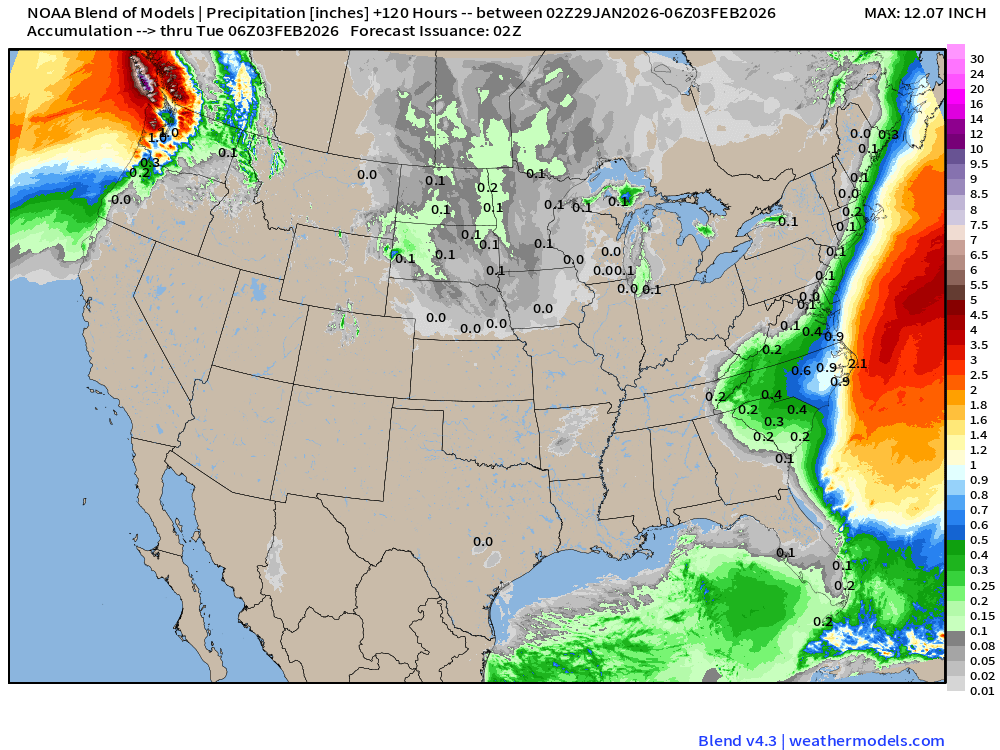
Blend of Models | 5 Days Precipitation Total
Blend of Models | Total Snowfall Next 5-Days
Temperature Anomaly | Next 15-days | ECMWF EPS 12z
5-Day Chunk #1 | Temperature Anomaly | Jan 28 - Feb 1
5-Day Chunk #2 | Temperature Anomaly | Feb 2 - Feb 6
5-Day Chunk #3 | Temperature Anomaly | Feb 7 - Feb 11
Maps sourced from weathermodels.com designed and innovated by yours truly! Please subscribe there for real-time access to the newest maps, charts from all of the weather models including ECMWF and AIFS, NOAA AI-GFS/AI-GEFS
- Milepost
- 853 · laid 2026-01-29T03:18:33.778000Z
- Source
- https://weather.substack.com/p/january-28-2026-wednesday-evening
- Digest
- 6924dc7c419ee7ccc12f26fcc7e128516774add3abf964cb1d75e3b439ac7ddb
- Machine
- JSON