January 23, 2026 Frigid 10-Days Ahead
Hazardous cold will blast into eastern half of Lower 48 and stay around all next week
January 2026 was the 25th-warmest January in the 132-year national record (1895–2026), at 33.1°F against a 1991–2020 normal of 32.3°F (+0.8°F).
January 2026 was the 12th-driest January in the 132-year national record (1895–2026), at 1.6in against a 1991–2020 normal of 2.3in (-0.8in).
NOAA/NCEI Climate at a Glance, contiguous United States. This is the observed record for the month, not a score of anything said in this piece — the forecast ledger begins 2026-08-17 and cannot reach earlier posts.

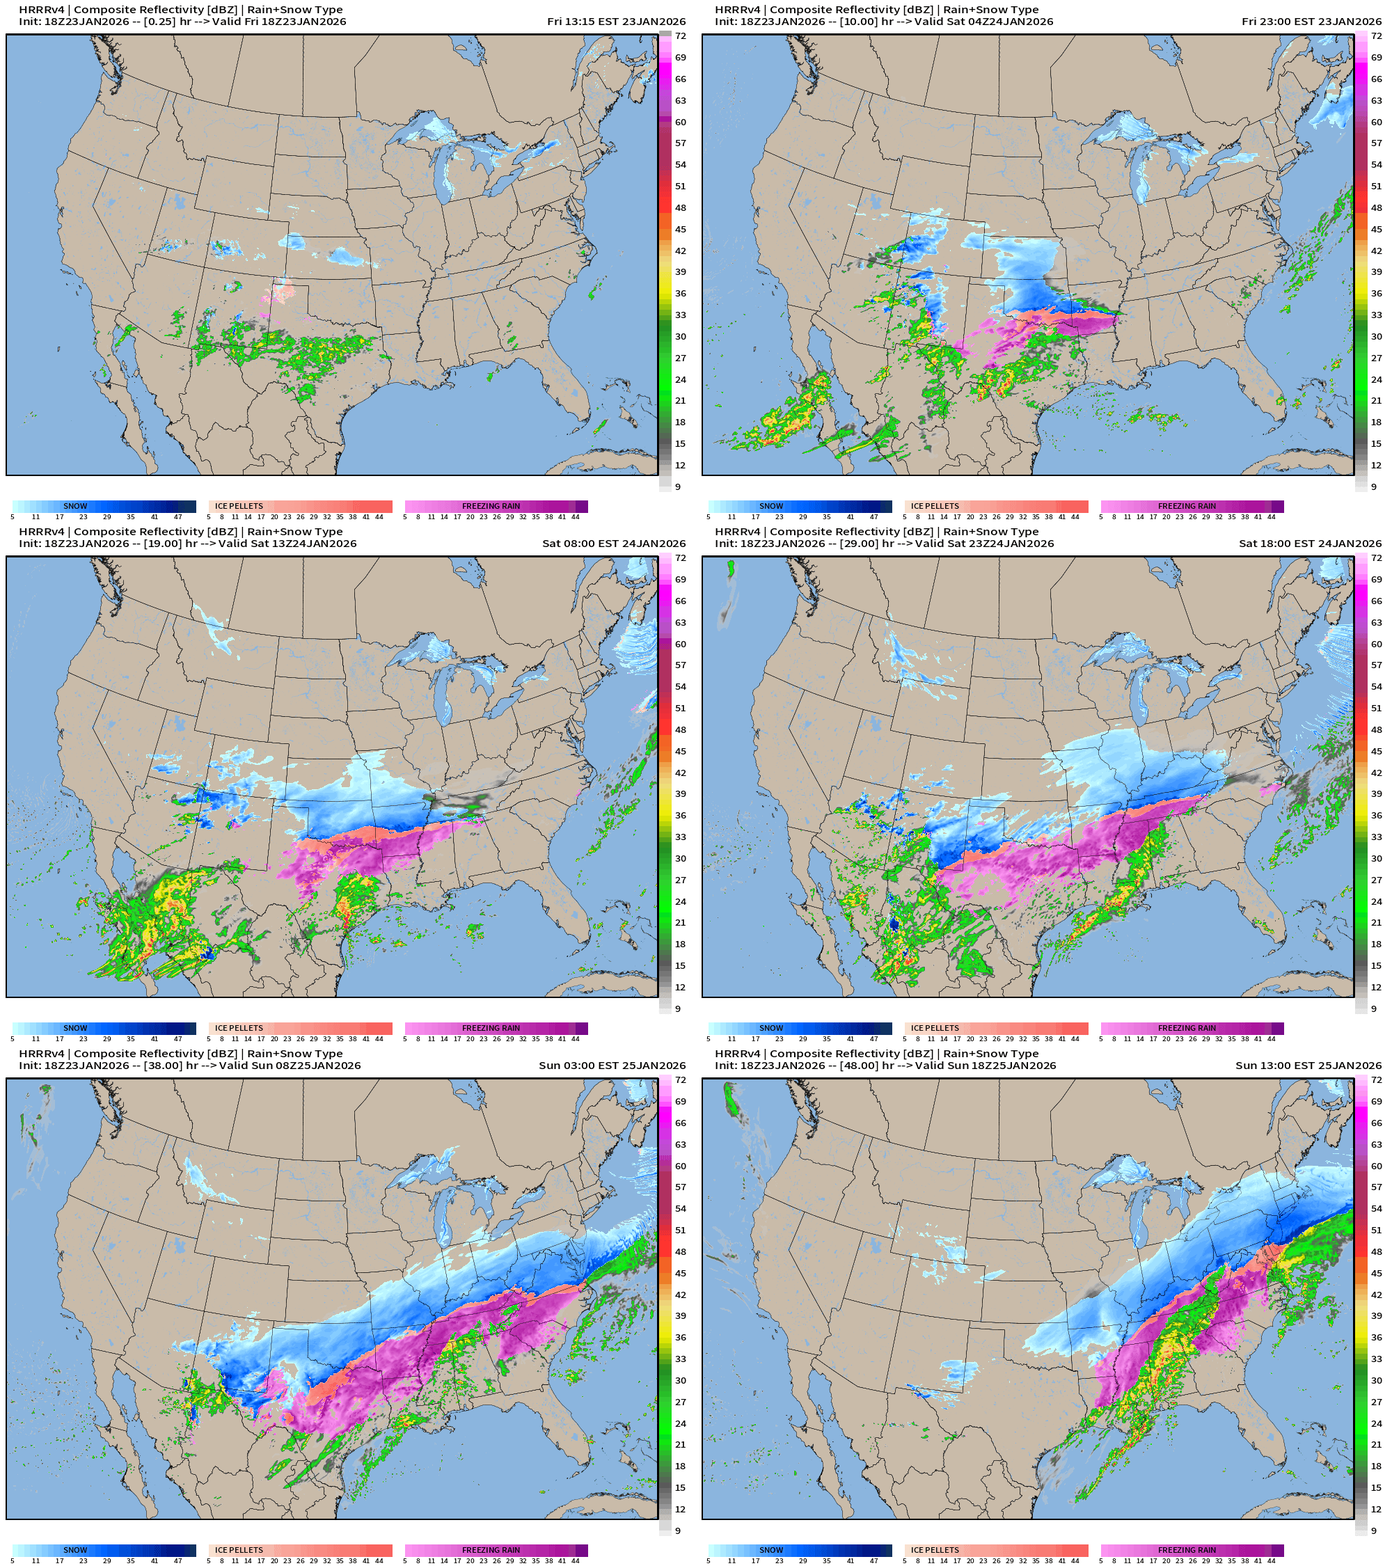
Next 48-hours simulated radar — the storm begins!
Hope everyone in the path of this massive winter storm escapes with minimal impacts, keeps their power, and can enjoy the weekend without worrying about recovery or damage. I won’t exhaustively cover the nuts and bolts — that’s a job best left for your local weather service office and TV meteorologists. However, I will provide an overview and see what’s coming next week — hint — it’s more cold.
AP: Forecasters warn of a ‘potentially catastrophic’ storm from Texas to the Carolinas
AP: FACT FOCUS: As cold hits, Trump asks, where’s global warming? Scientists say it’s still here
AP: Meteorologists blame a stretched polar vortex, moisture, lack of sea ice for dangerous winter blast
The Atlantic: Winter Ice Could Humble the United States by Nancy Welecki
National Weather Service Snowfall Pieced Together from individual offices
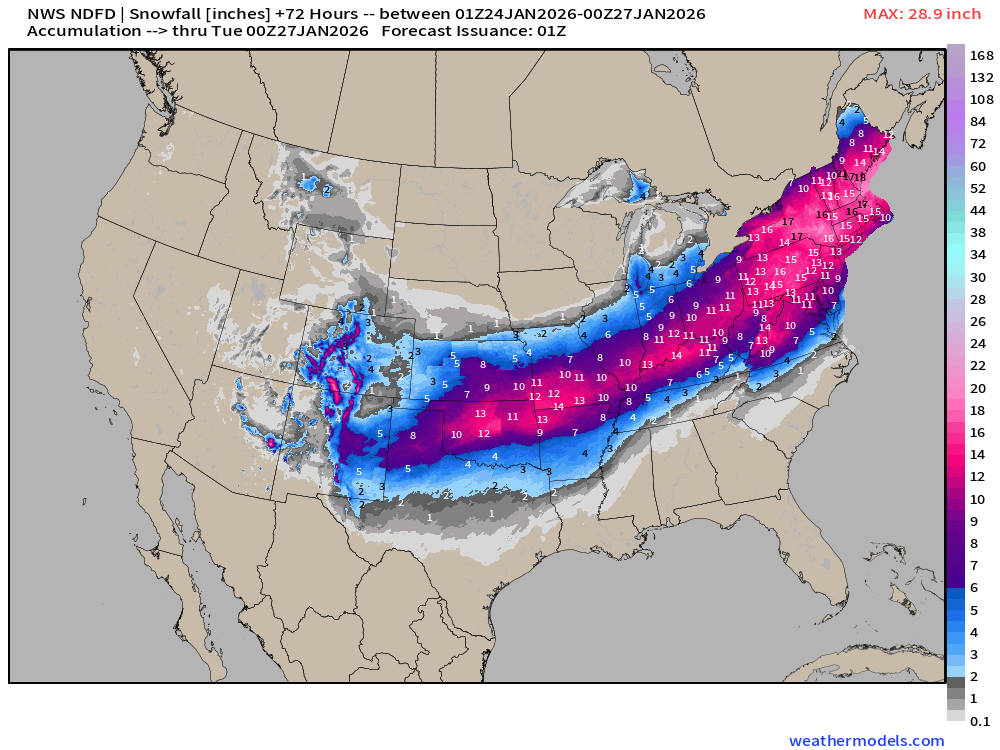
Very nice coordination among the individual offices. This is where the rubber meets the road when the humans behind the keyboards and screens put their expertise and experience to work — and publish actionable forecasts for the United States.
Zooms — I think New England will outperform
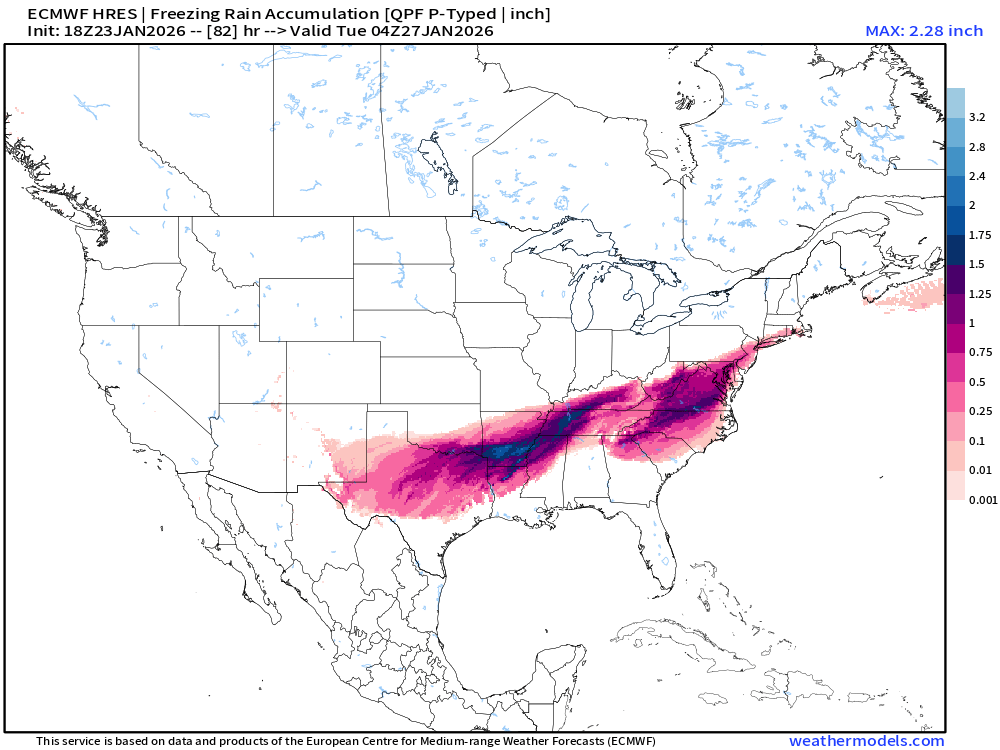
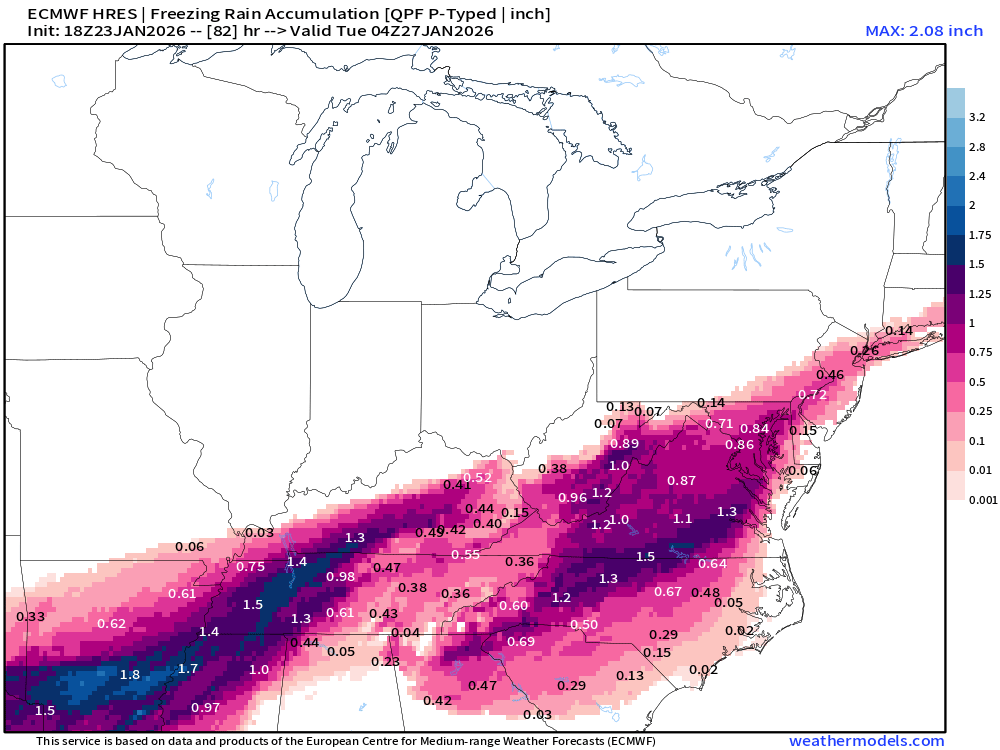
Ice Accumulations are going to be extremely damaging centered upon NE Louisiana and northern Mississippi with 1.5” maximum accumulations
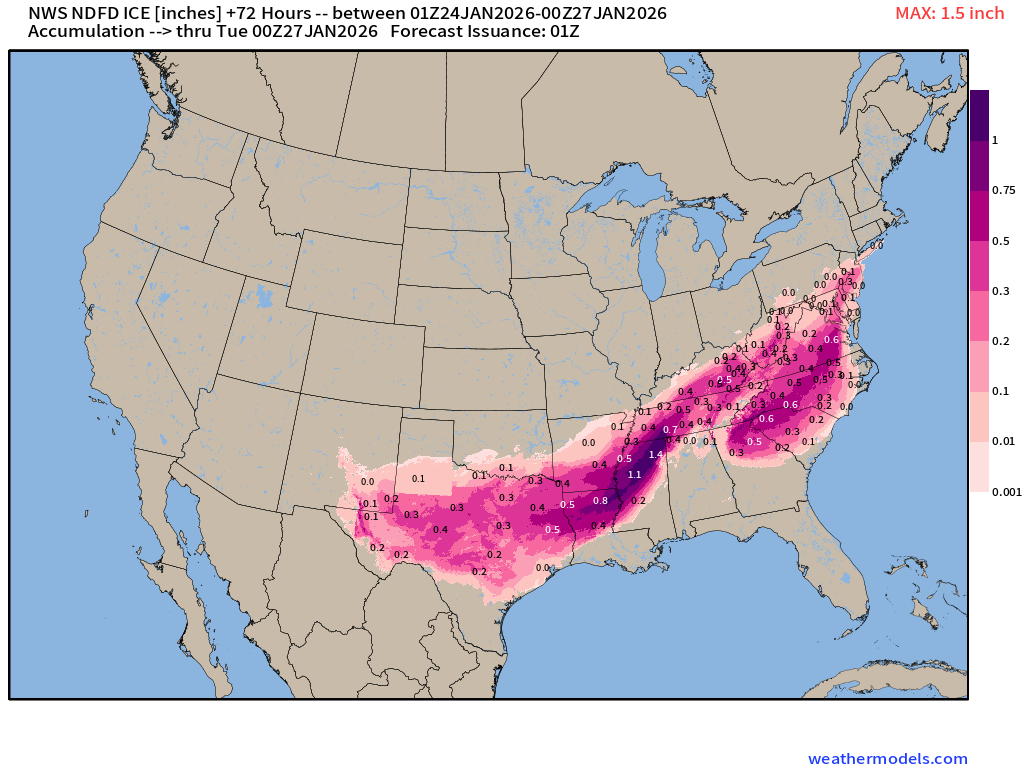
Atlanta is under an “ice storm” warning but hopefully the “warm nose” arrives and melts in on Sunday — I think many locations will be saved from “entombment” in ice for a long period by heavy rainfall arriving after the ice with the warm sector of the storm system.
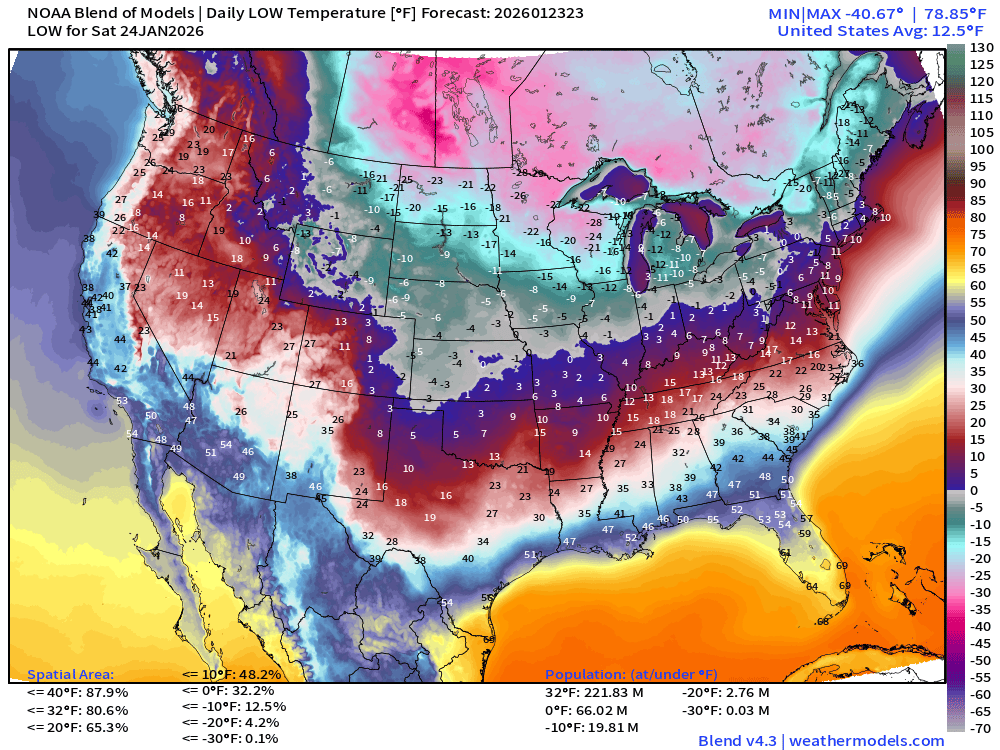
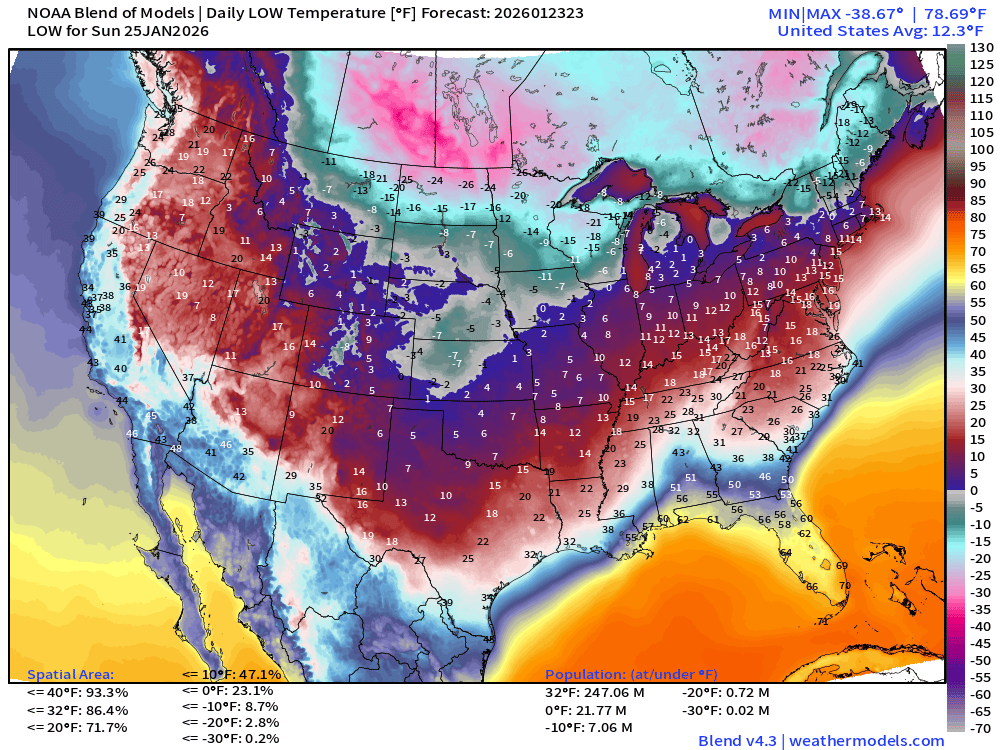
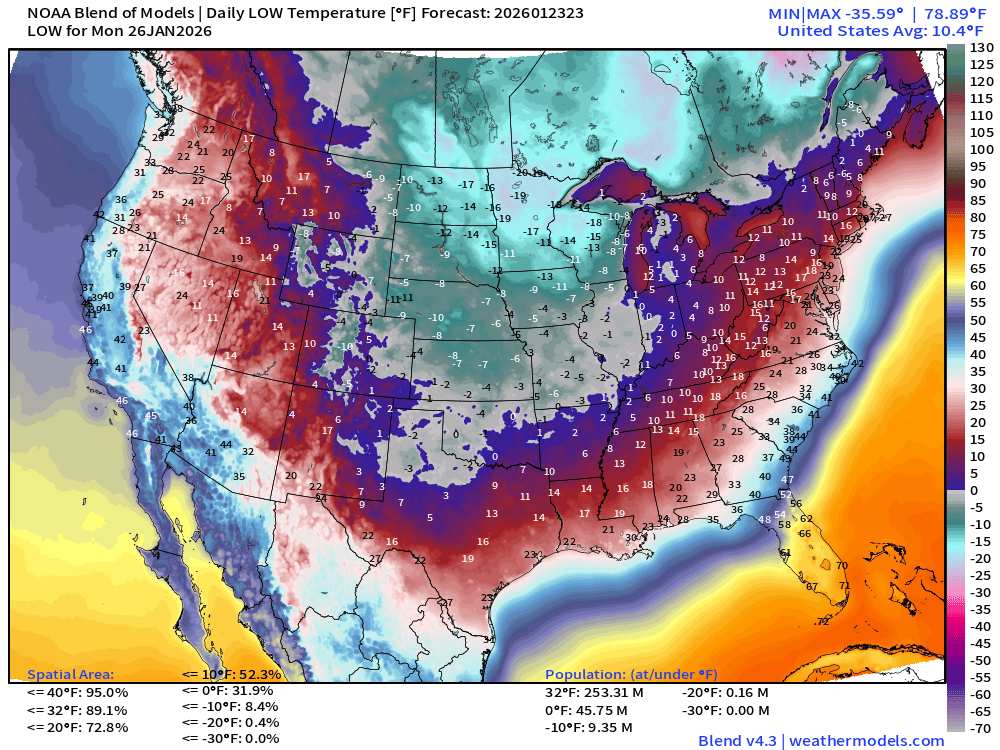
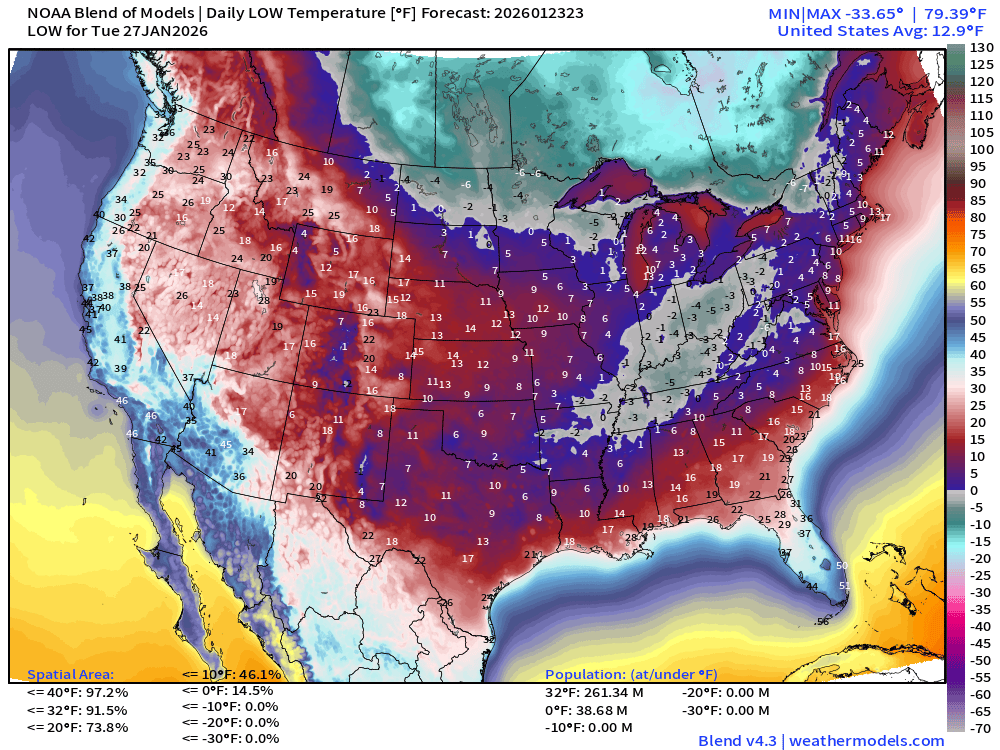
Lower 48 | Low Temperatures Next 8-days
The Blend of Models shows the coldest day at 10.6°F for national minimum Monday.
Not seeing much improvement through next Sunday with 80-90%+ of the Lower 48 remaining below freezing
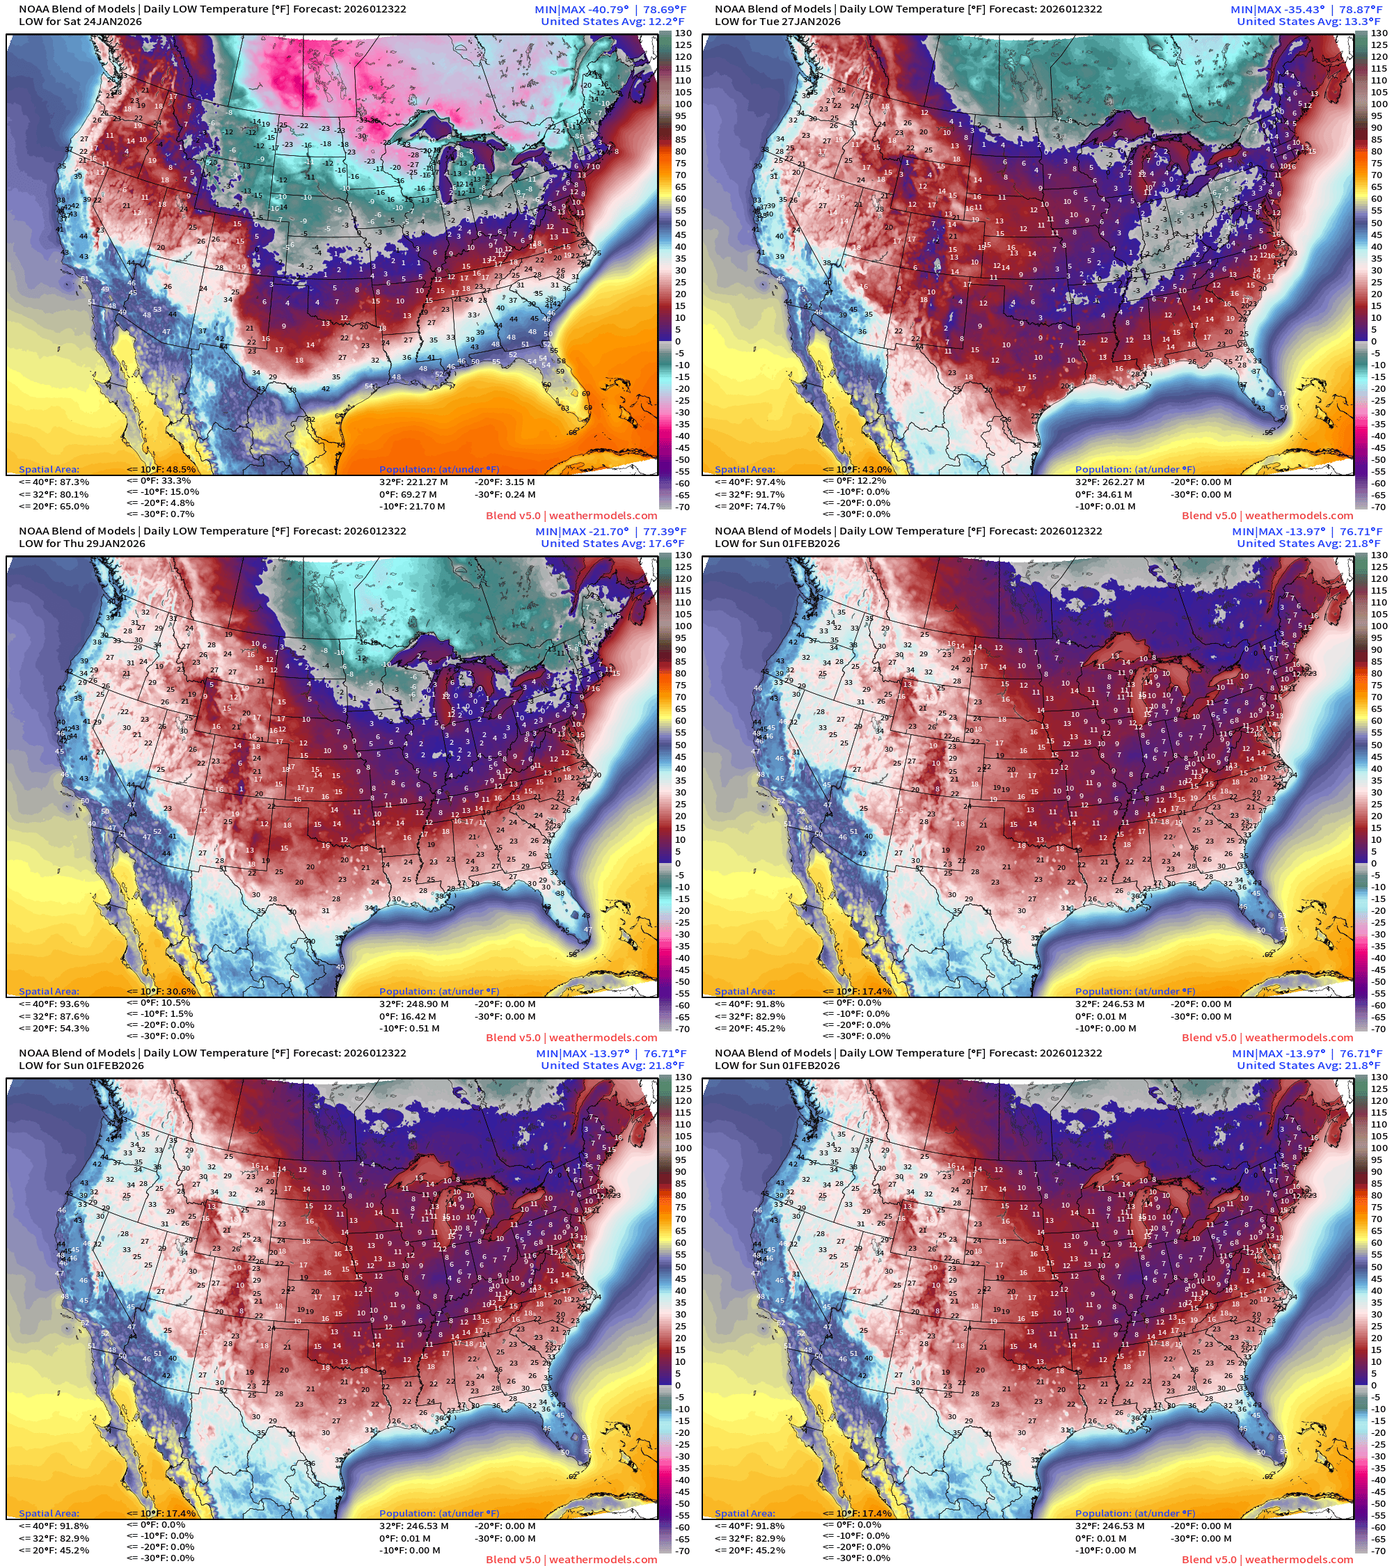
Low Temperatures Saturday | 66 million below zero + 222M below freezing
Low Temperatures Sunday: 22M below zero, 247M below freezing
Low Temperatures Monday: 253M below freezing, more again below zero: 46M
10.4°F Lower 48 average minimum —> except for Florida, it would be much lower.
Low Temperatures Tuesday: 261M below freezing — so even more, and 39M below 0°F … can’t say there’s much improvement!
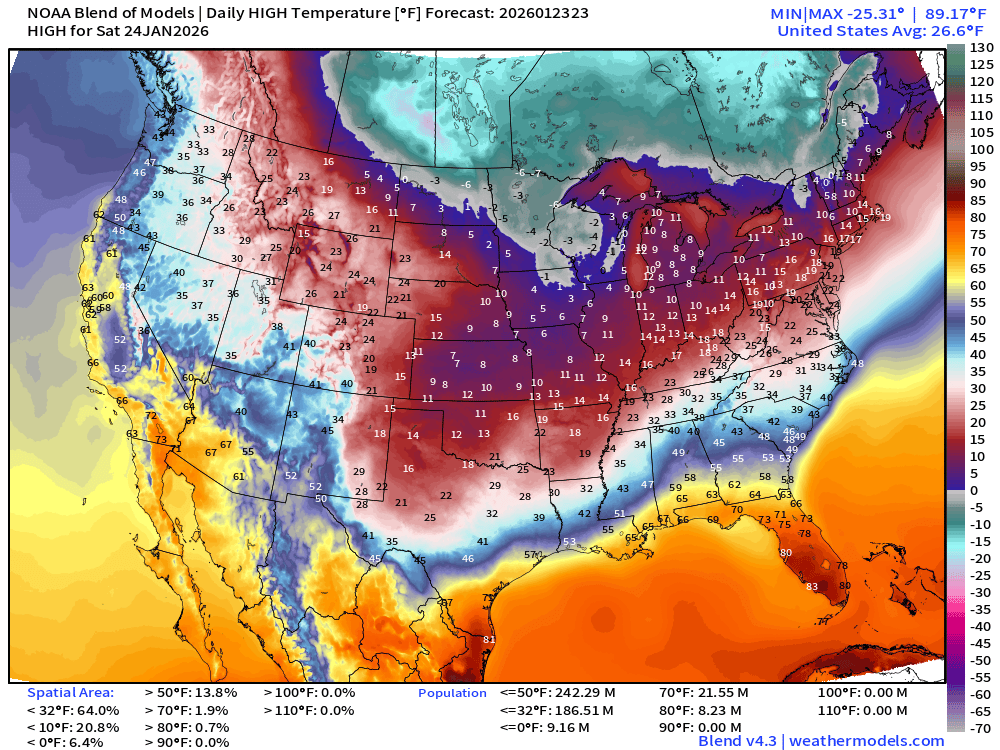
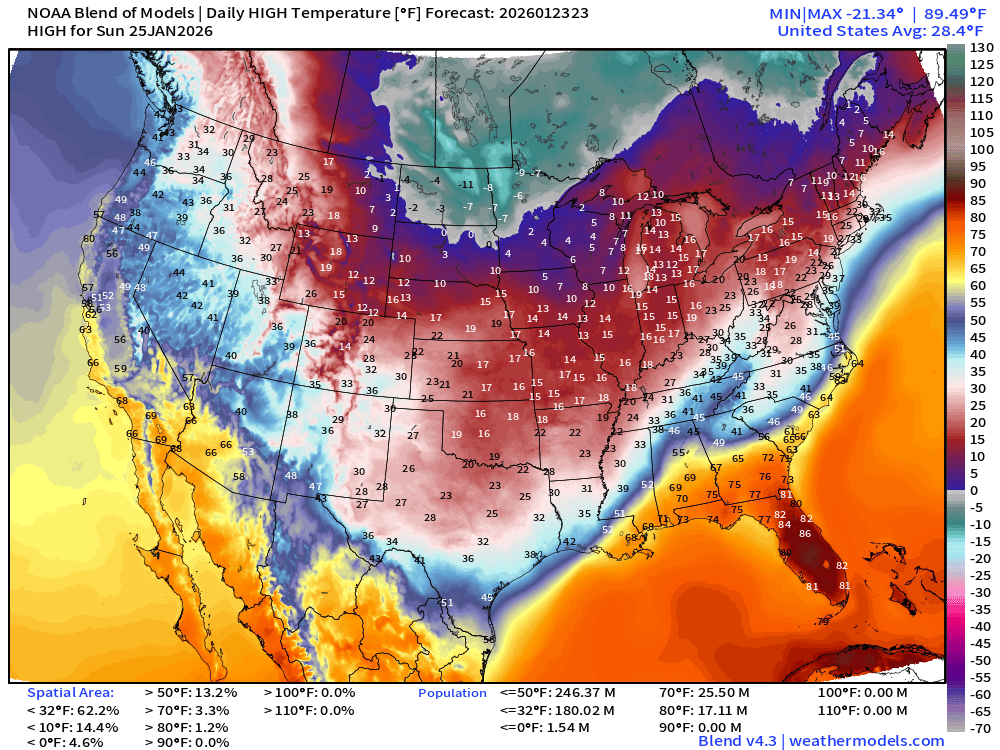
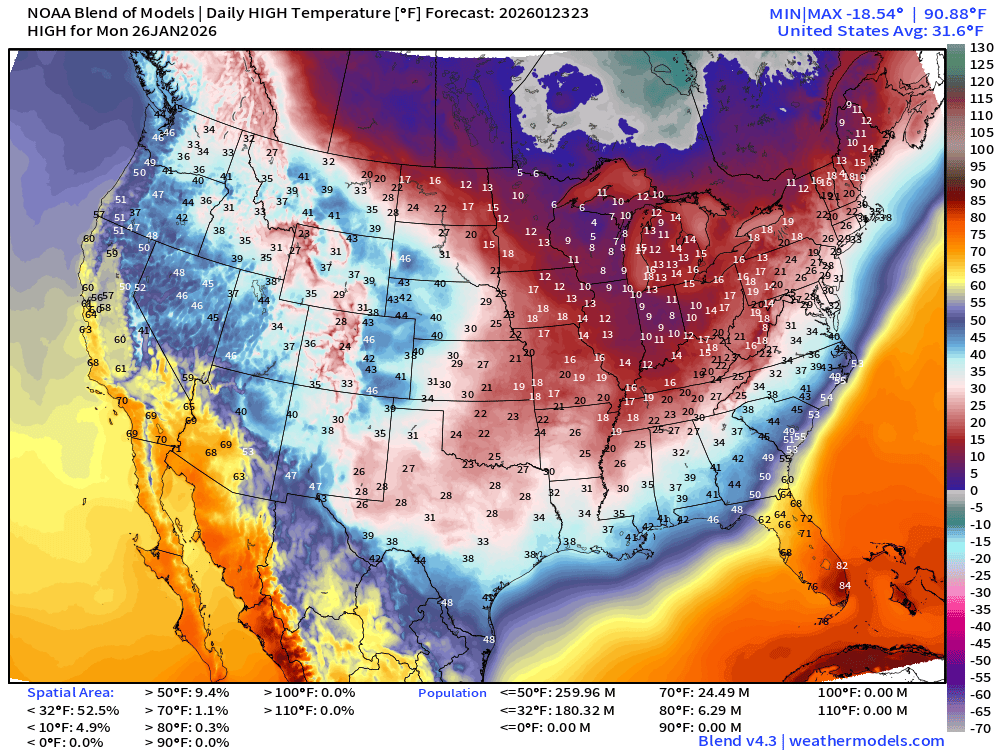
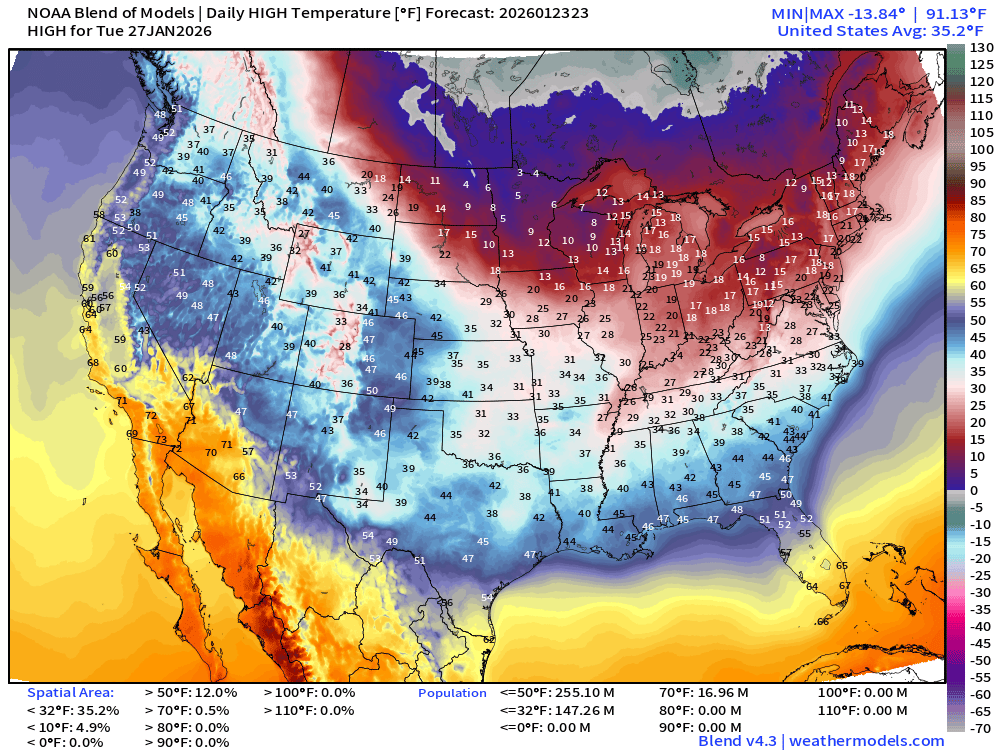
High Temperatures Next 4-days | Saturday Sunday Monday Tuesday
Saturday: 186 million remain below freezing and even 9 million below zero.
Sunday: a little warmer but still 180 million below freezing
Monday: the same 180 million below freezing. Not quite a thaw yet in much of Texas but getting there
Tuesday Thaw gets underway but we’ll see how long that lasts!
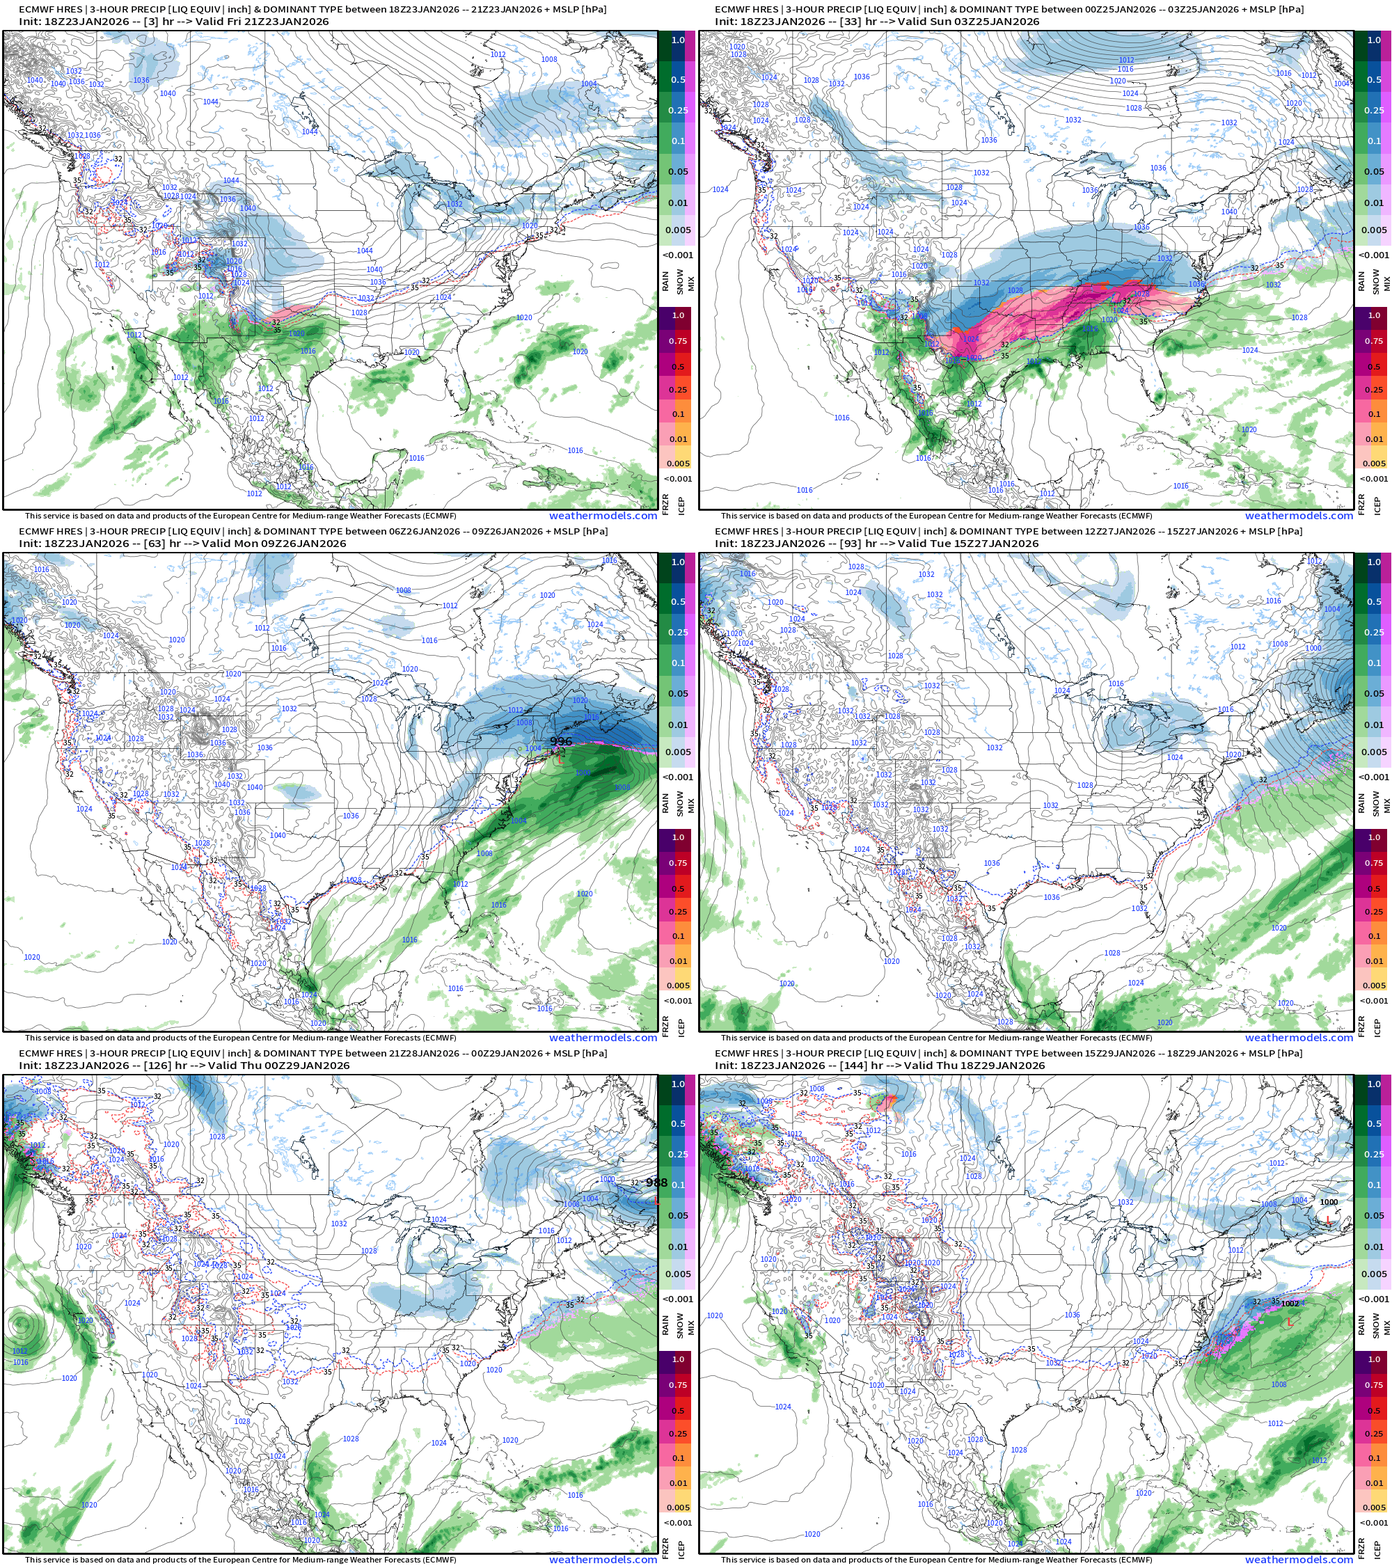
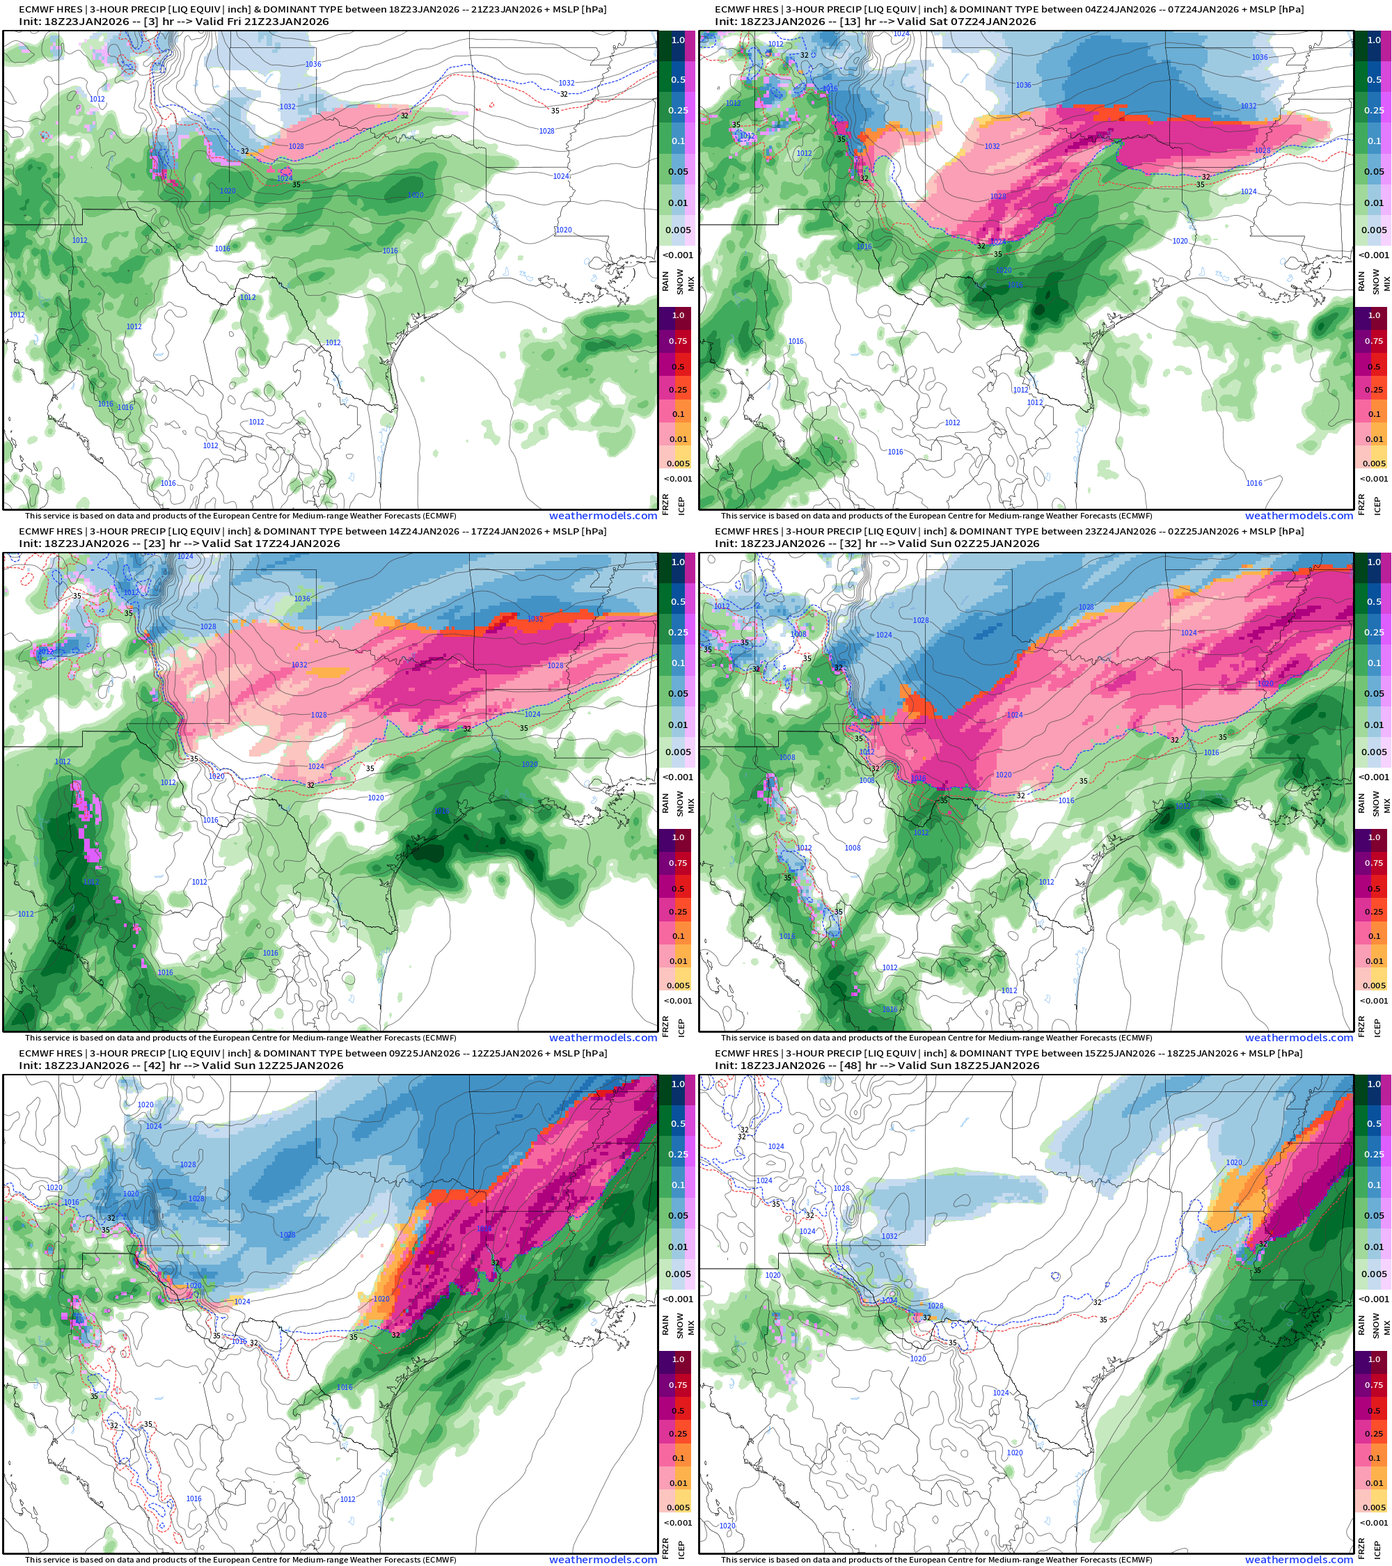
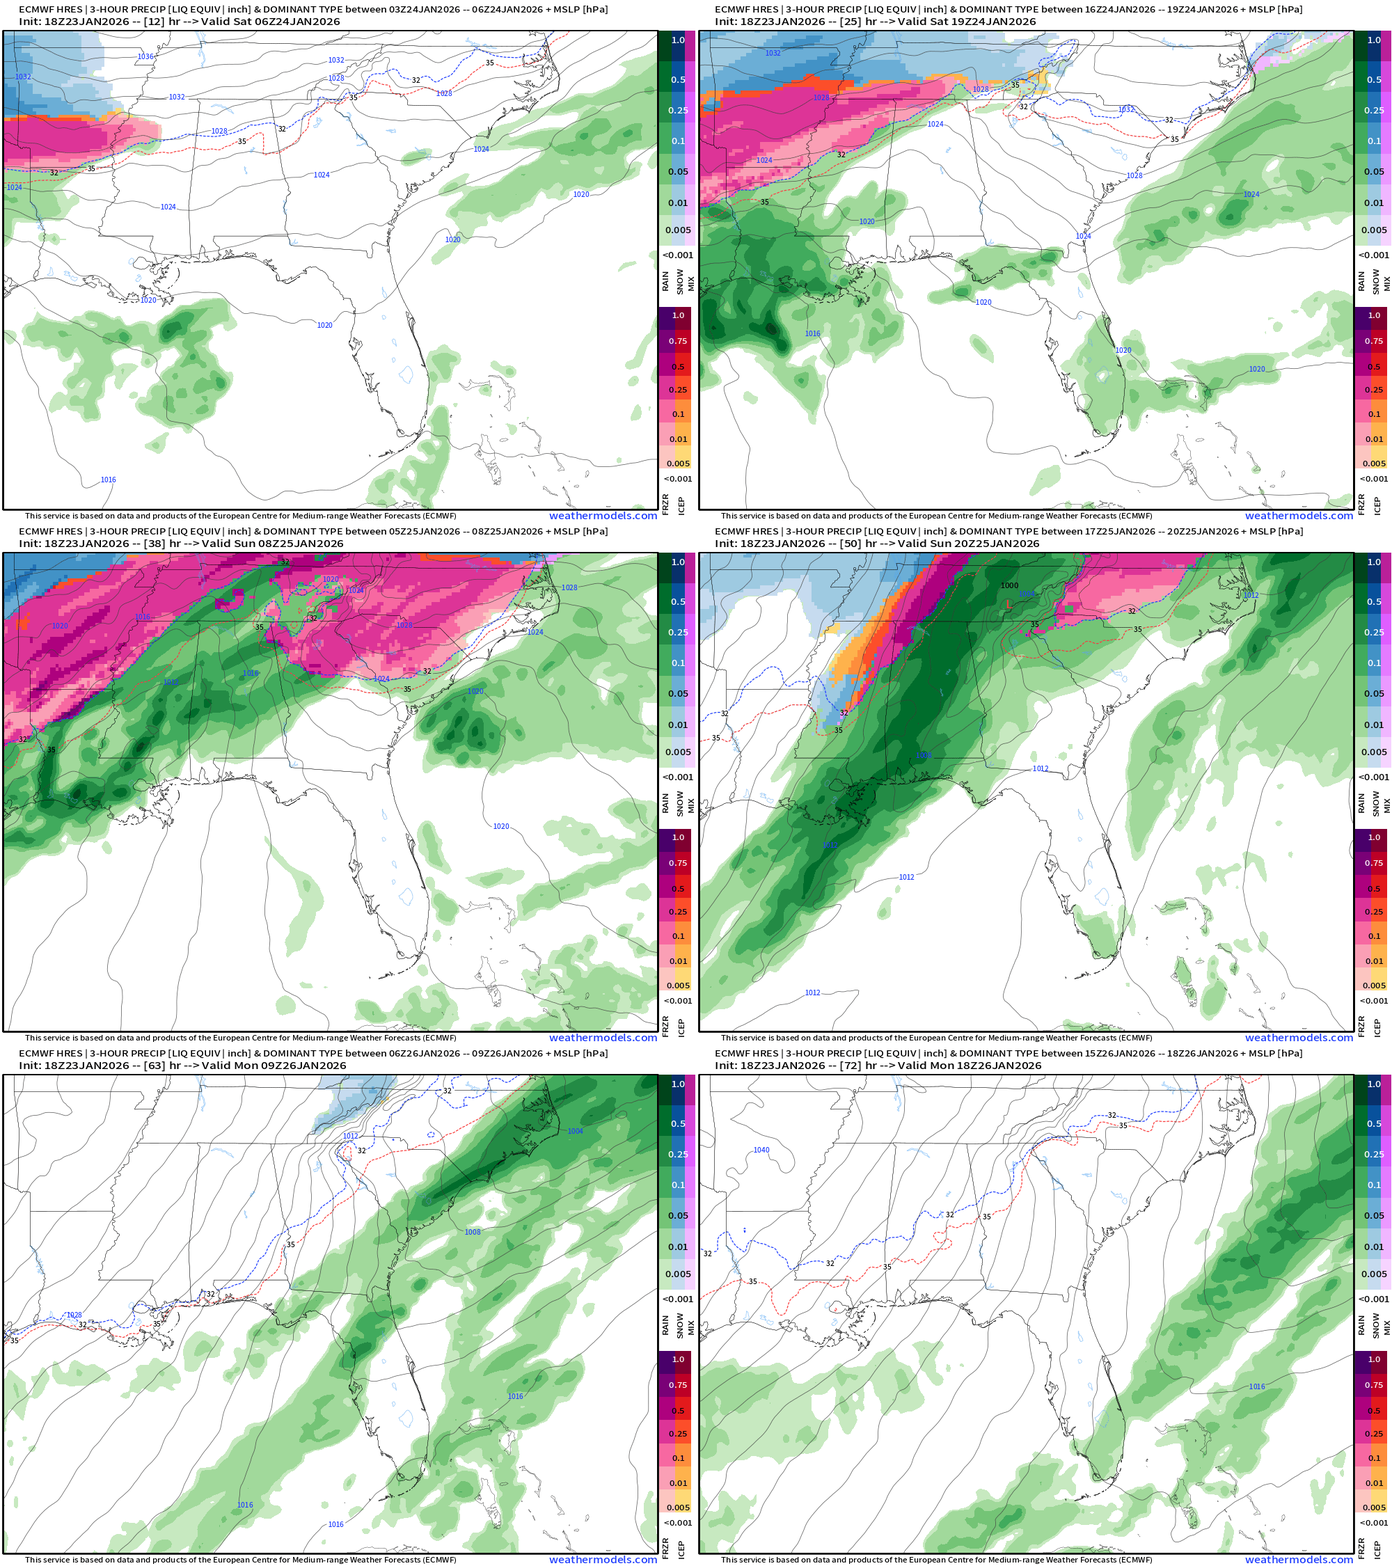
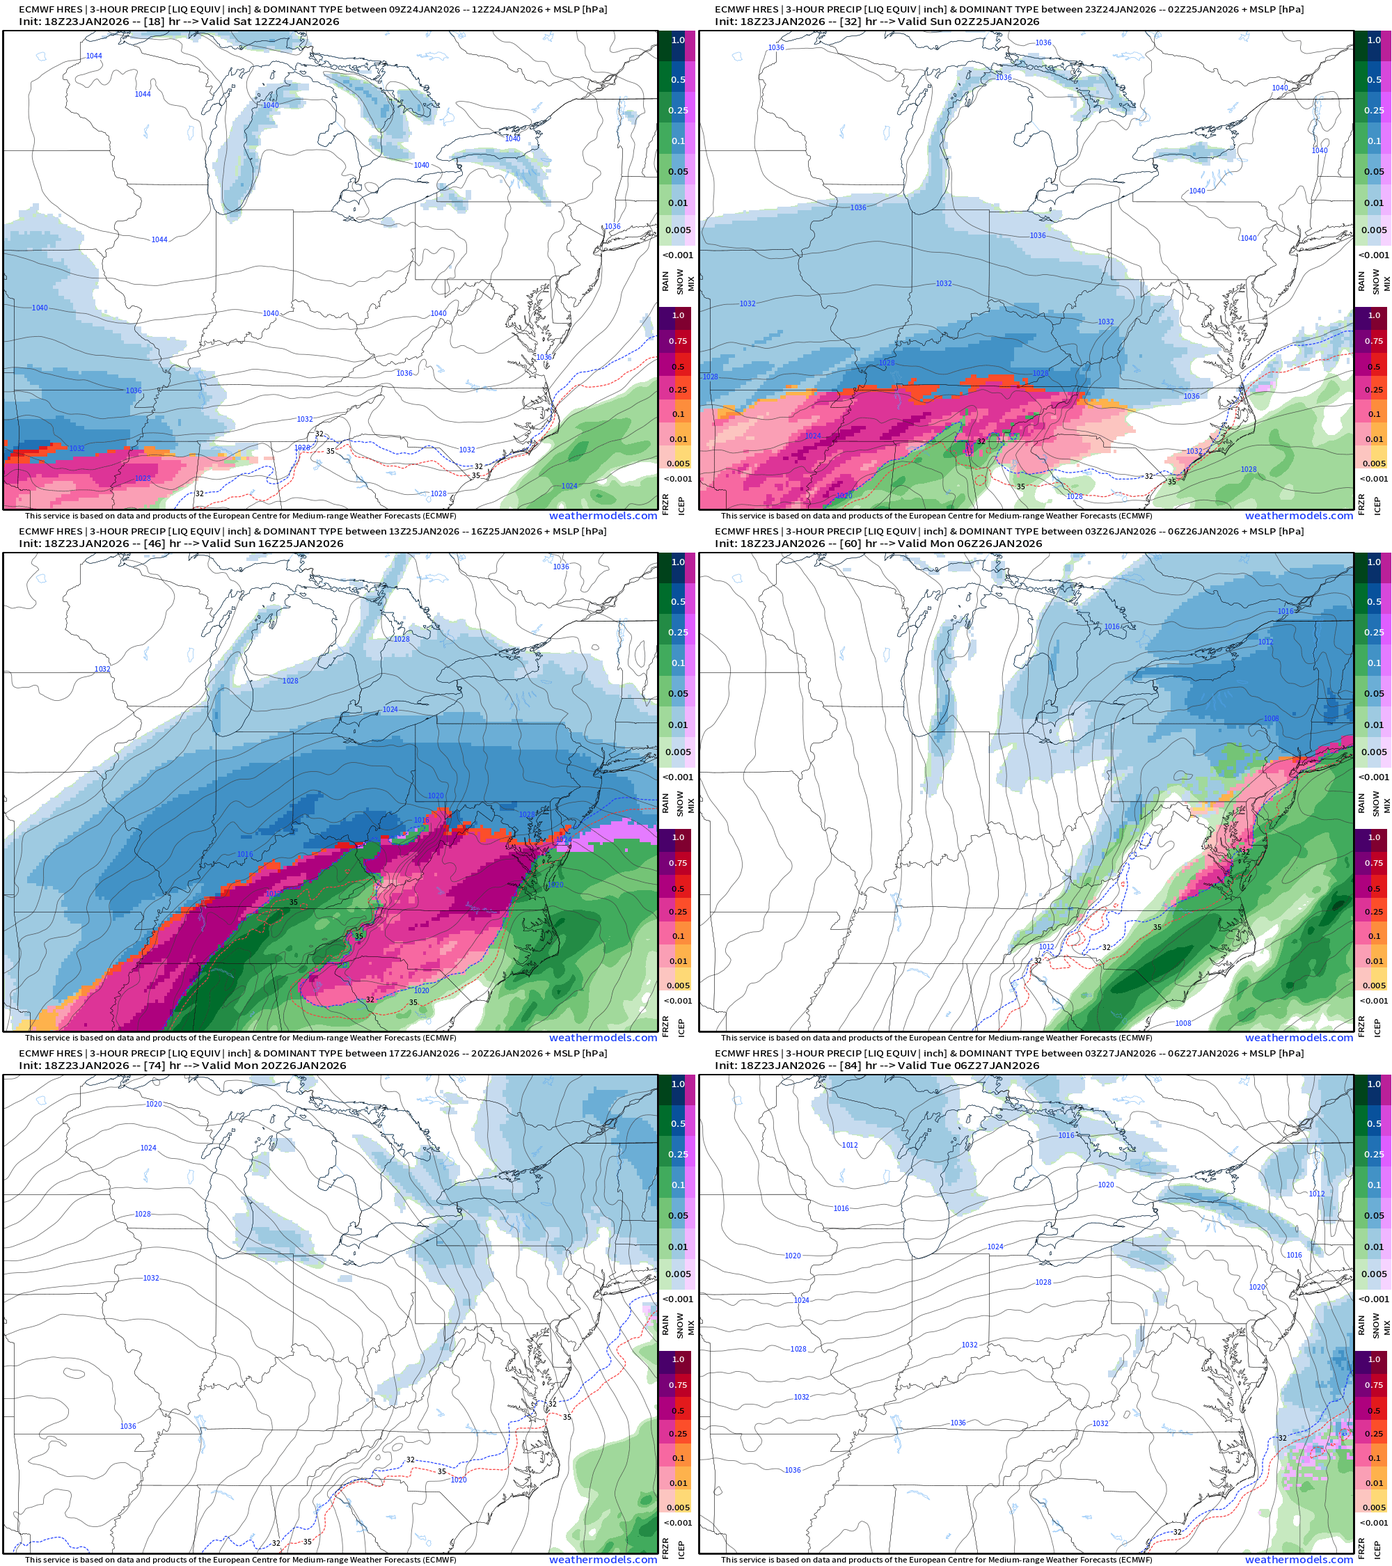
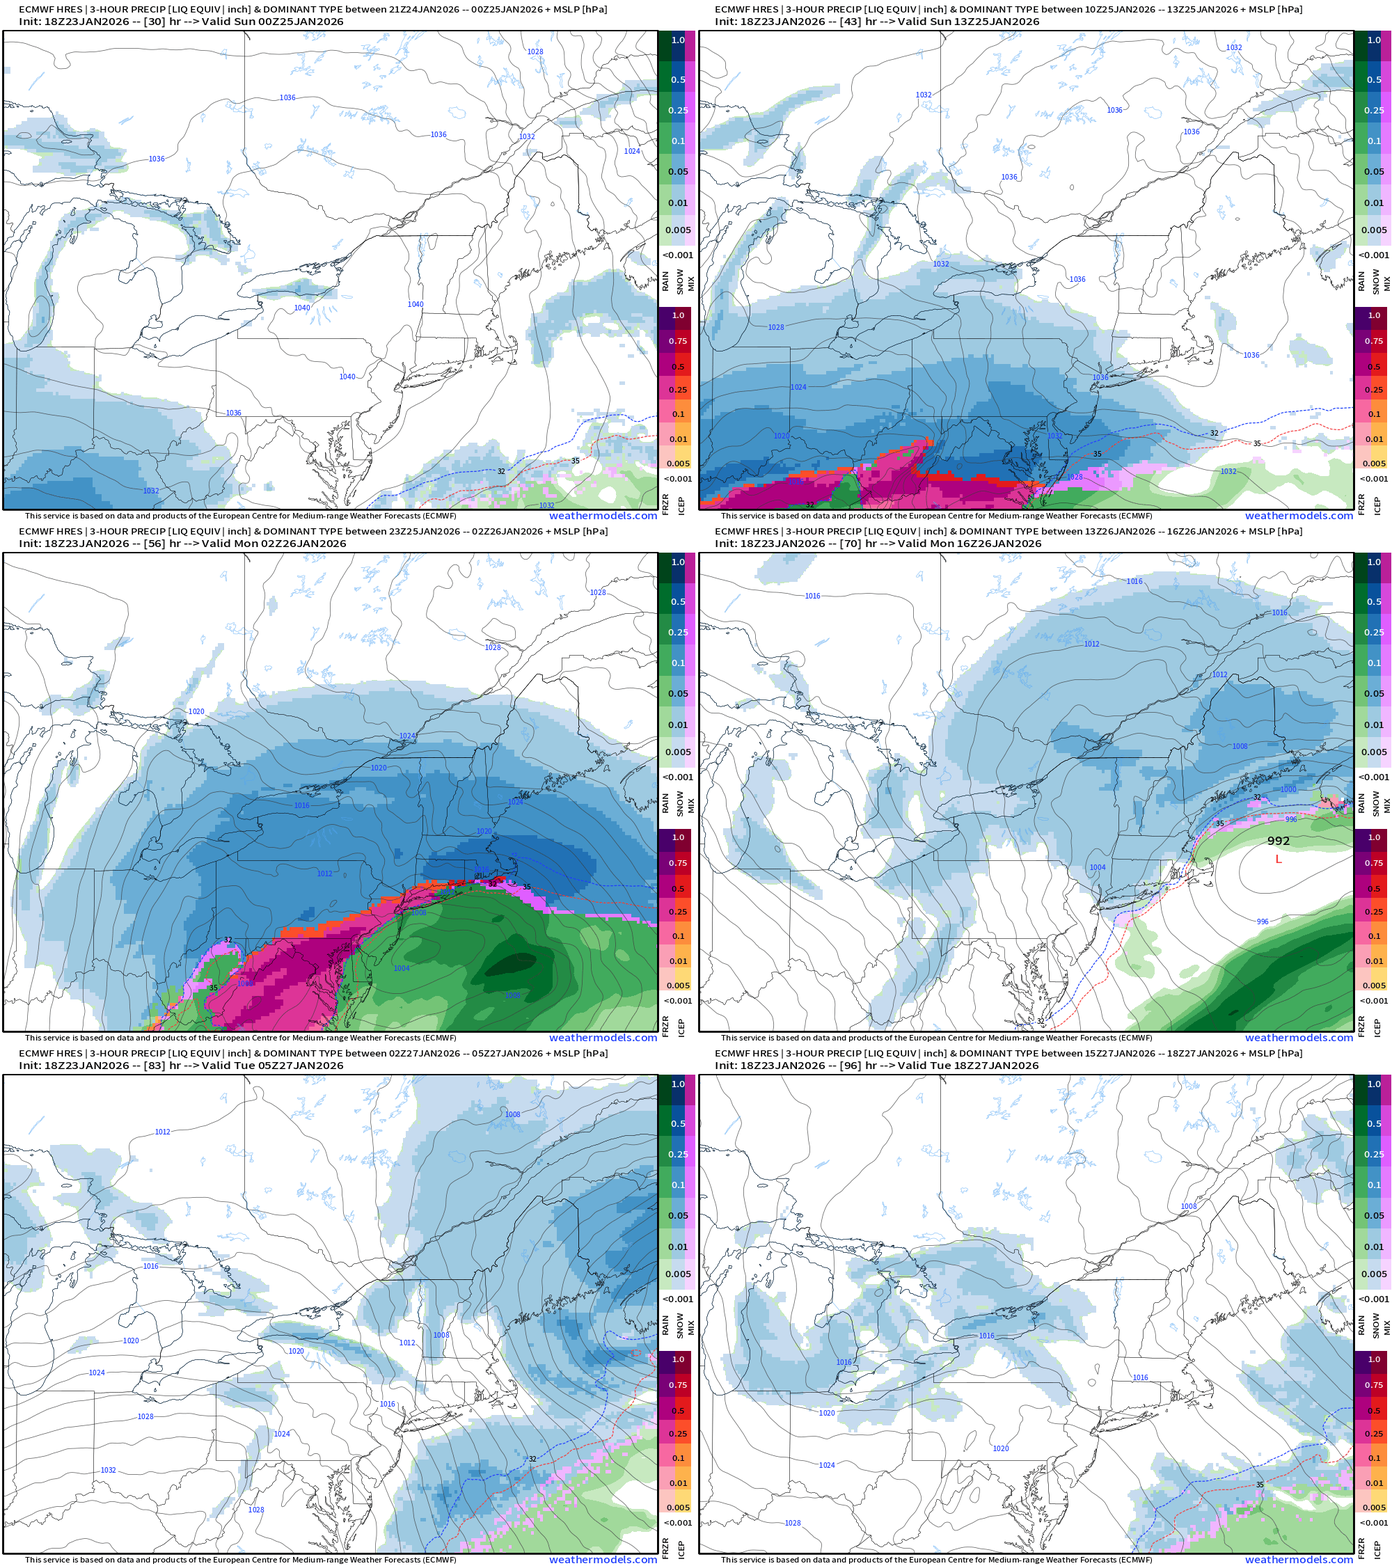
Precipitation Type and Intensity Next 6-days (ECMWF 18z)
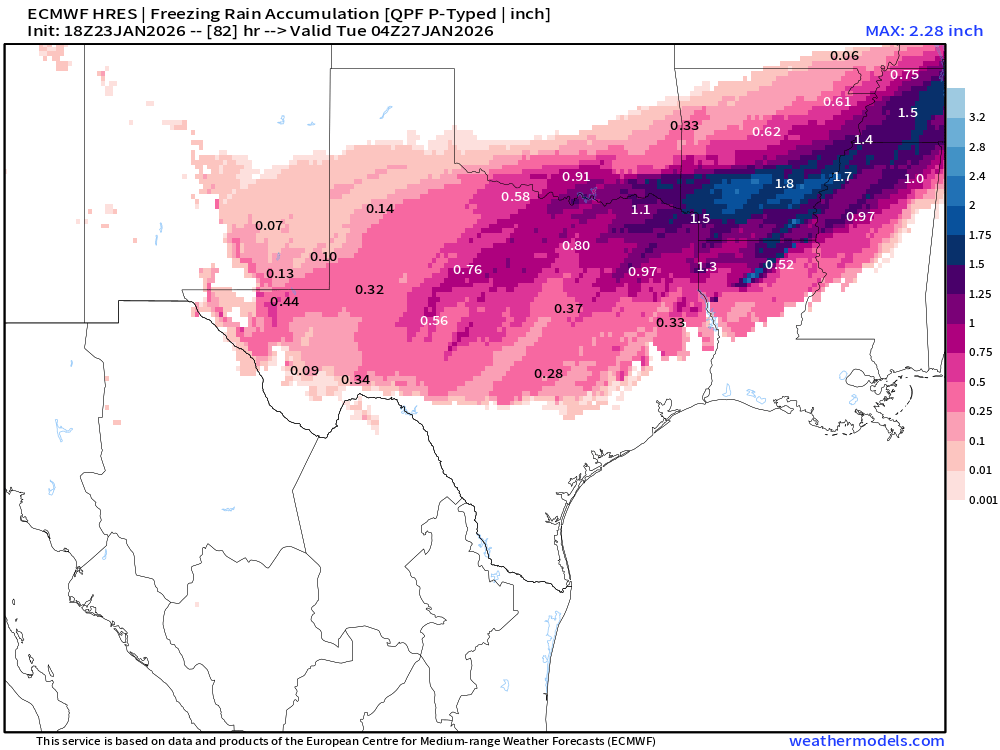
And, zoom for Texas
Southeast —> note the changeover to rain later on Sunday as the warm nose melts the accumulated ice in Atlanta, NE Georgia, into the Carolinas — yay!
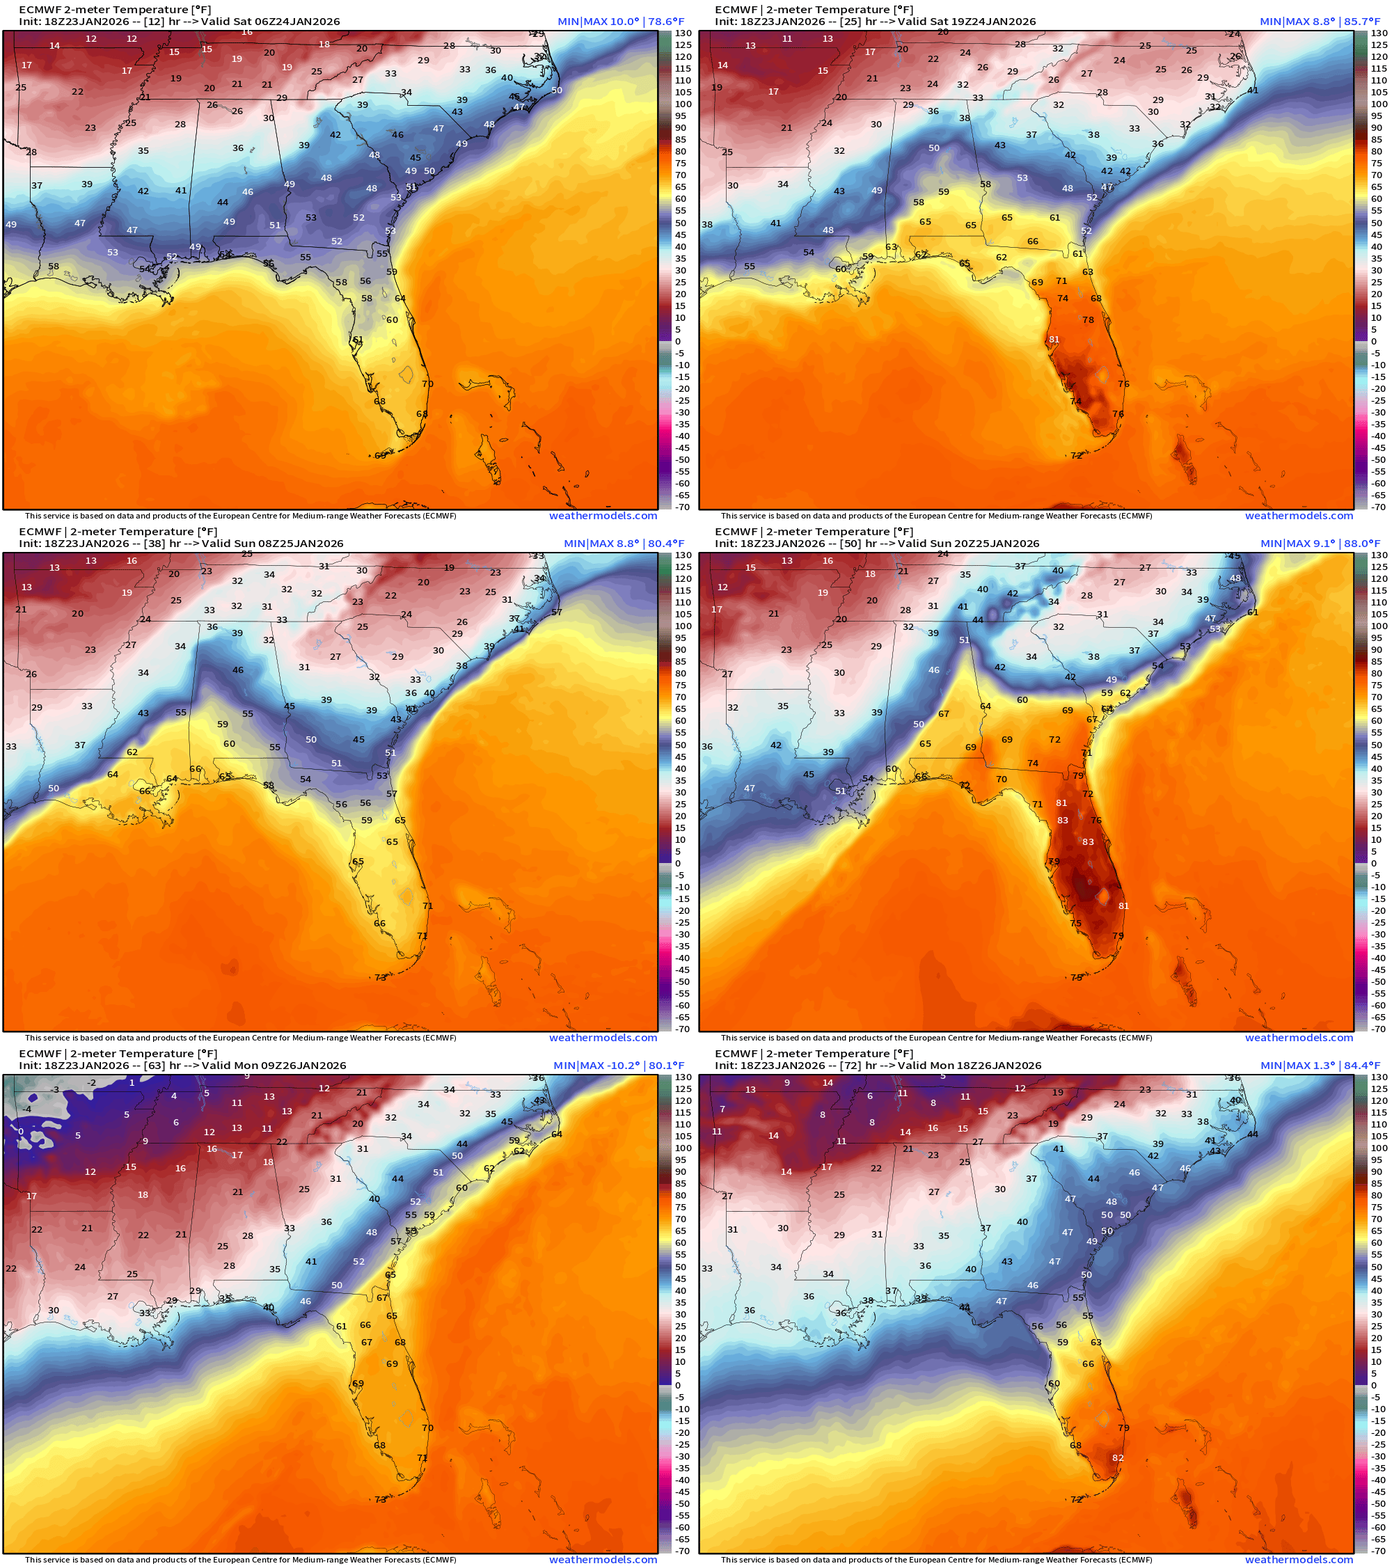
The temperatures are cool to see animated. Some places may rocket into the 50s and 60s after seeing wintry precipitation earlier in the day on Sunday
Mid-Atlantic
Because of the cold air in place already, the storm event starts out as snow and then transitions to freezing rain and ice, but there won’t be any rain or “warm nose” to save folks in Washington D.C. from the “entombment” coming with brutal Arctic blast.
Northeast USA
Much more snowfall especially in NYC and New England. Prepare for 12-18” wide spread before maybe some freezing rain arrives on top in the Big Apple
Flagship ECMWF 12z EPS | Temperature Anomaly | Next 15-days
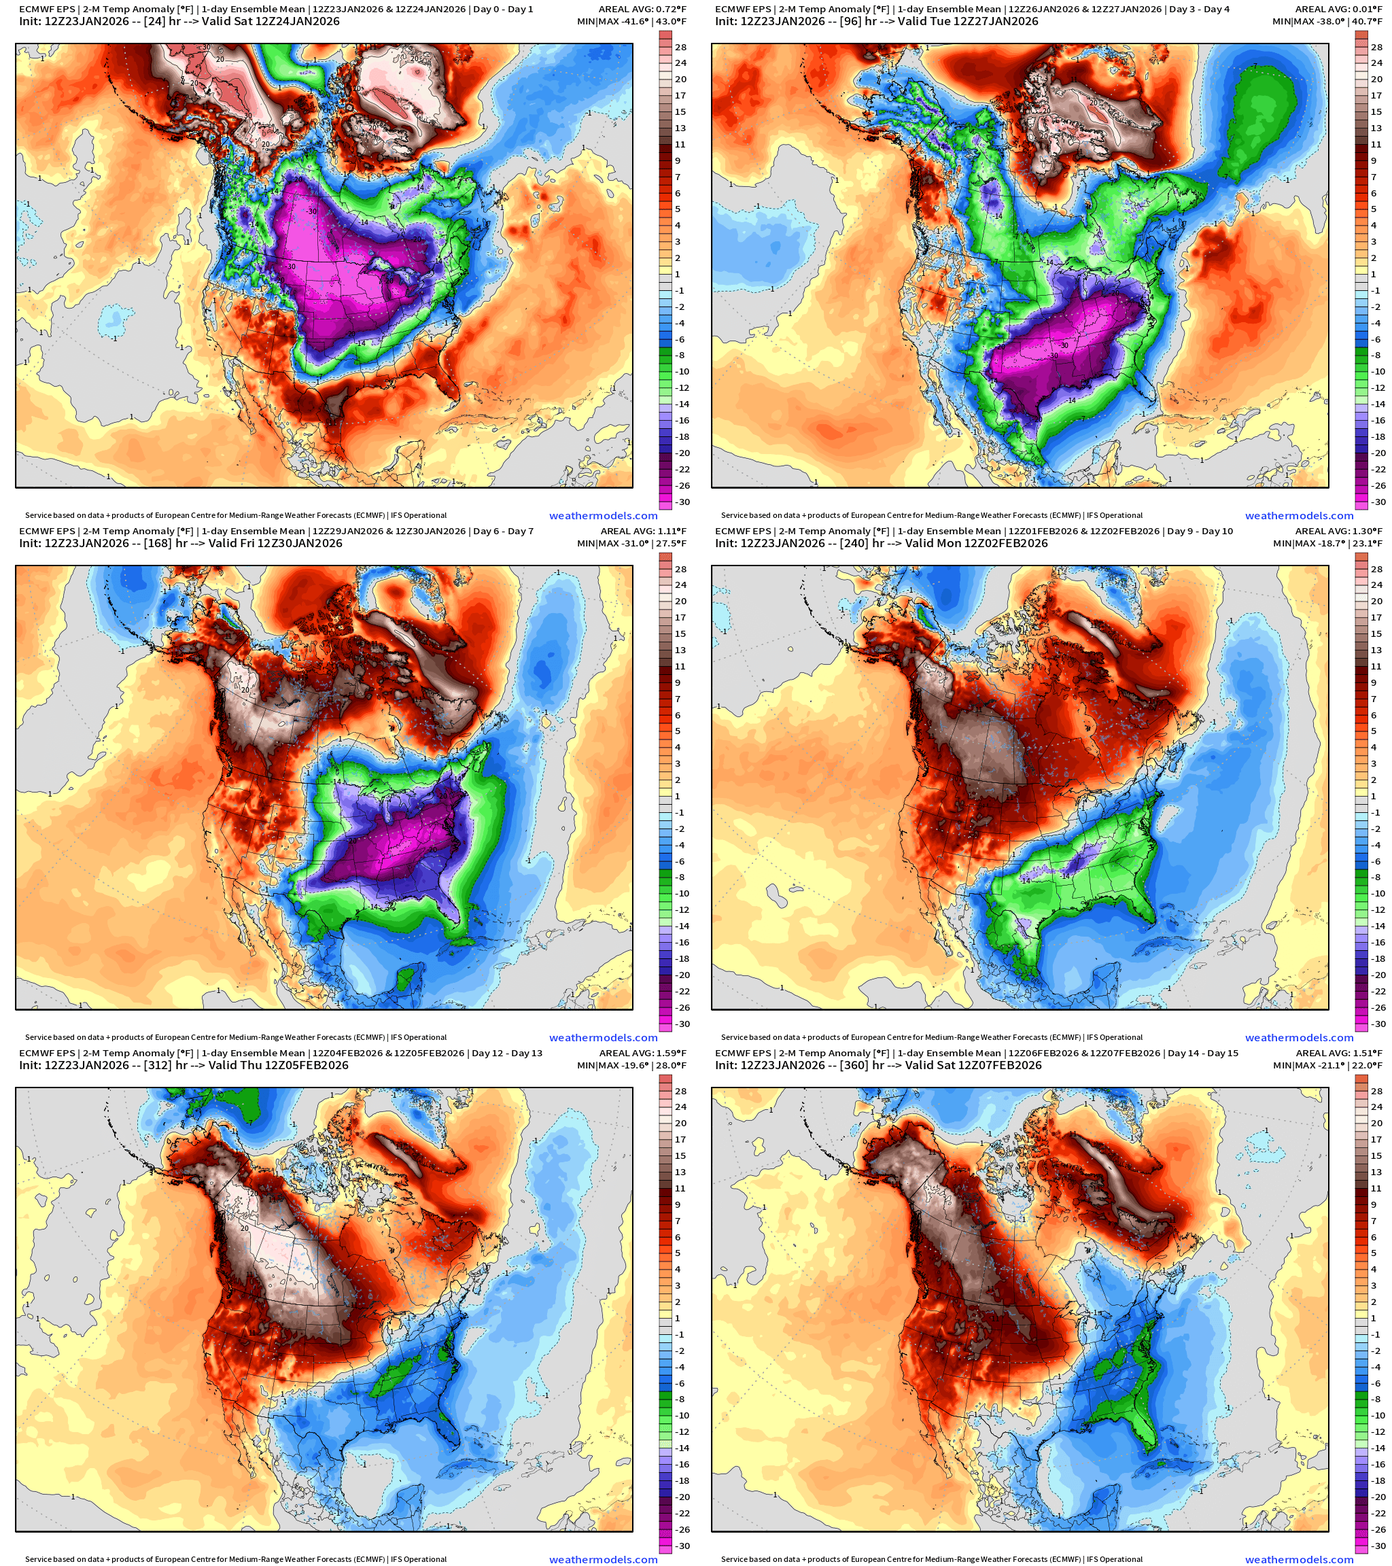
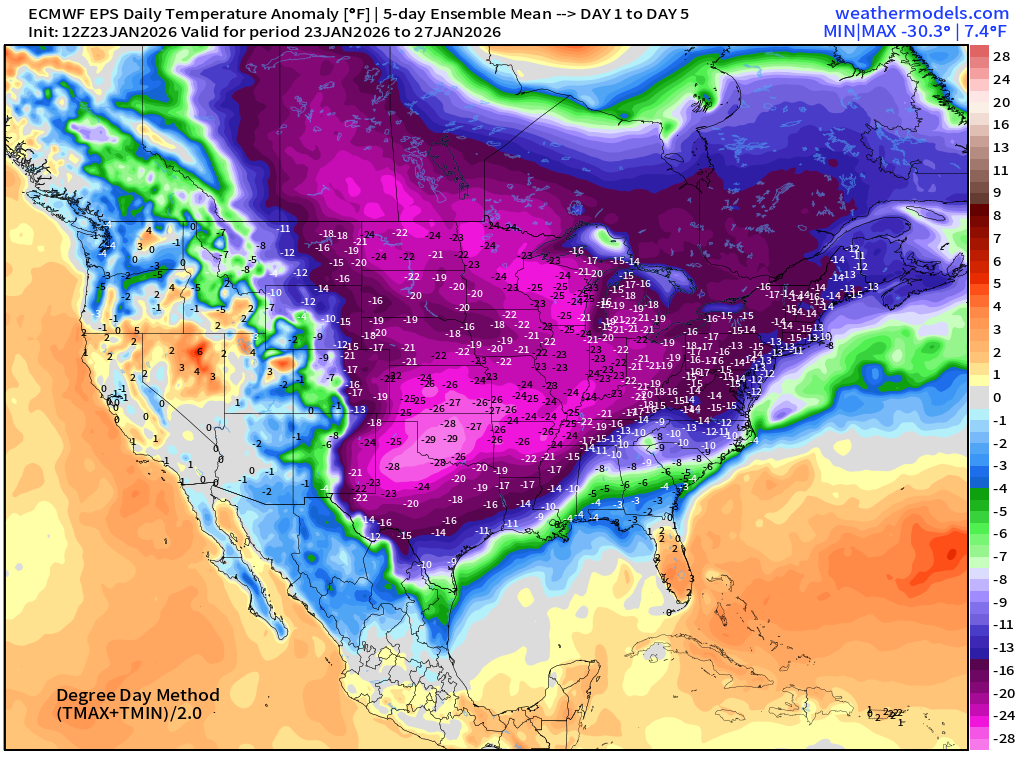
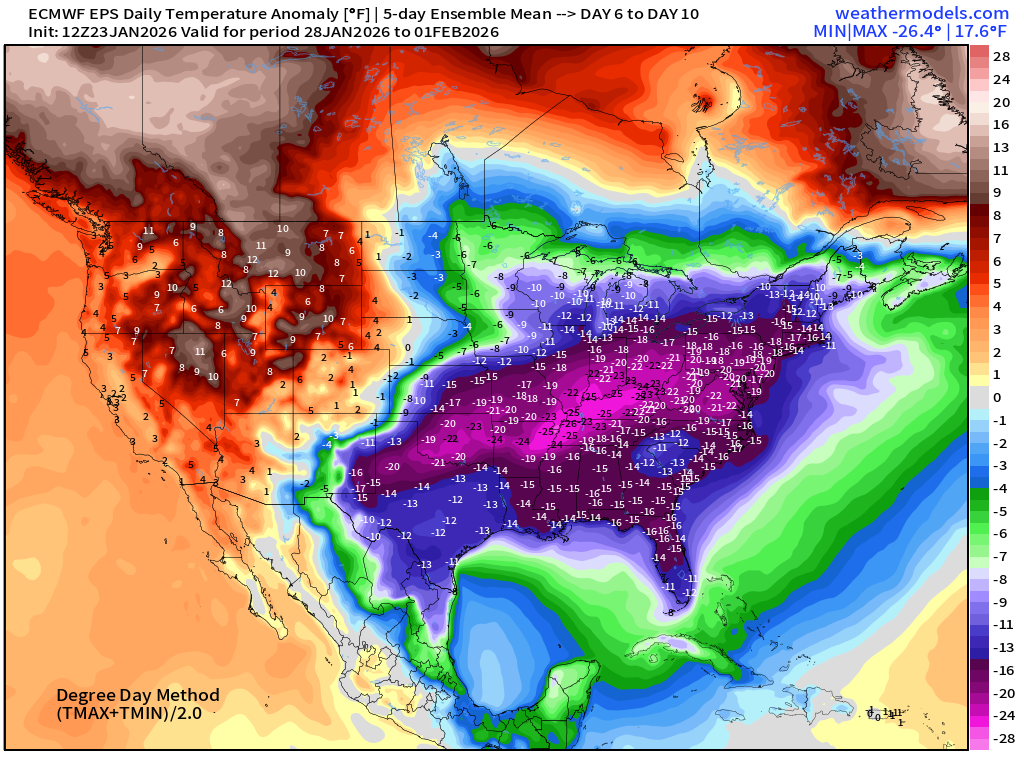
Not seeing a sustained warm up or major thaw through early February for the Eastern U.S. as the same old “polar vortex” pattern remains locked in place.
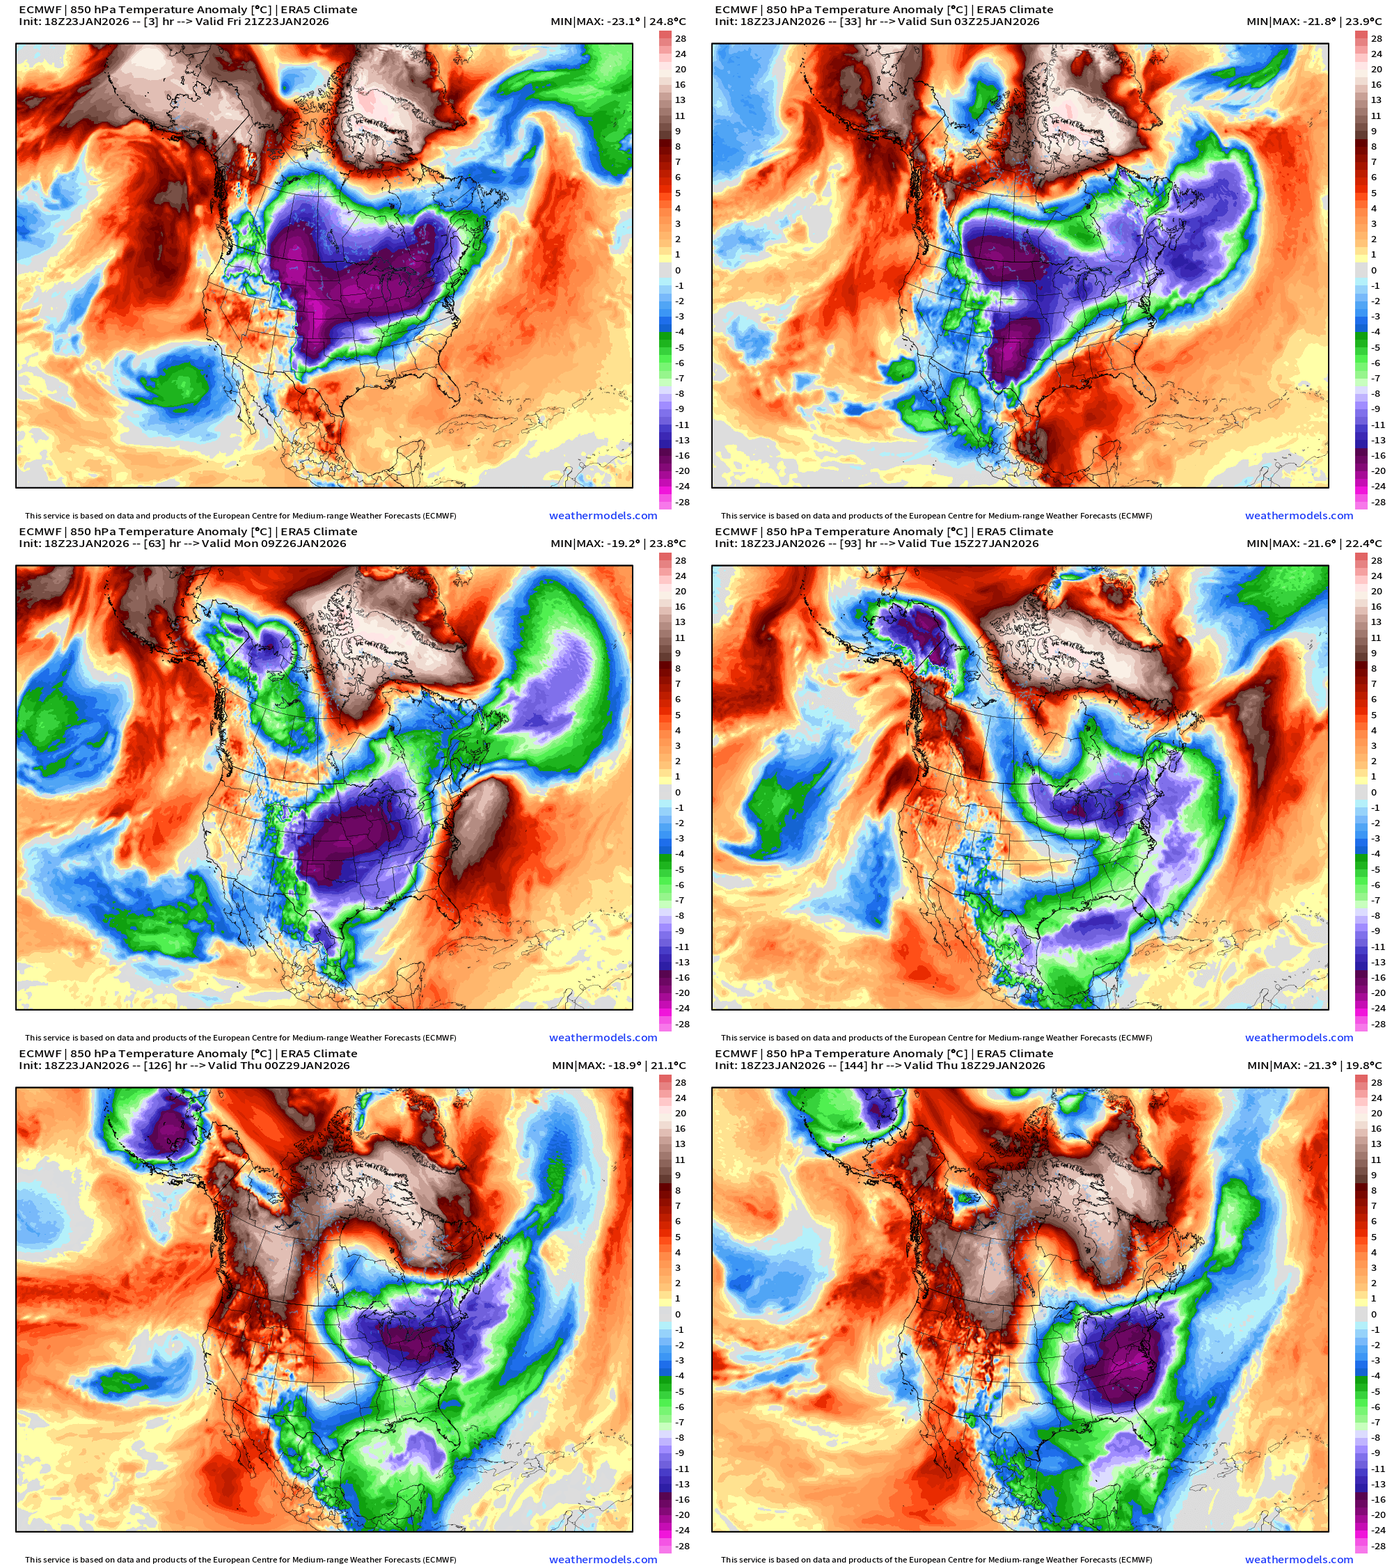
Next 6-days showing 2 Arctic Blasts w/850 mb Temperature Anomaly
ECMWF AIFS-Single 18z | Height Anomaly (500 hPa) Next 10-days
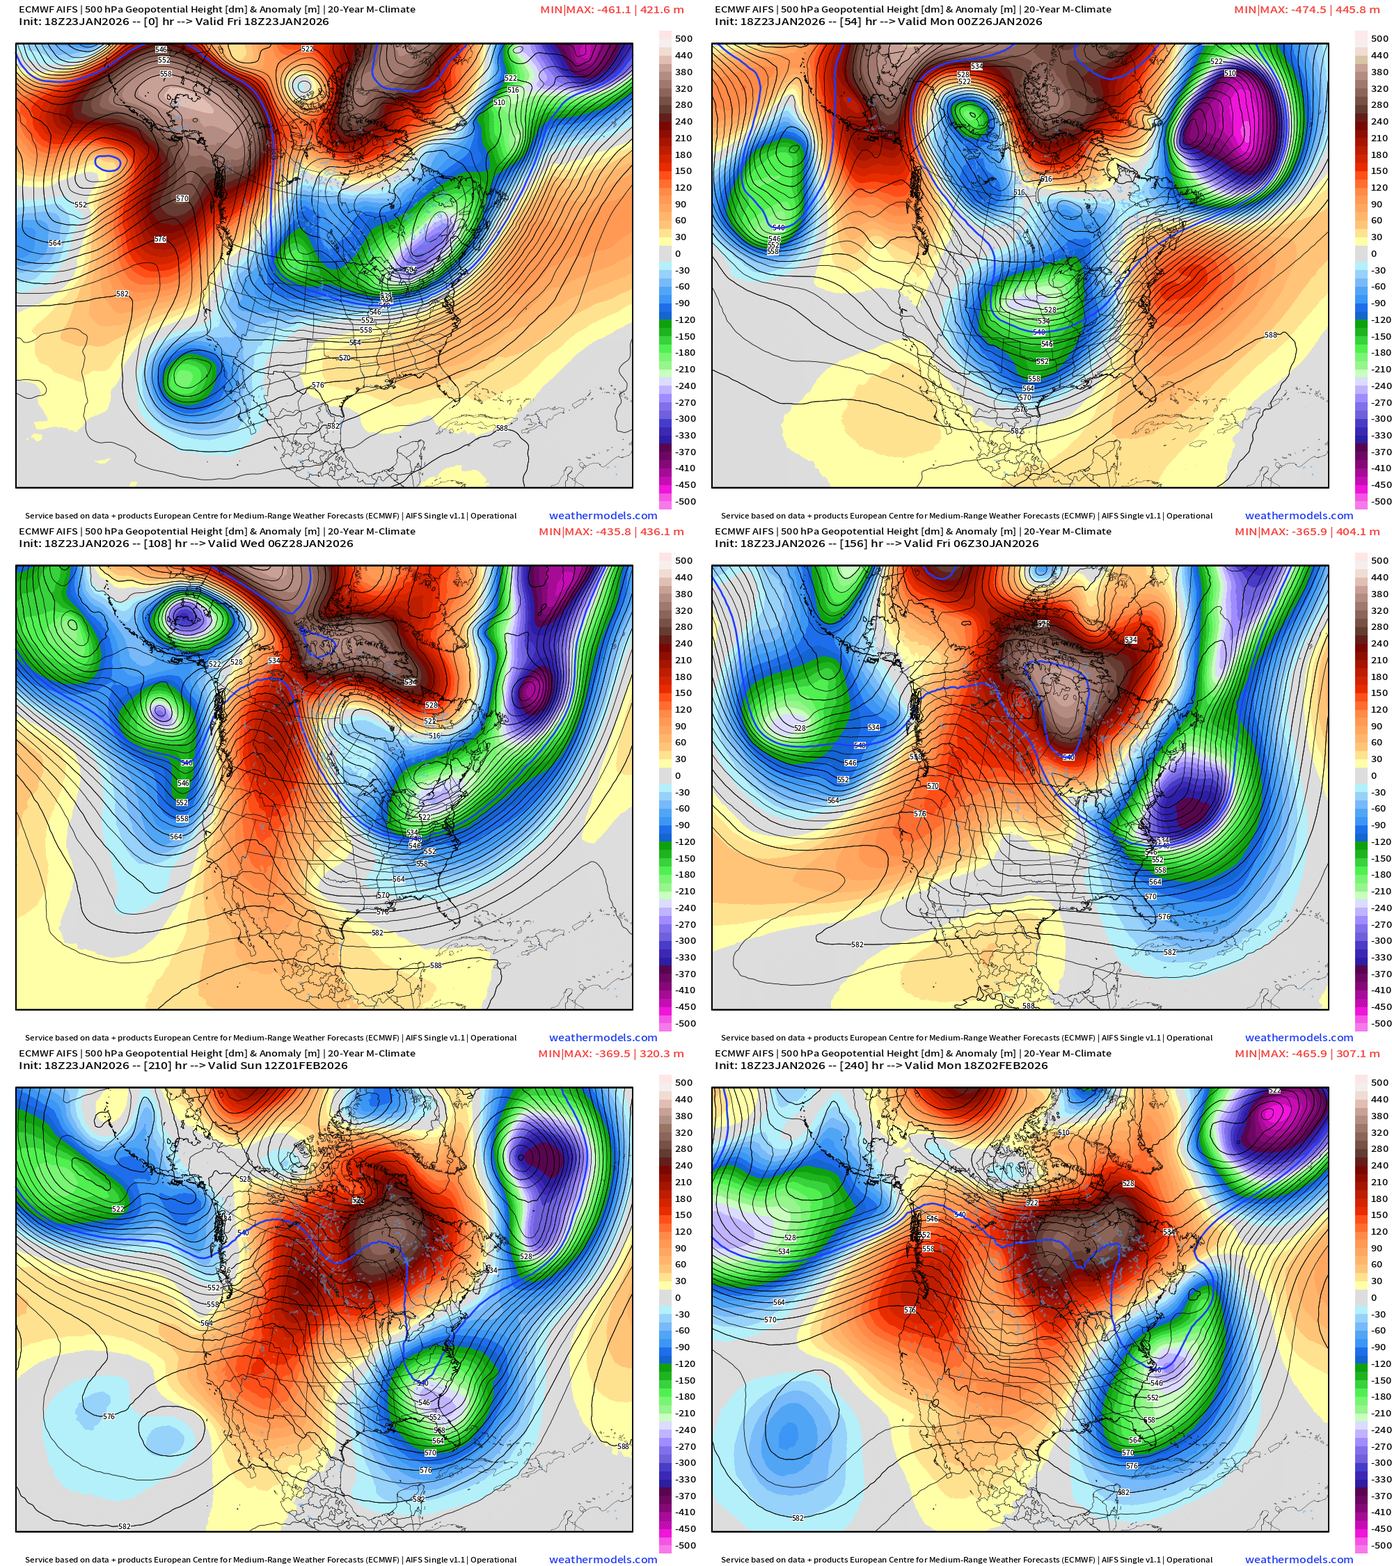
Thickness —> Showing the Polar Vortex spinning over Ontario and finally eroding by Day 10 — however, the process may repeat with a PV anomaly coming from the North Pole.
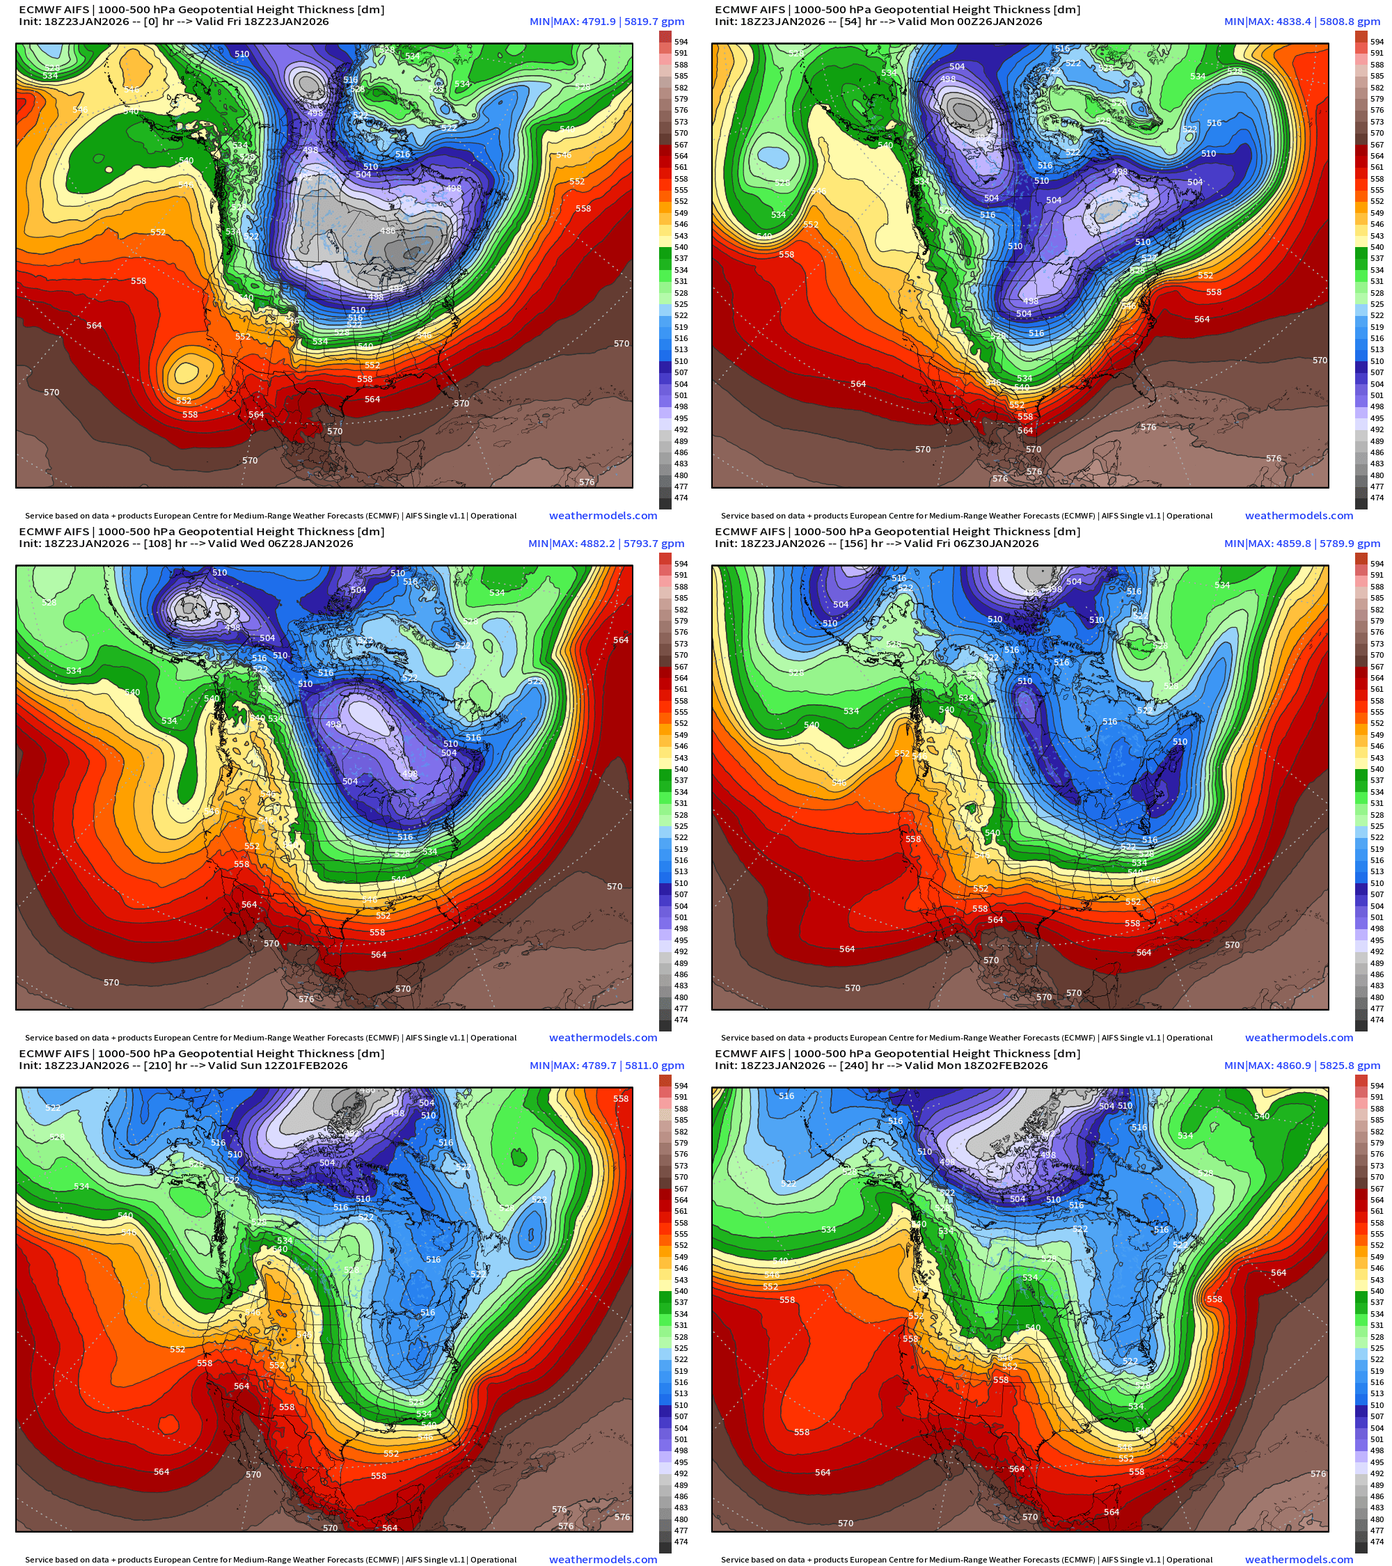
Multiple polar vortex (PV) anomalies drop out of Canada circulating around the main polar front or cold pool centered over southern Canada (Ontario)
ECMWF AIFS-Single 18z | Temperature (500 hPa) Next 10-days
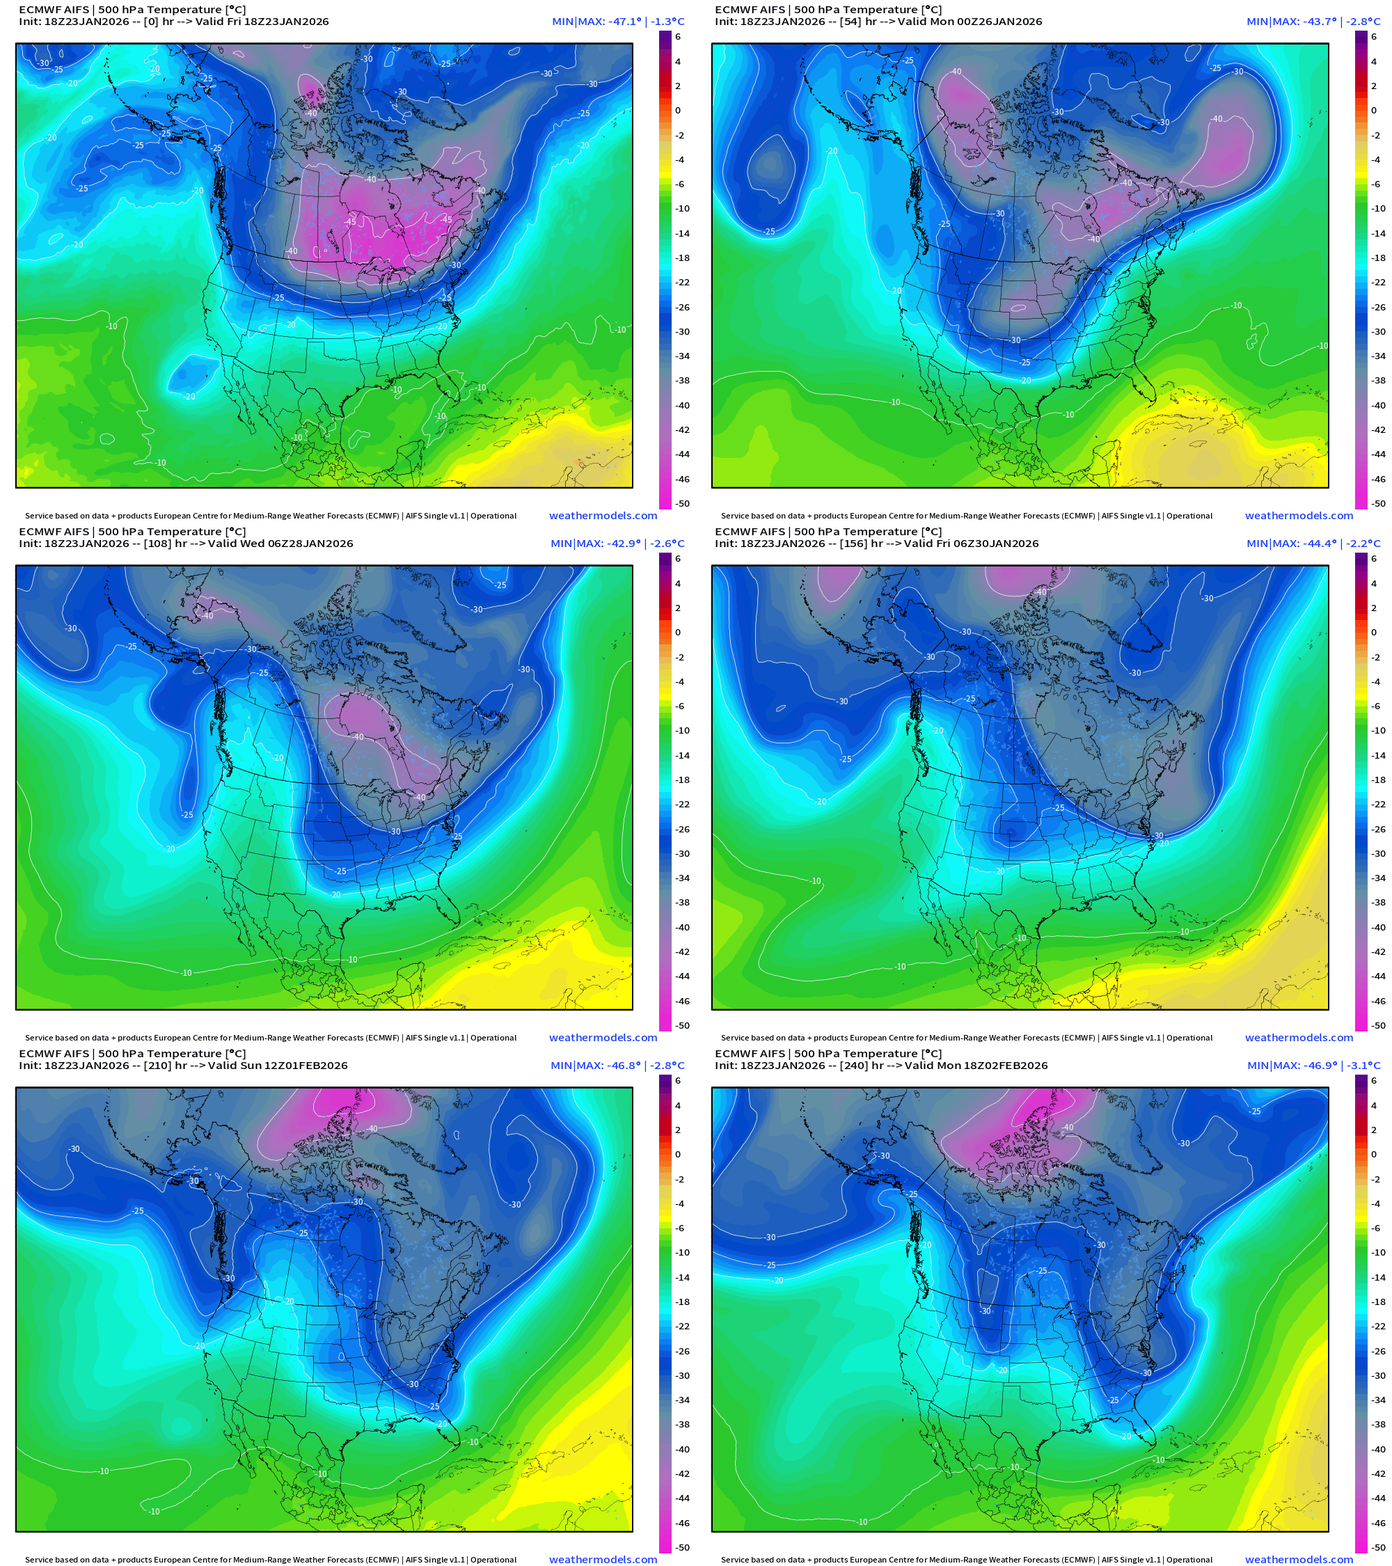
The temperature at 500 mb is the easiest way to highlight the “polar vortex” across North America with the coldest pool at -40°C (pink) with the -25°C contour usually associated with below freezing temperatures at 2-meters (surface).
ECMWF AIFS 18z | Precipitable Water Next 10-days
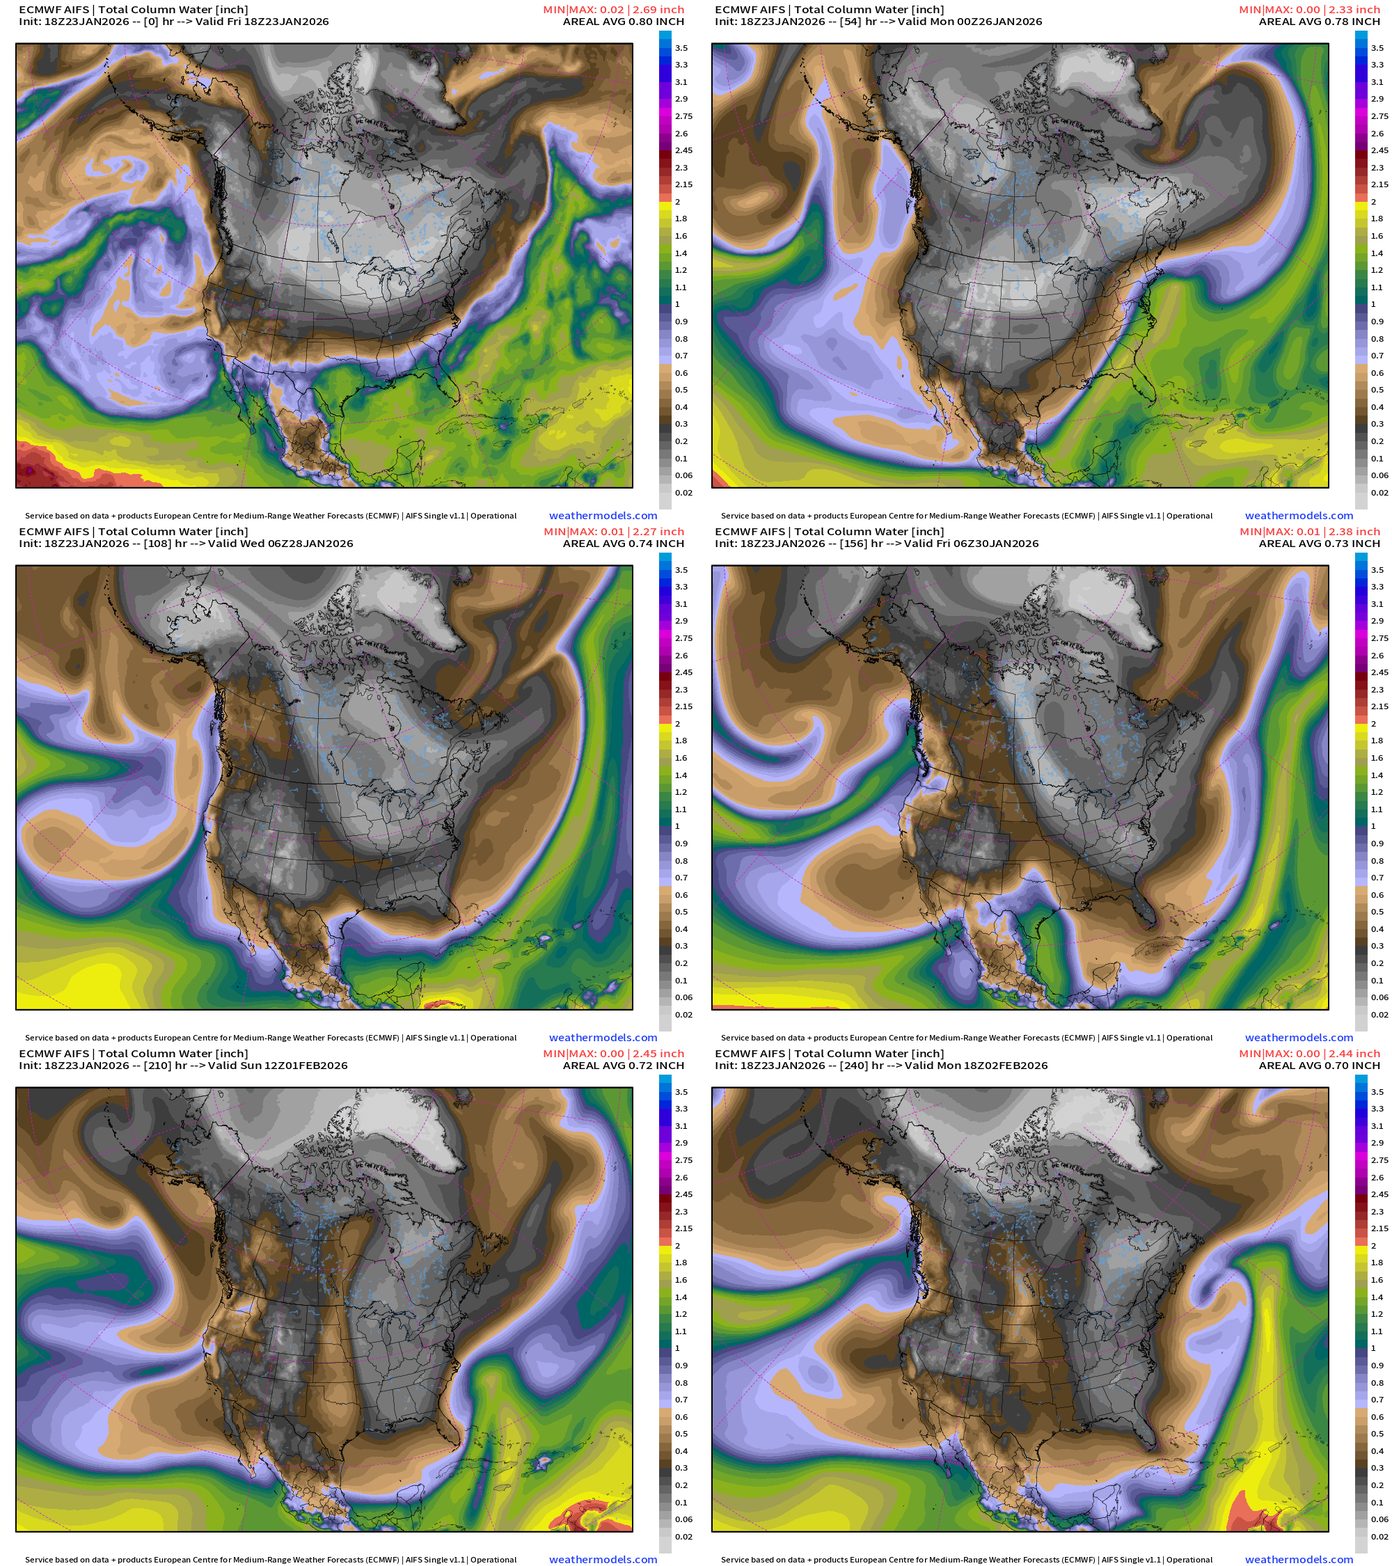
The collision of the extremely cold and dry/dense Arctic air will undercut the very moist and warmer air coming from the Gulf of Mexico and Pacific subtropics. The result is a battleground of frozen precipitation from freezing rain, sleet, ice, and snow to whatever else you can think of —> massive frozen precipitation mess.
RTMA | Temperature Analysis | 7:45 PM ET
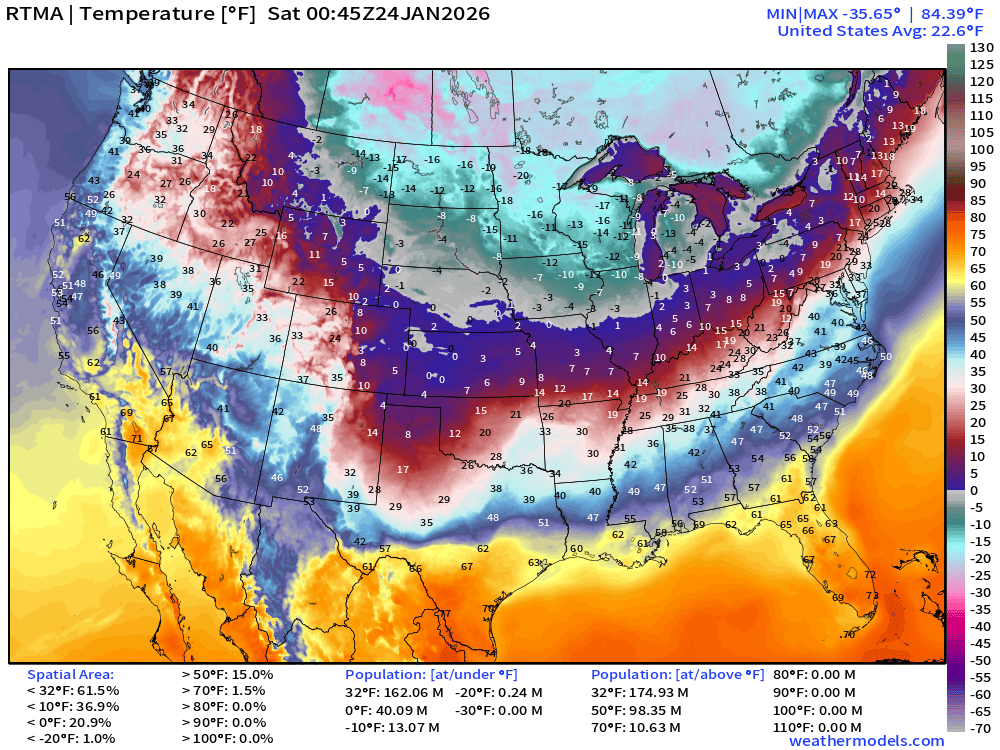
Average Lower 48 temperature was only 22.6°F with 175 million below freezing.
Temperature Anomaly | 7:45 PM ET
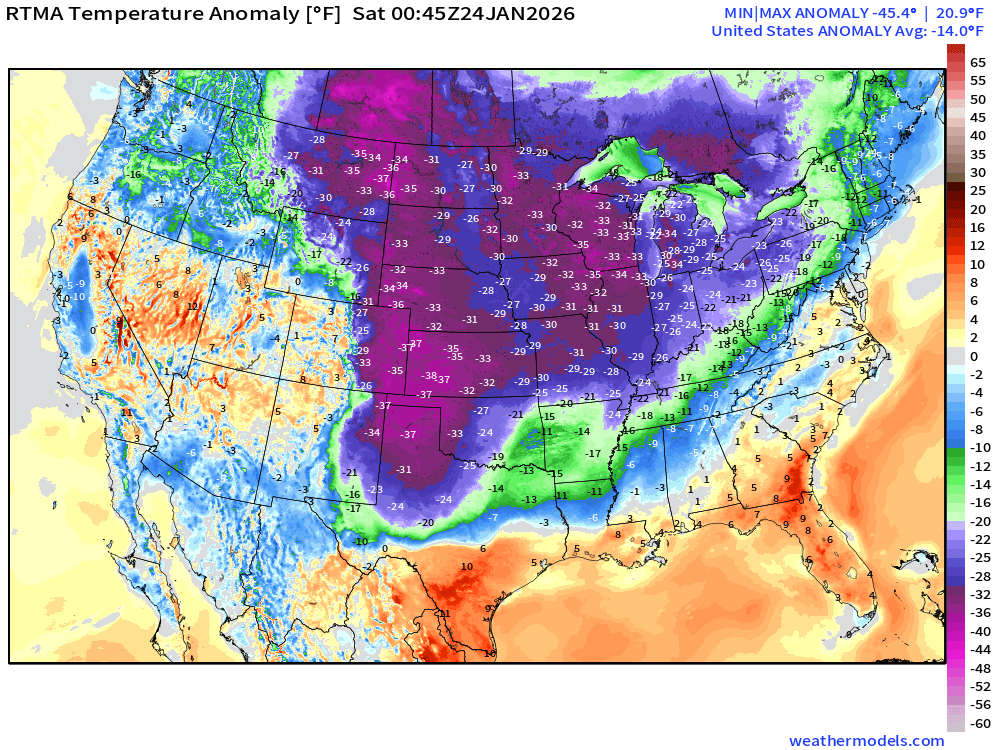
Lower 48 Temperature Anomaly below normal by -14.0°F —> whoa!
Blend of Models | 7 Days Precipitation Total
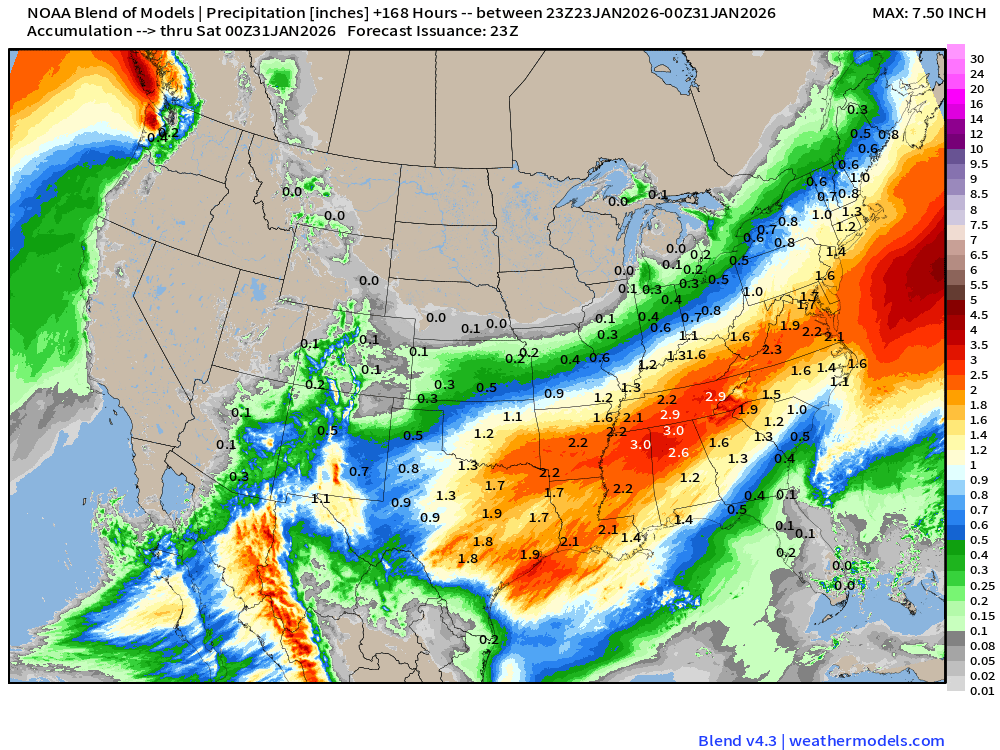
Boatloads of QPF from this atmospheric river / subtropical atmospheric river
Blend of Models | Total Snowfall Next 7-Days
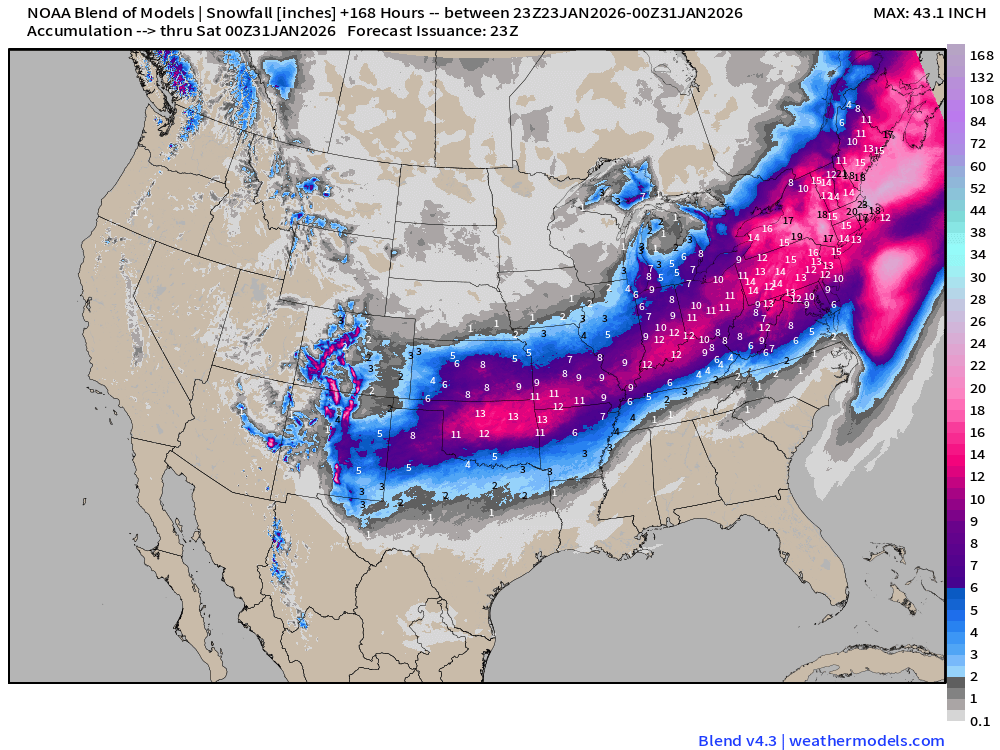
And, for this storm event through 5-days, as more snow falls in the Northeast into next weekend
The snow to liquid ratios (SLR) are incorporated directly into the Blend of Models snowfall forecasts —> quite amazing totals in Washington D.C. + Philly —> NYC and Boston. Wow!
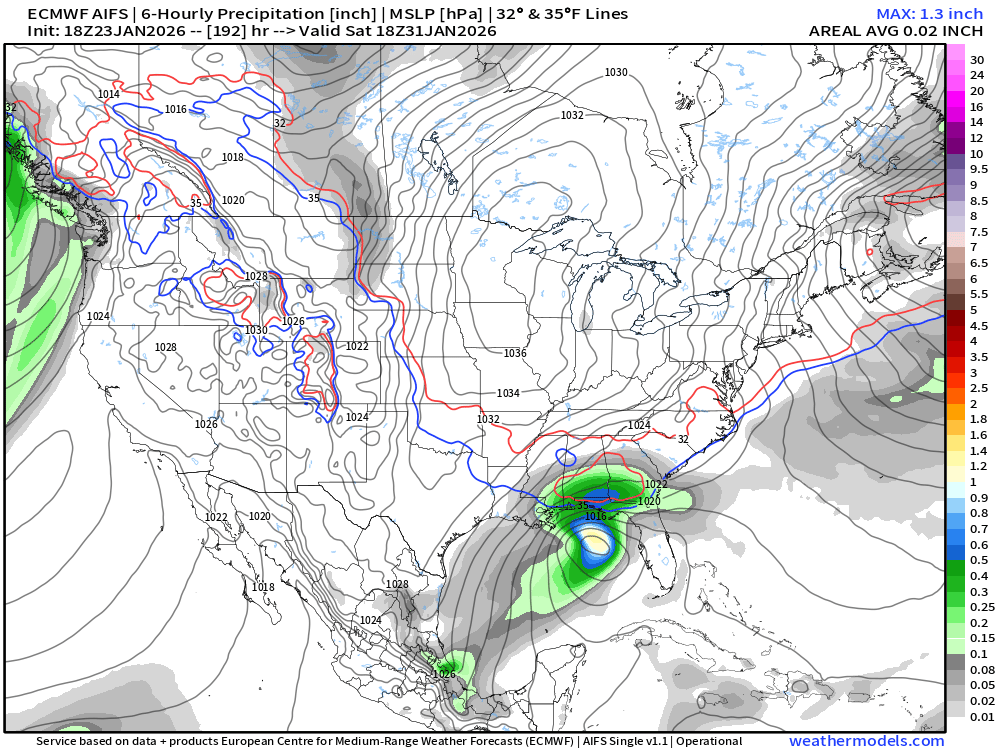
Now, let’s quickly mention a Gulf coast potential storm system next weekend!
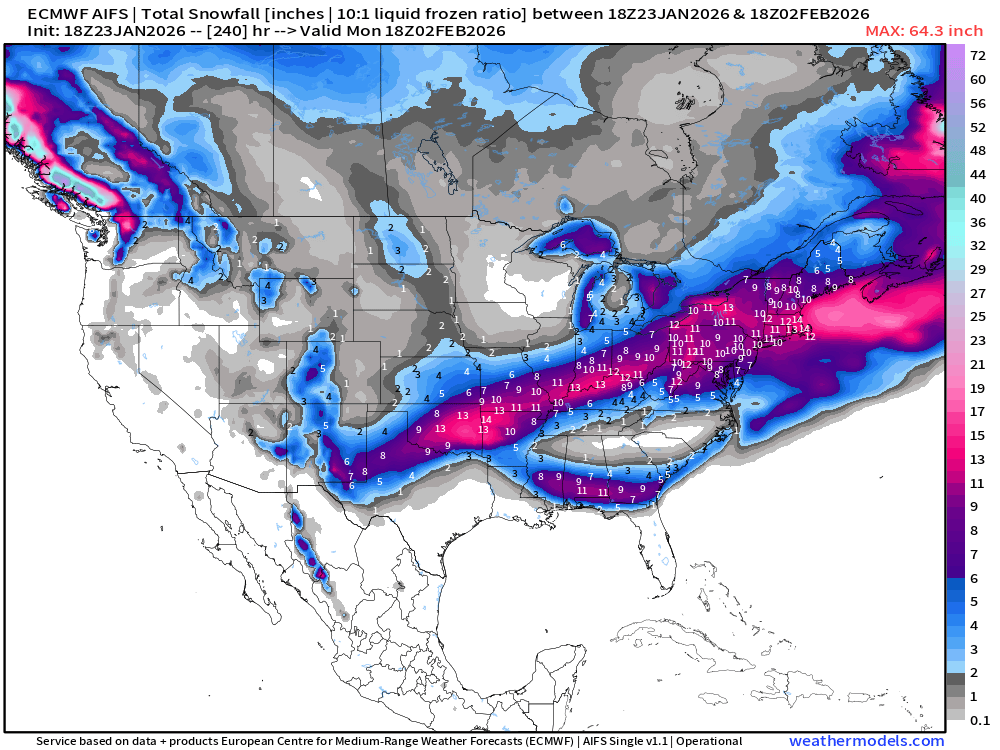
Look at that cute little guy —> and it could deliver a foot of snow to almost the Gulf of Mexico — next Saturday — only 8-days away!
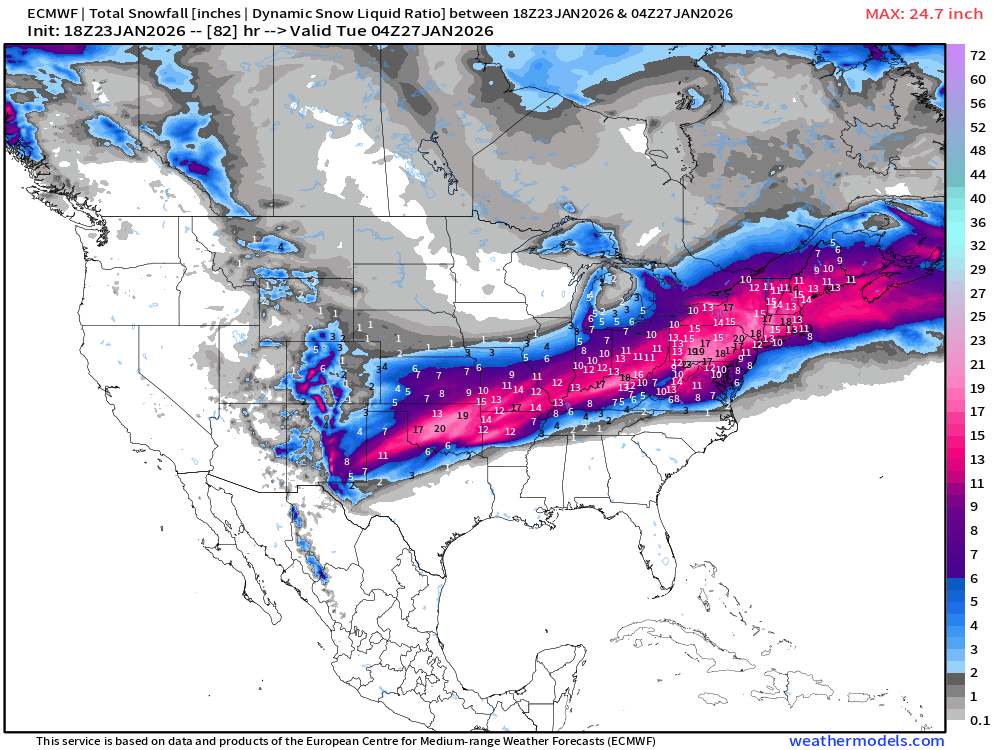
Quick Record Keeping of the ECMWF 18z HRES Snowfall Amounts
So we can see how the models performed after
Freezing Rain — note this is not accumulated ice (accretion)
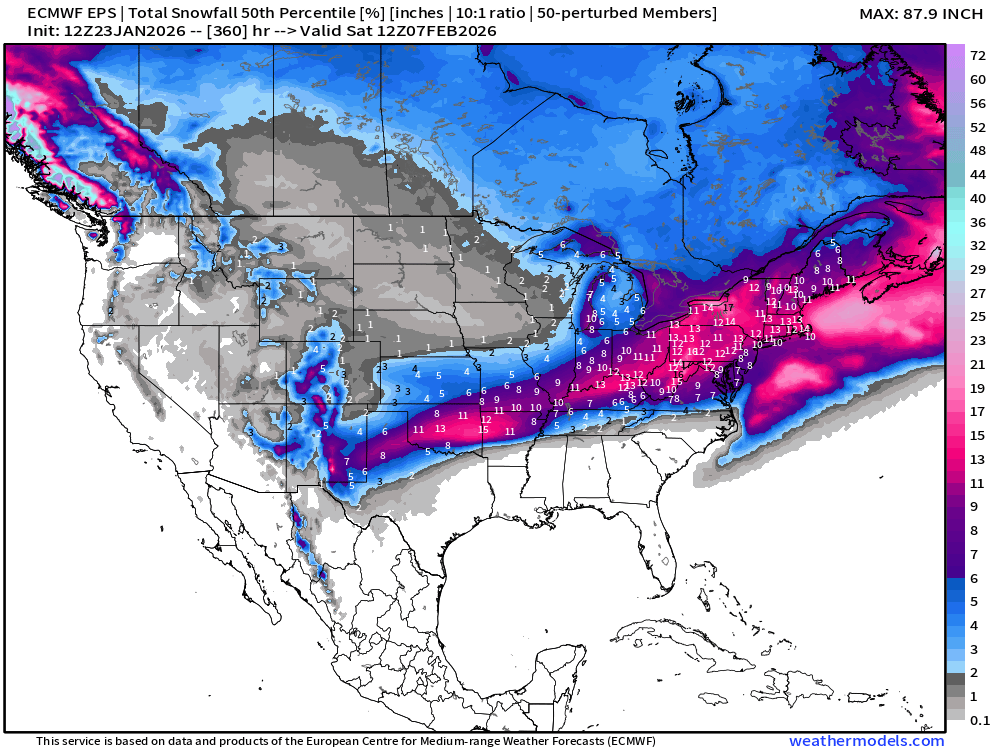
ECMWF EPS 12z | Ensemble Median Snowfall Next 15-days
Probability of some Snowfall (0.1”) in next 15-days
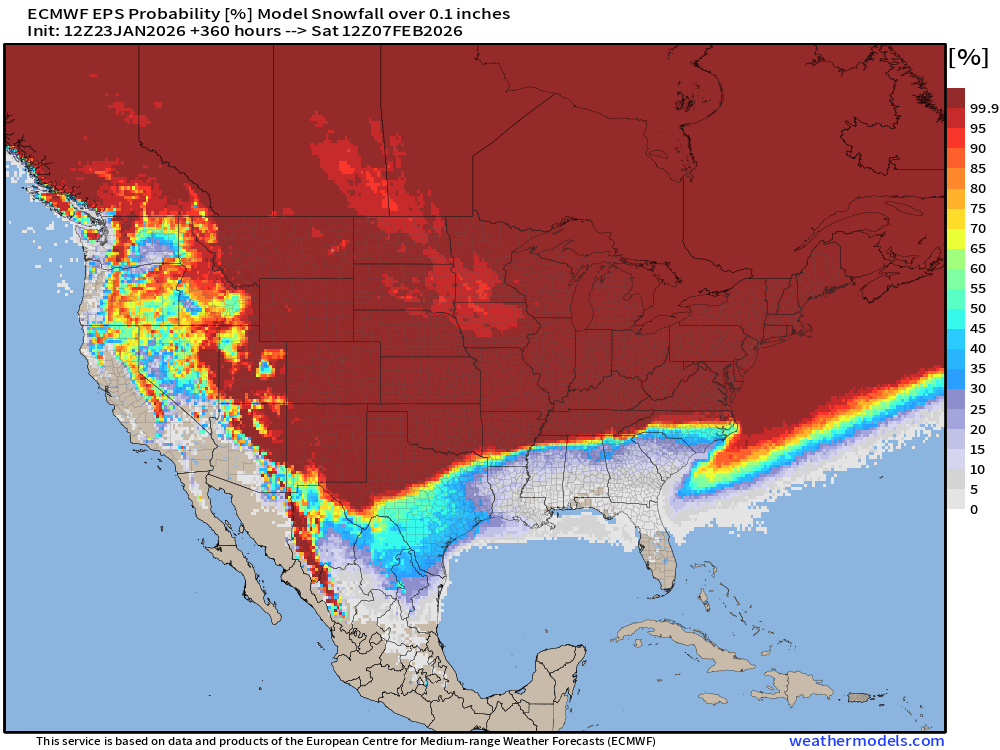
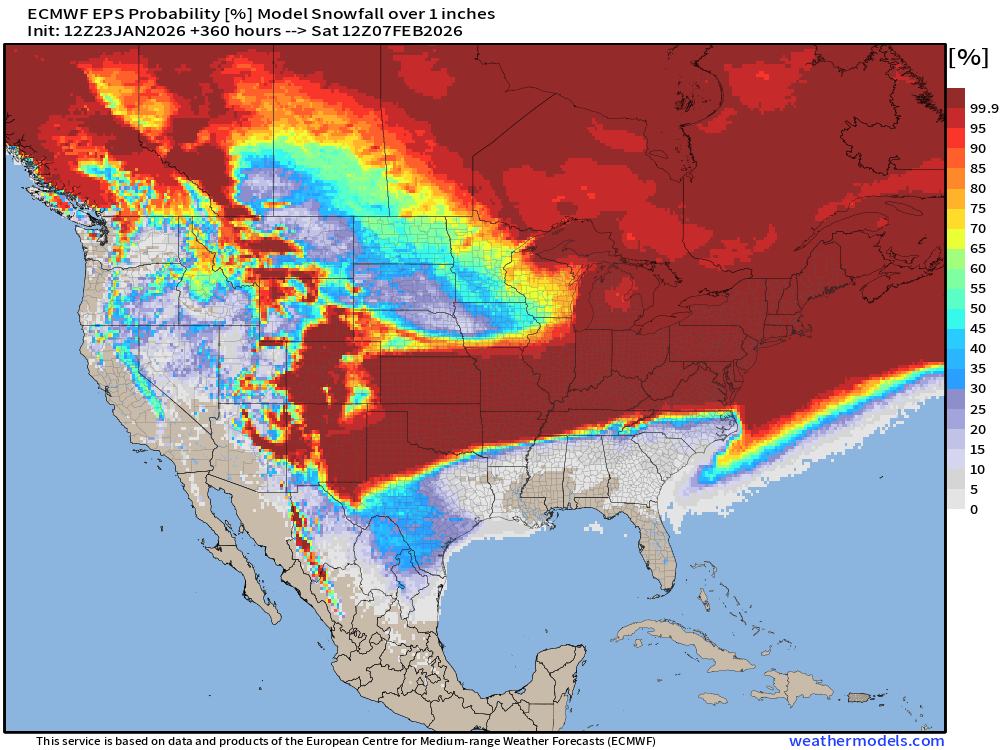
Probability of 1-inch Snowfall in next 15-days
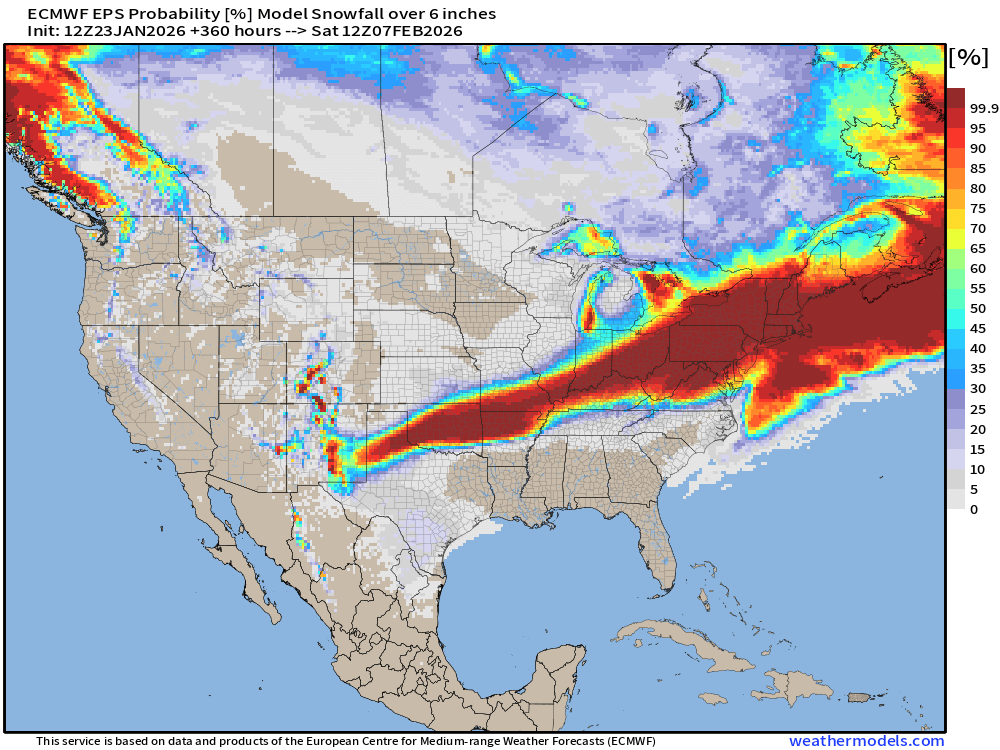
Probability of 6” of Snowfall next 15-days
Lower 48 Temperature Anomaly | Next 15-days | ECMWF EPS 12z
5-Day Chunk #1 | Temperature Anomaly | Jan 23 - Jan 27
5-Day Chunk #2 | Temperature Anomaly | Jan 27 - Feb 1
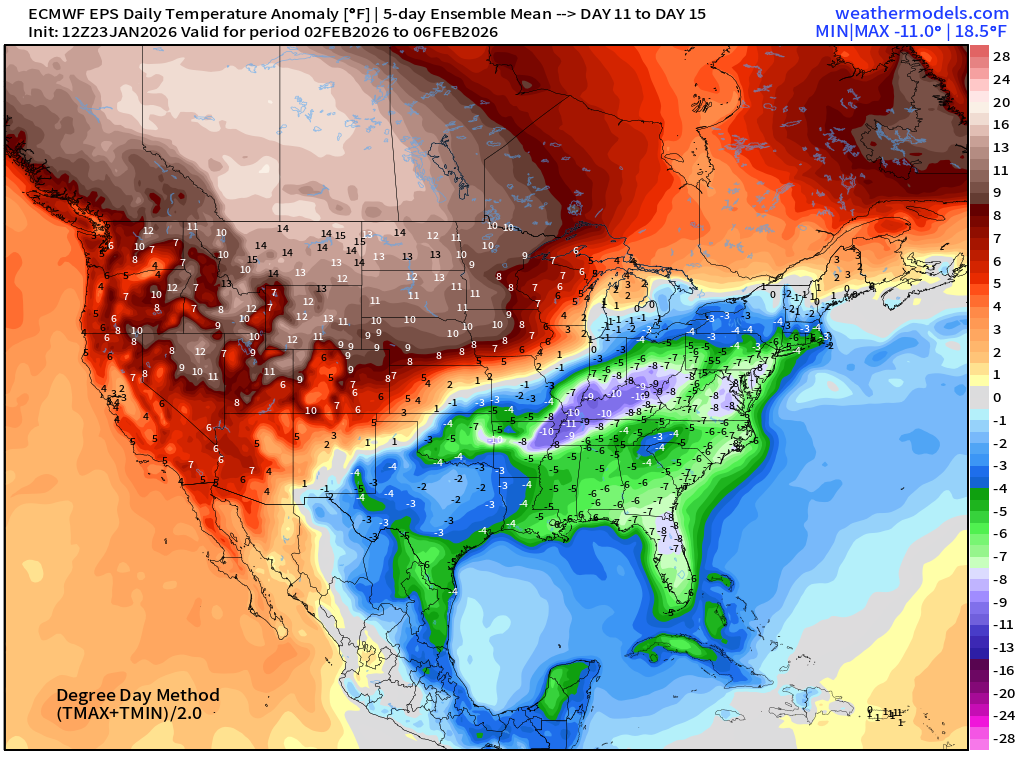
5-Day Chunk #3 | Temperature Anomaly | Feb 2 - Feb 6
You made it to the end of the blog — congratulations! A lot more coming in the days ahead. Please sign up / share
Maps sourced from weathermodels.com designed and innovated by yours truly! Please subscribe there for real-time access to the newest maps, charts from all of the weather models including ECMWF and AIFS, NOAA AI-GFS/AI-GEFS
- Milepost
- 848 · laid 2026-01-24T02:15:31.550000Z
- Source
- https://weather.substack.com/p/january-23-2026-frigid-10-days-ahead
- Digest
- e960723a7573b20ae040d30890ea5ae1b277a1af5813395938a03d1ecd8269e0
- Machine
- JSON