December 2, 2025 Tuesday Evening Winter Weather
Cold in Great Lakes into weekend as December remains below normal for Eastern U.S.
December 2025 was the 5th-warmest December in the 131-year national record (1895–2025), at 37.8°F against a 1991–2020 normal of 34.3°F (+3.5°F).
December 2025 was the 37th-driest December in the 131-year national record (1895–2025), at 2.0in against a 1991–2020 normal of 2.5in (-0.5in).
NOAA/NCEI Climate at a Glance, contiguous United States. This is the observed record for the month, not a score of anything said in this piece — the forecast ledger begins 2026-08-17 and cannot reach earlier posts.

Next 15-days Temperature Anomaly | Ensemble Mean to December 16
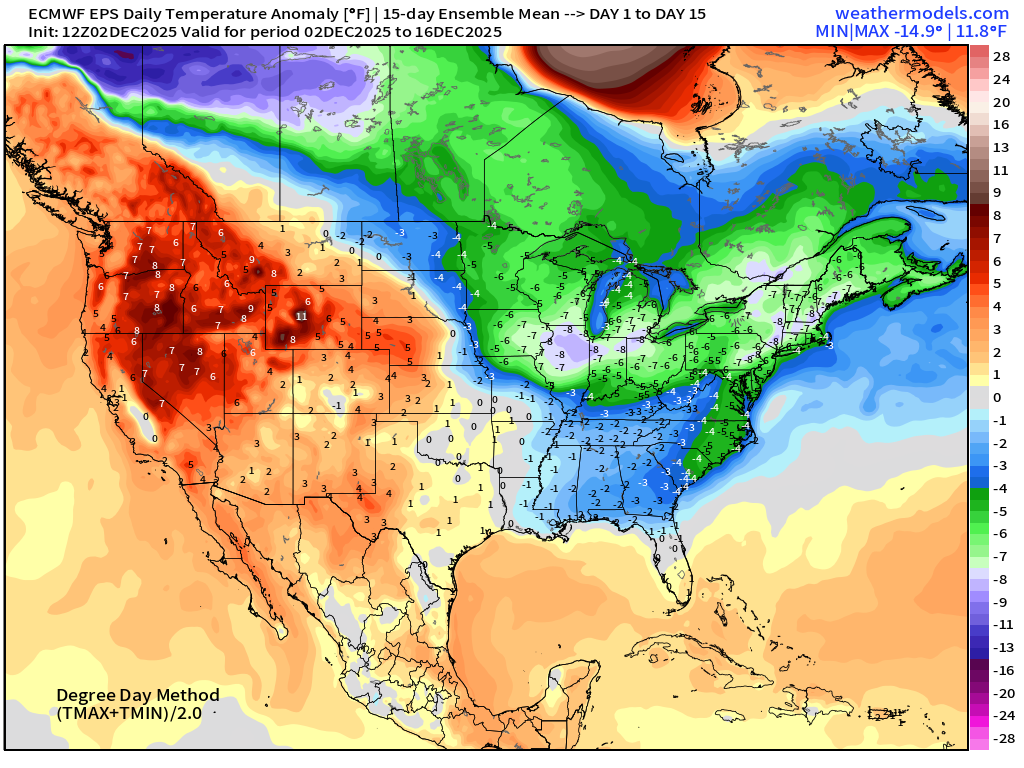
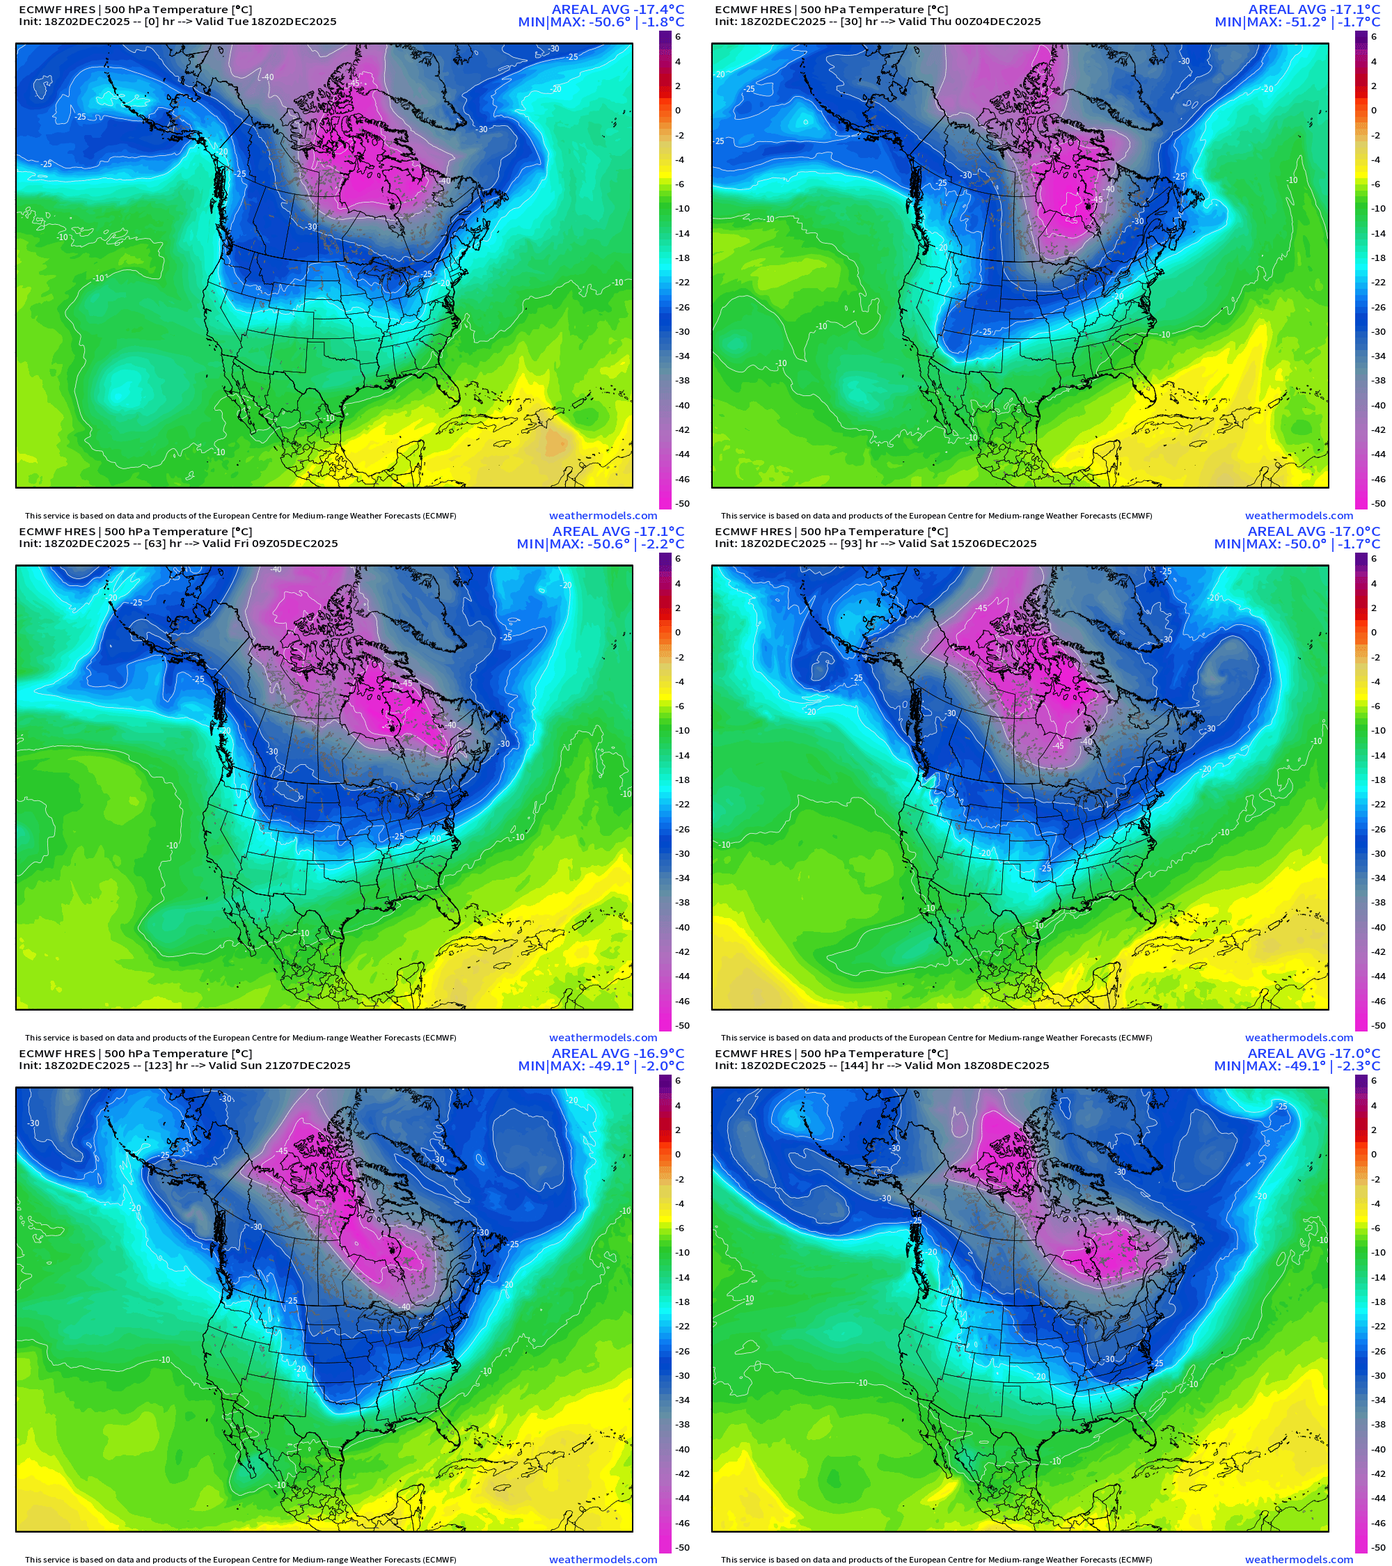
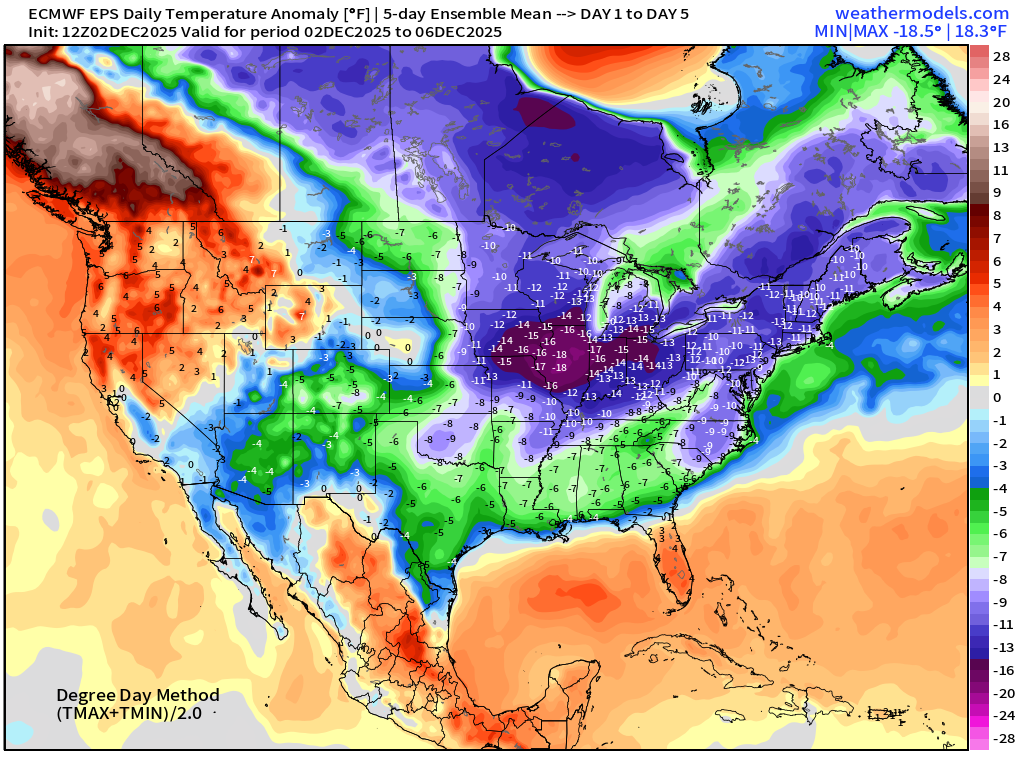
Main story for the next couple weeks is cold air entrenched in the Midwest, Great Lakes, and Northeast with the main tropospheric polar vortex perilously close to the Lower 48 locked onto a fulcrum over Hudson and James Bay. Shortwave impulses riding along the polar front / jet stream will grab lobes of the PV and keep Canadian Arctic air flowing southward.
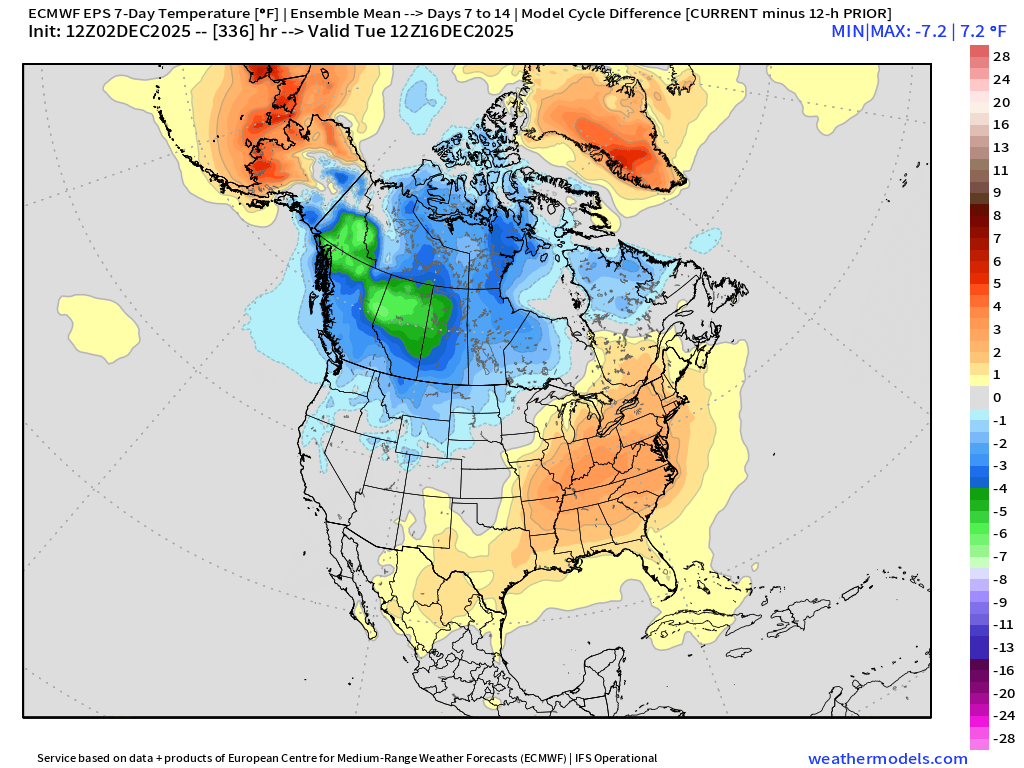
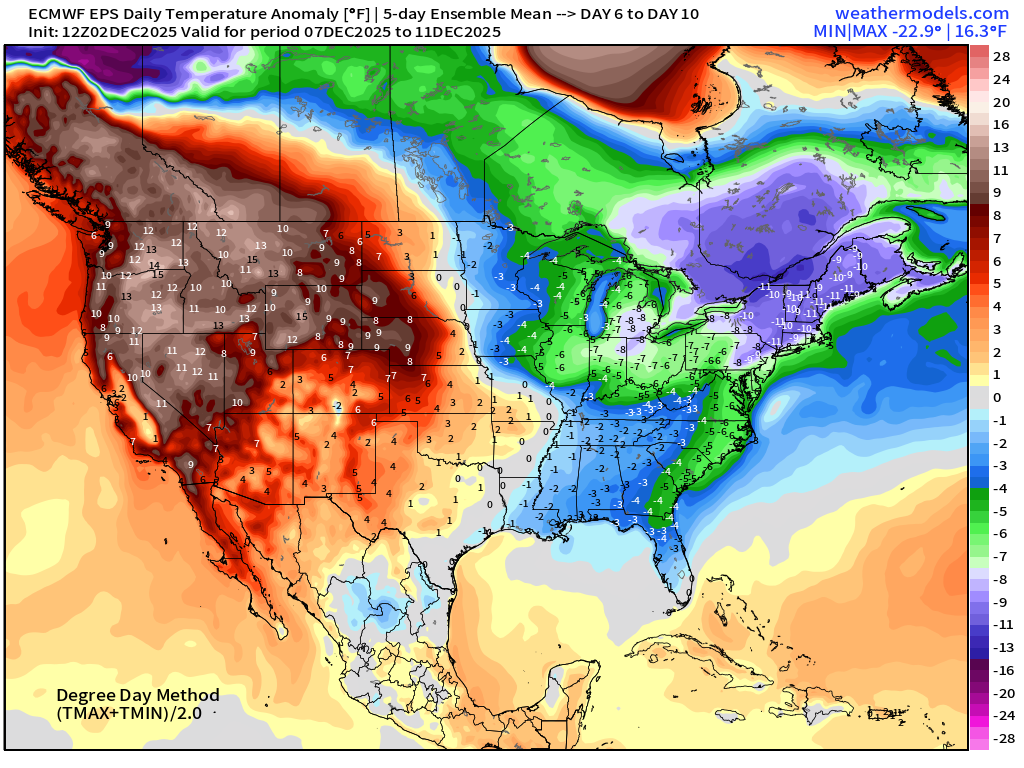
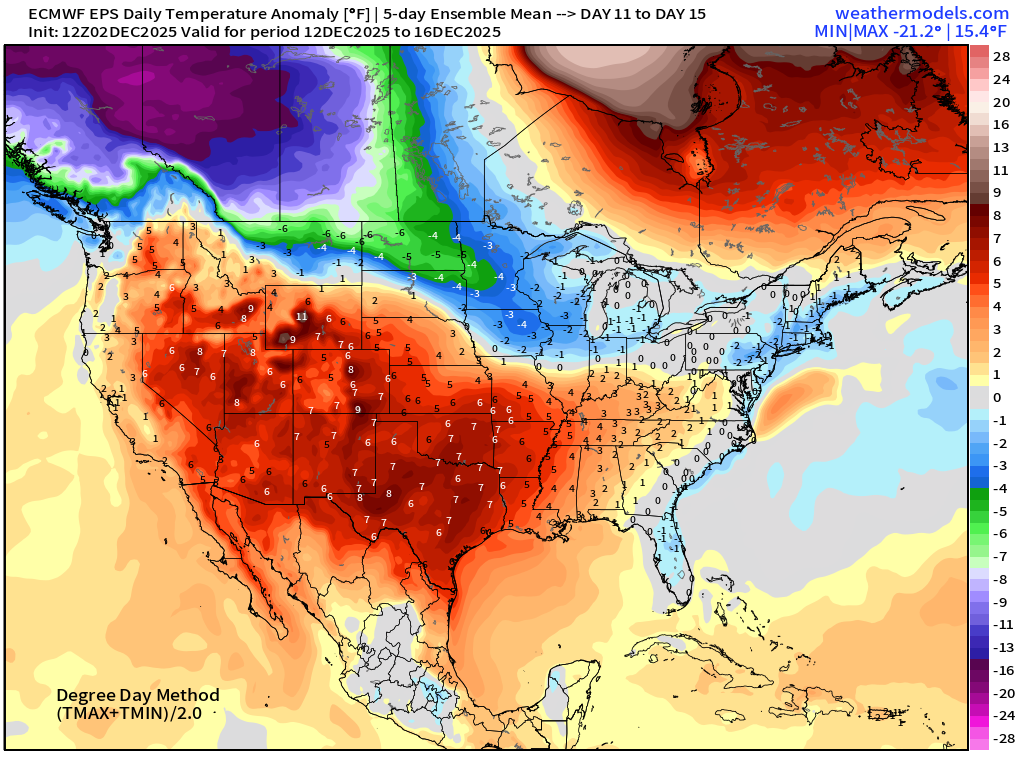
However, there is uncertainty about the strength of a subtropical ridge from the Pacific / Western U.S. extending into the Southeast into Day 10 (Dec 12th) that may keep the worst of the Arctic air at bay — and instead pooling/building in Western Canada and Alaska. The next “polar vortex” blast of cold air might be more of a Western U.S. / Rocky Mountain origin event rather than relying upon the Hudson Bay company PV. That’s welcome new for the already winter wearing Great Lakes and Northeast for a reprieve from the cold weather next week — but we’re going INTO winter and it’s eventually going to get a lot worse.
Week 2 Modeling is Warmer across Eastern US — ECMWF EPS 12z | 7-day Temperature Change from previous cycle — but colder in Western Canada
Precipitation Type | Weather Next 6-days | ECMWF 18z
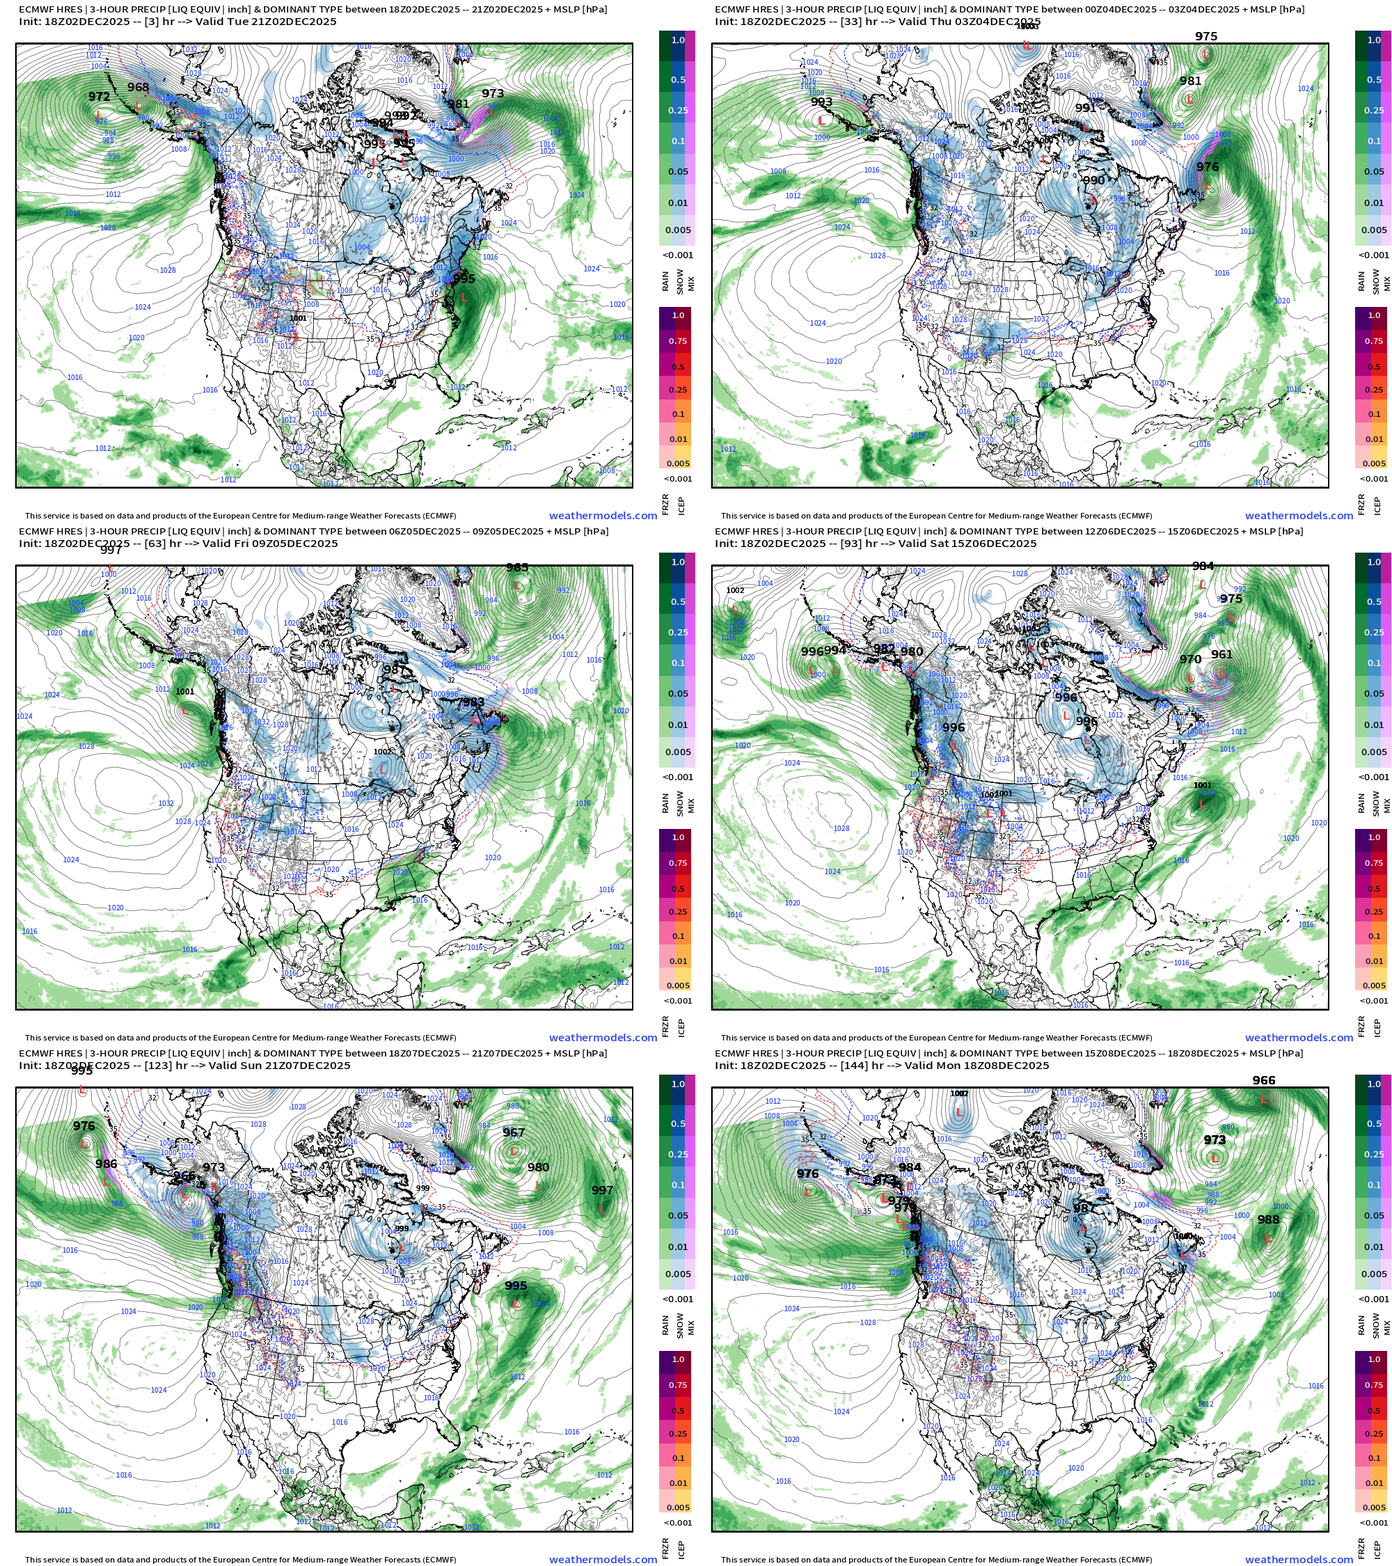
Weak Cutter System late Friday
15-day Stratosphere | EPS Ensemble Mean 10 mb Wind and Temperature Anomaly —> Sudden Warming Event #2 still scheduled
Headlines Tuesday Evening
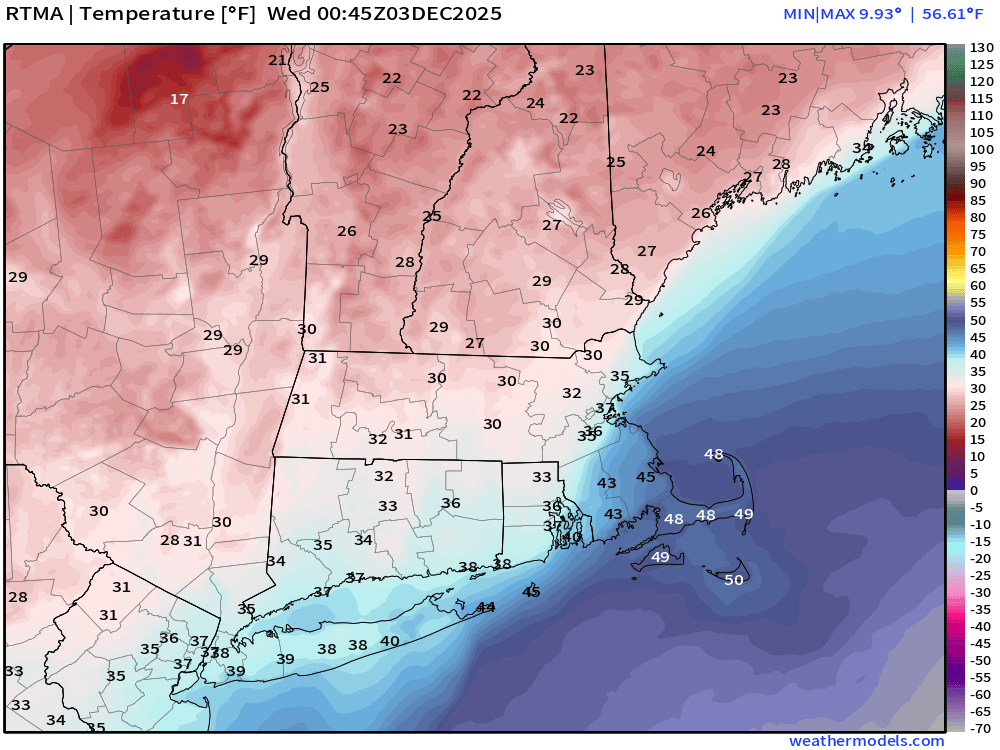
Nor’easter sliding of the coast of New England — bringing the first plowable snow to New Hampshire and Vermont + Maine. The low pressure is close enough to the coast to prevent cold air aloft from eroding the marine influence — so we have 35°F and rain in Boston! Only light accumulations of snow or mixture will affect the I-95 corridor into the evening hours.
A weak cutter-type storm system might providing a quick burst of mixture/snow for Washington D.C. into VA and NC — 1” to 3” accumulations
Subtropical ridging in the Southeast could keep the Arctic / Polar Vortex at bay with more mild temperatures into next week — we’ll see.
Sudden Stratospheric Warming event #2 (see yesterday’s explainer post)
Temperature Analysis | 7:45 PM ET
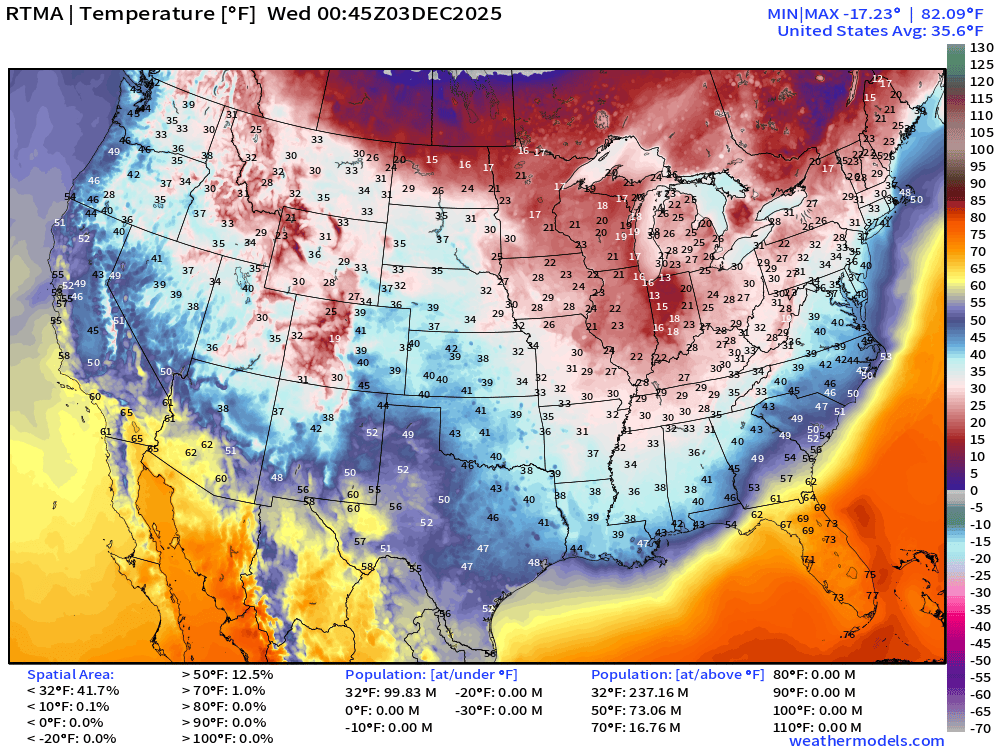
Temperature Anomaly | 7:45 PM ET
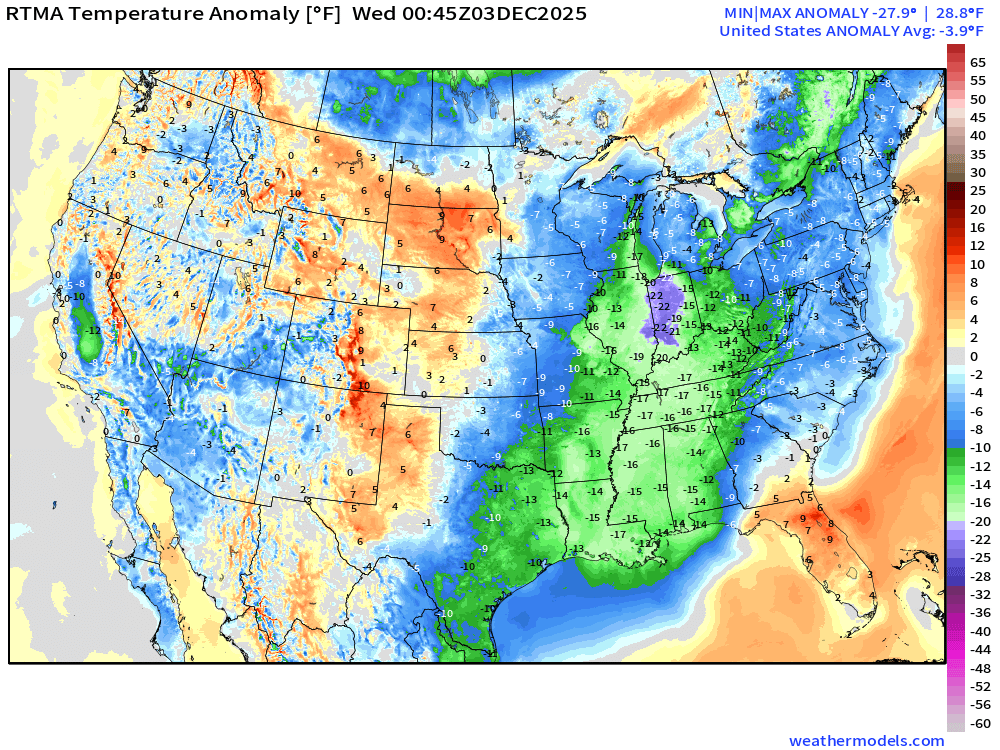
Lower 48 Temperature Anomaly was -3.9°F below normal
HRRR 22z | Simulated Radar Next 18-hours into Wednesday 11AM ET
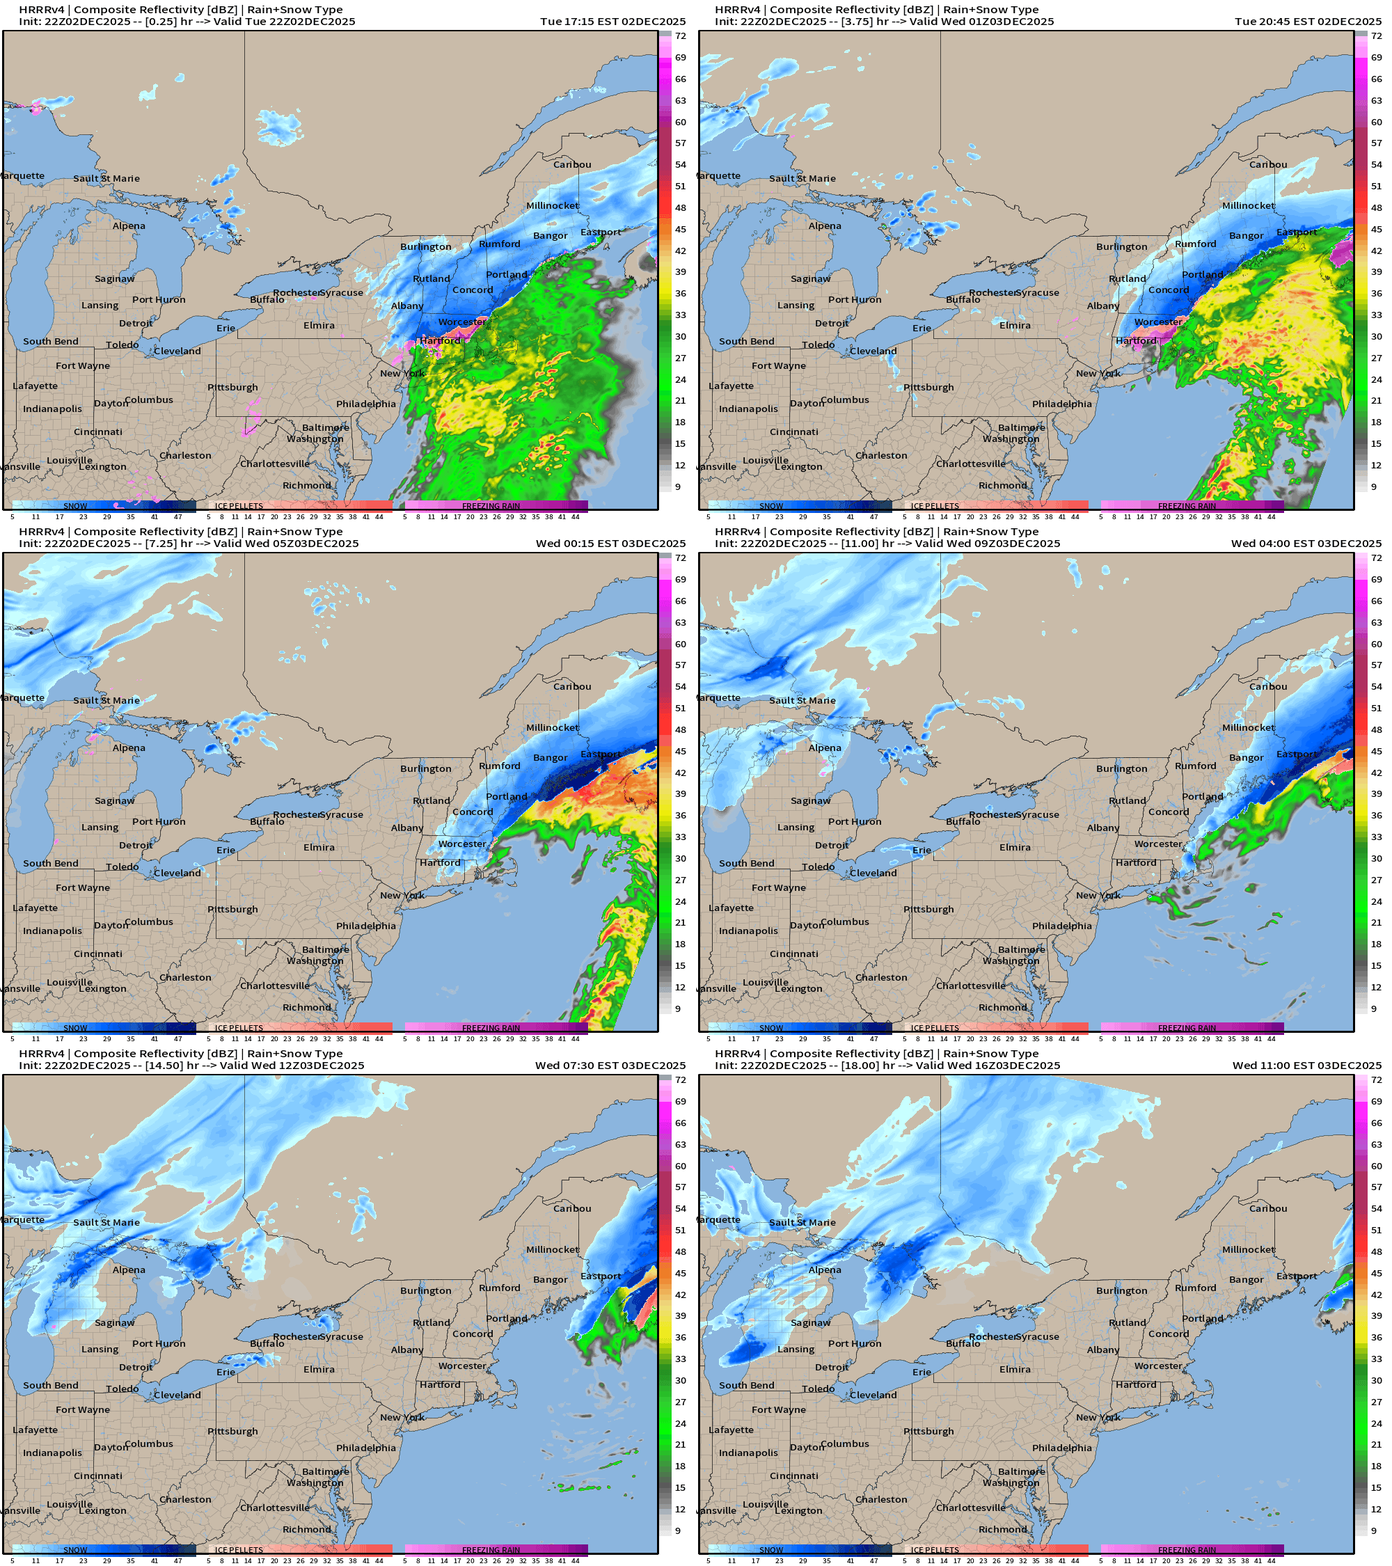
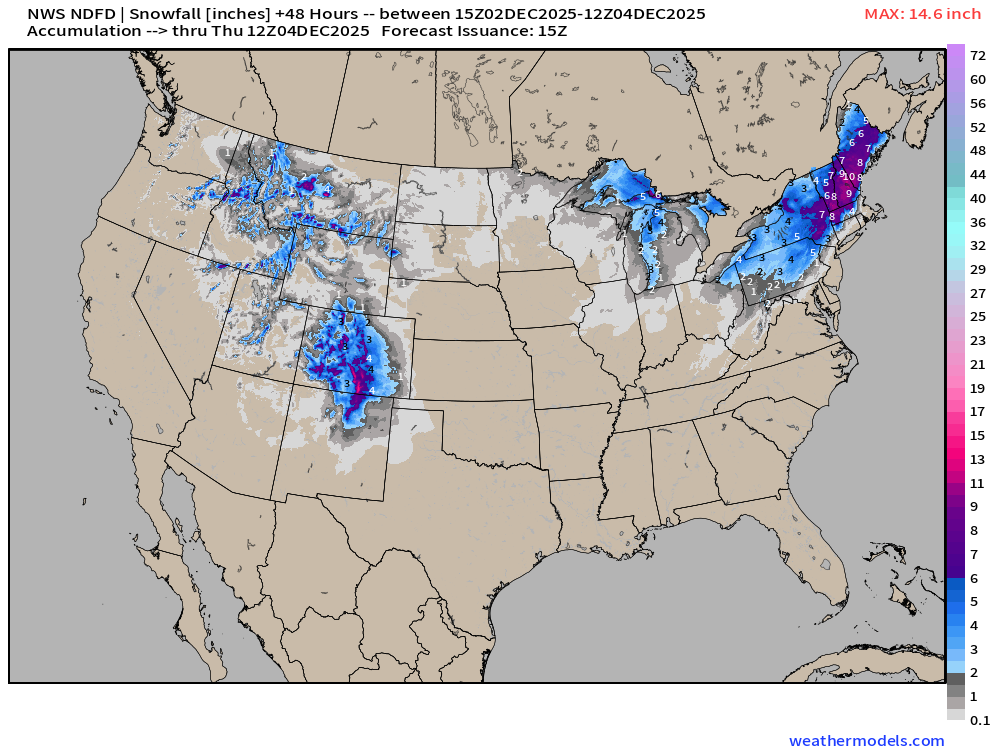
New England: less than 100-miles = difference between 20 million more getting 6”-12” rather than inland
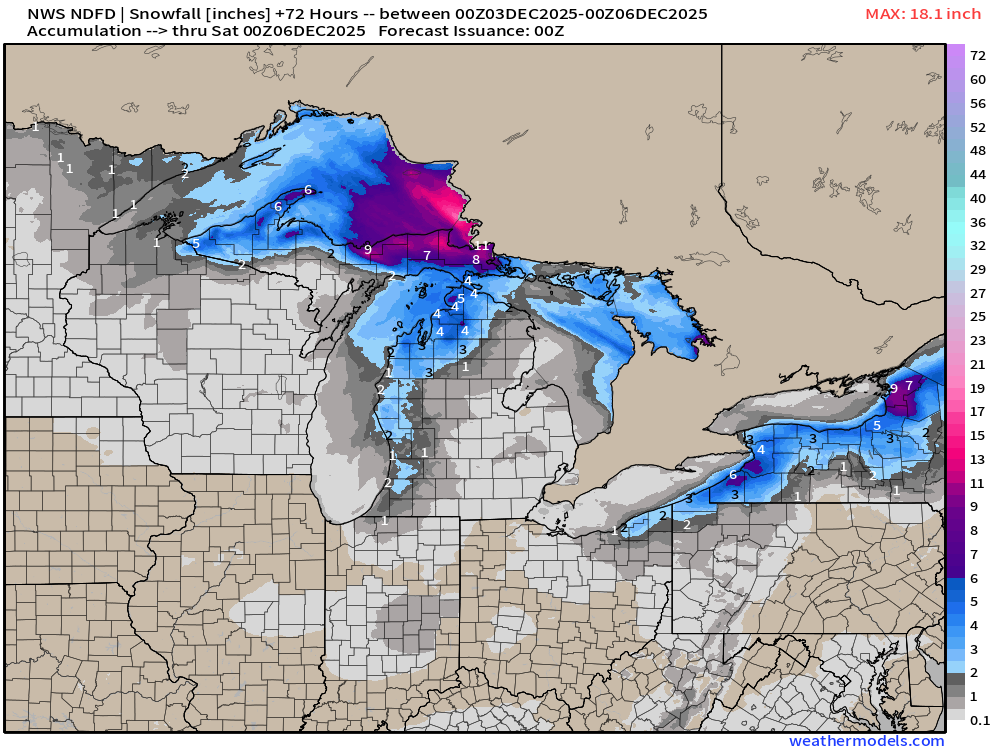
More snow showers in the Great Lakes — oh joy! Schools were closed along Lake Michigan shoreline
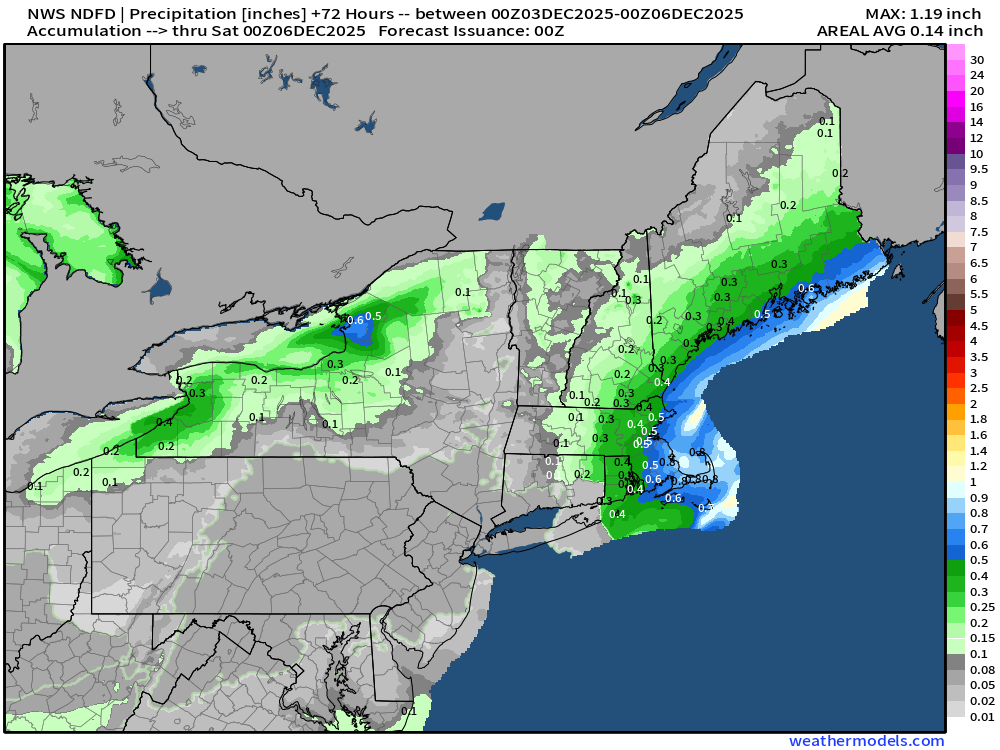
NWS Precipitation Next 72-hours
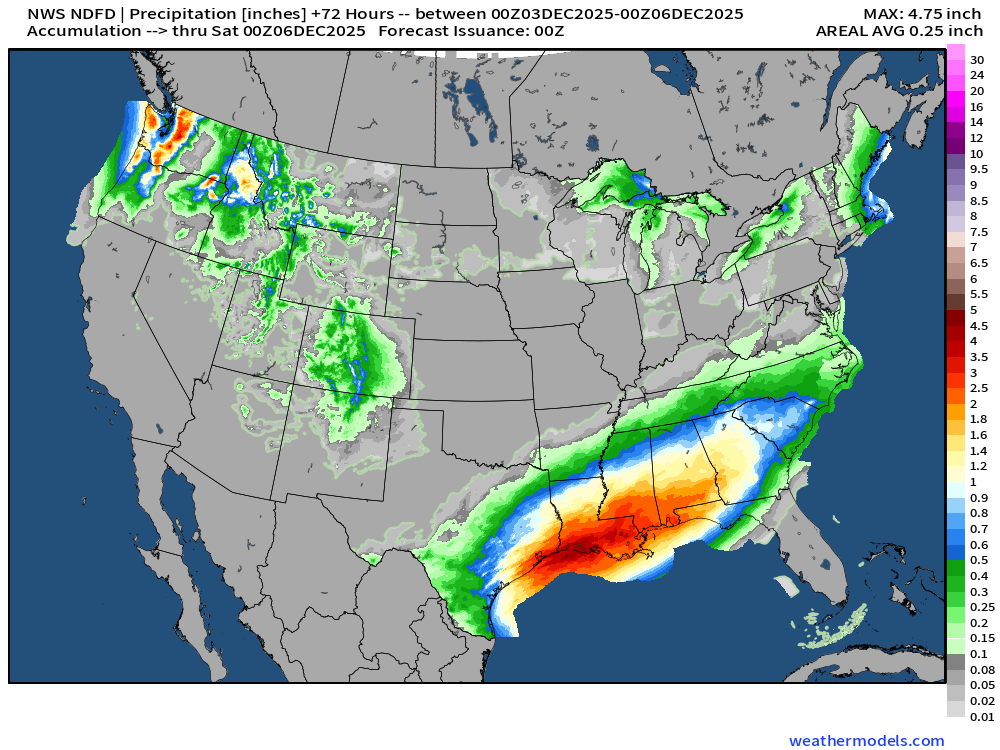
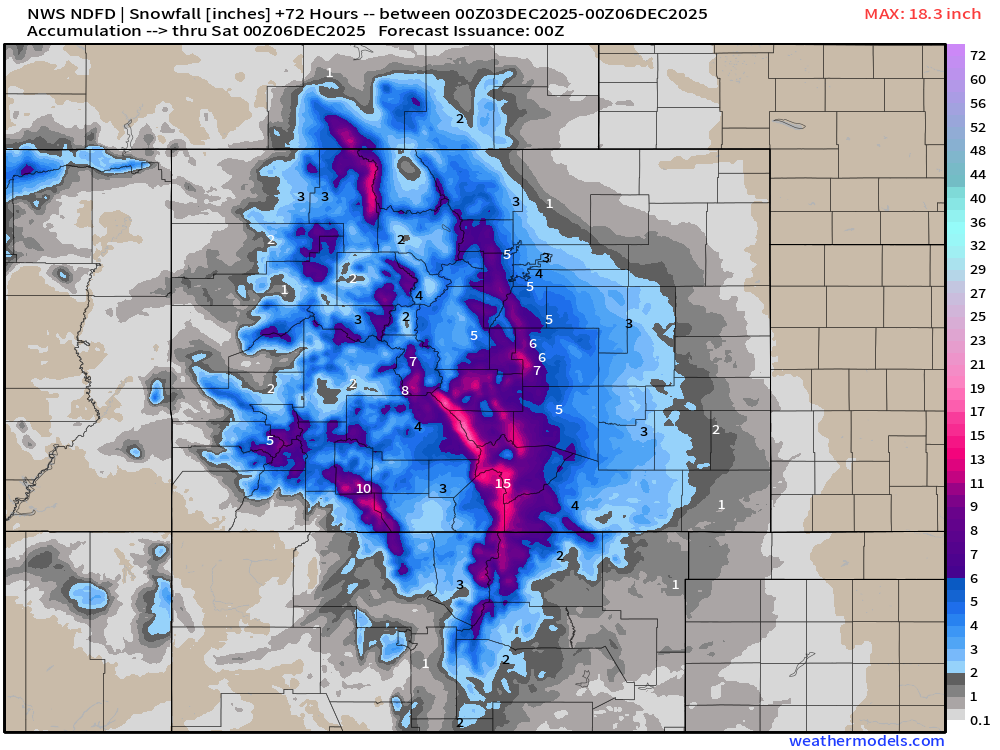
NWS Snowfall Next 72-hours
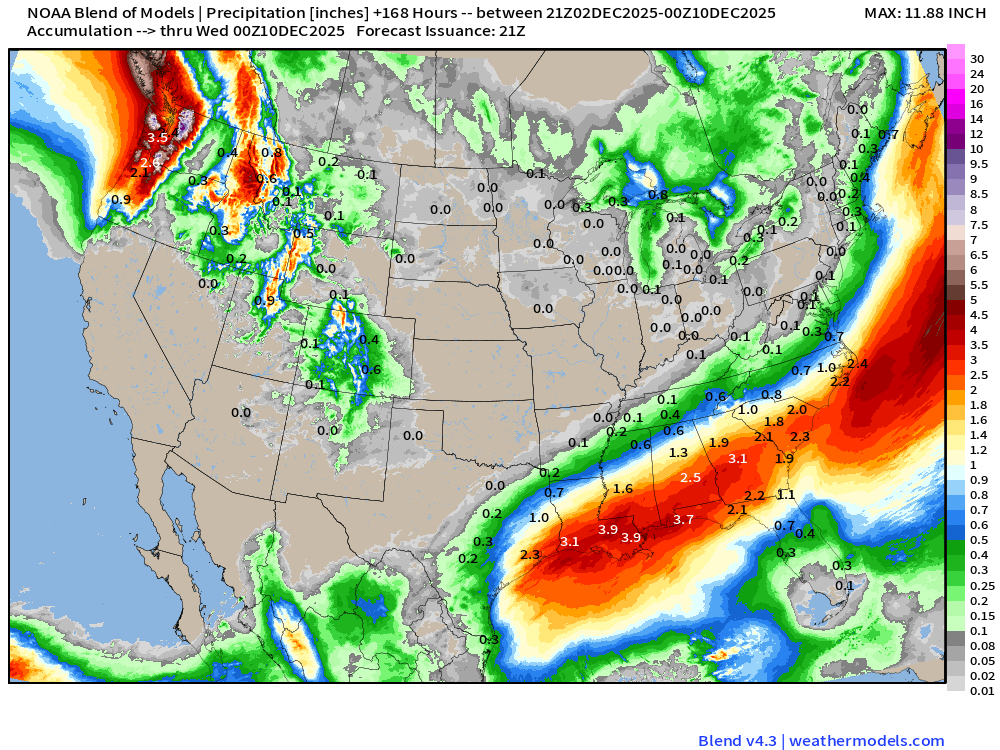
Blend of Models | 7 Days Precipitation Total (includes liquid from snow)
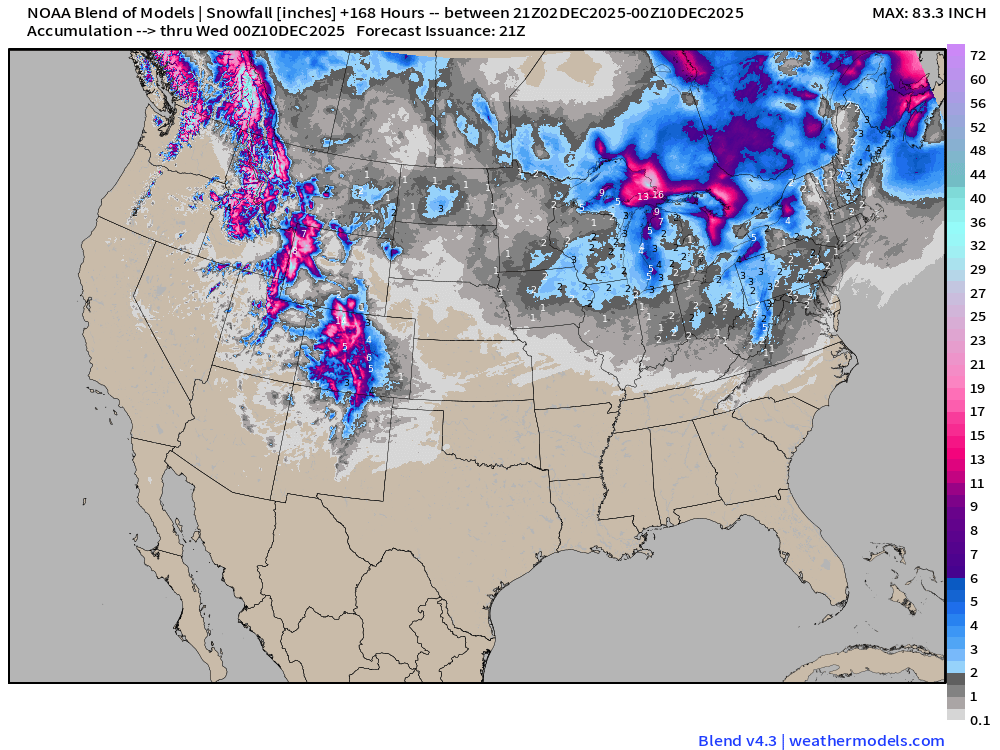
Blend of Models | Total Snowfall Next 7-Days
Wednesday Morning Low Temperatures
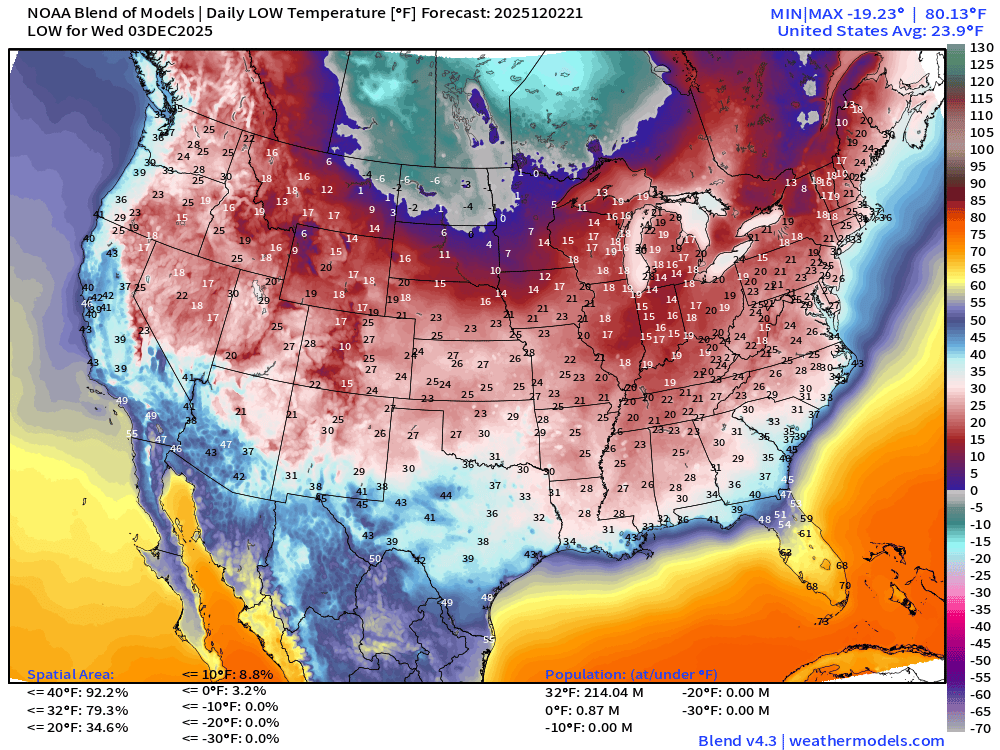
214 million below freezing (Lower 48 average low is 23.9°F)
Wednesday High Temperatures
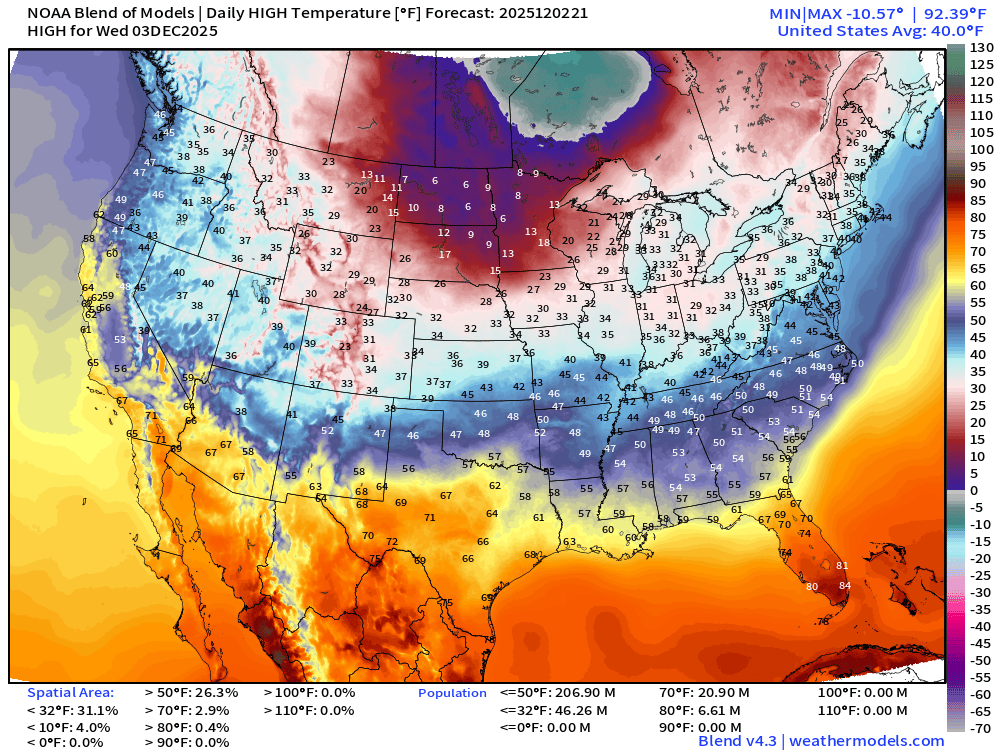
Still 46 Million remain below freezing for high temperatures — 80s in south Florida
Thursday Low Temperatures
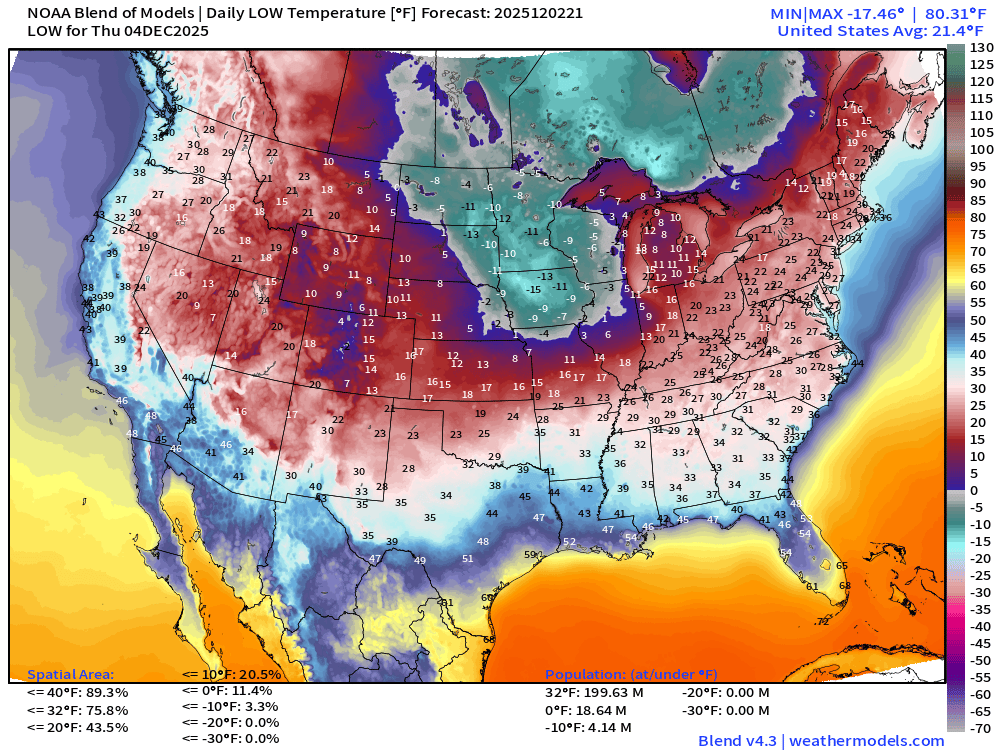
200 million below freezing (Lower 48 average low is 21.4°F)
Friday Low Temperatures
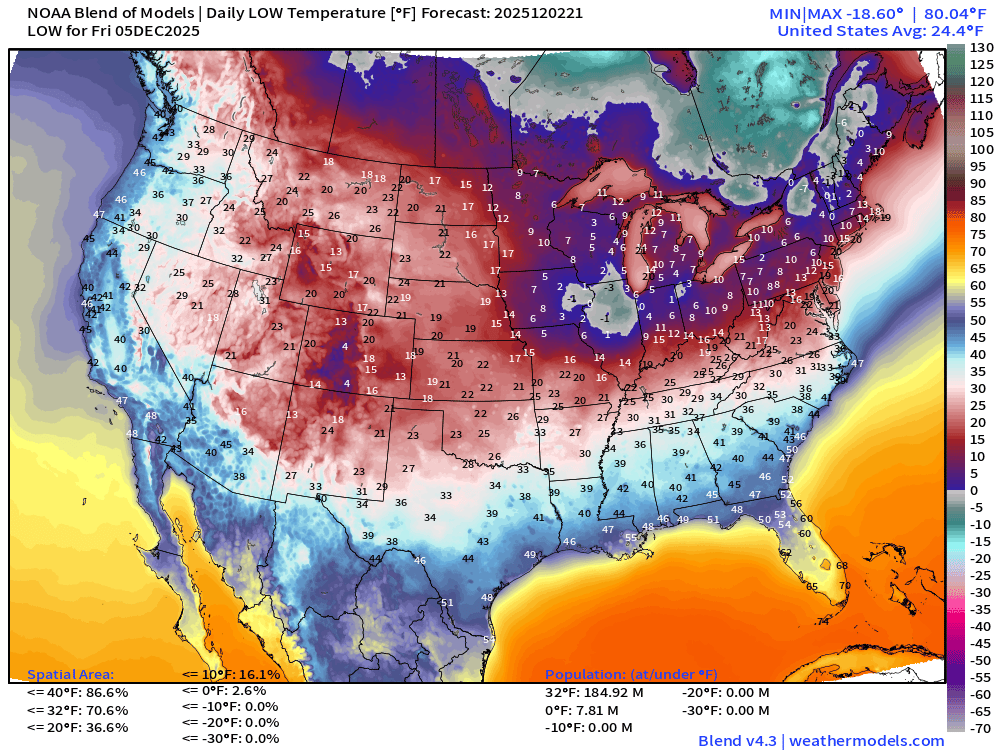
185 million below freezing (Lower 48 average low is 24.4°F)
ECMWF 18z | 500 mb Temperatures | Polar Vortex Watch Next 6-days
ECMWF EPS 12z | 15-day Ensemble Mean Temperature Anomaly
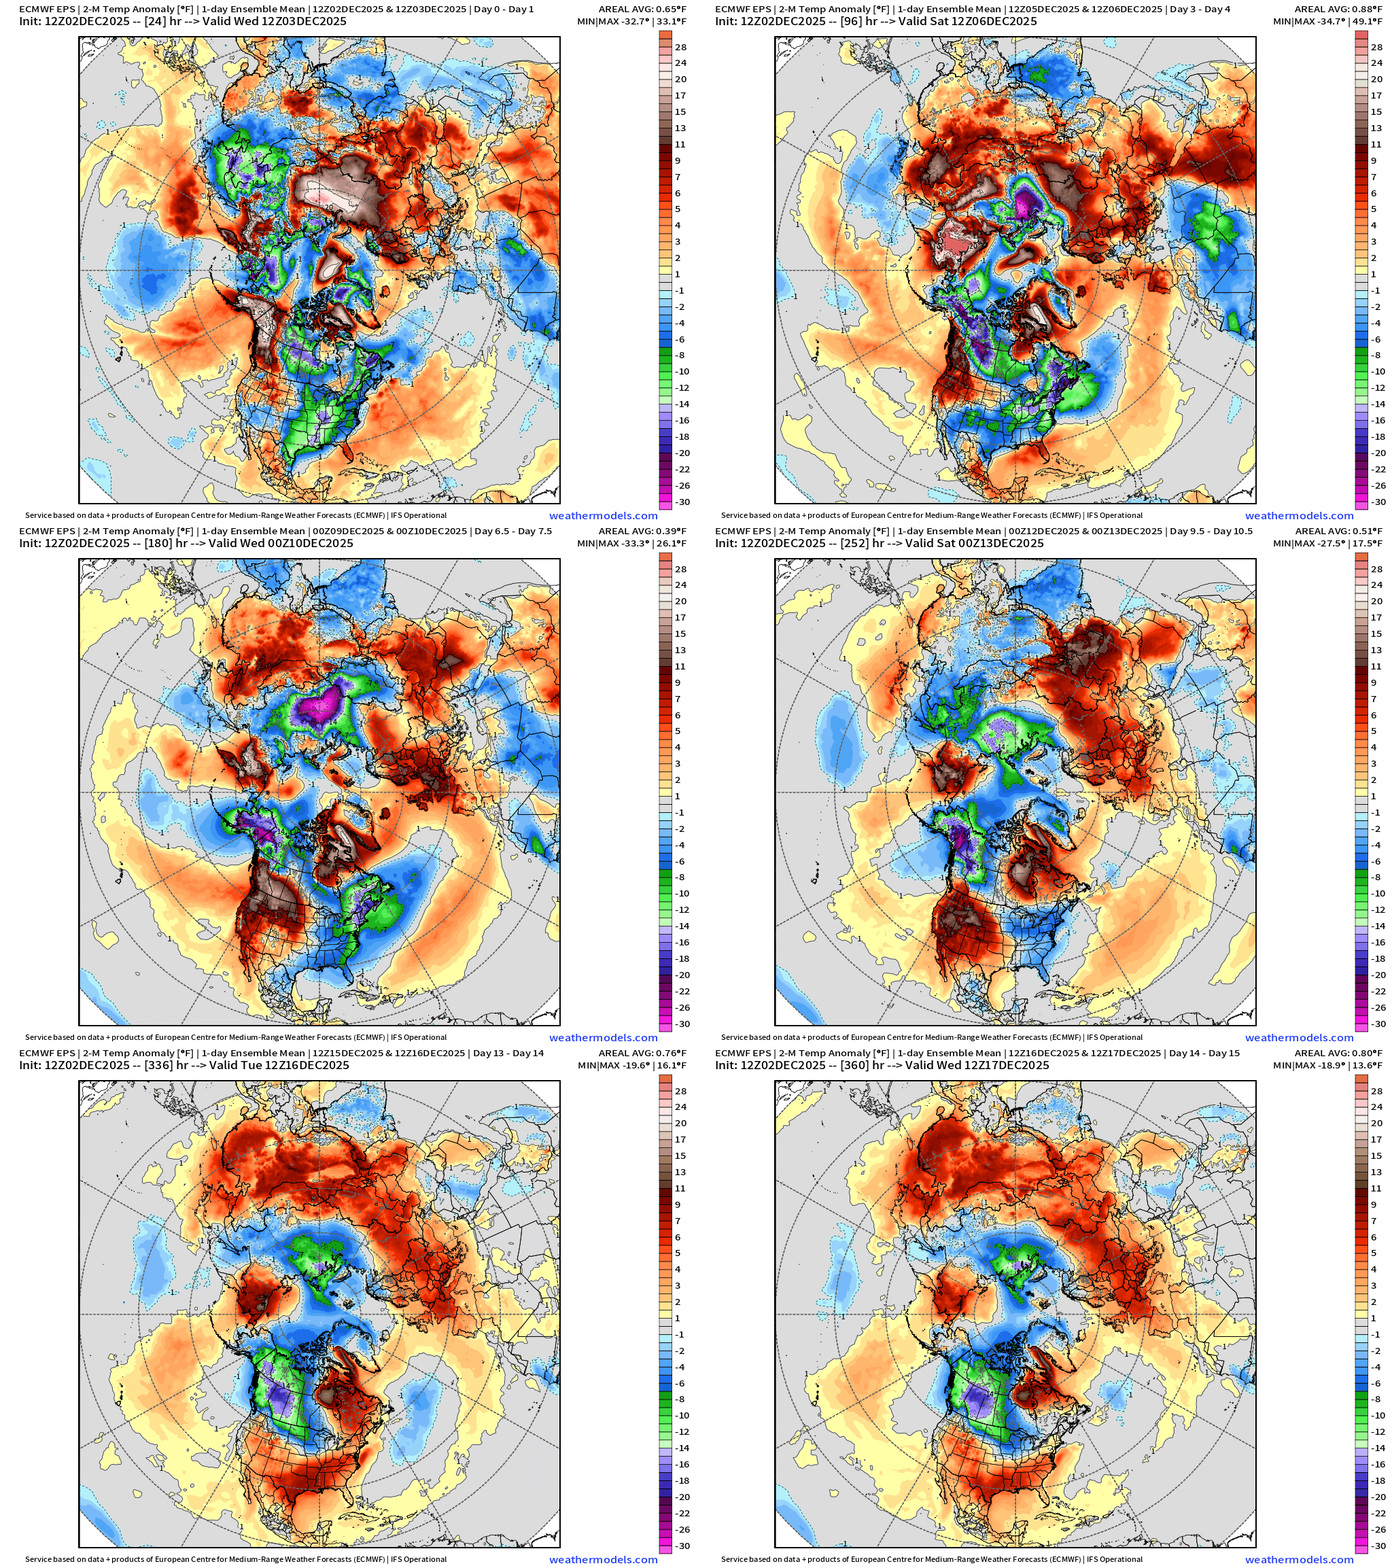
Flagship European model ensemble solution for temperature anomaly next 15-days
ECMWF AIFS-Single 18z | Height Anomaly (500 hPa) Next 10-days
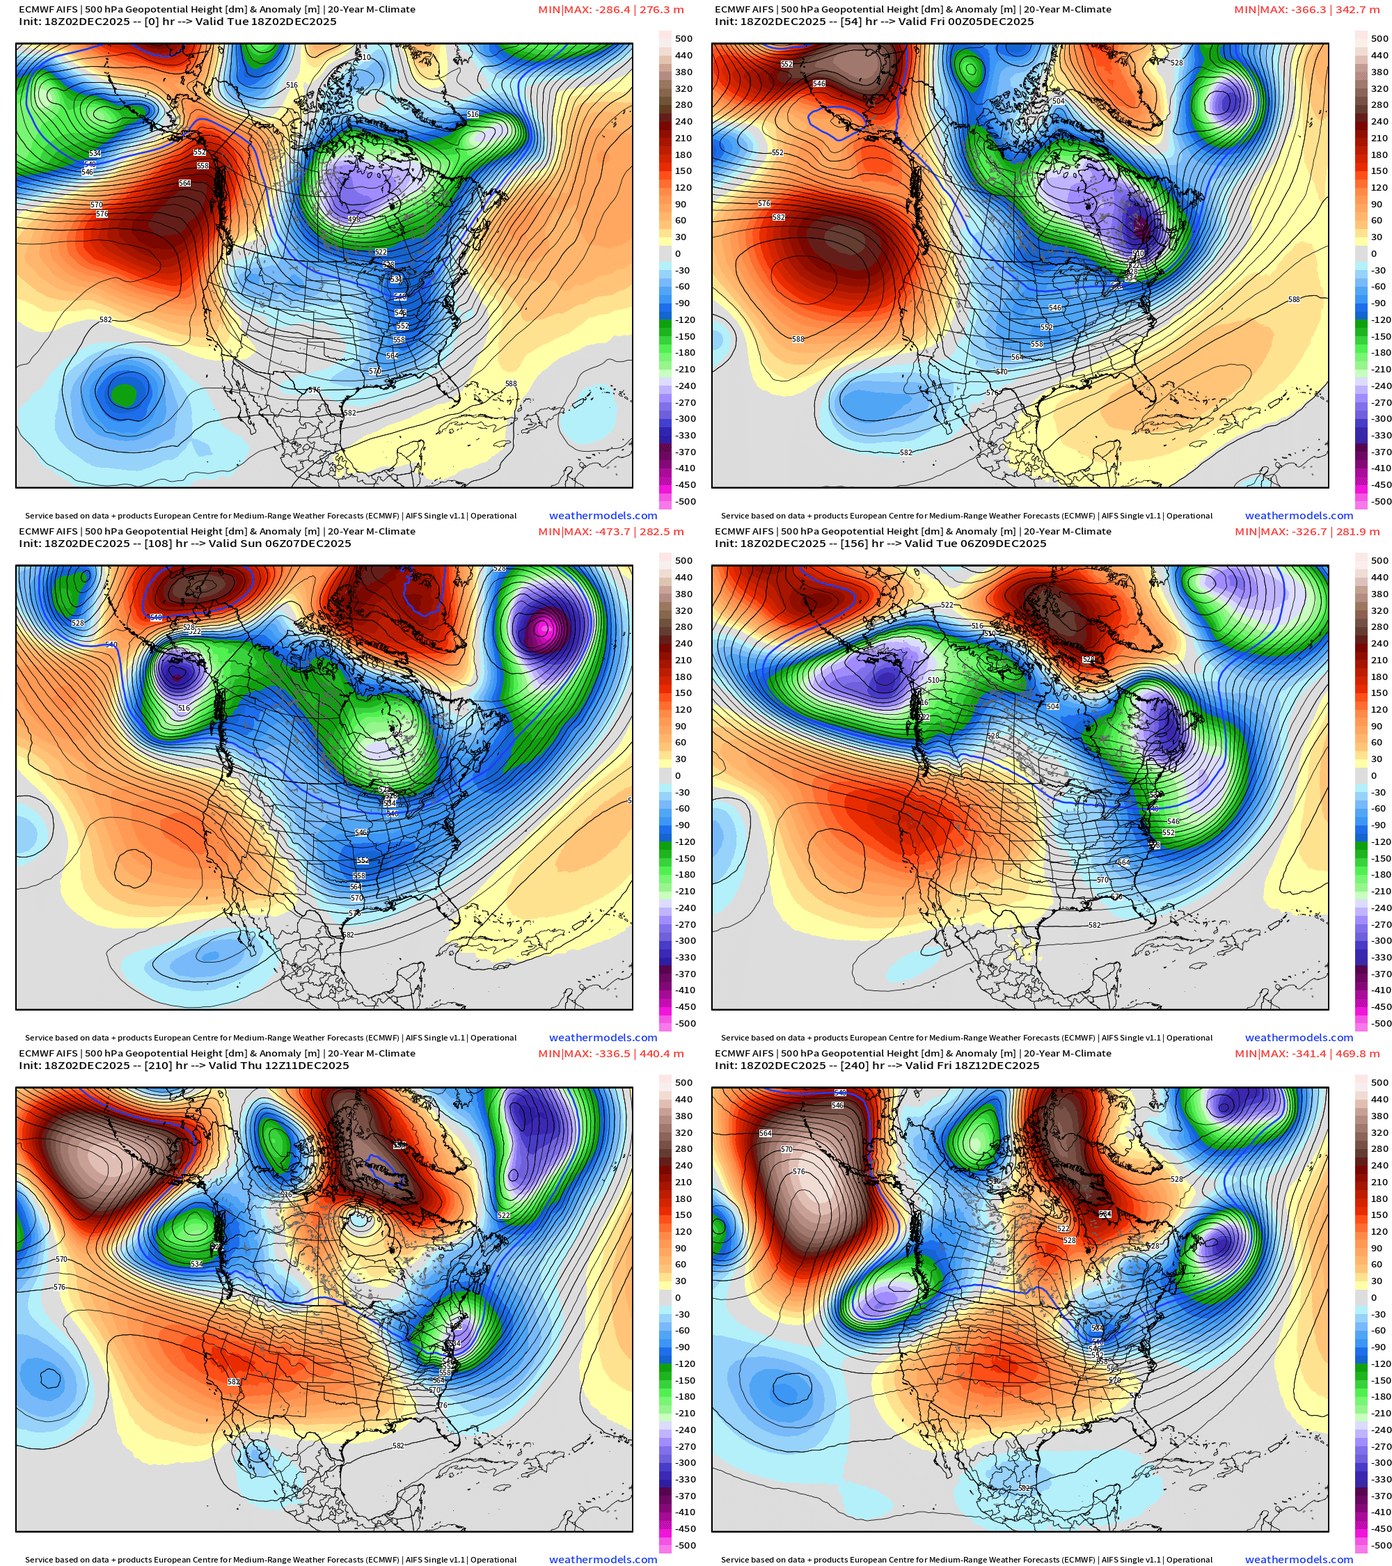
Day 10 Height Anomaly Products from NOAA —> GFS/GEFS + AI-GFS/AI-GEFS
All look quite similar … with uncertainty in the magnitude of the Pacific NW trough vs. ridge in the Southwest
Comparison with ECMWF Suite of Full-Physics and AI modeling
Uncertainty: Top left of the second window of 4 charts —> ECMWF IFS (Control) which has a much more intense trough in the Pacific Northwest —> and stronger ridge in the Southeast/Eastern U.S.
Integrated Vapor Transport Next 10-days
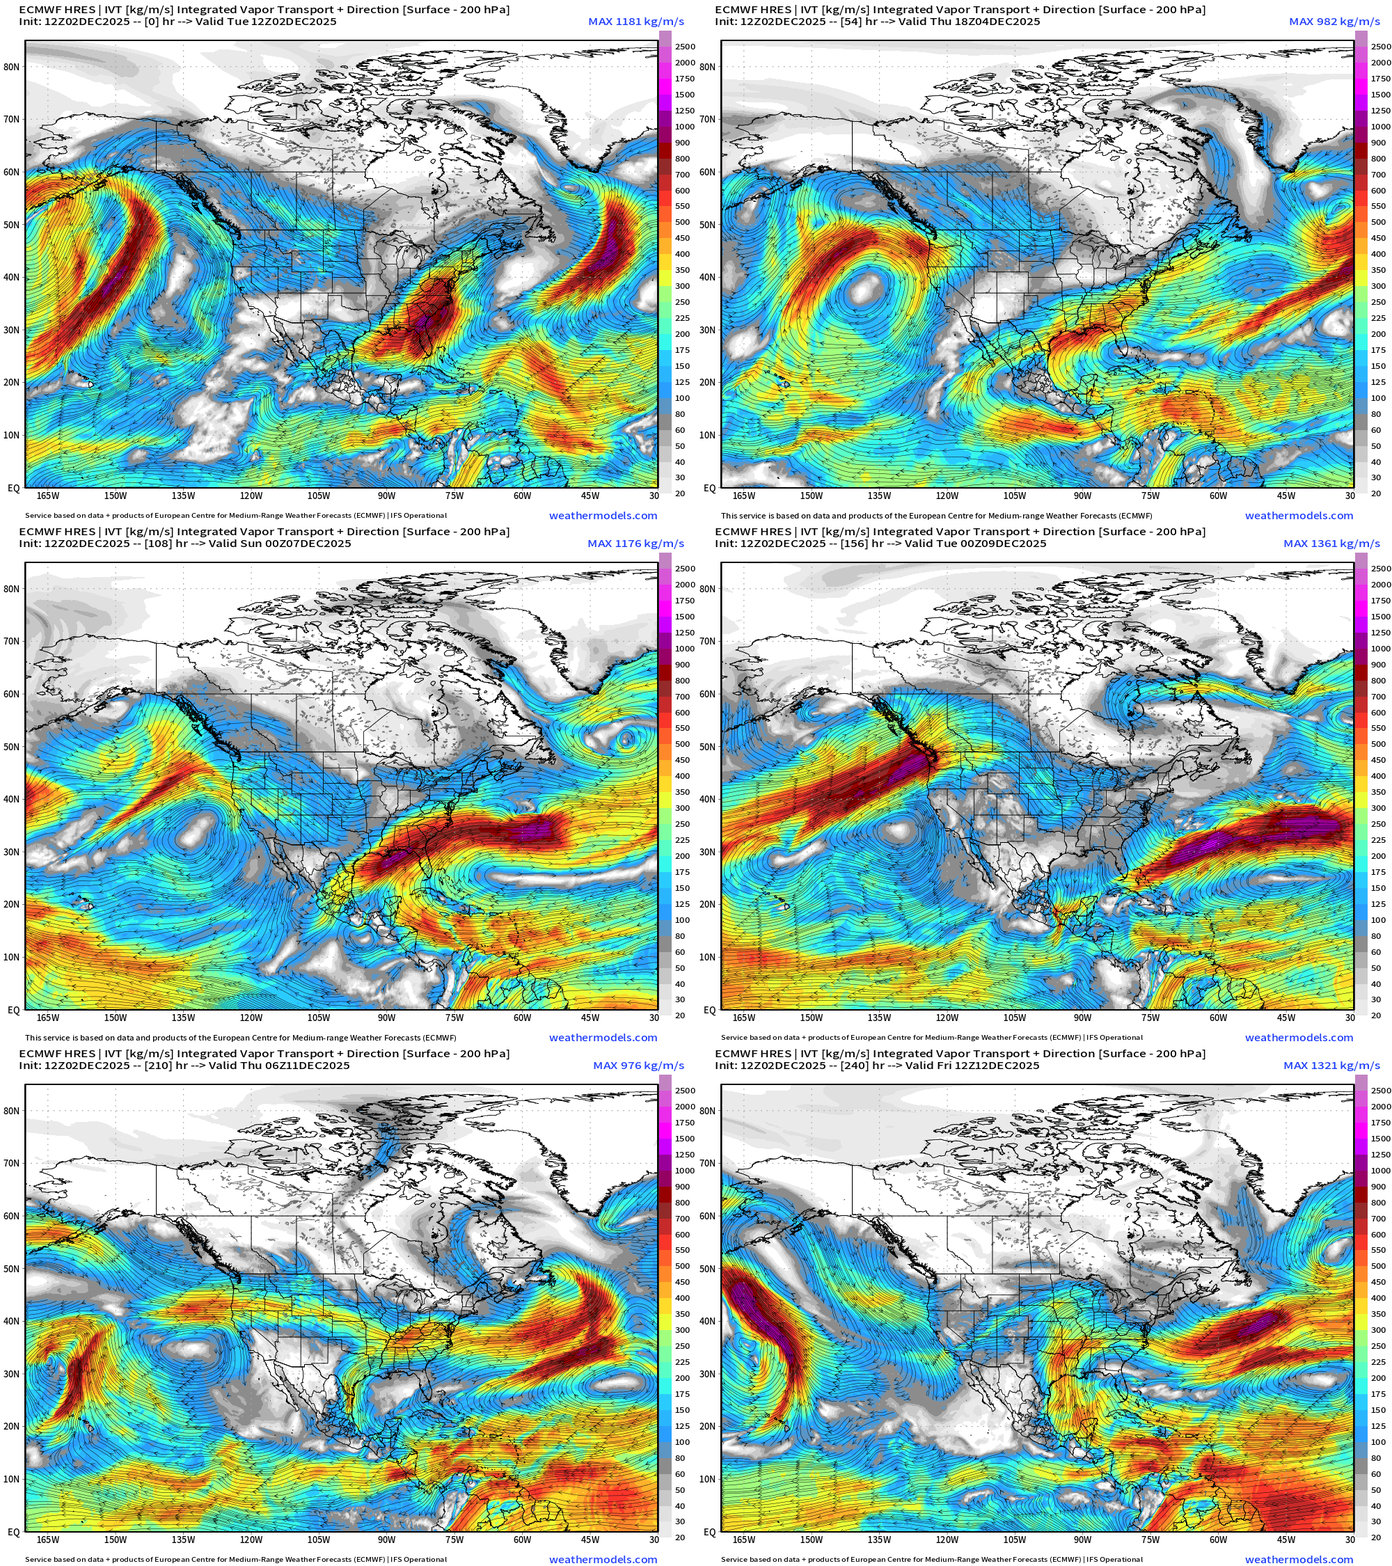
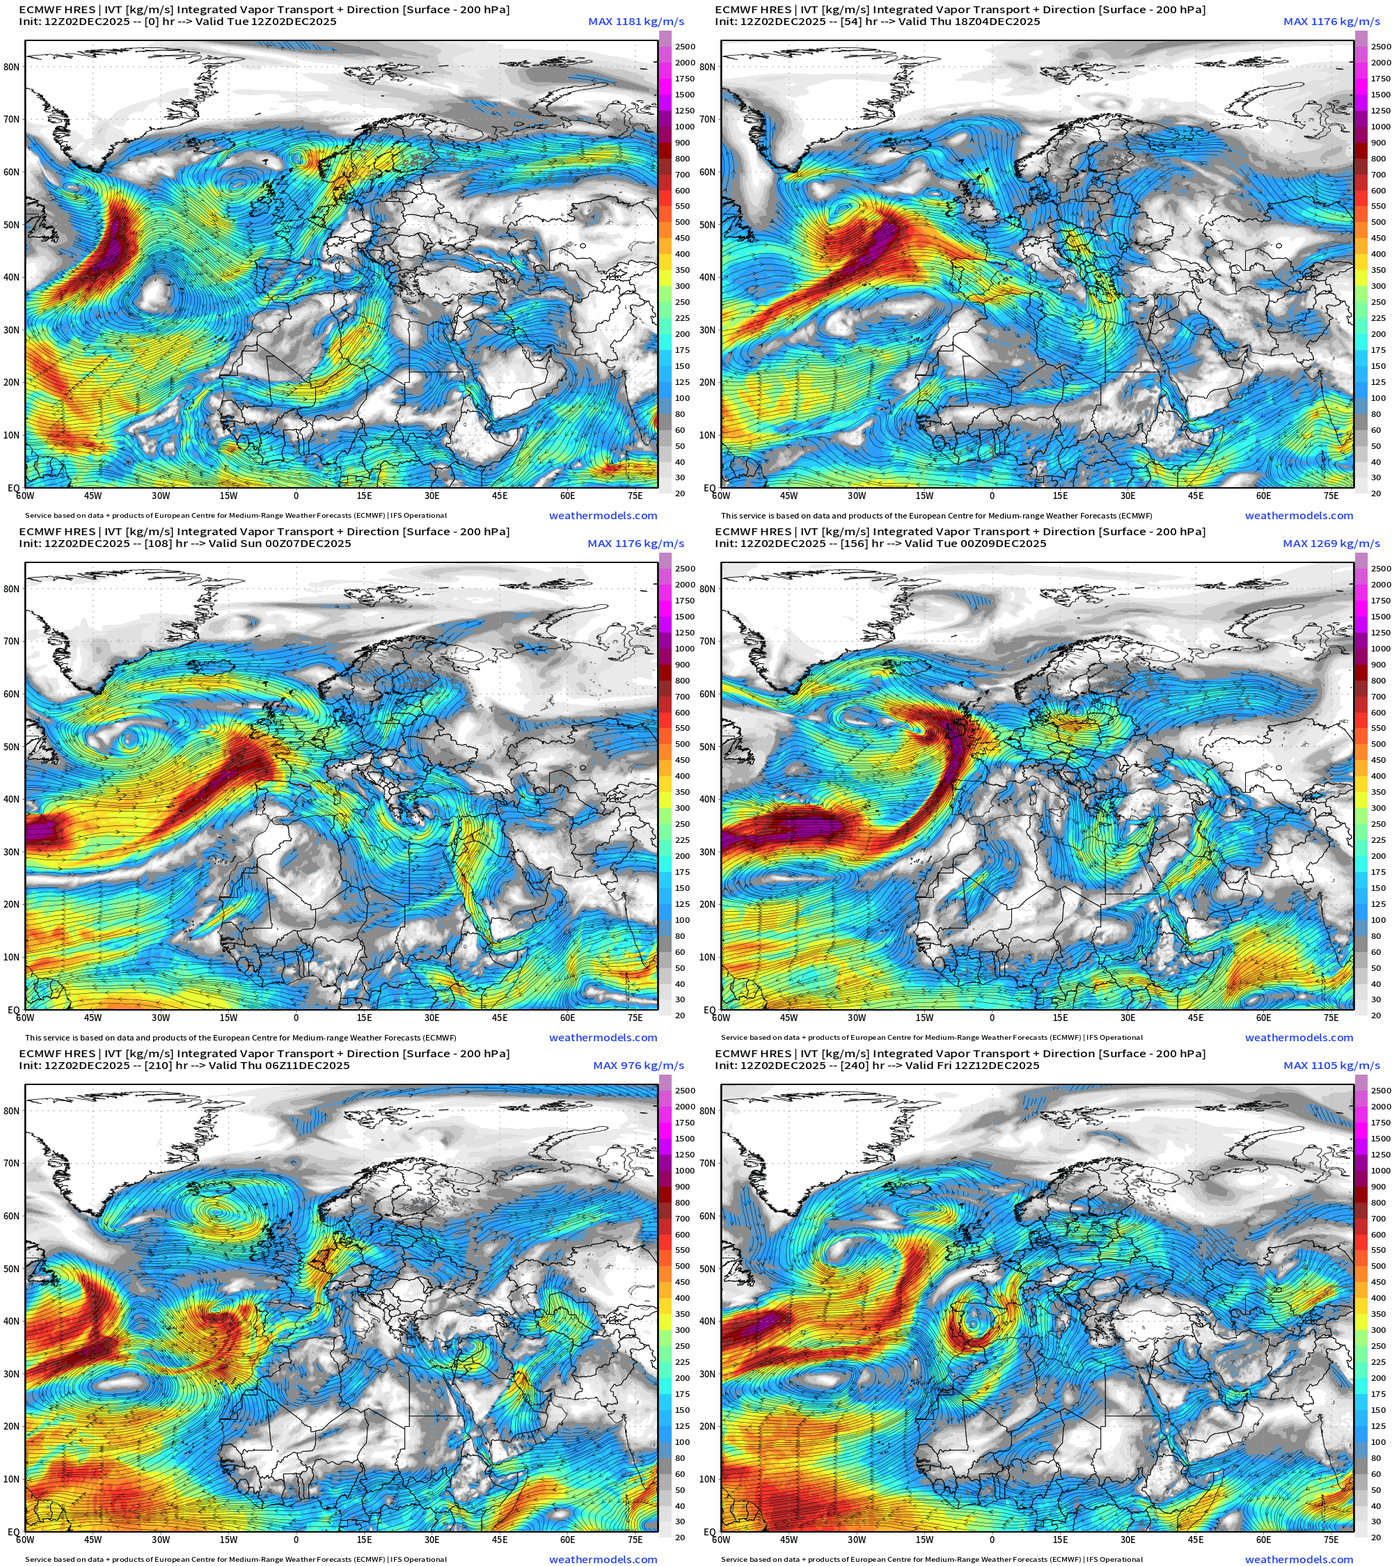
Parameter used for monitoring “atmospheric rivers” usually along the U.S. west coast, but the idea works well for many other areas — highlighting midlatitude storm systems with warm conveyor belts (moisture plumes)
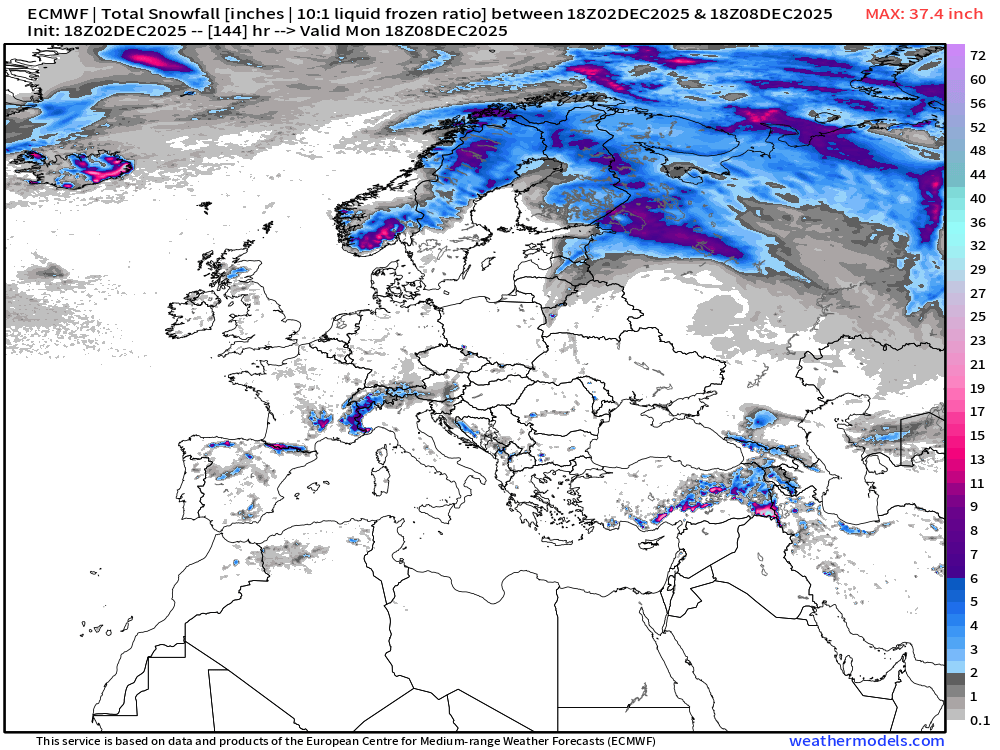
ECMWF 18z | Snowfall | Next 6-days
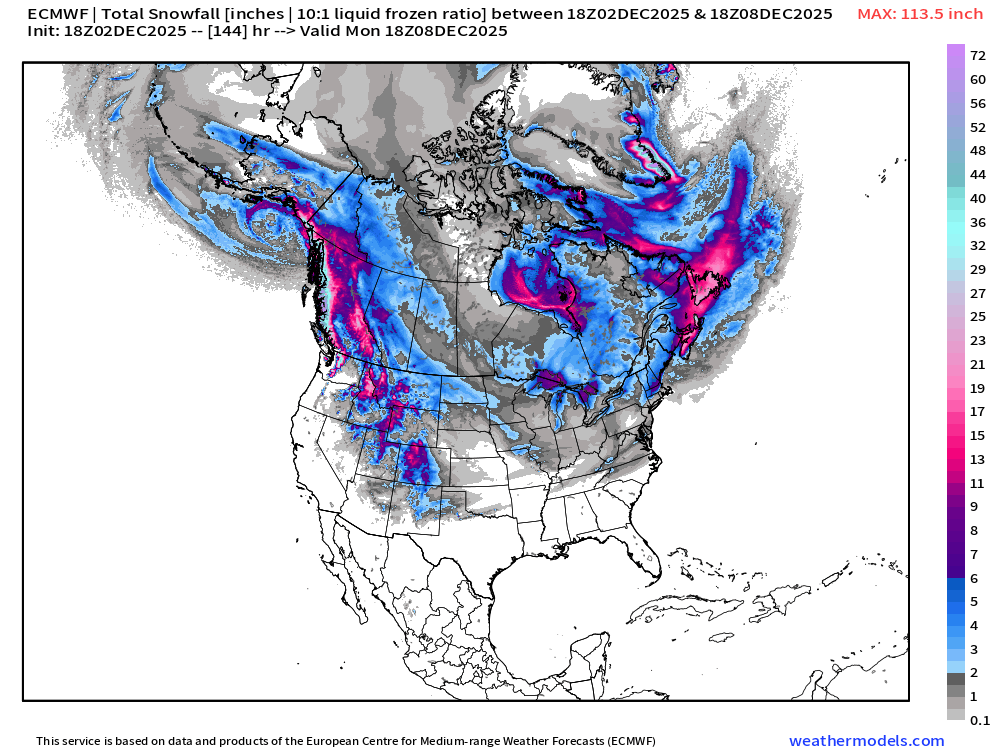
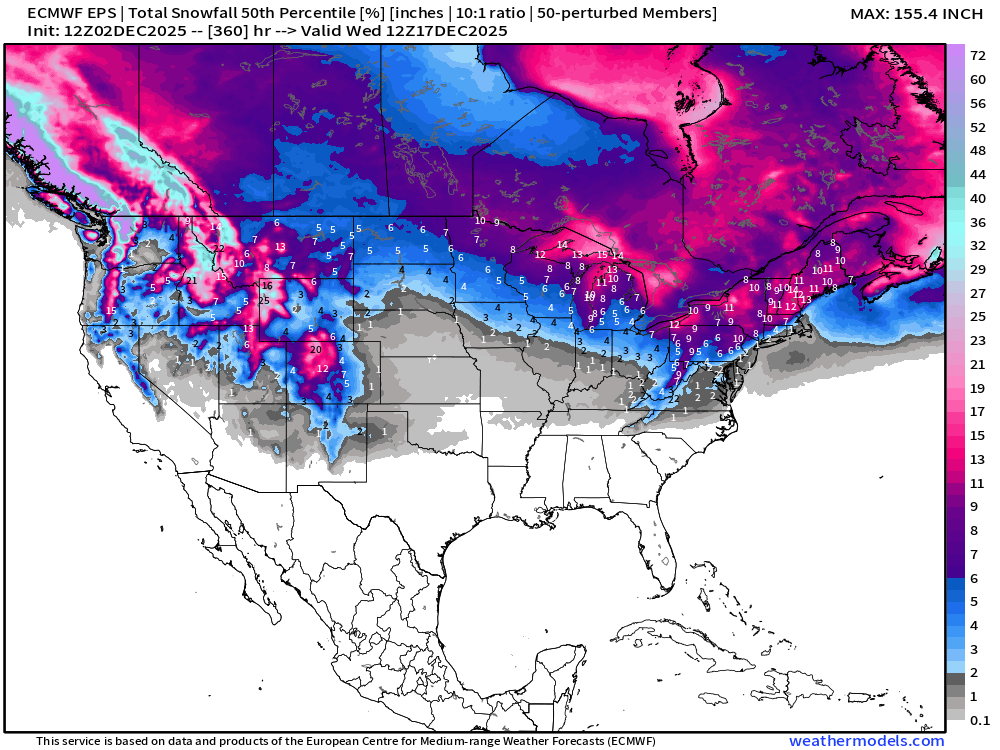
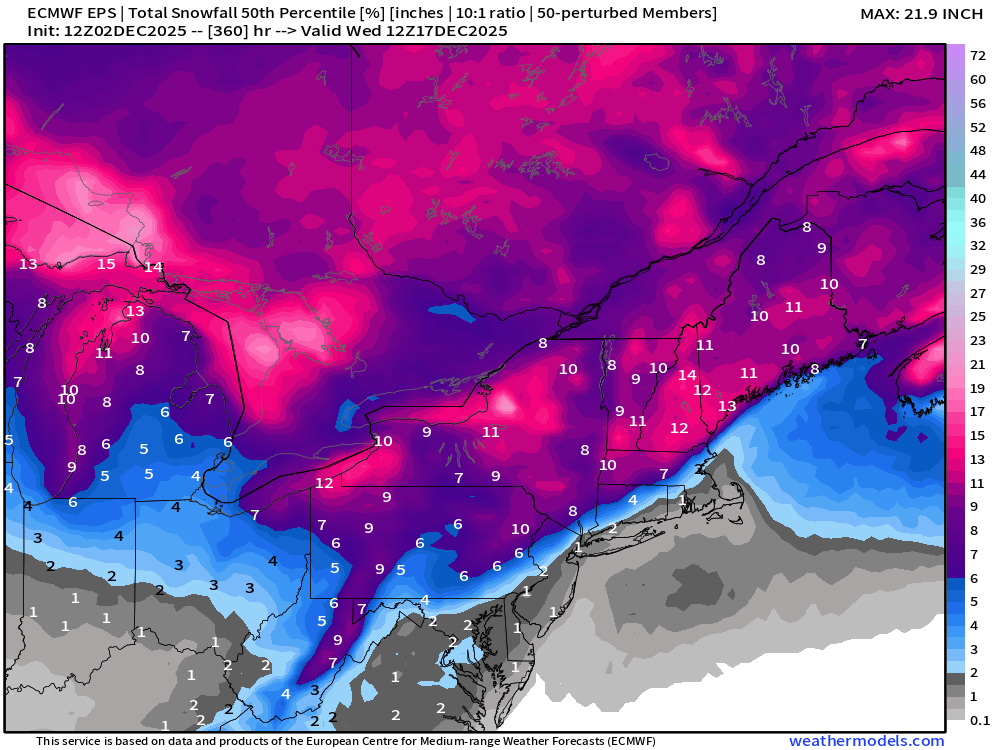
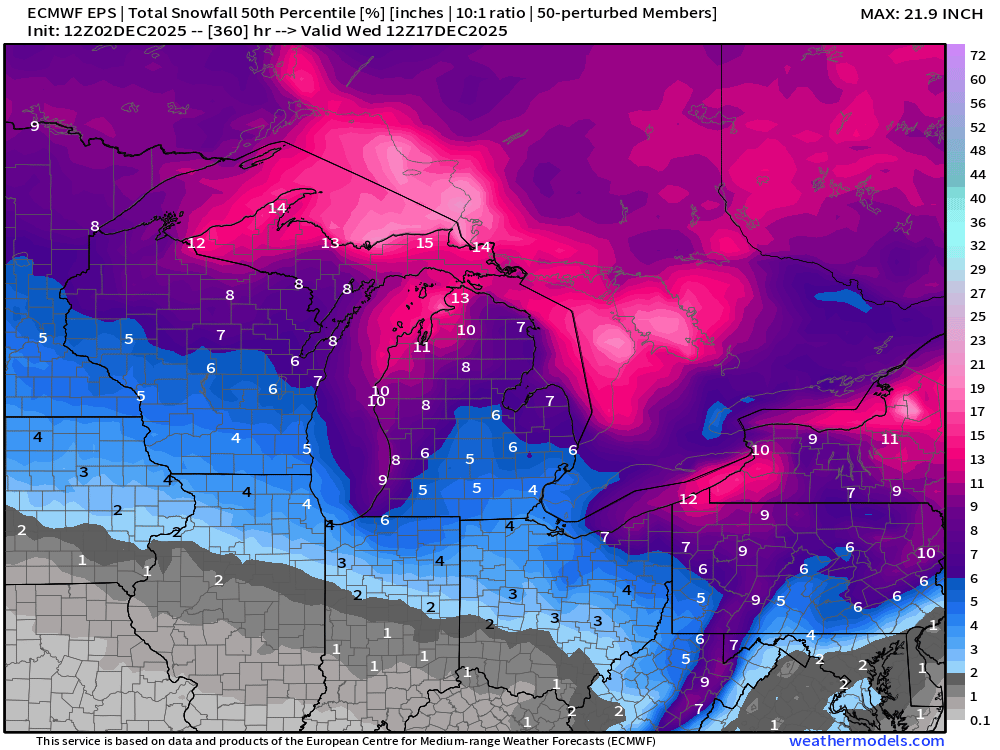
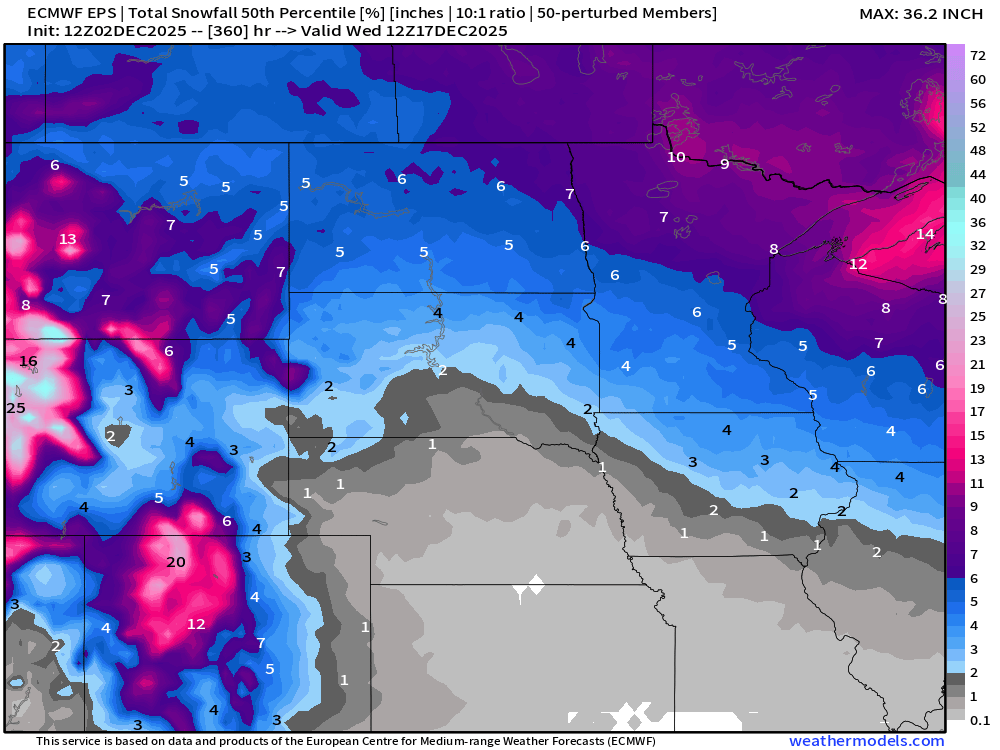
ECMWF EPS 12z | Ensemble Median Snowfall Next 15-days
ECMWF EPS 12z | Ensemble Snowfall Probability > 1” | Next 15-days
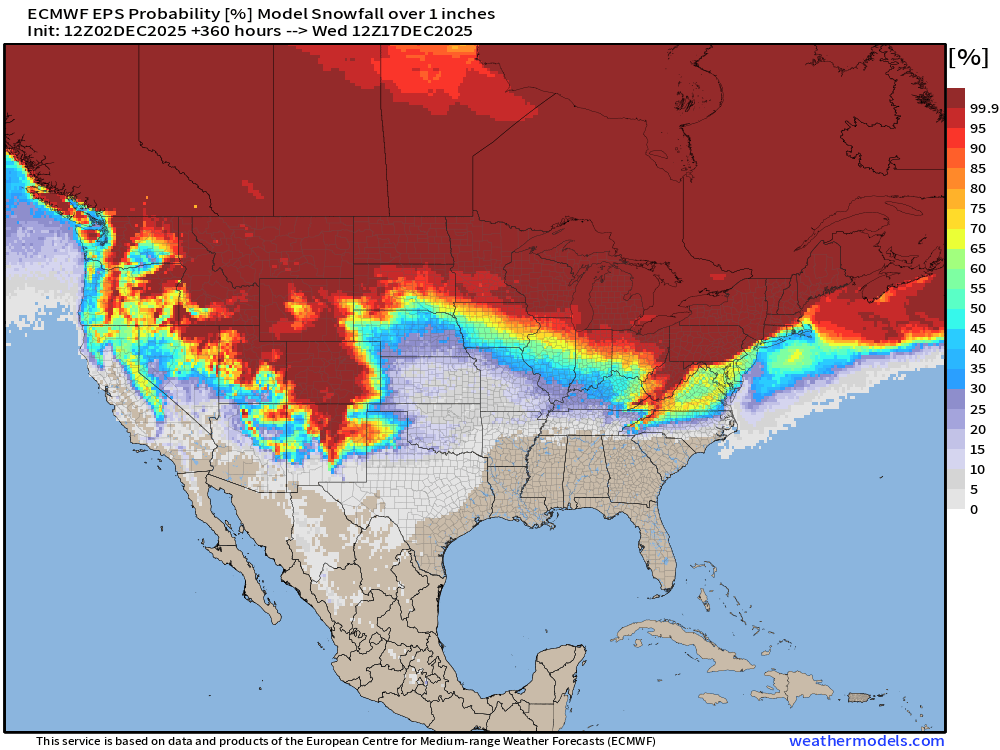
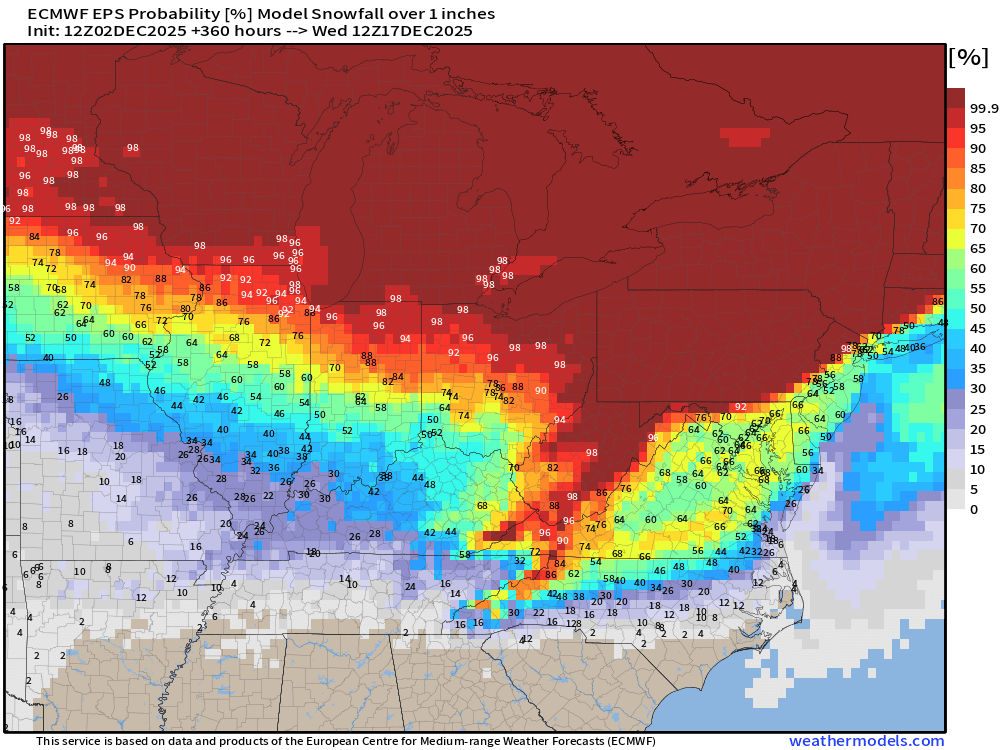
We’ll be monitoring the 1” chance of snowfall for a “White Christmas” in the coming weeks.
ECMWF EPS 12z | Ensemble Snowfall Probability > 6” | Next 15-days
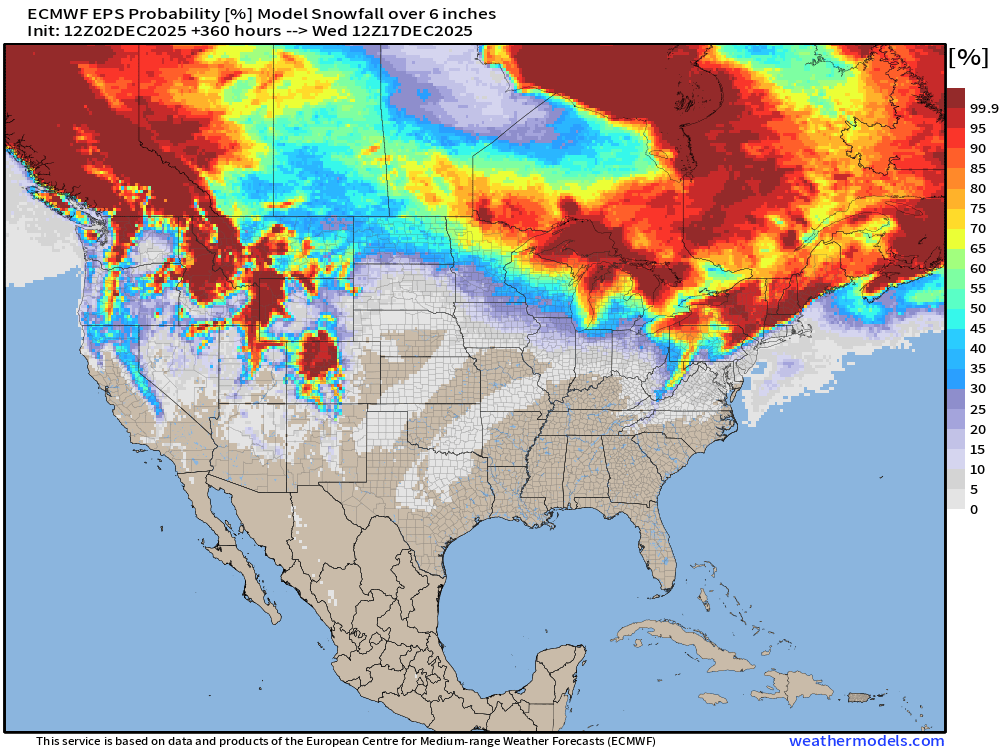
6-inches is sufficient for a “big storm” and Lake Effect machine diagnostic
Temperature Anomaly | Next 15-days | ECMWF EPS 12z
5-Day Chunk #1 | Temperature Anomaly | Dec 2 - Dec 6
5-Day Chunk #2 | Temperature Anomaly | Dec 7 - Dec 11
5-Day Chunk #3 | Temperature Anomaly | Dec 12 - Dec 16
Maps sourced from weathermodels.com designed and innovated by yours truly! Please subscribe there for real-time access to the newest maps, charts from all of the weather models including ECMWF and AIFS, NOAA AI-GFS/AI-GEFS
- Milepost
- 804 · laid 2025-12-03T01:42:28.565000Z
- Source
- https://weather.substack.com/p/december-2-2025-tuesday-evening-winter
- Digest
- 8acee3a533fc430f1143eed07d09267caacc0e0f9e68ddc37914ce01fb95b6fa
- Machine
- JSON