July 9, 2025 Hurricane Season Wednesday
Seasonal forecast slightly downgraded but still above normal from CSU
July 2025 was the 20th-warmest July in the 132-year national record (1895–2026), at 75.4°F against a 1991–2020 normal of 74.4°F (+1.0°F).
July 2025 was the 27th-wettest July in the 132-year national record (1895–2026), at 3.1in against a 1991–2020 normal of 2.9in (+0.2in).
NOAA/NCEI Climate at a Glance, contiguous United States. This is the observed record for the month, not a score of anything said in this piece — the forecast ledger begins 2026-08-17 and cannot reach earlier posts.

Sorry for the late update, but today was hectic with the hearing this morning, and then a coding sprint to incorporate the new AIFS-ENS into a trading platform.
Wednesday’s Tropical Update
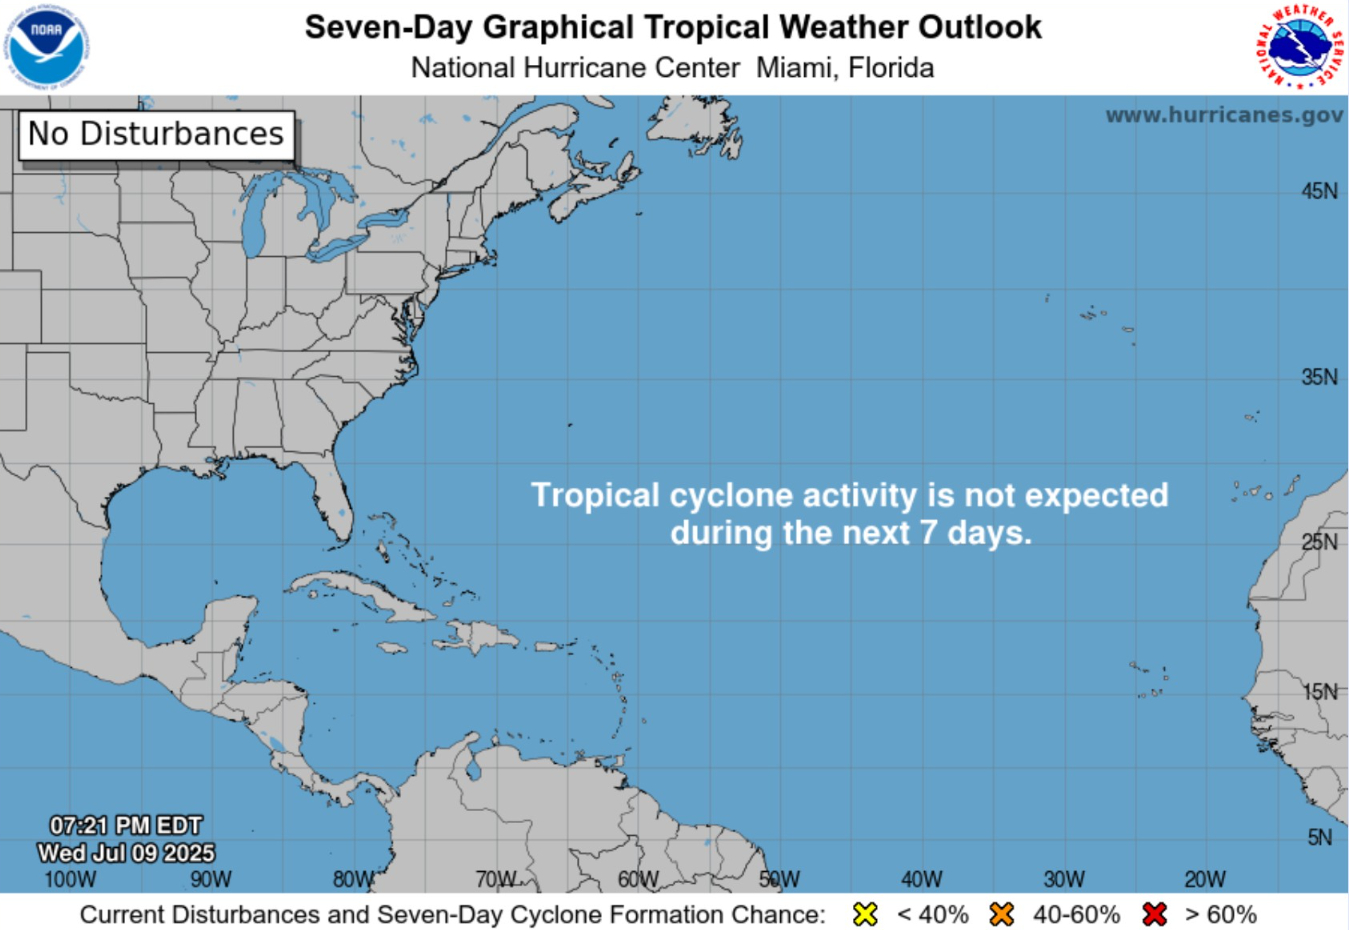
Atlantic Basin: Nothing brewing for next 7-days, or 2-weeks from Ensembles
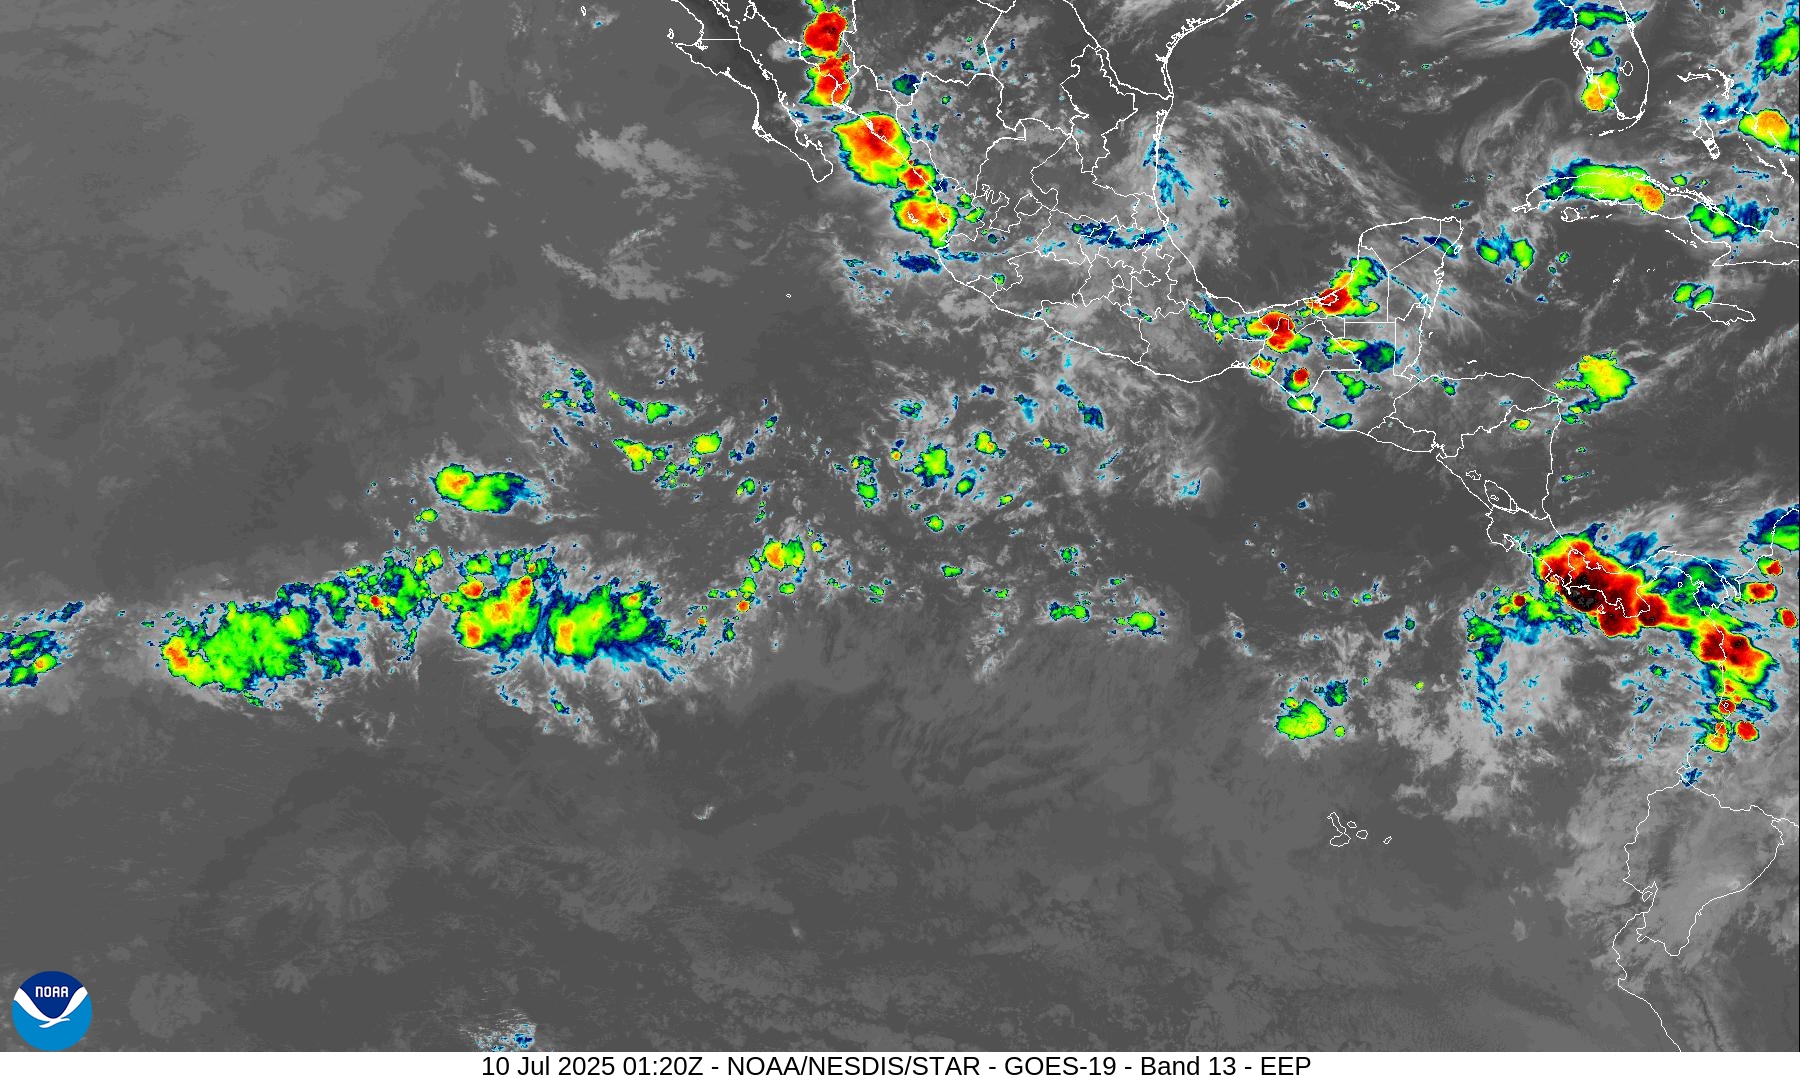
Eastern Pacific Basin: The basin has also gone dormant after a fast start
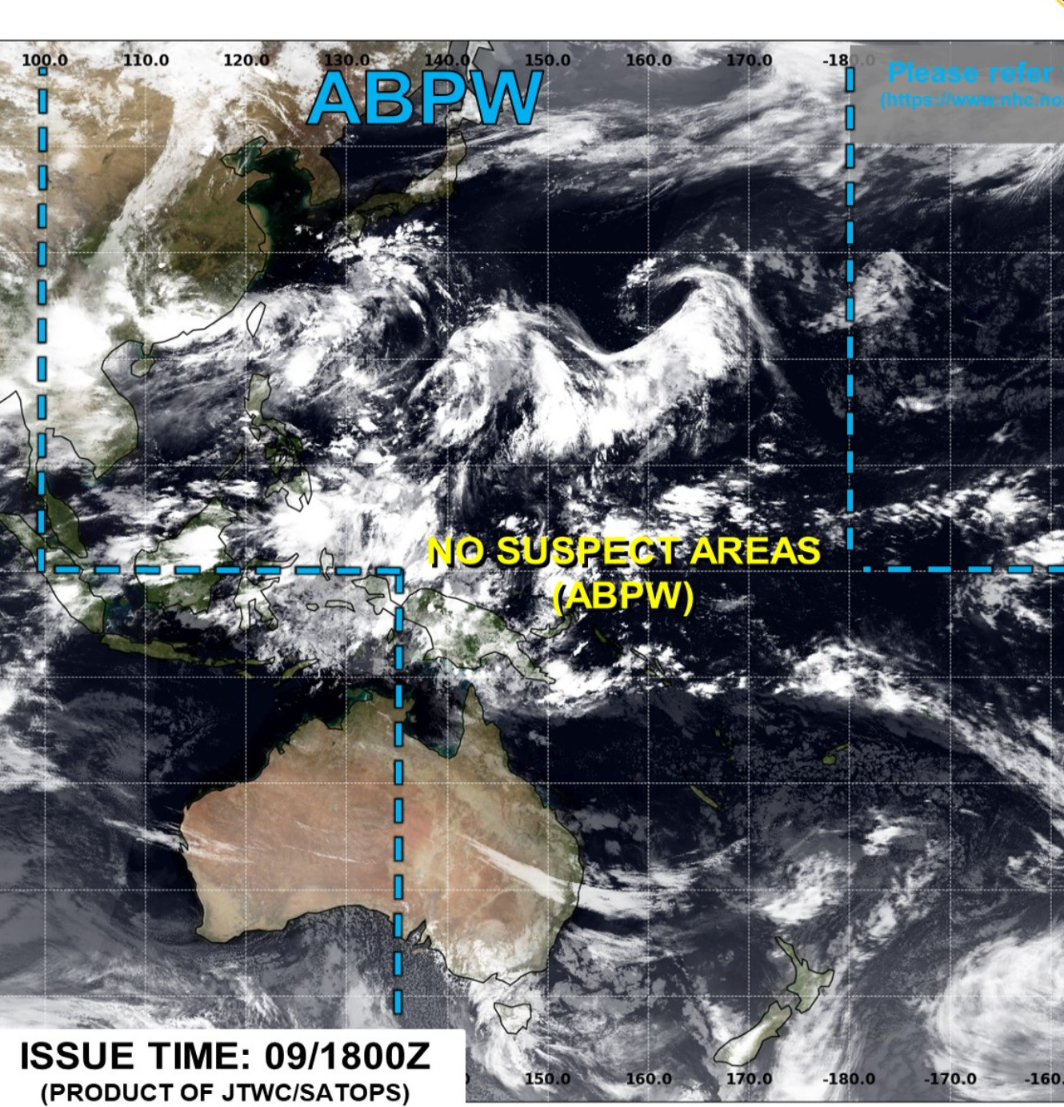
Western Pacific Basin: Activity will return in coming days as monsoon trough remains active
In the News
Colorado State University (Klotzbach) slightly reduced the 2025 Hurricane Season forecast for the Atlantic to 16/8/3 — still above my prediction for year, but I’m not seeing above-normal activity (using 1995-2024 baseline)
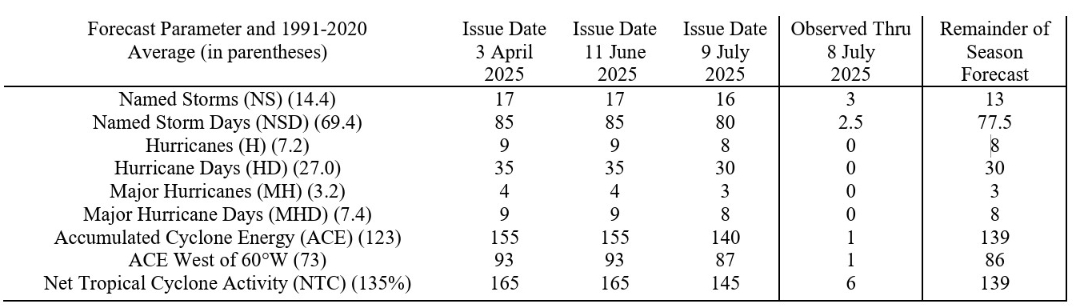
“We have decreased our forecast slightly and now call for a slightly above-normal 2025 Atlantic basin hurricane season.
The primary reason for the slight decrease in the outlook is both observed and predicted high levels of Caribbean shear. High levels of Caribbean shear in June/July are typically associated with less active hurricane seasons.
However, we also anticipate the tropical Pacific to be characterized by ENSO neutral conditions. Sea surface temperatures across the eastern and central Atlantic are slightly warmer than normal, but not as warm as they were last year at this time.
A warmer-than-normal tropical Atlantic combined with likely ENSO neutral conditions typically provides a more conducive dynamic and thermodynamic environment for hurricane formation and intensification.”

NOAA political appointees [Dr. Neil Jacobs and Mr. Taylor Jordan] appeared before the Senate Commerce committee this morning. The mood in the room was somber due to the Texas flooding tragedy, but many questions were asked in a collegial manner about what could have been done better to save lives.
Takeaways for me (Link to good article in Government Executive)
Dr. Jacobs is a meteorologist and numerical weather prediction expert. He urgently wants to improve the quality and accuracy of U.S. weather models — to be at least on par — or better than the Europeans. This is a “moonshot” program that will require investment across NOAA from computing, AI, and rapid R2O.
As Trump’s pick to lead the agency, he agrees with the proposed budget cuts for FY26 that reduce the overall NOAA budget by 27% and zeroes out climate research, deletes OAR, and restructures NOAA to be laser focused on mission priorities.
During Trump 1.0, the entire political appointee team at NOAA — including myself — was under constant onslaught by careers in resistance mode. There was a concerted effort even in NOAA to throw sand into the gears of policy, and at every opportunity, leak to the press e.g. Sharpiegate was just one example. However, this time it’s different as those nefarious actors are gone, and NOAA’s new team (same as the old team) is much better off with full administration and Congressional GOP support. I’m very optimistic to see rapid innovation in global modeling, and A.I. forecasting.
The key to success at NOAA will be moving the weather research activities much closer to the National Weather Service users — and the public — instead of being siloed off at OAR and various centers around the country. The timeline for R2O was exceedingly long to the point of stasis. Everything model related is delayed by years, not joking. Meanwhile, ECMWF upgrades its suite of global models 1-2 times per year with a cycle framework, and all hands on deck focusing on the mission.
Atlantic Water Vapor Forecast Next 8-days
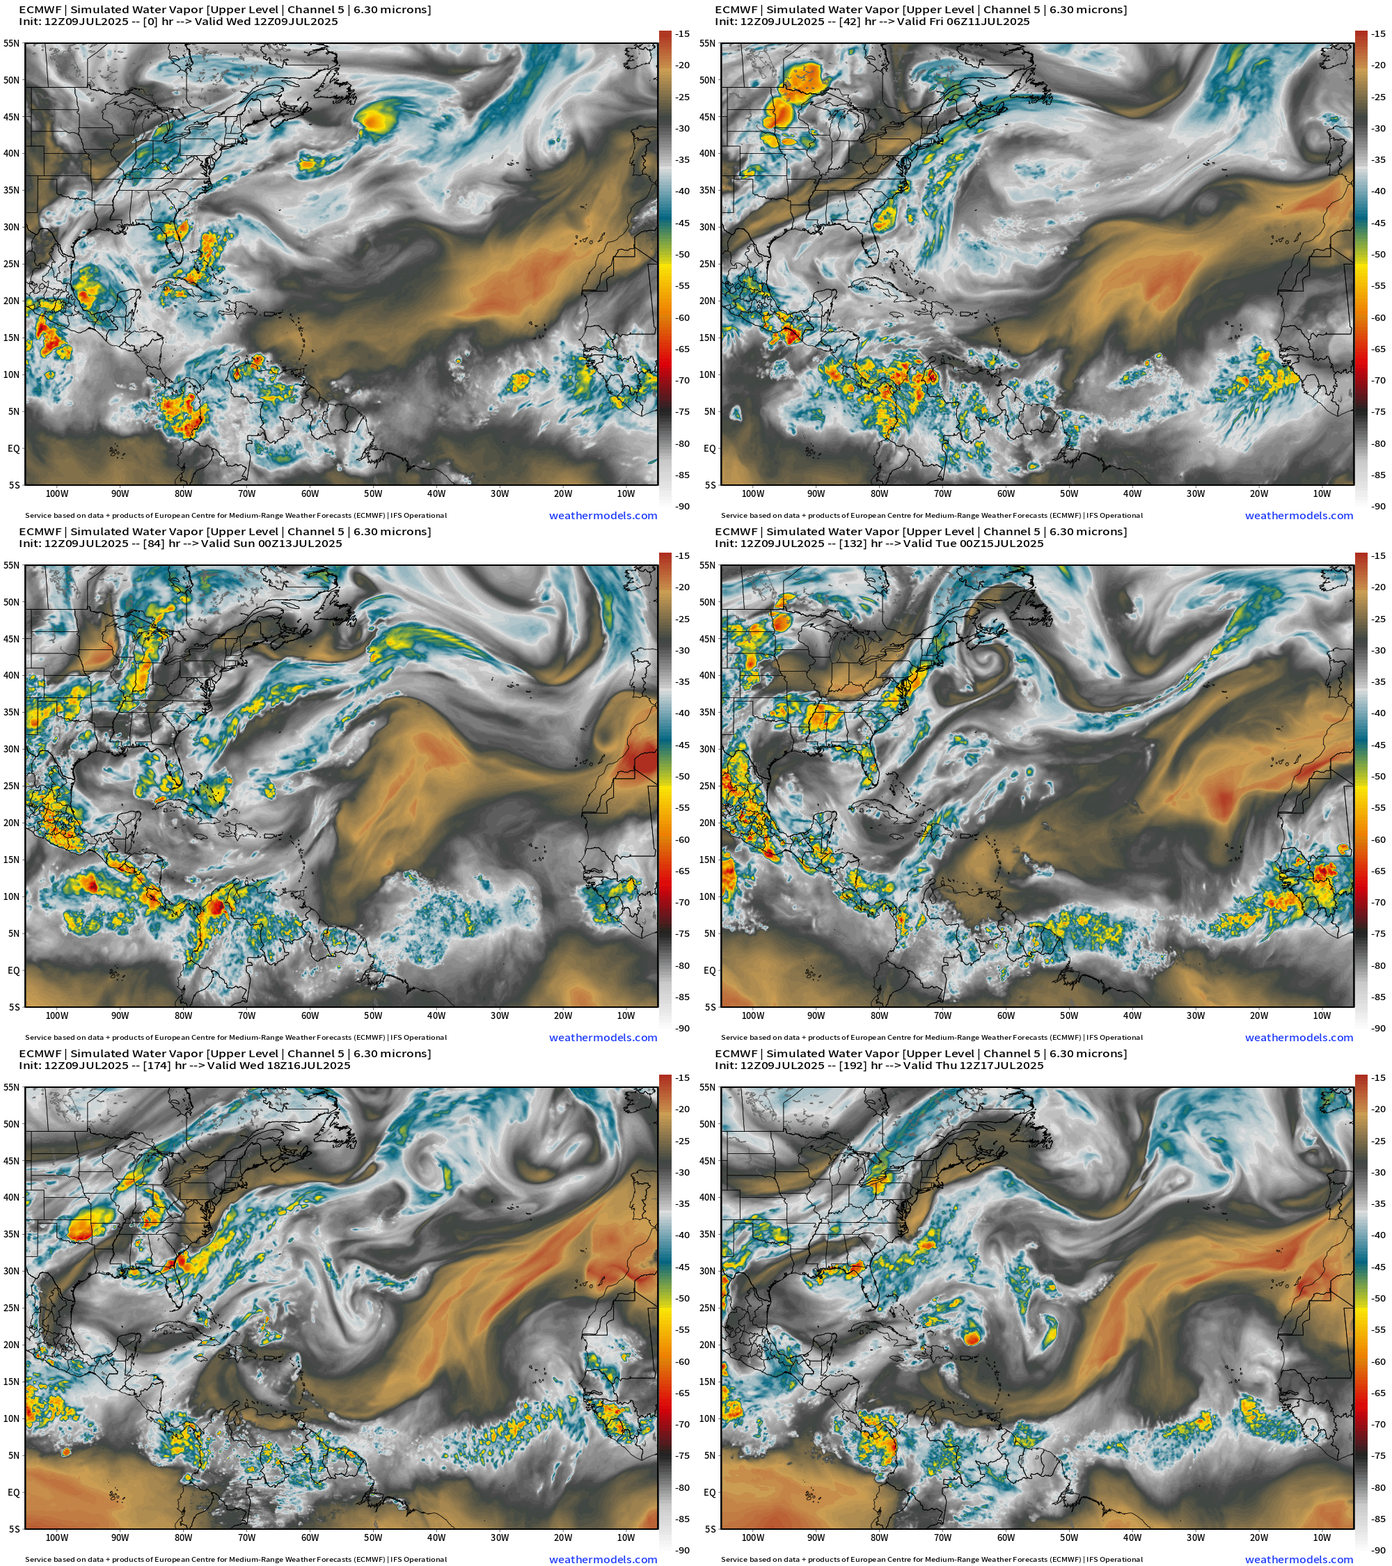
The brown and black are indicators of dry air and troughs from the middle latitudes impinging upon the tropics. ECMWF model simulated water vapor shows well the translation of Saharan Air Layers across the entire Atlantic in a 7-day time frame.
A reprieve in the dust in 7-days with a stronger wave coming off Africa (July 15) might have a better chance of developing.
Current Satellite Imagery | United States
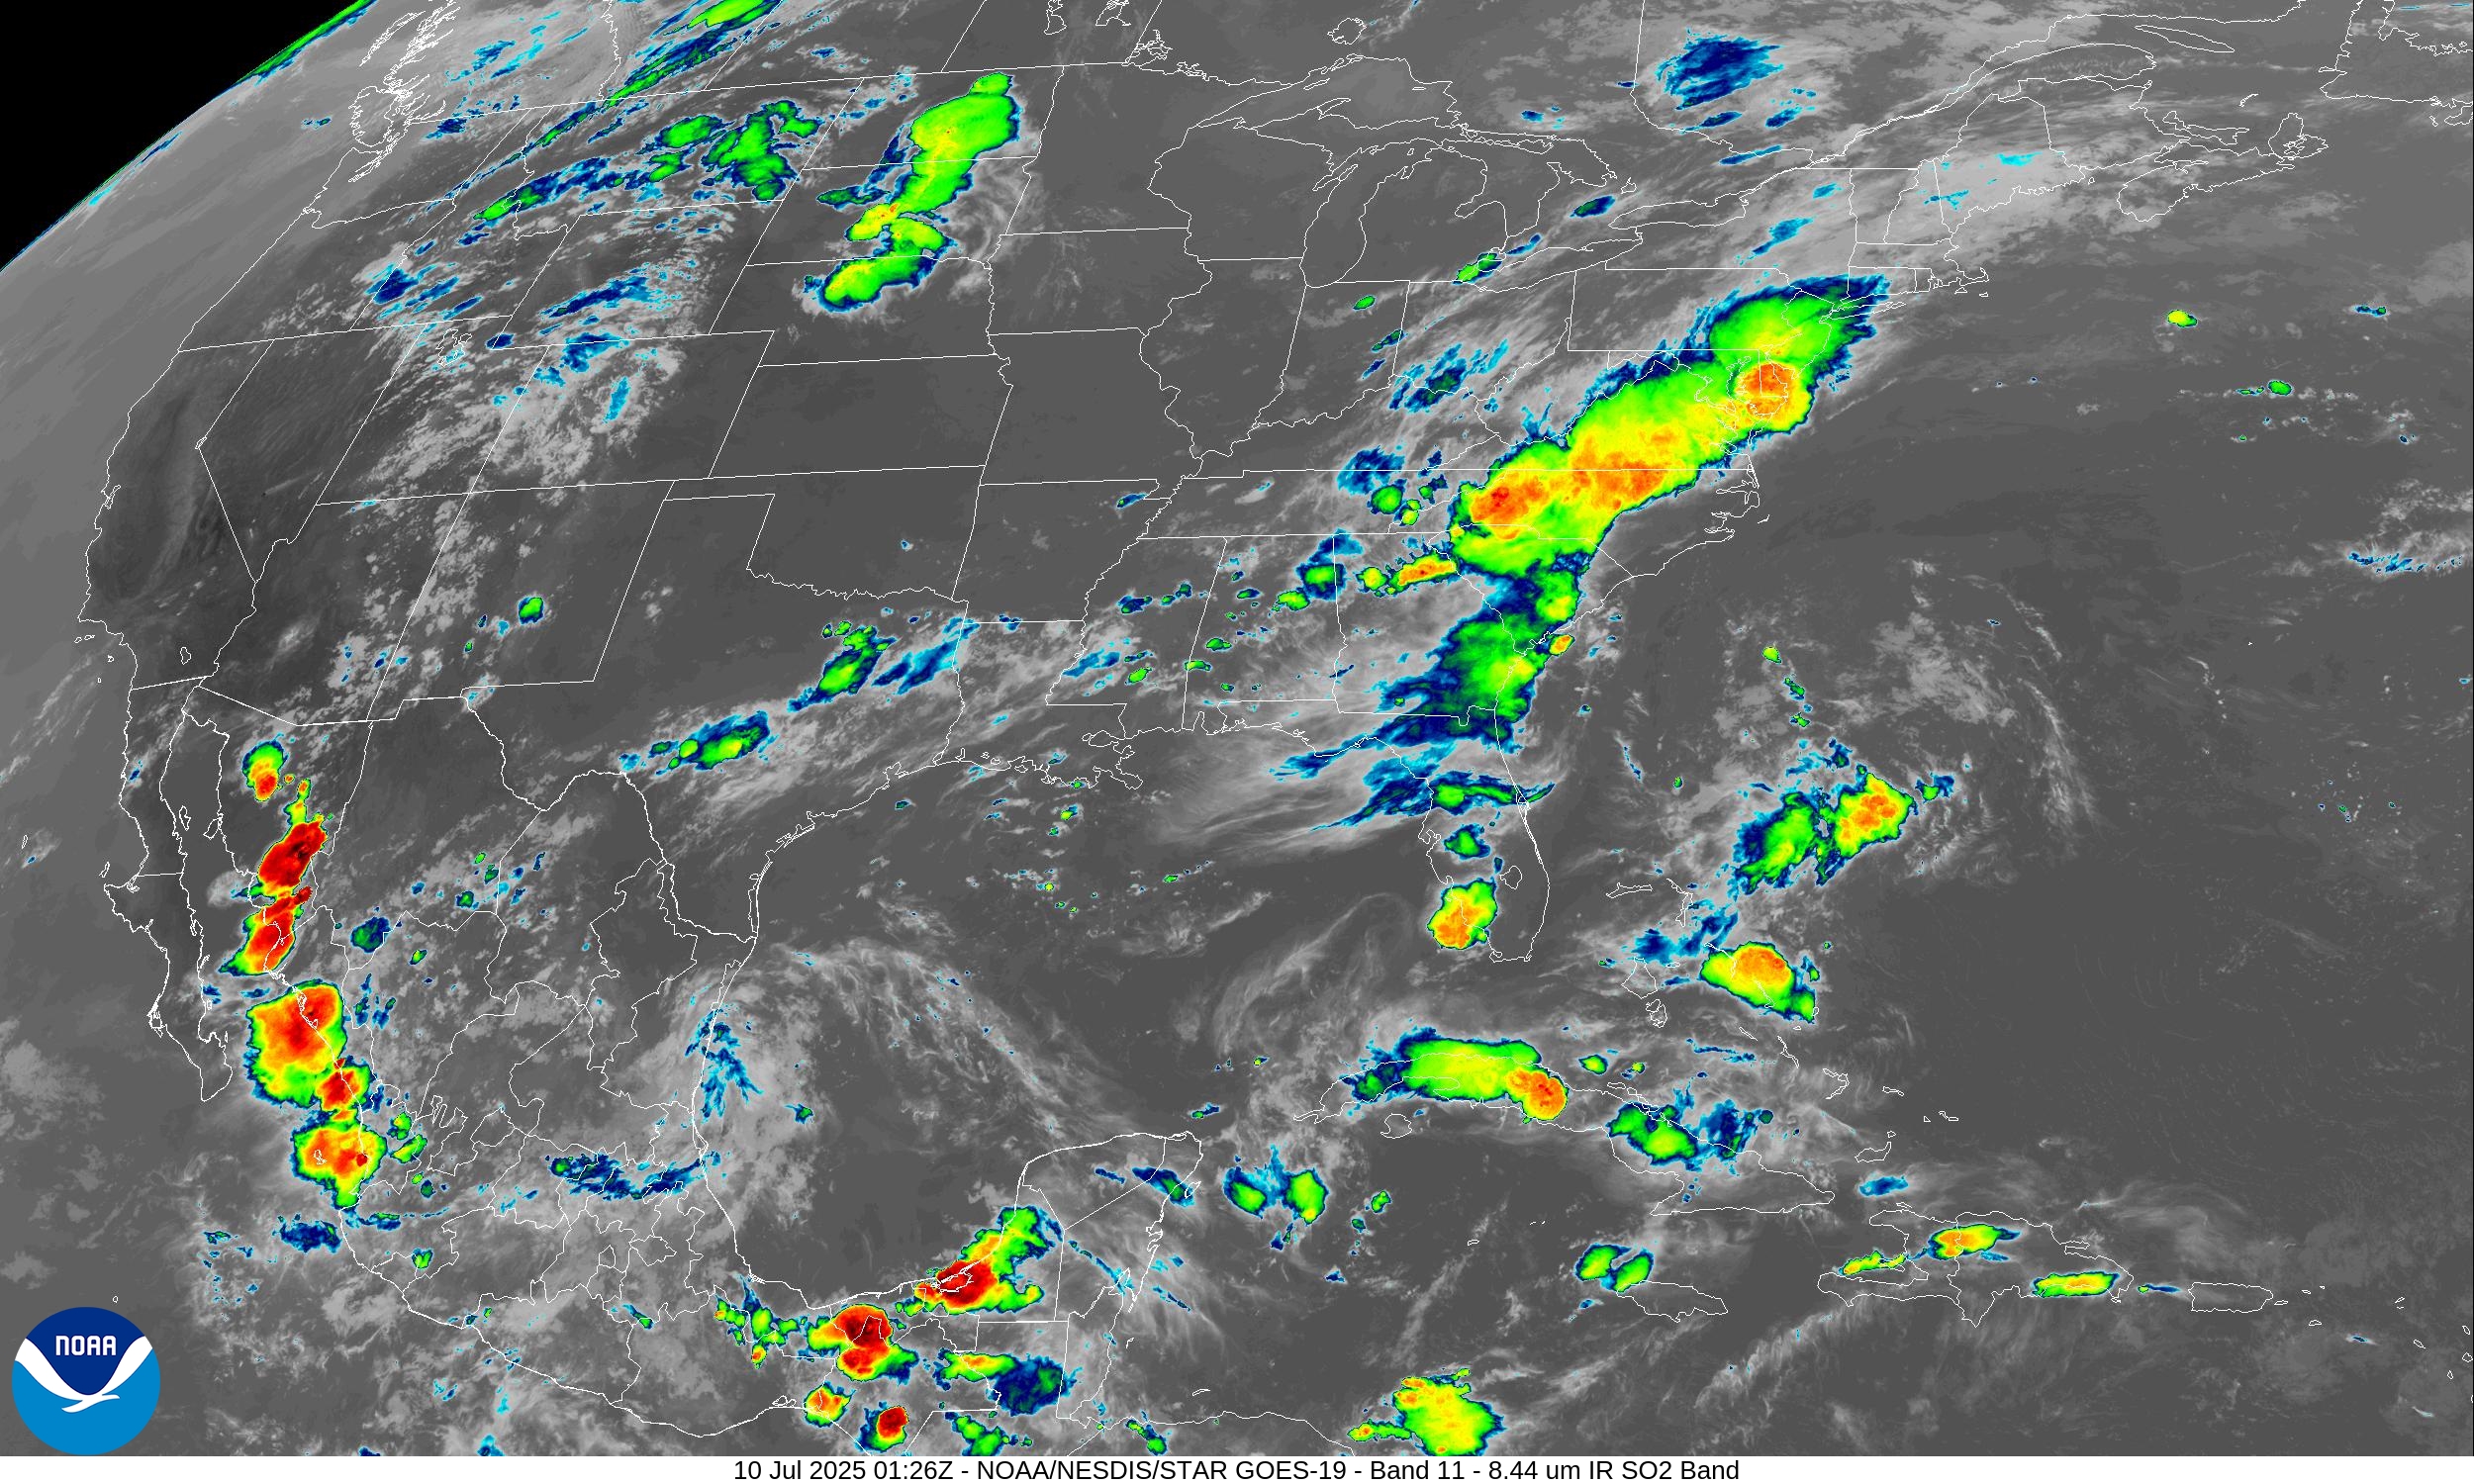
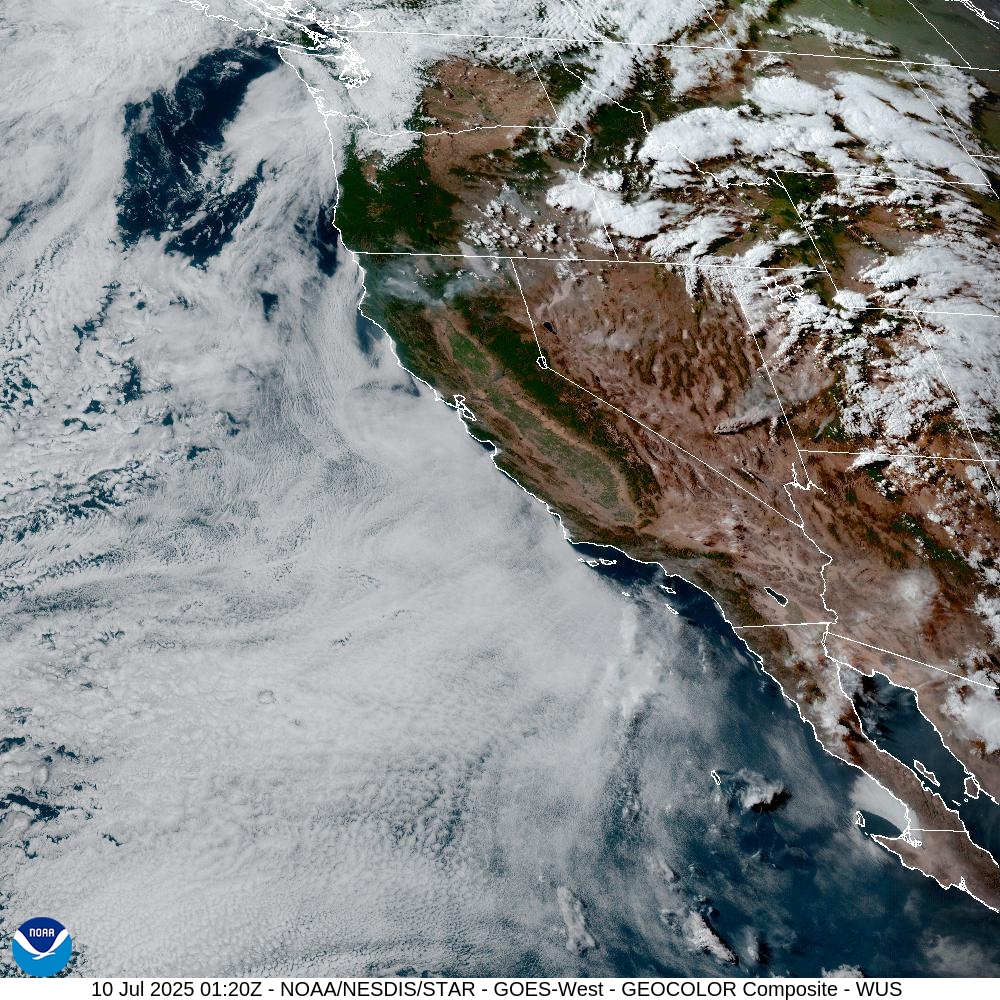
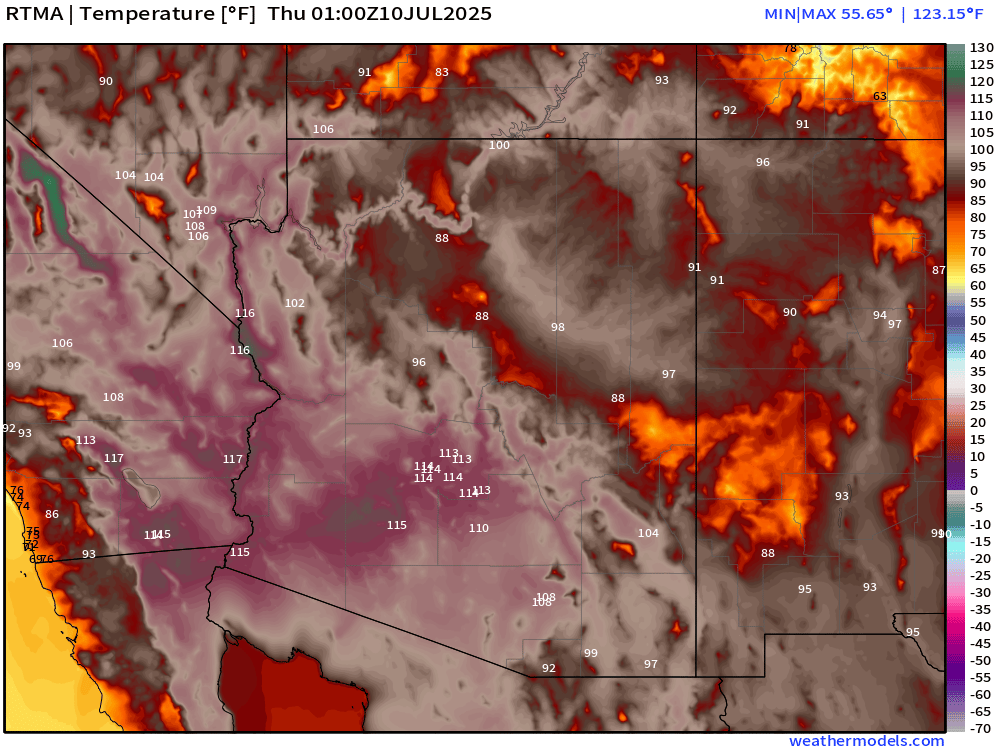
Offshore flow = crystal clear and oppressively hot across the Southwest.
Temperatures | 9:00 PM ET
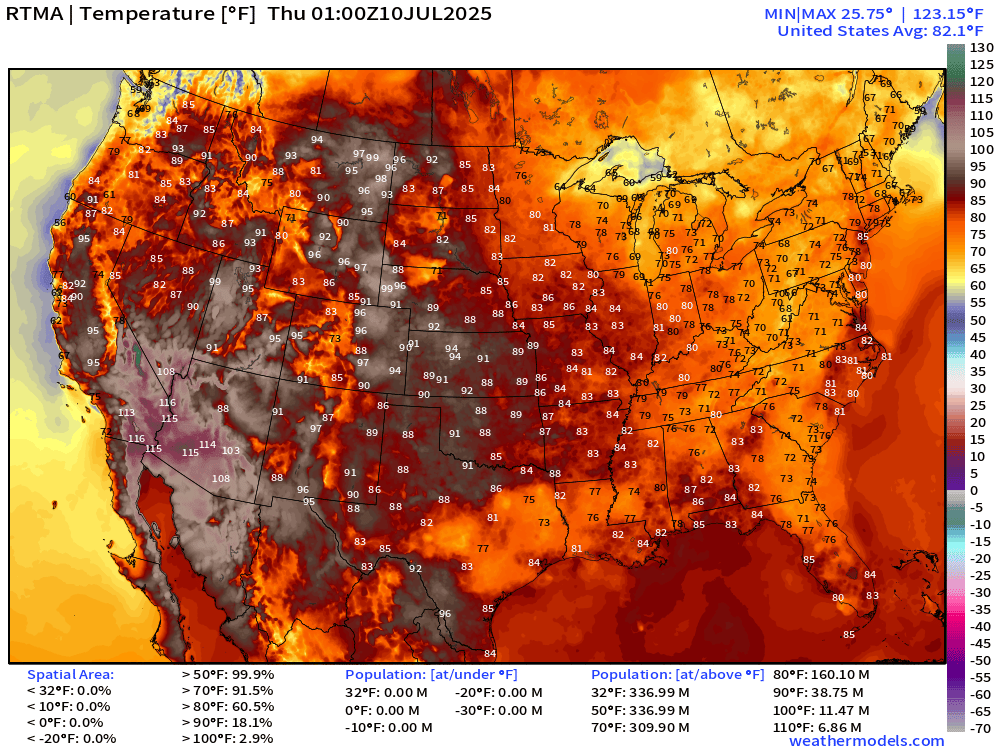
Very hot across the Southwest … 118°F in Phoenix today.
Temperature Anomaly | 9:00 PM ET
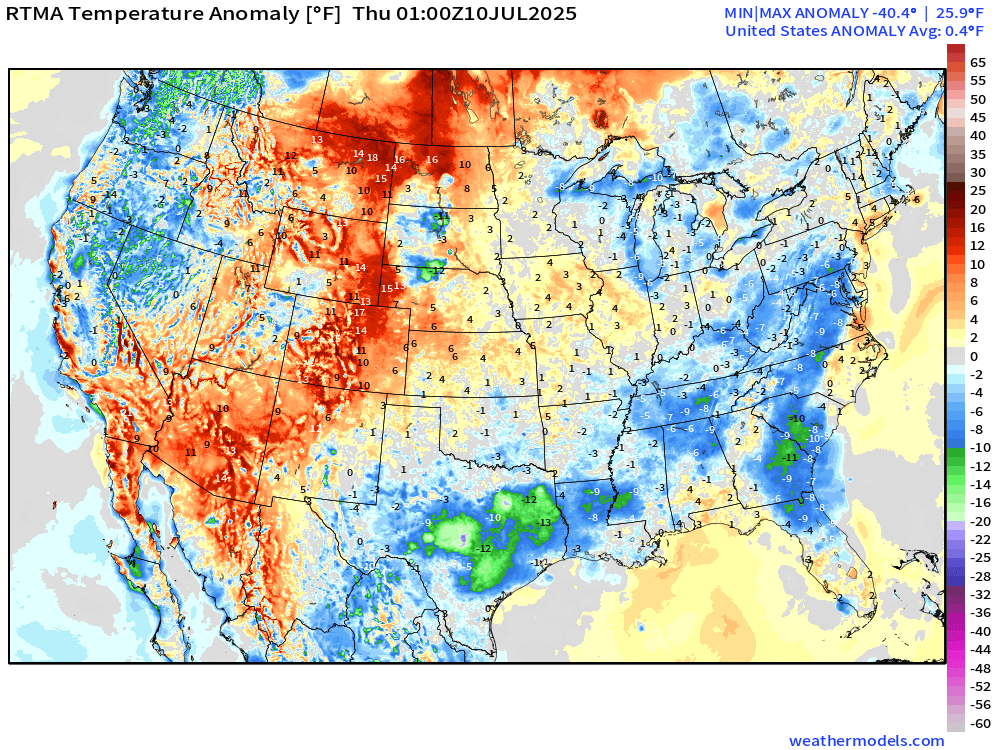
Overall, the Lower 48 is 0.4°F above average with storms breaking the summer heat pattern across the south and cooling temperatures in the 70s.
Lows on Thursday
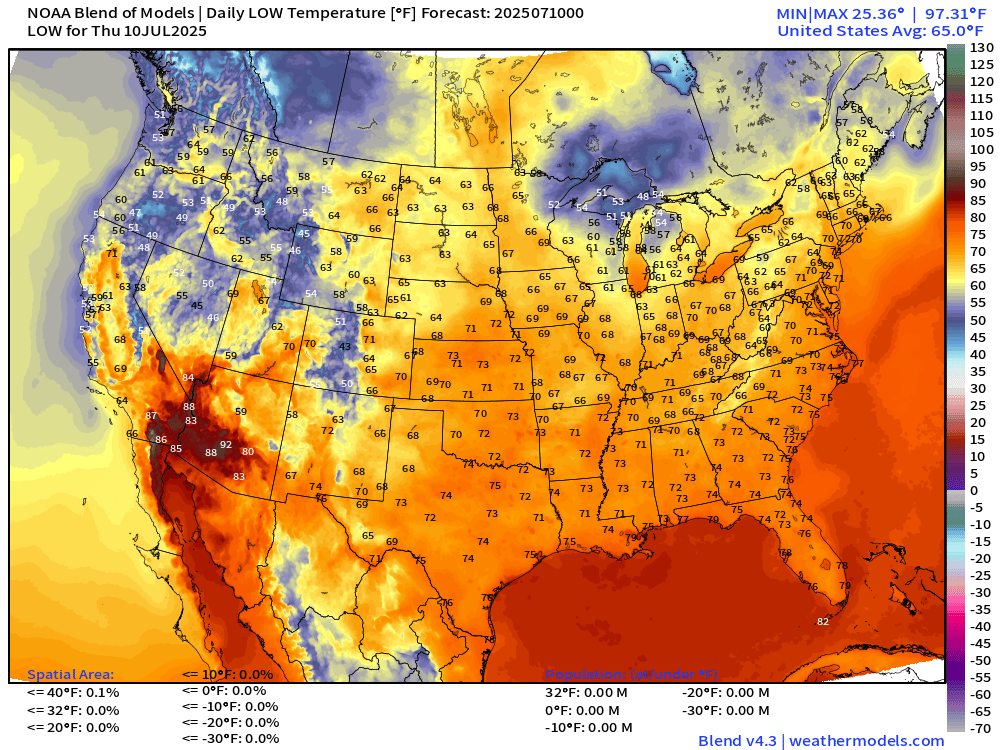
Highs for Thursday
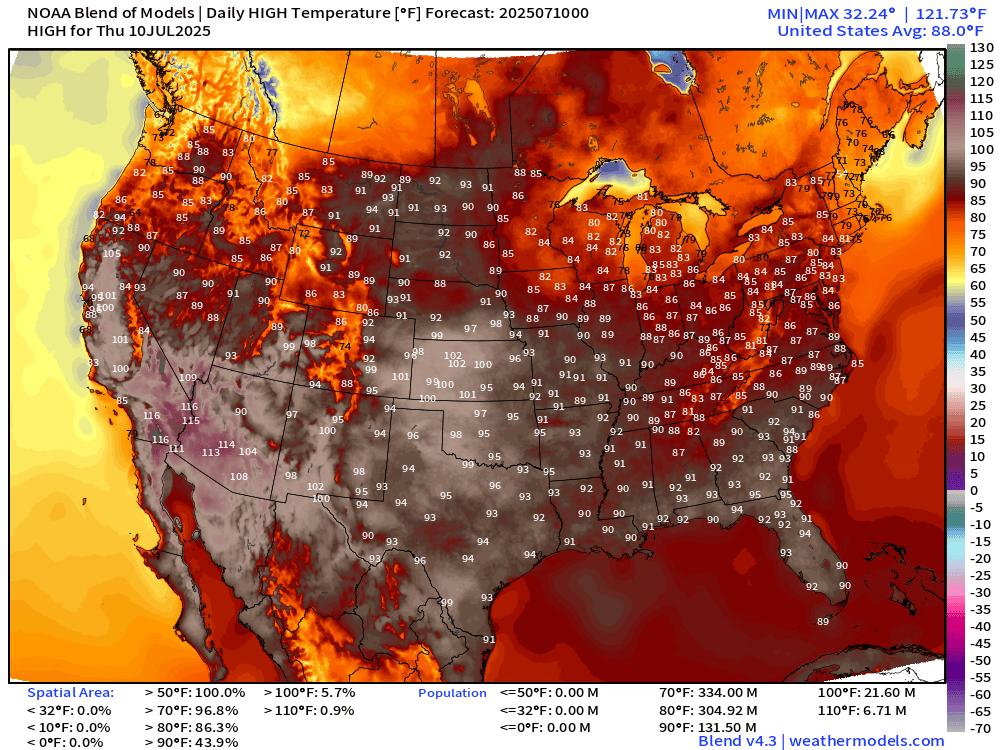
Lower 48 average is 88°F with 132 million at/above 90°F
Current Radar Across the Mid-Atlantic
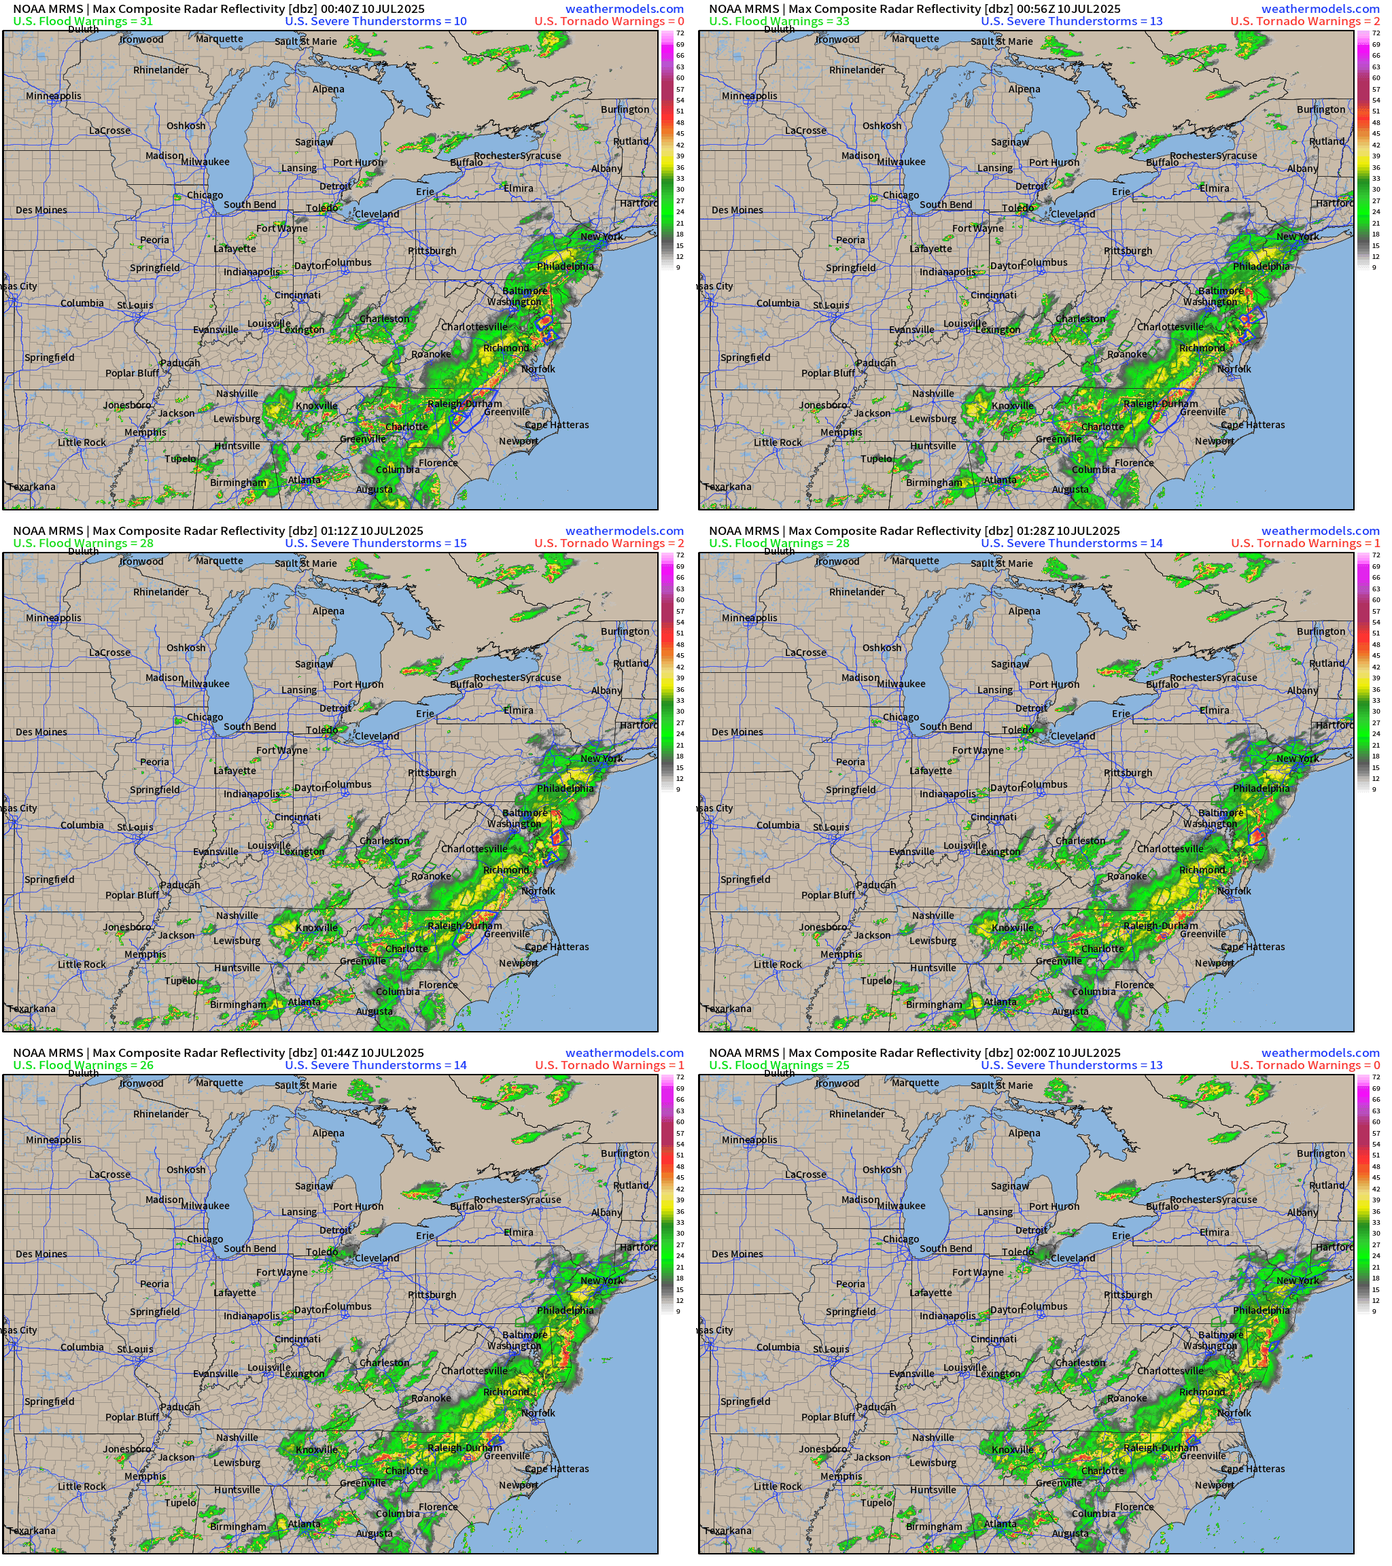
RRFS-A Radar Simulation Next 18-hours | through 1 PM Thursday
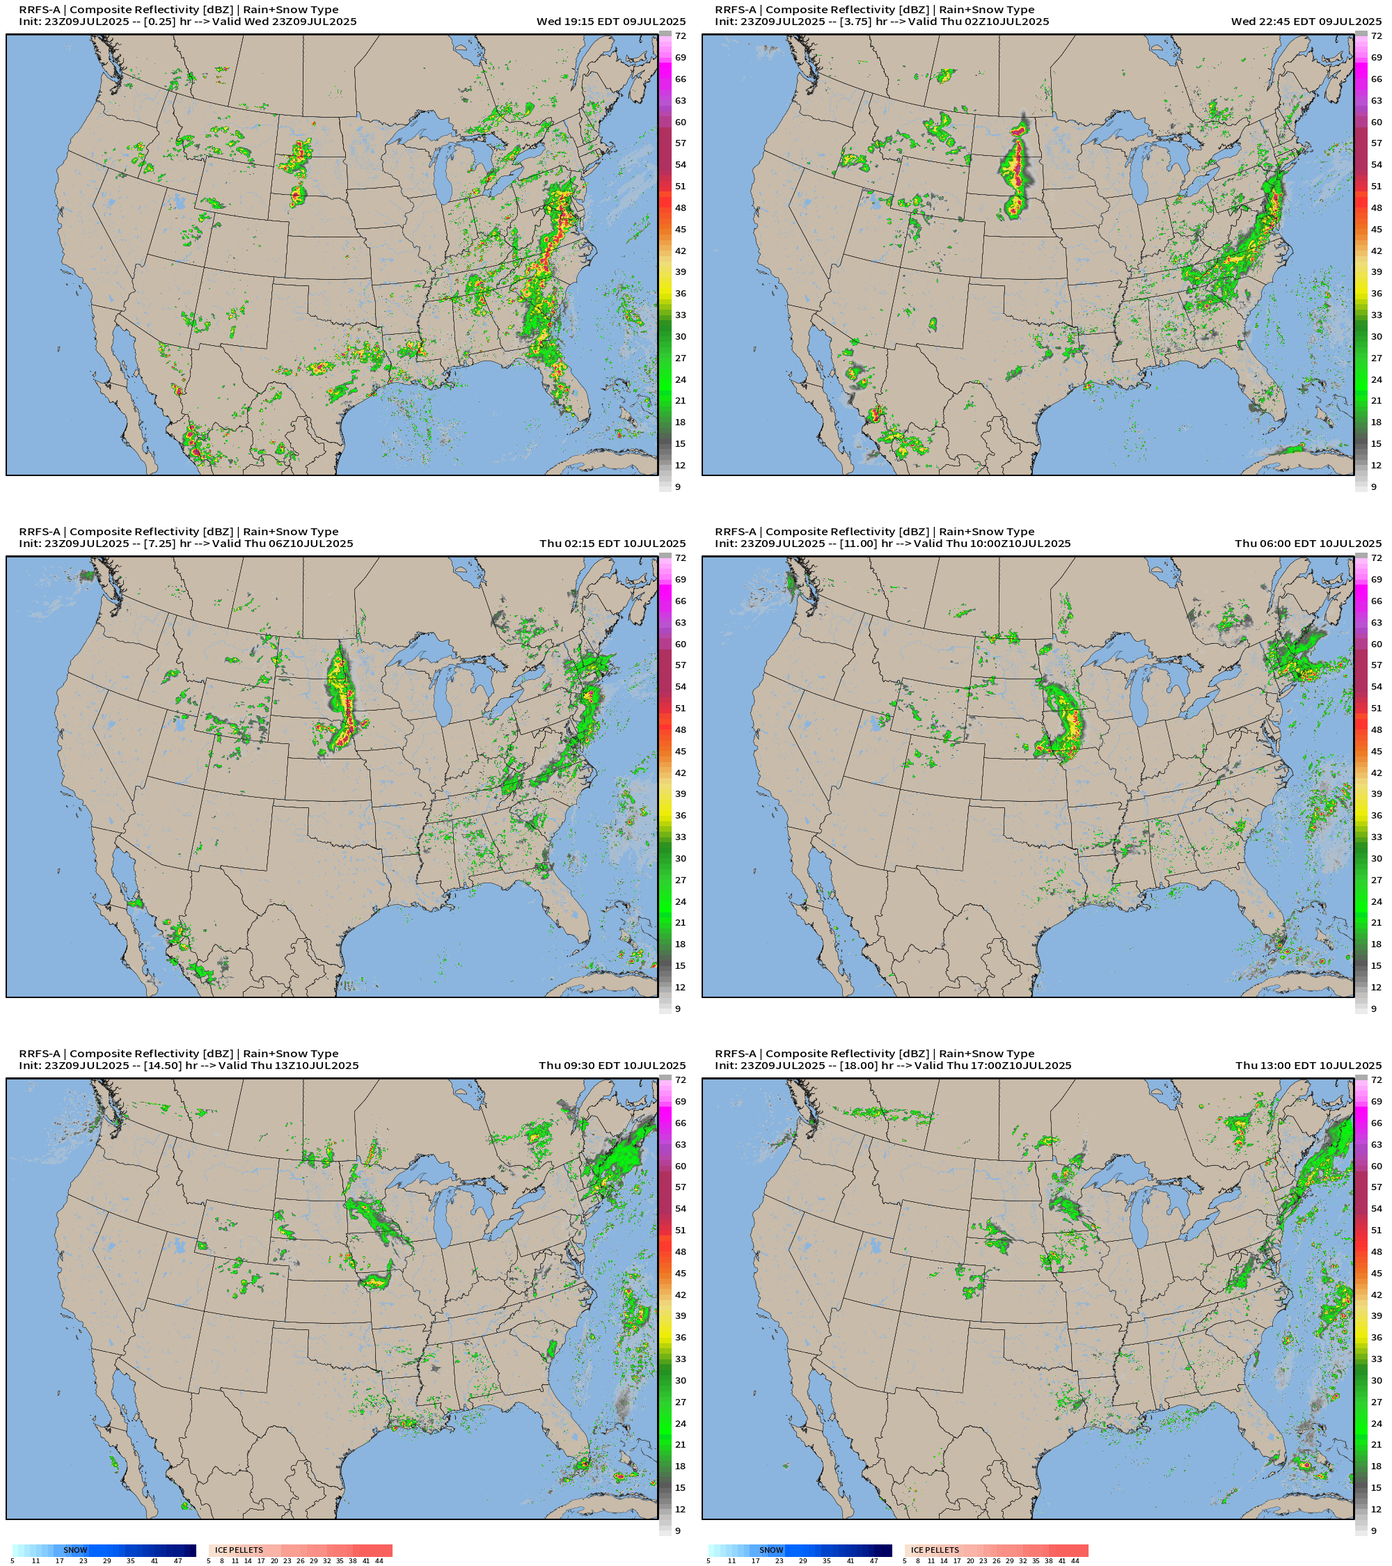
Weather on Thursday
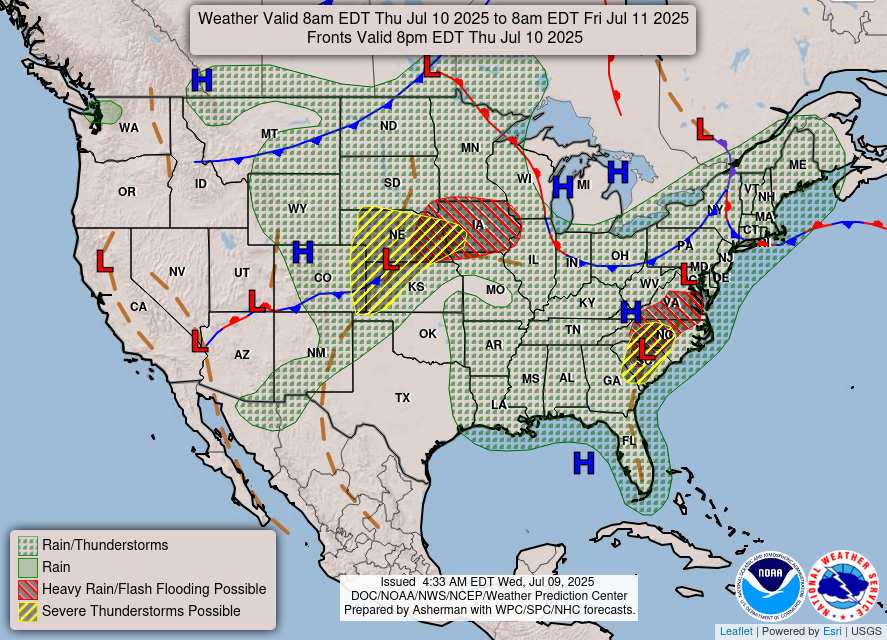
NWS Precipitation Next 48-hours
Heavy rain continues across VA/MD/DE and NJ
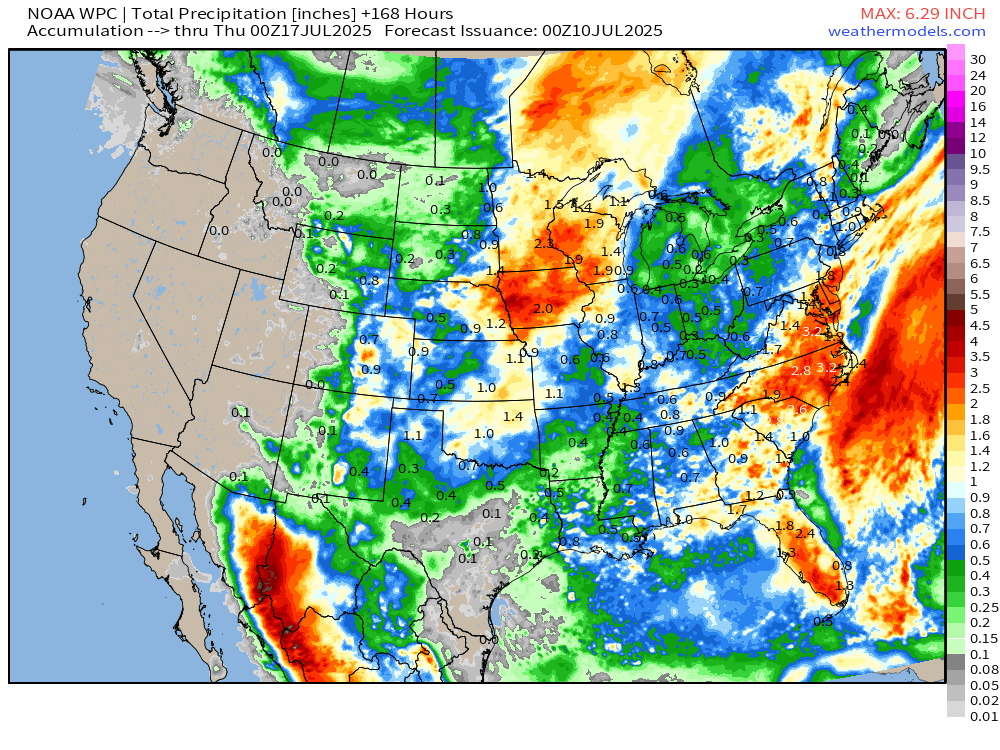
NWS WPC Precipitation Next 7-days
ECMWF 12Z | Integrated Vapor Transport | Next 8-days
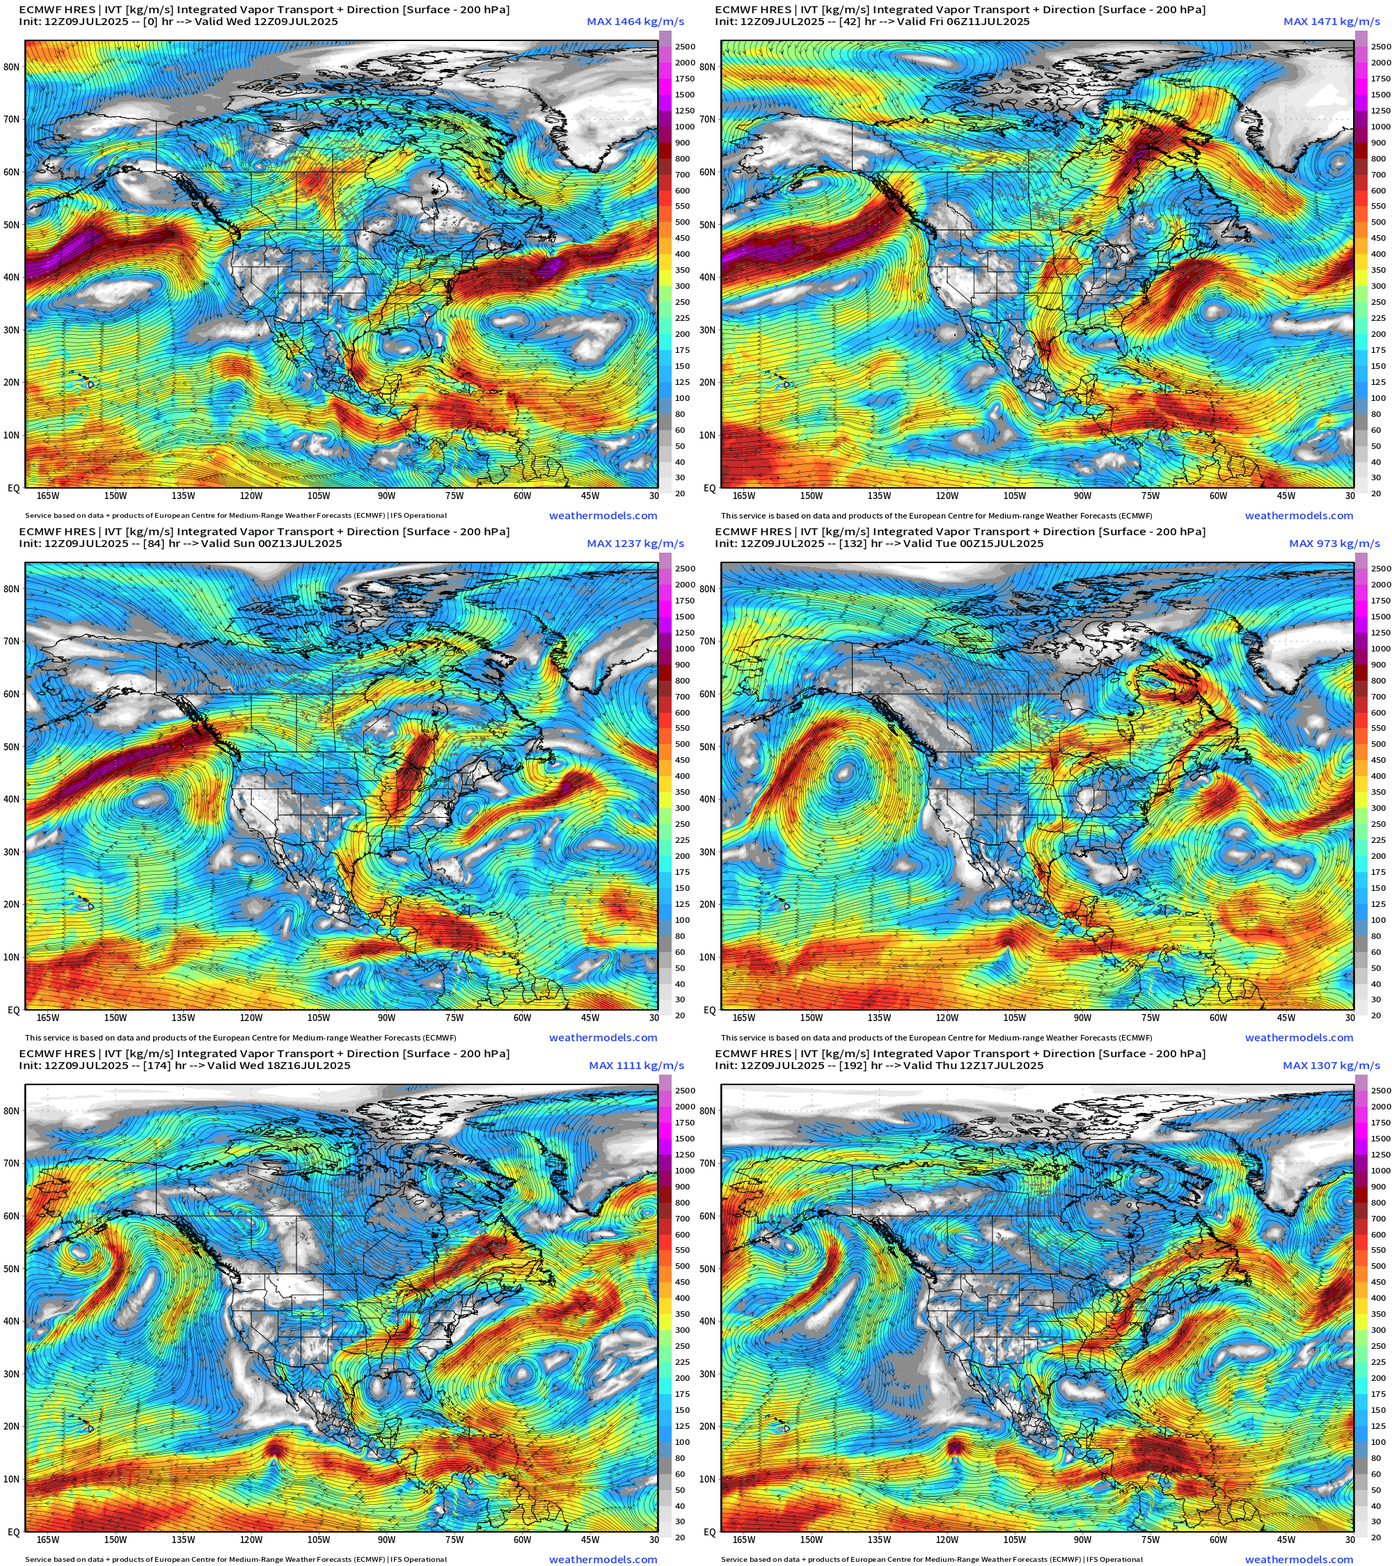
The Pacific High Pressure cell comes back and breaks down after a week. Combined with the Bermuda high, this means a steady flow of moisture out of the Caribbean into the center of the U.S. repeating the pattern we saw in late June.
Flow out of the Northwest and Canada will keep the Midwest and Great Lakes cooler than could be expected into mid-July. A lot of “blue and green” on the maps for Week 2 — and that’s not a heat dome.
Weekly Temperature Anomaly | ECMWF 12z Ensembles
Thank you to readers continuing into this Hurricane Season. My goal is to keep you informed about ongoing extreme weather events inside and outside of the tropics, but also a week (hopefully) heads up on what’s coming. I’ll be using a variety of weather modeling output, some of it may be unfamiliar, but it’s state-of-the-art and industry leading standard.
Next 8-days ECMWF 12z Precipitation and MSLP | Atlantic
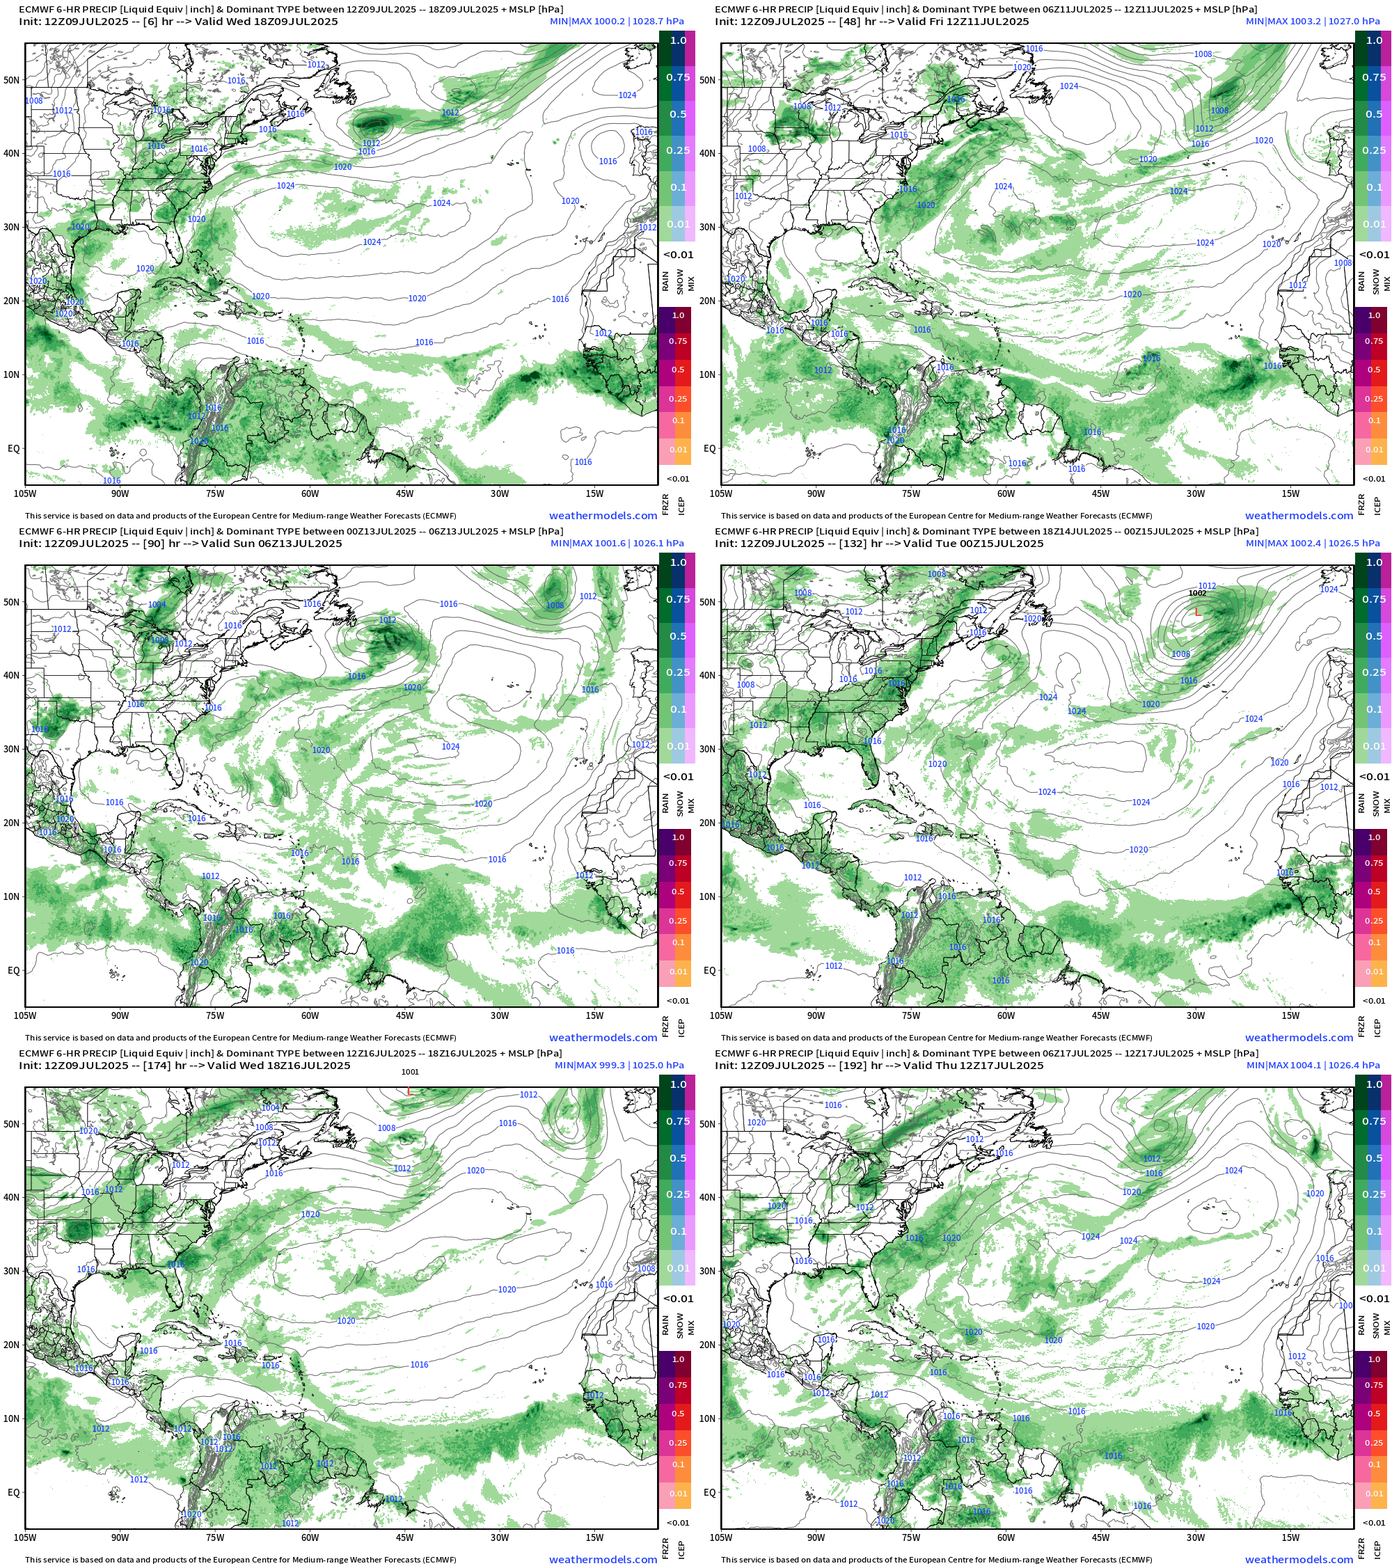
Lots of green but it’s not organized into a tropical storm … and that’s great — through July 17th.
Atlantic Basin Outlook
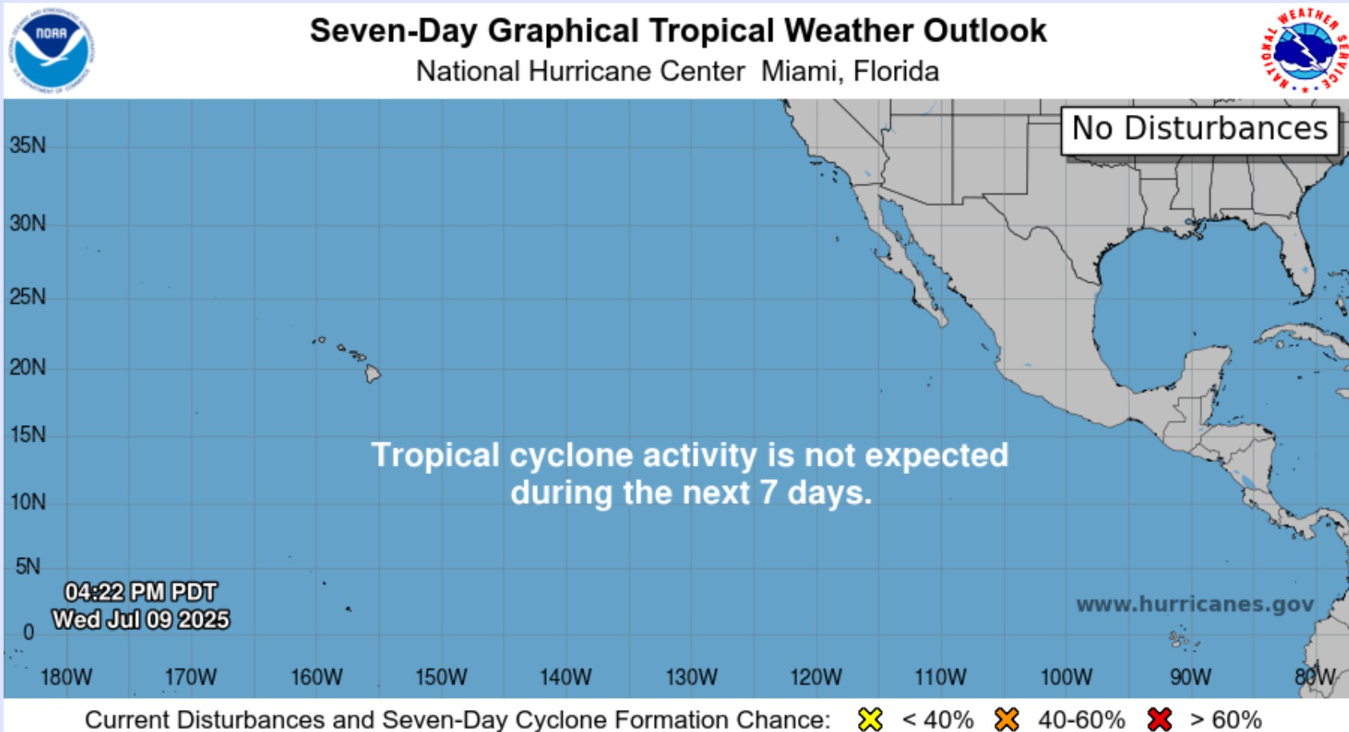
7-Day NHC Outlook
Eastern Atlantic Satellite Image
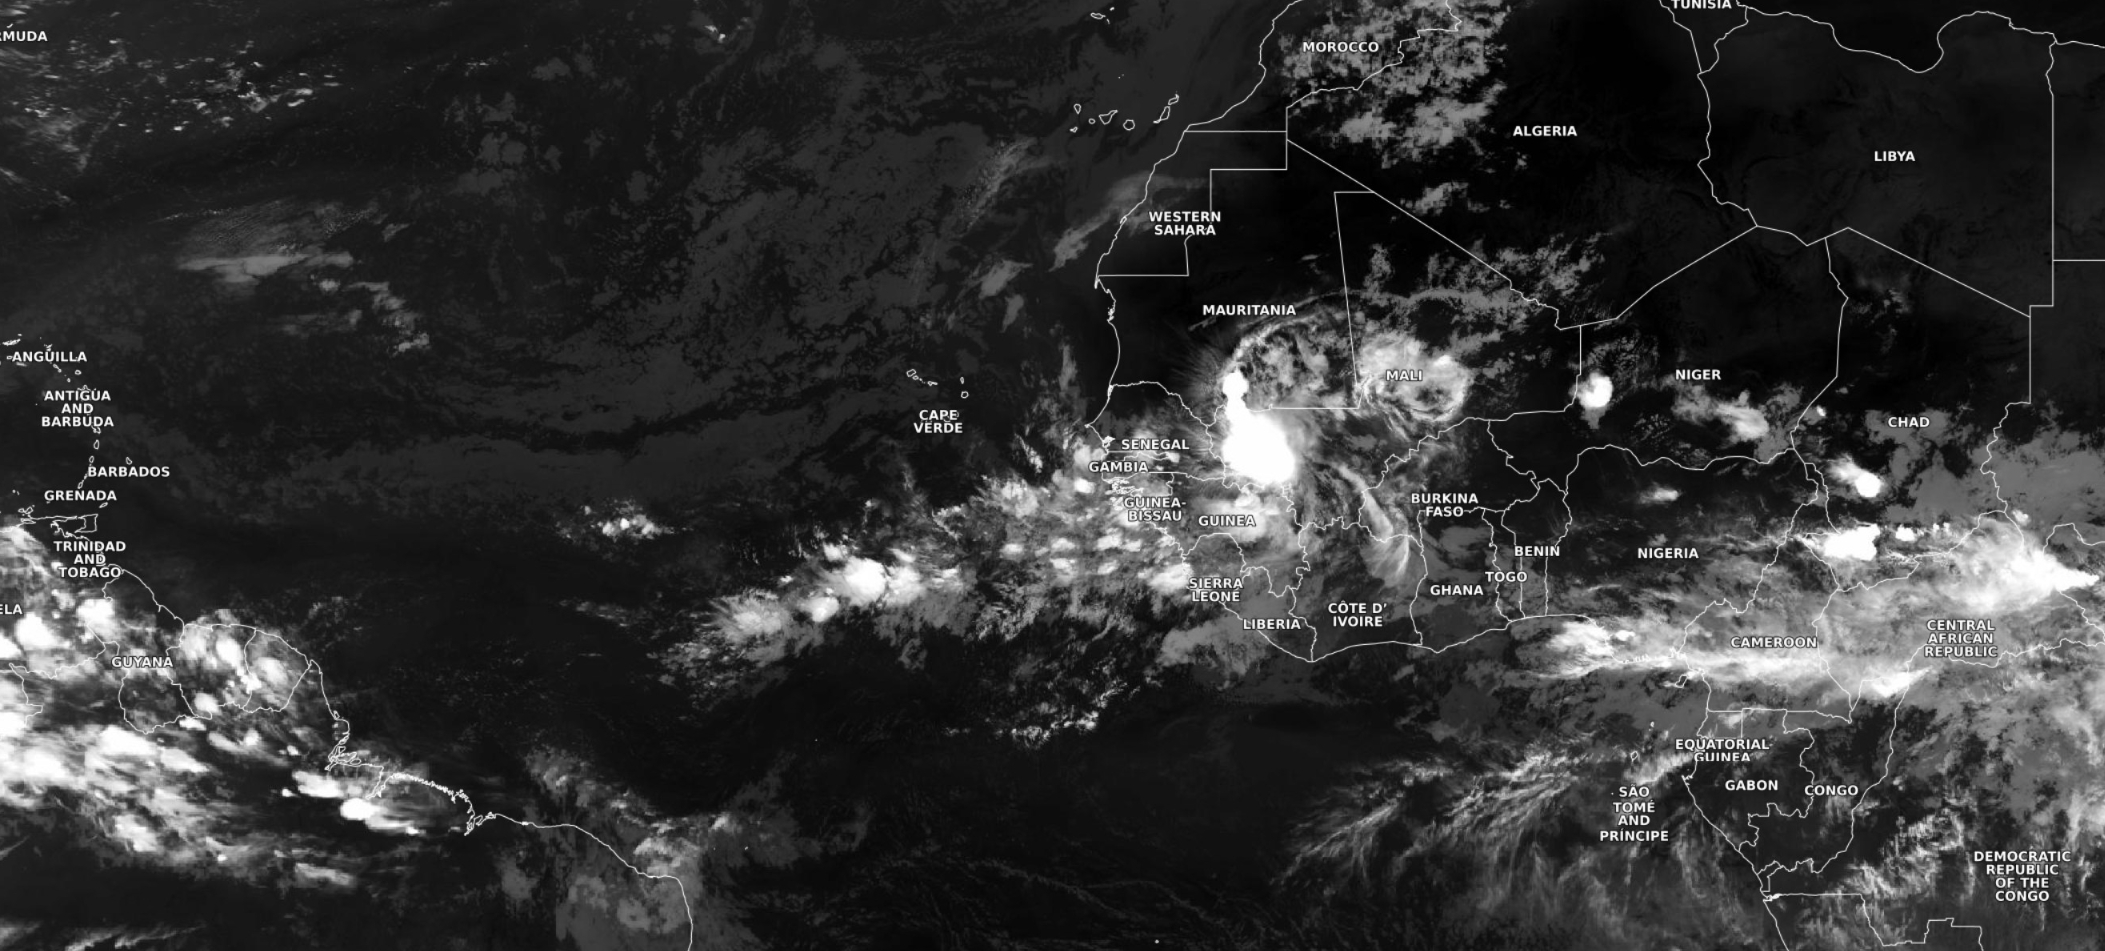
One healthy looking tropical with convection about 36-hours from coming off the continent. We’ll see how much of it can survive over the warming waters of the far Eastern Atlantic. Otherwise, the basin is devoid of convection.
NASA GEOS-5 | 12z DUST Aerosol Optical Depth (AOD) | 5-days Forecast
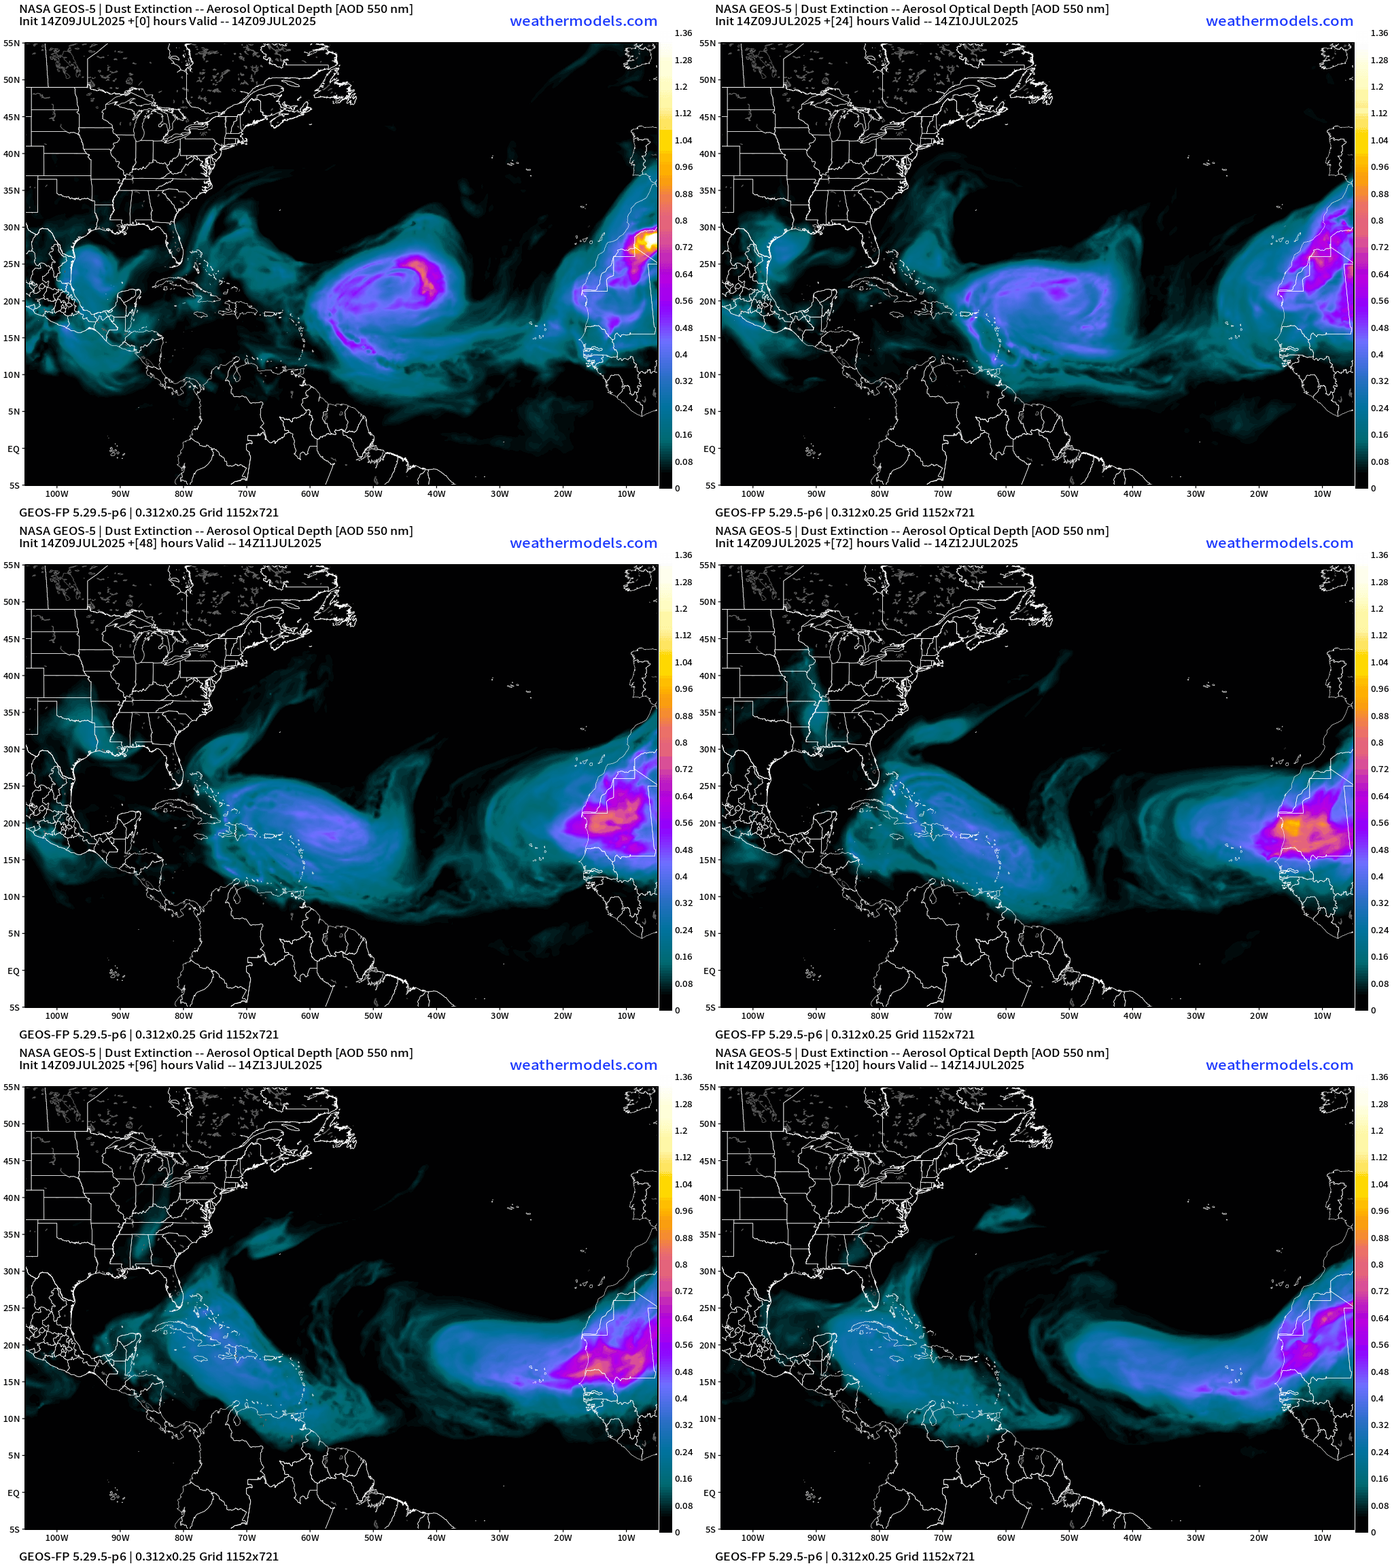
Massive dust plumes continue … not surprising for July, but eventually they need to dial back for the African Easterly Waves to survive!
Part of the reason why the Atlantic MDR can’t get going with organized convection is perpetual plumes of dust from the Saharan. These air layers are warm and stable above the surface and inhibit convection. The plumes circulate clockwise (high pressure) with a major amount of dust heading into the Gulf over the next few days in 2 waves.
Atlantic Ocean Surface Temperatures (SST) | Anomaly
The marine heat wave across the western Atlantic centered on Bermuda continues … with 28°C “warm pool” expanded across the subtropics. However, cooler water to the south and then really cool < 26°C to coast of Africa at 20°N will zero out any chances of tropical storm unless a wave can exit Africa at low-latitude and survive the SAL onslaught.
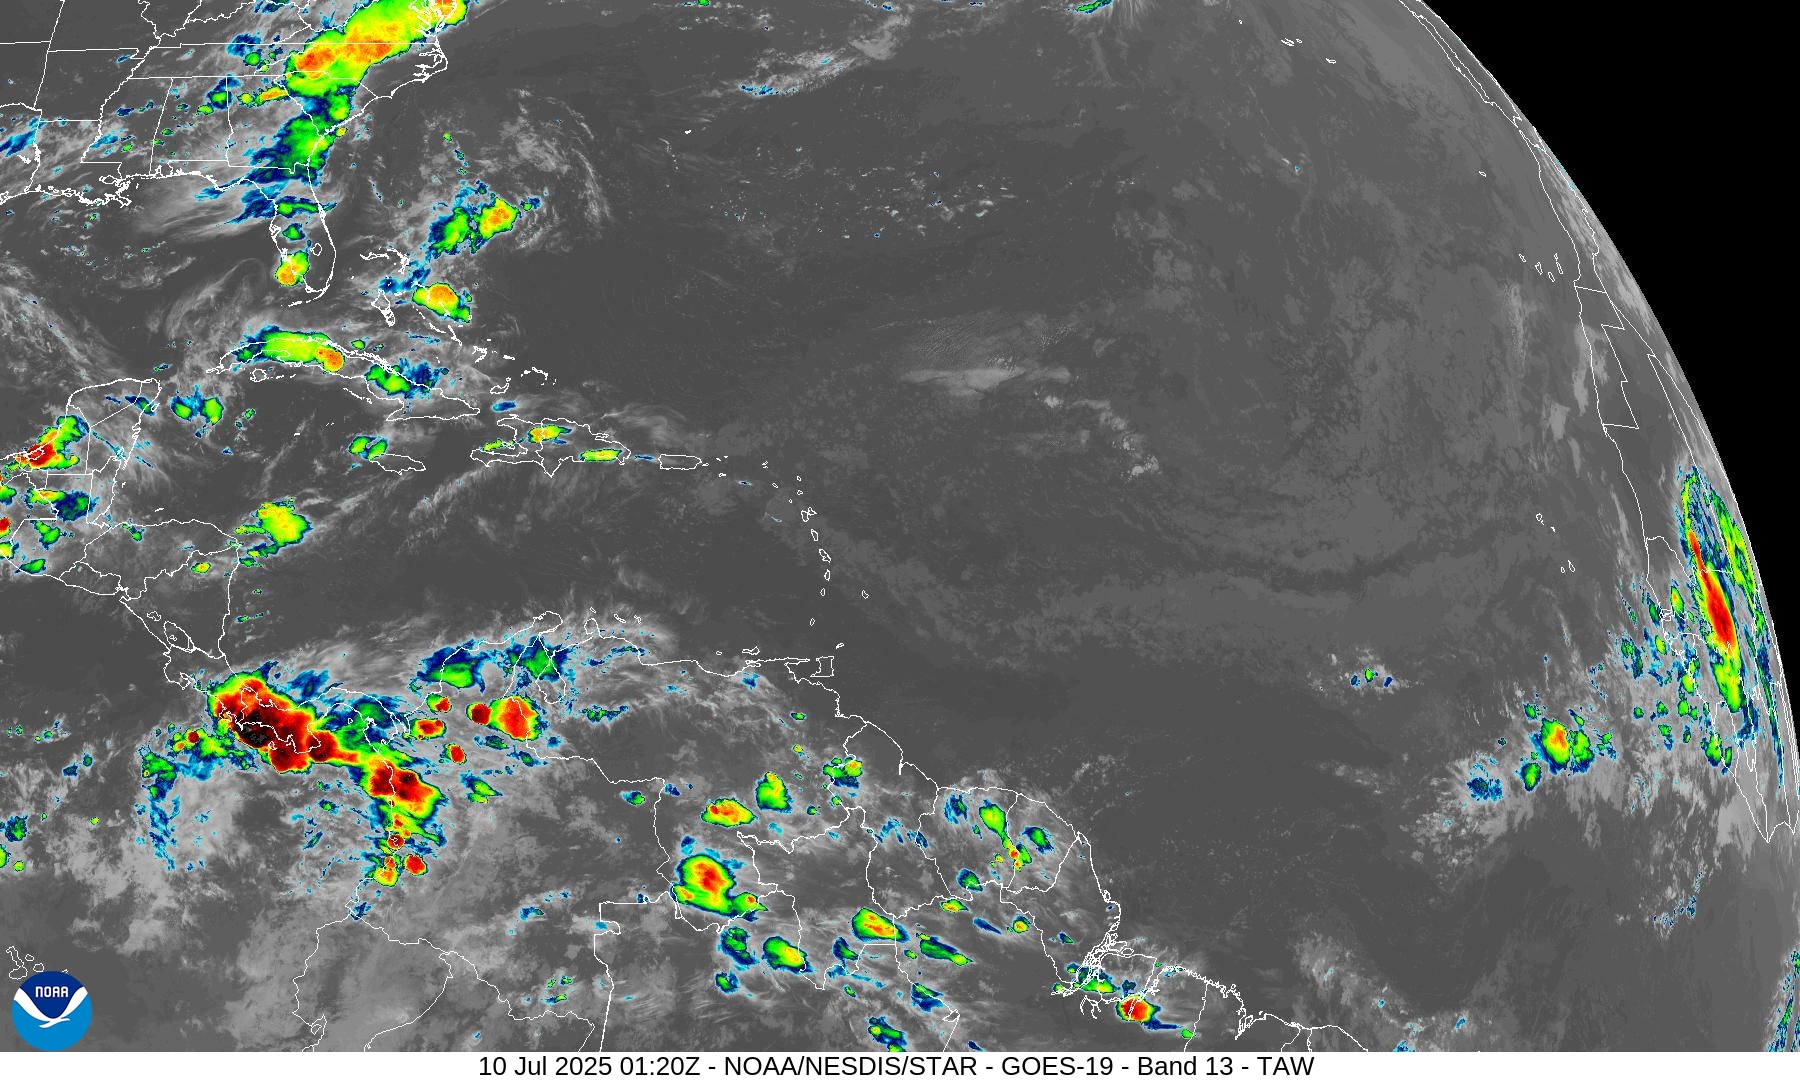
Tropical Atlantic Satellite Imagery
NOAA Tropical Surface Analysis | 18z
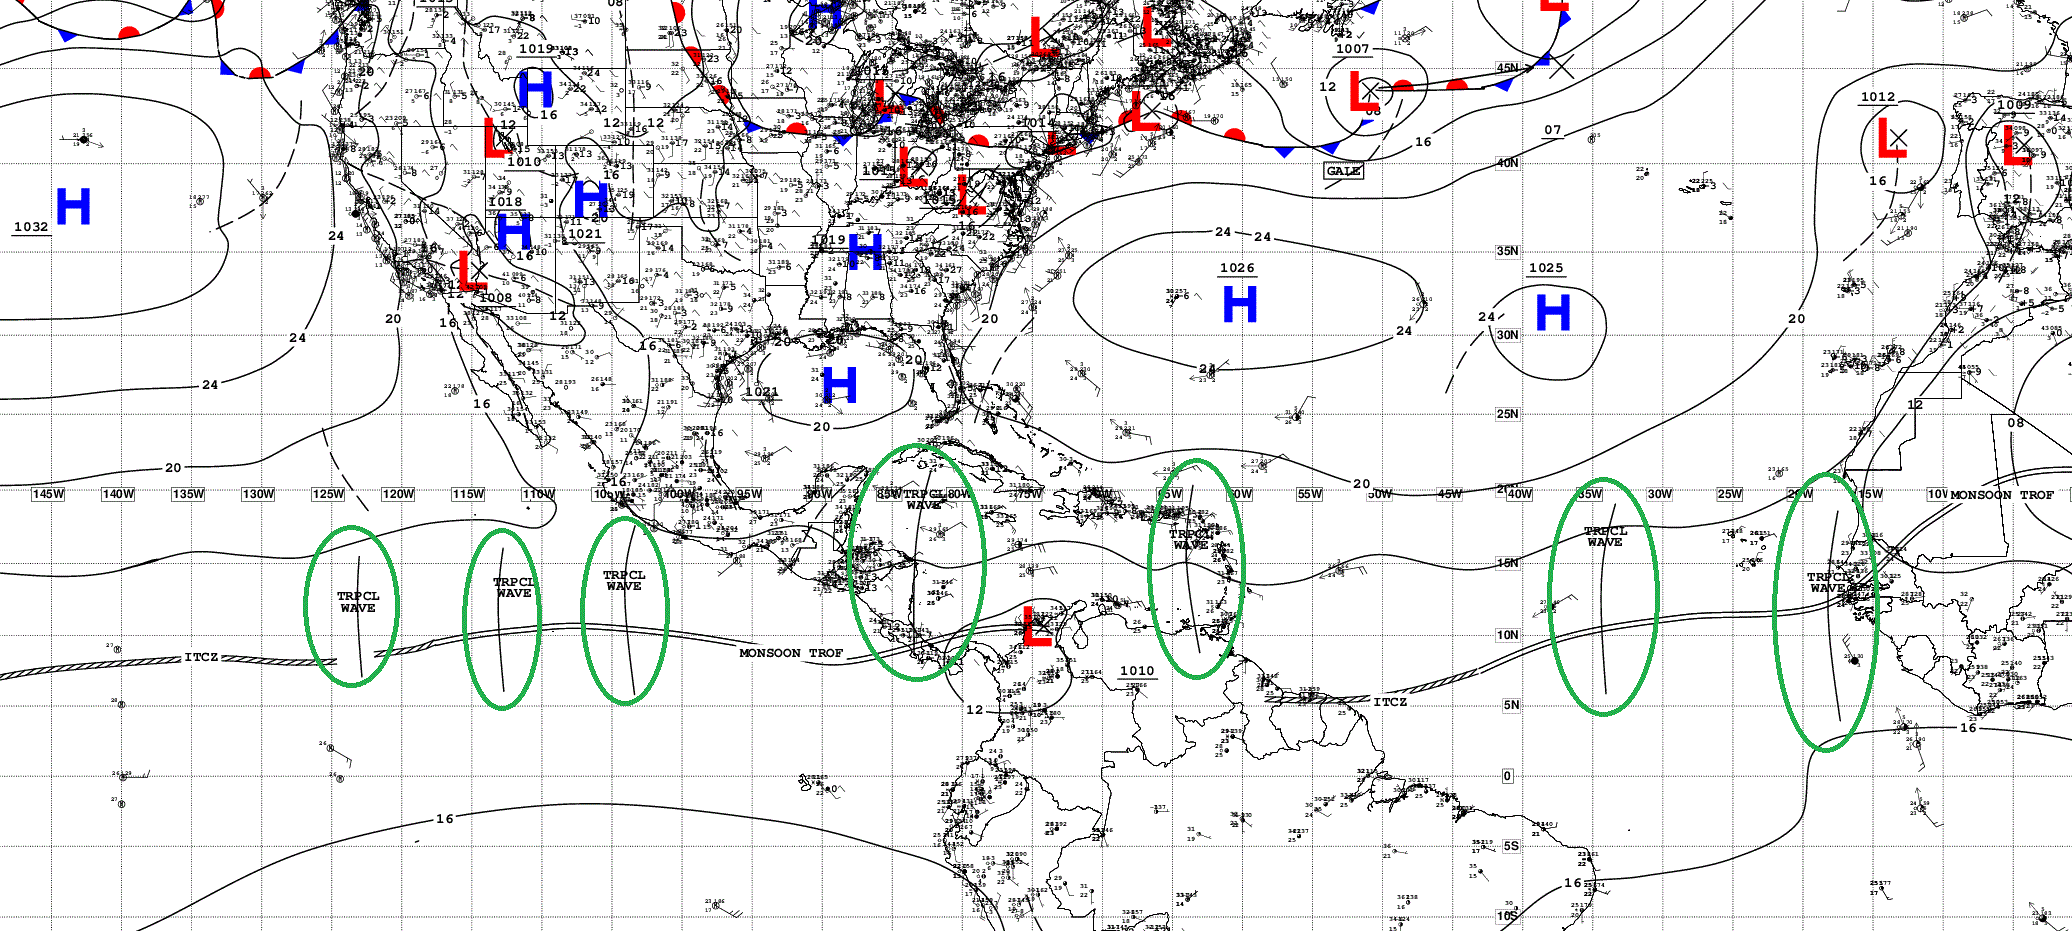
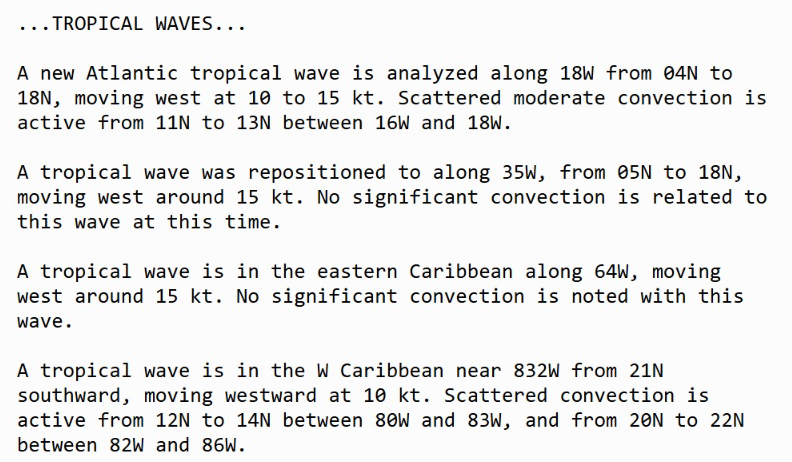
Atlantic Tropical Waves = 4 but only scattered showers observed as the large-scale environment is not conducive for tropical development.
Medium range ensemble model outlook
These are 51-realizations of the same model with different initial conditions. Each ensemble gets equal ~2% weight in a mean calculation.
ECMWF Ensembles 12z | 15-Days | All storm Tracks
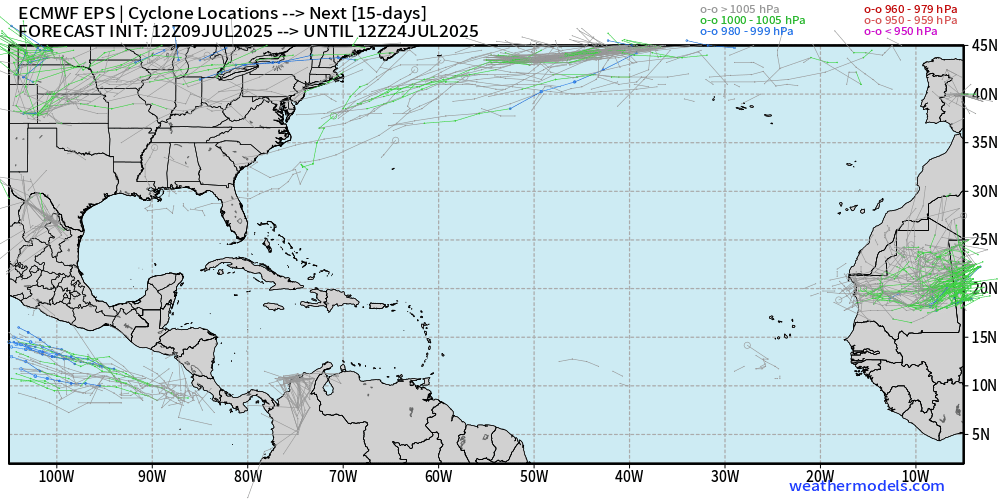
Ghost town through July 24.
ECMWF 15-days Control Run | Cyclone Tracks
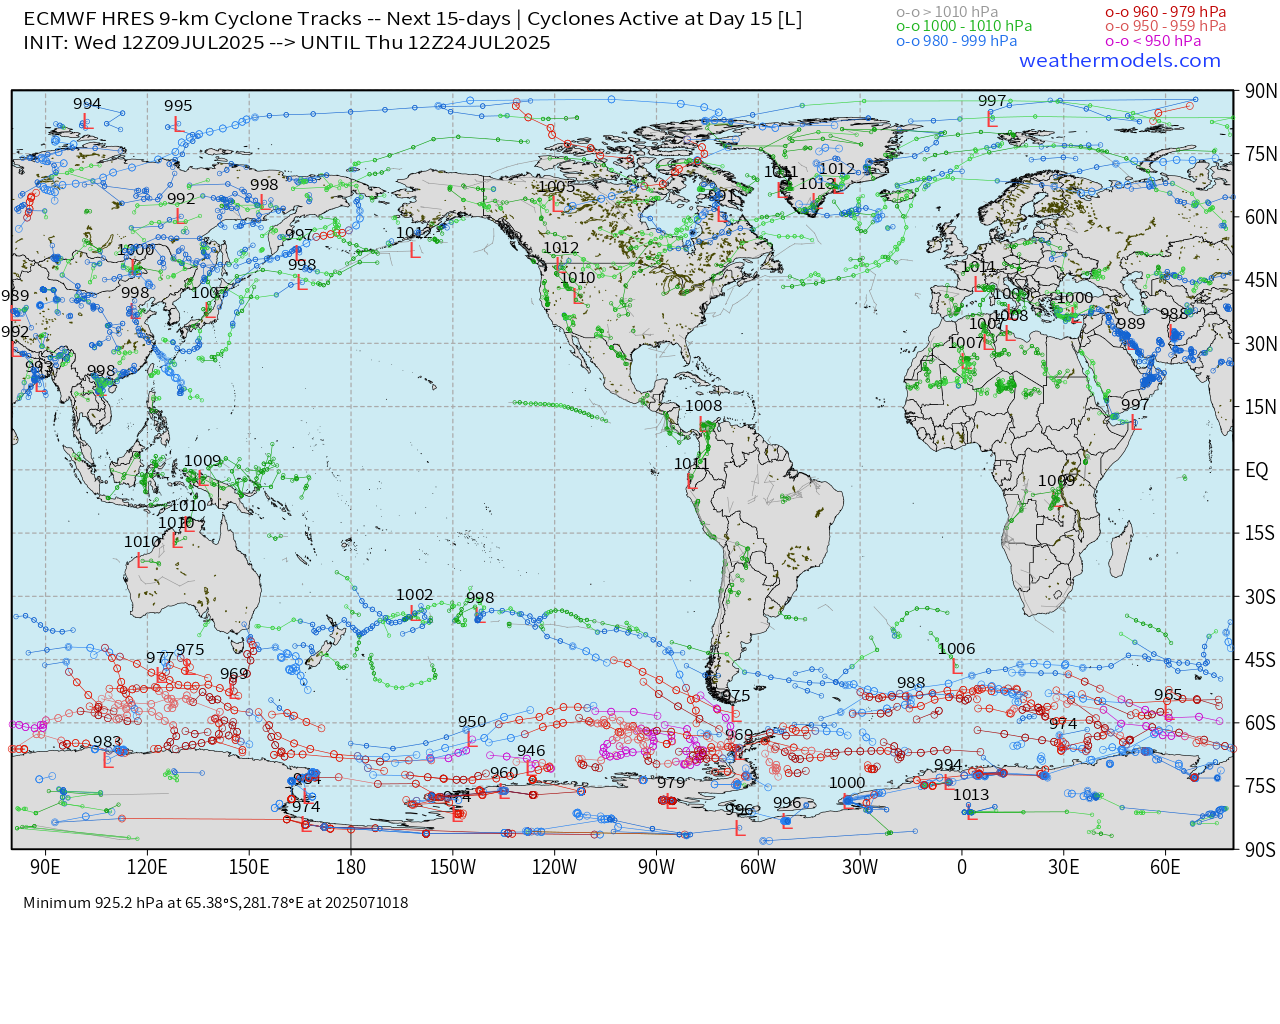
If you want strong cyclones, then head down into the Southern Ocean for major storms around Antarctica! Except for some close-in developments in the Western Pacific, and one lone storm in the Eastern Pacific, the rest of the global tropics remains quiet into the last week of July.
Eastern Pacific Tropical Update
ECMWF 12z Ensembles | 7-days Storm Tracks
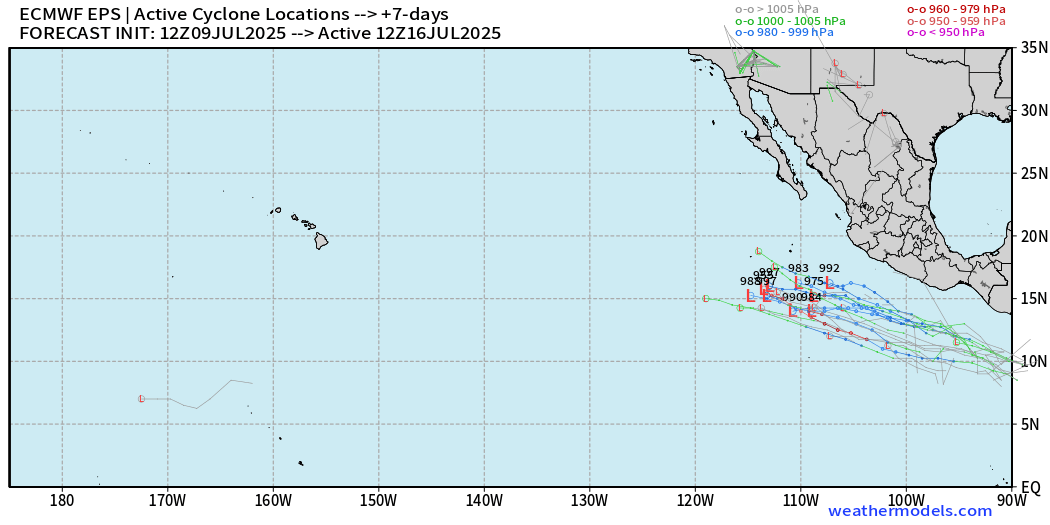
A fair number of options out of 51-ensembles through 7-days, so I’d expect a 20% hatch coming up tomorrow from NHC.
Western Pacific Tropical Update
15-days All Ensemble Tracks
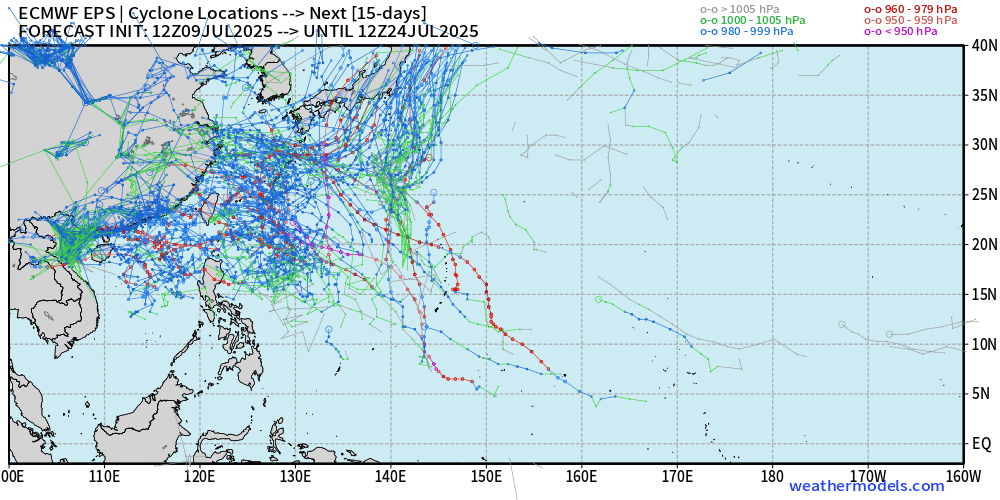
Looks like a mess for 2-weeks — but that’s a great way to show that the Western Pacific monsoon trough can spin up multiple storms whenever — but they are hard to predict and HUGE uncertainty when there’s no incipient vortex, but instead an unstable curtain of vorticity and very deep tropical moisture pooled over 28°C and warmer SST.
Ryan’s Notes:
June 2025: We use the ECMWF for medium-range prediction because the GFS can’t be trusted due to false-alarm bias, and unrealistic intensification of tropical convection into spurious (ghost) storms. I don’t agree this is a good thing like CNN.
We can look at the GFS every day for weeks and see a modeled tropical storm or hurricane in the Caribbean or Gulf especially after Day 10. However, this is a known bias/false alarm problem with spurious convective — vorticity spin-ups due to the convective parameterization or estimation of vorticity generation due to intense diabatic heating. Perhaps it’s worthwhile to show what will not happen.
Maps sourced from weathermodels.com designed and innovated by yours truly! Please subscribe there for real-time access to the newest maps, charts from all of the weather models including ECMWF.
- Milepost
- 667 · laid 2025-07-10T02:10:14.946000Z
- Source
- https://weather.substack.com/p/july-9-2025-hurricane-season-wednesday
- Digest
- 97e3f86e70cbeb34ec23403daaec98533dff1acd79d3773942adeedaf710b4c9
- Machine
- JSON