May 19, 2026 Tuesday Tropical Update
Atlantic hurricane season starts June 1st and we have many new forecasting tools
May 2026 was the 29th-warmest May in the 132-year national record (1895–2026), at 61.7°F against a 1991–2020 normal of 61.0°F (+0.6°F).
May 2026 was the 63rd-driest May in the 132-year national record (1895–2026), at 2.9in against a 1991–2020 normal of 3.1in (-0.2in).
NOAA/NCEI Climate at a Glance, contiguous United States. This is the observed record for the month, not a score of anything said in this piece — the forecast ledger begins 2026-08-17 and cannot reach earlier posts.

A Super El Niño is on the way for Summer/Fall 2026!
Getting ready for the start of Atlantic Hurricane Season June 1st, and since U.S. weather is rather quiet, I’m going to fill up a post with global tropics related maps, charts, and analysis. I admit I REALLY missed the tropics.
In 2026, we now have mature data-driven weather prediction ensembles (AIFS-Ensemble v2) in addition to full-physics ensemble systems like ECMWF EPS.
Let’s talk about an embarrassment of riches thanks to rapid advancement in A.I. tools and techniques for weather modeling:
Every 6 or 12 hours, we get an update including these model output:
ECMWF EPS full-physics ensembles … 50 perturbed members + control/HRES
ECMWF AIFS-Ensemble (data driven) … another 50 members + control
ECMWF AIFS-Single … a special deterministic system that has exceptional skill
NOAA GEFSv12 Ensembles … 30 perturbed members + control
NOAA GFSv16 … 13-km high resolution global deterministic
UK Met Office MOGREPS lagged ensembles … global 14-km 72-members per day
Environment Canada ensembles + Germany ICON + Australia BOM Unified Model
New Google WeatherNext 1000-member ensemble system (!) more on that in future post
This requires a lot of data processing, and many individual companies do it for a modest subscription of $15/$30 month, but there are free options. I believe there is a market void for an “ad revenue” supported weather maps site that is of much higher quality e.g. 4K TV style mapping, especially for videos. We’ll see if that’s viable!
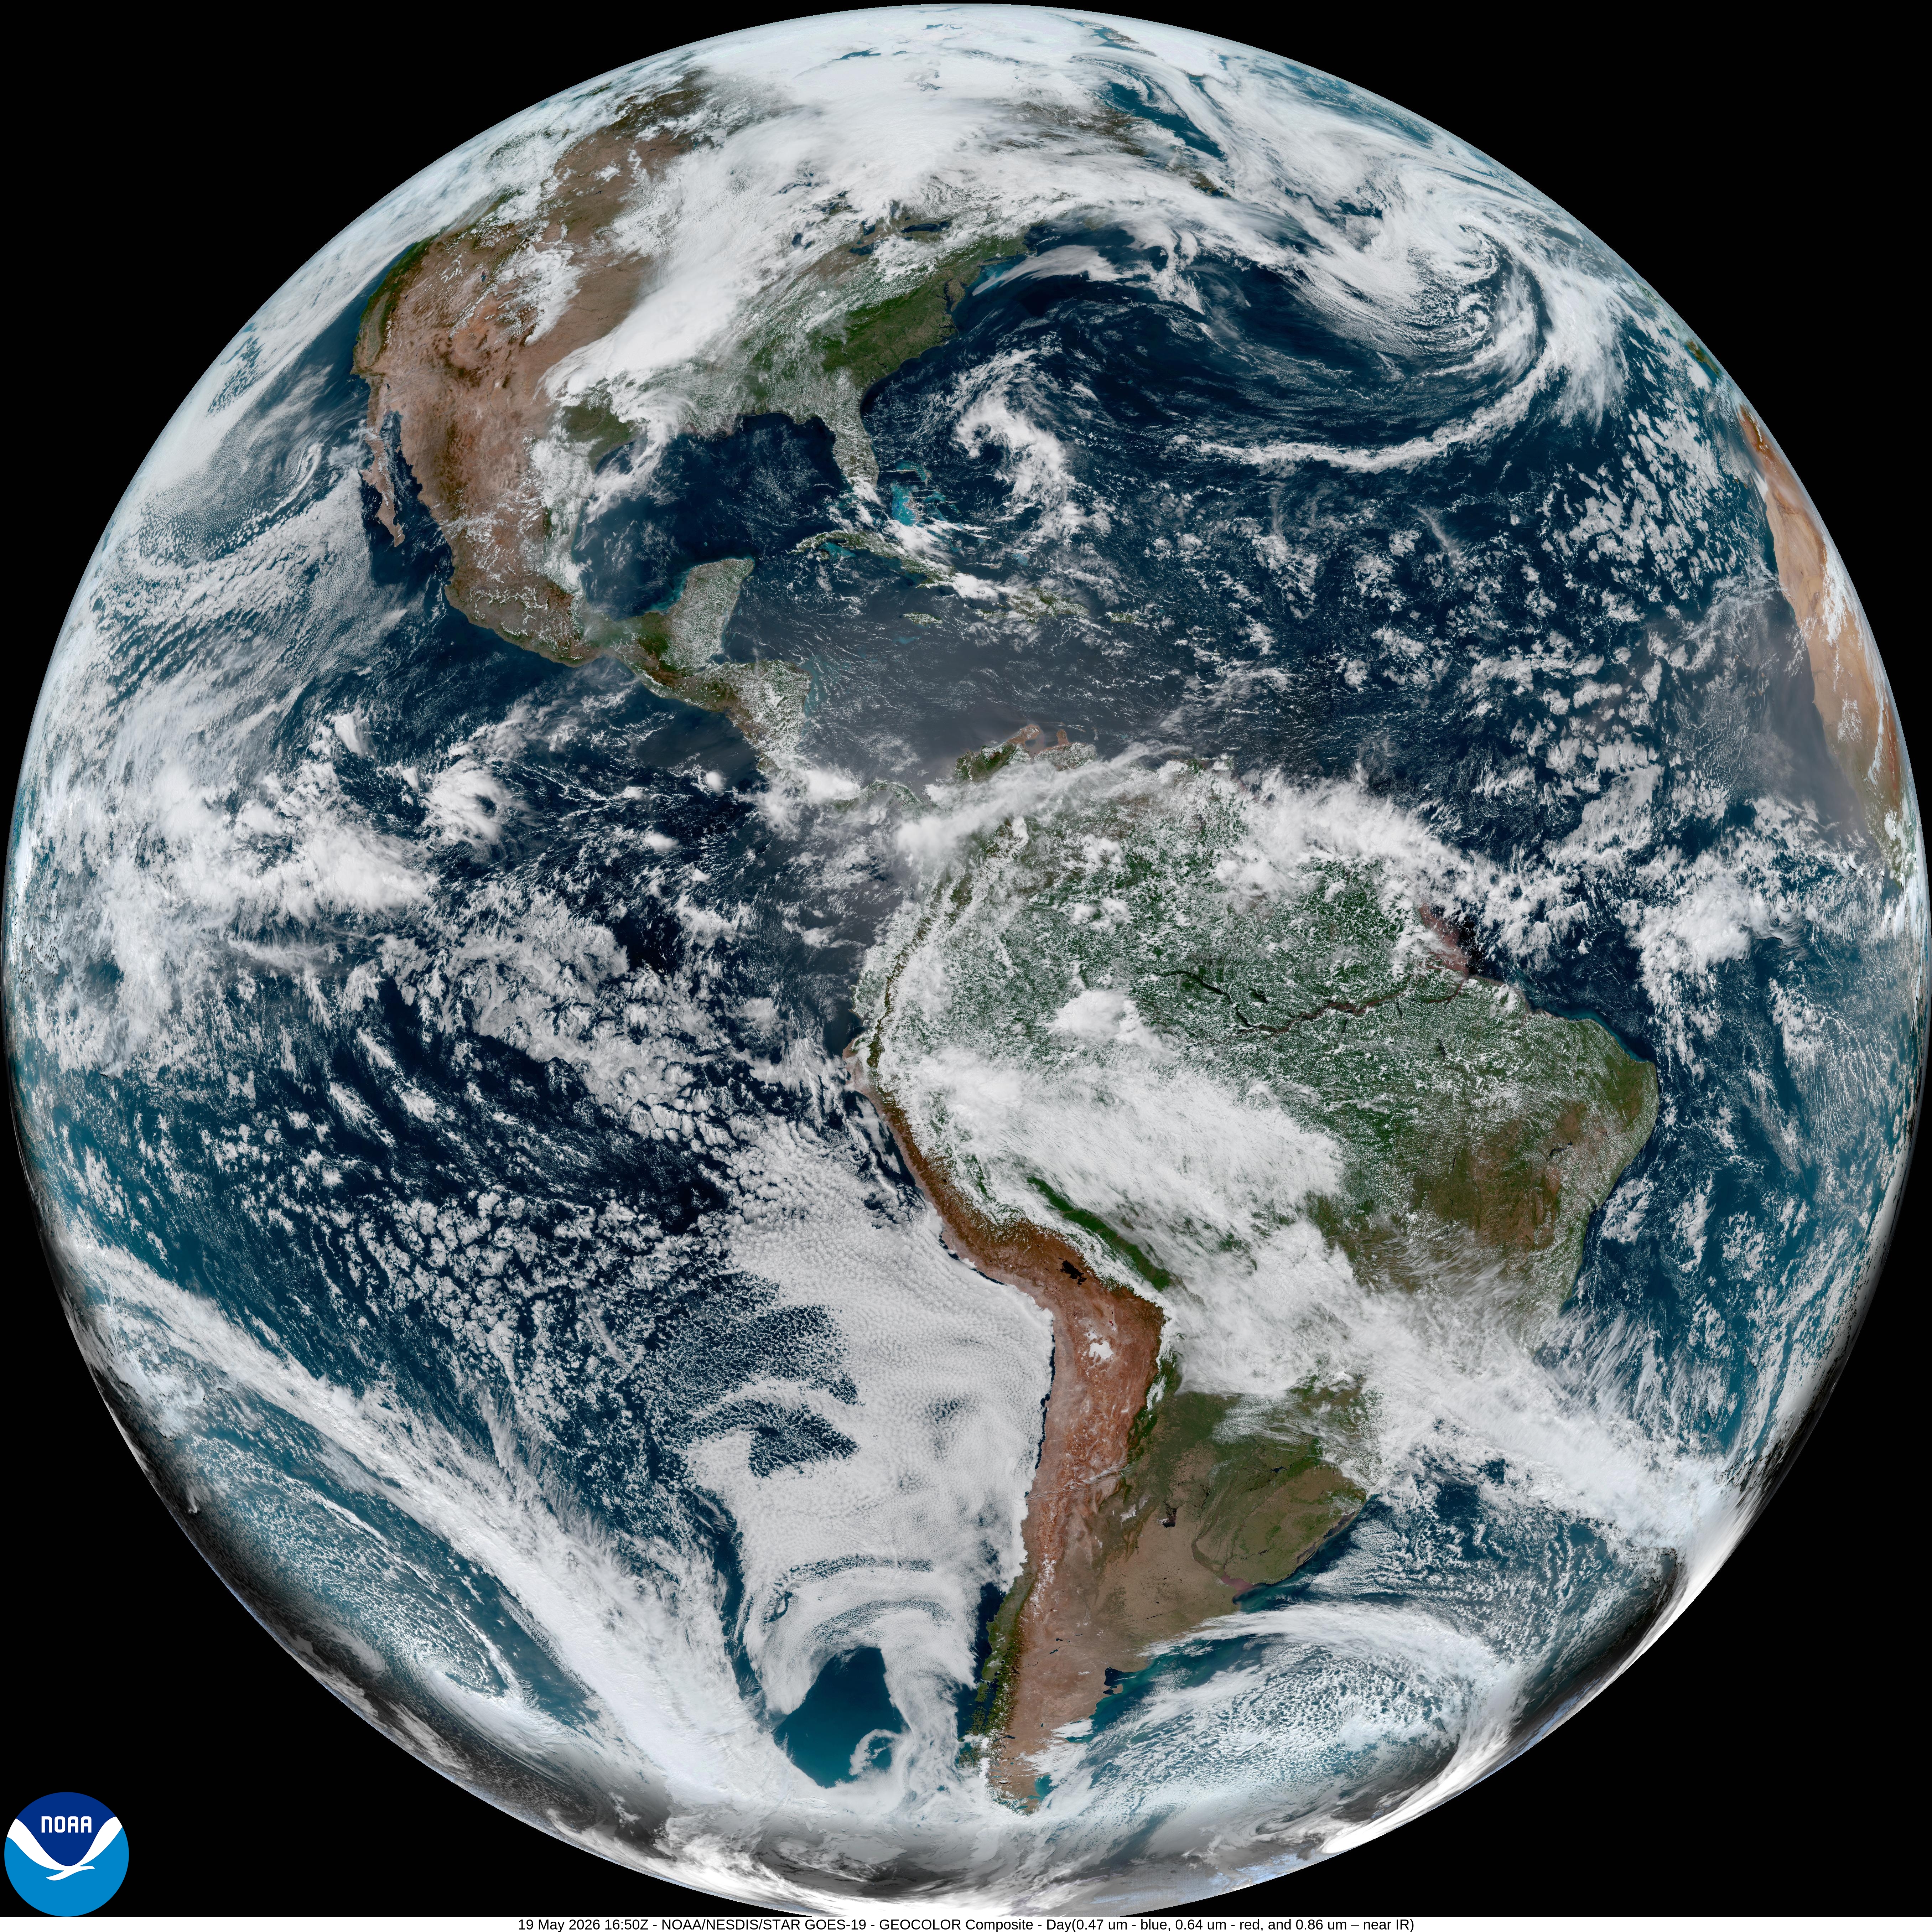
GOES East Geostationary Satellite: Full Disk earlier Tuesday — GeoColor
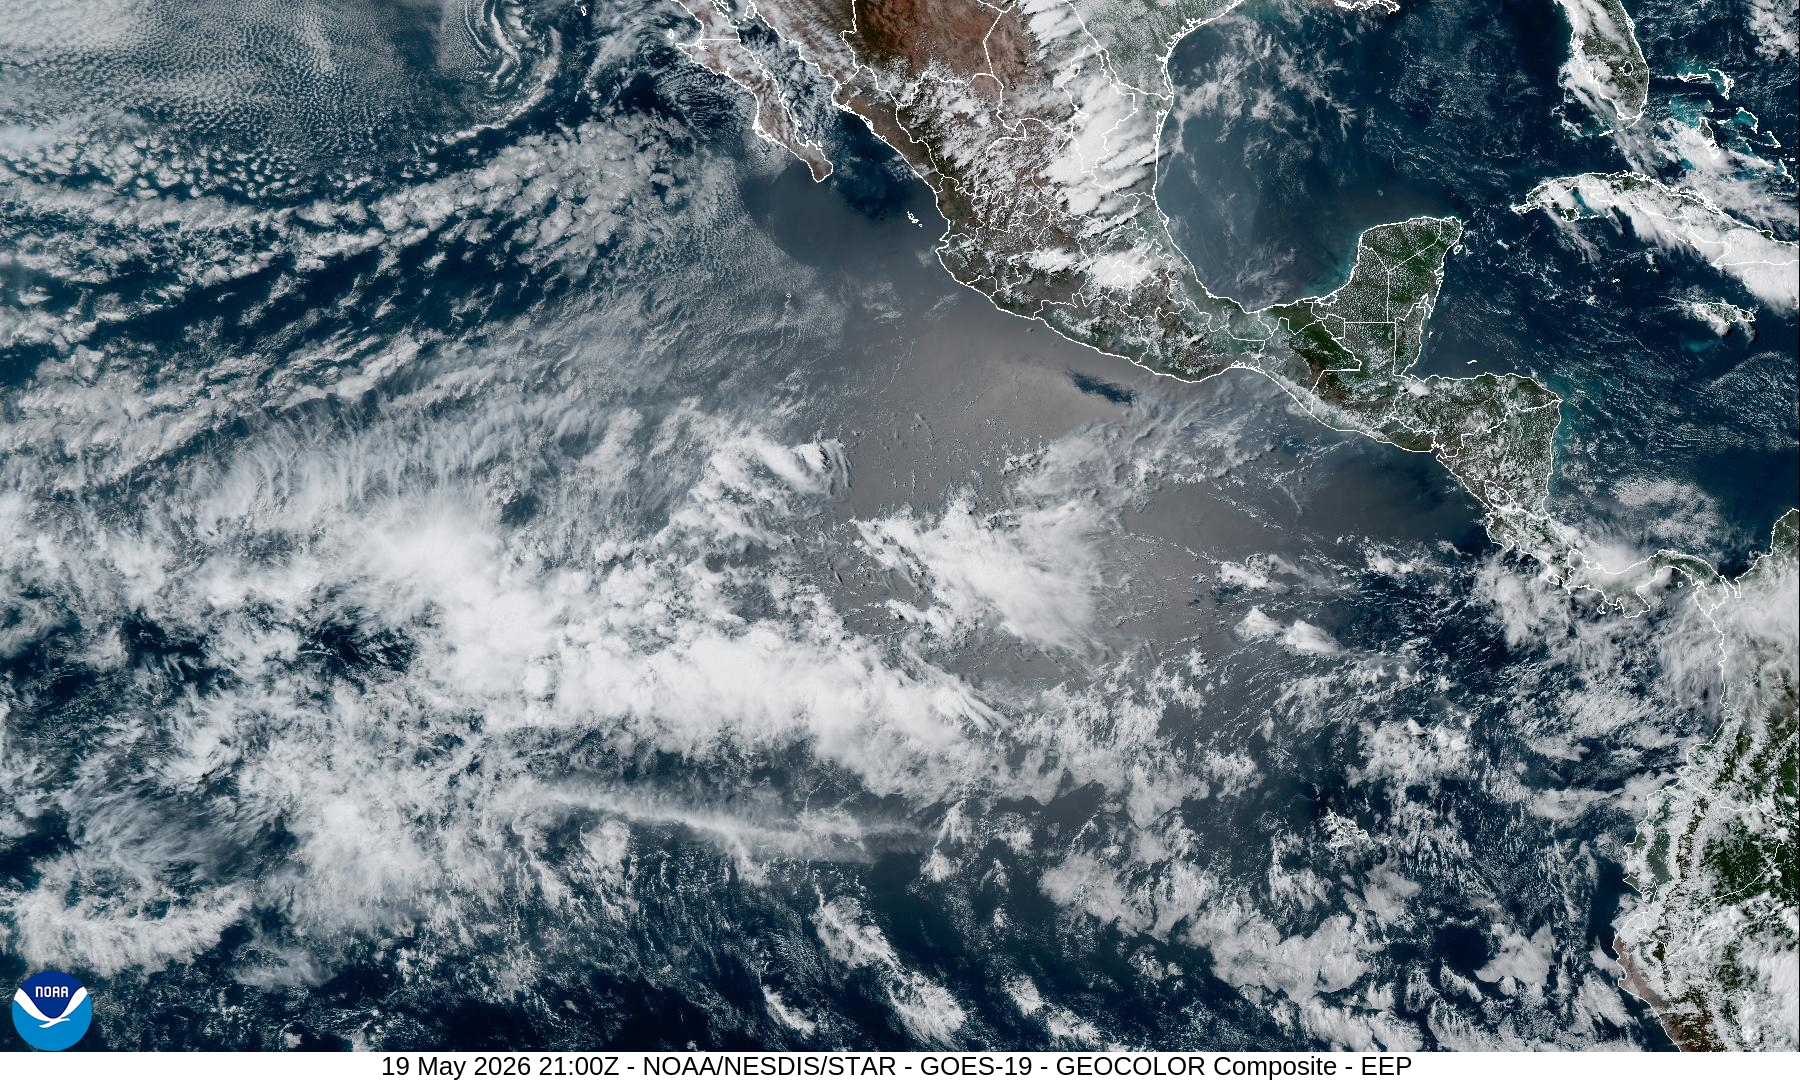
Eastern Pacific + Central Pacific
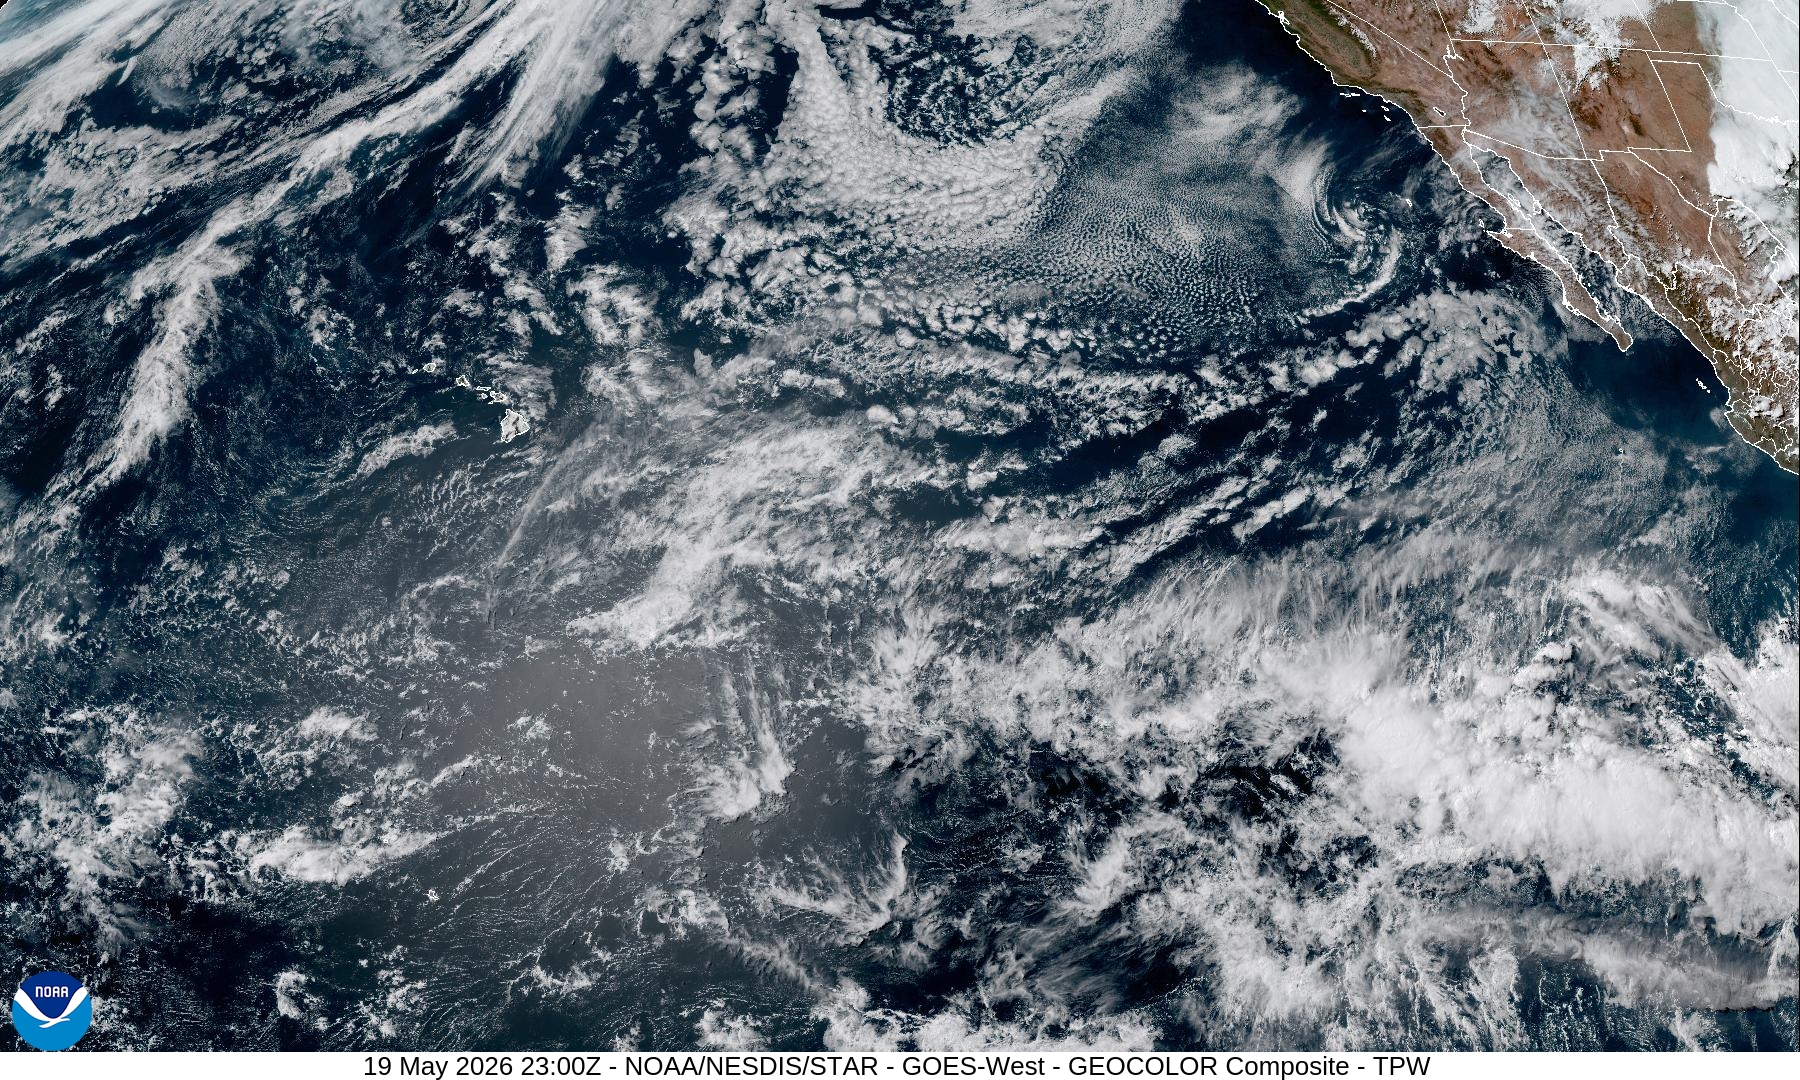
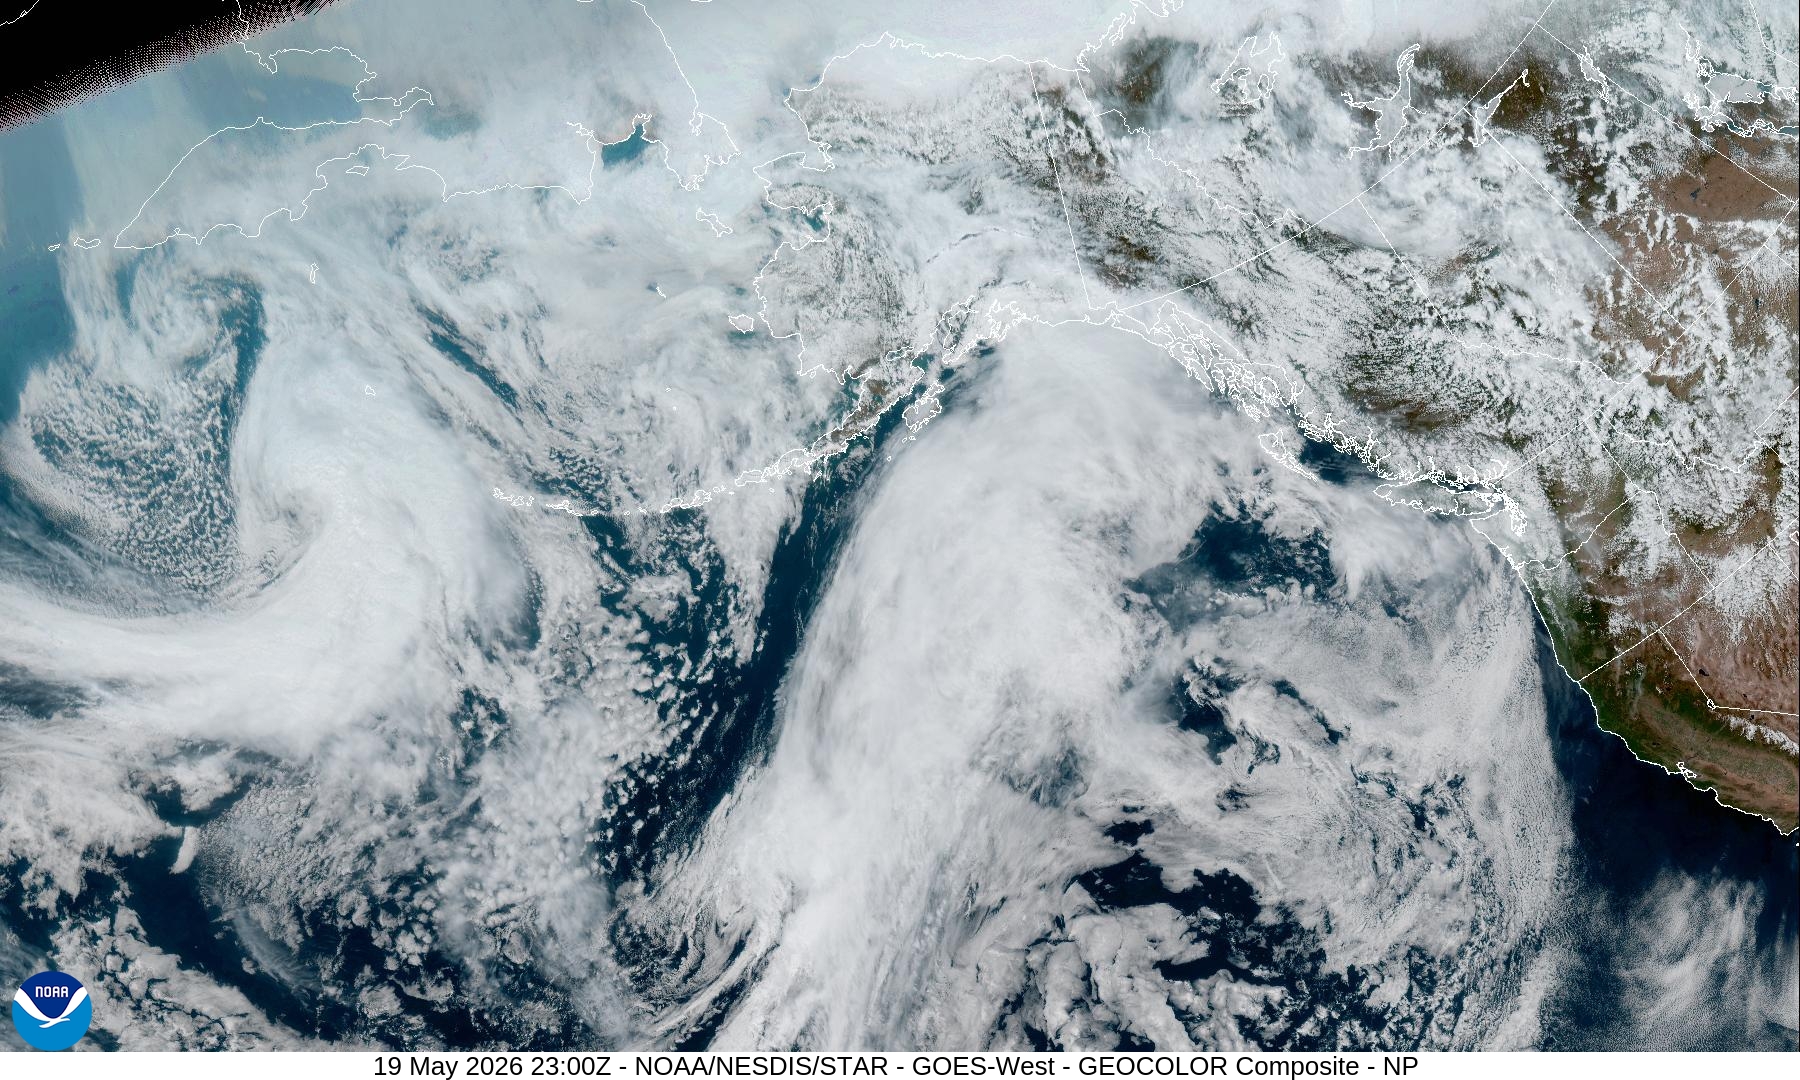
Northwest Pacific — not the tropics — but a view probably few see daily
With the expected Super El Niño into the summer/fall, the Atlantic hurricane season will likely be quieter / less active that recent years. We can simply take the climatology over the past 30-years and sort the seasons, and look below the median for typical outcomes. We now have three full decades of observed storms in the Atlantic since the positive (warm) phase of Atlantic Multidecadal Variability onset in 1995. My forecast last year (2025) was pretty good — largely based upon a simple model I developed in grad school using the Multivariate ENSO Index (MEI), so we’ll give 2026 a whirl. This was from post on April 7 —>
From April 7, 2026: Atlantic Seasonal Hurricane Forecast: (11/5/2)
9-13 Named Storms (11 most likely)
4-7 Hurricanes (5 or 6 most likely)
1-3 Major Hurricanes (2 most likely)
Accumulated Cyclone Energy: 75-85
Atlantic Basin Satellite Channels
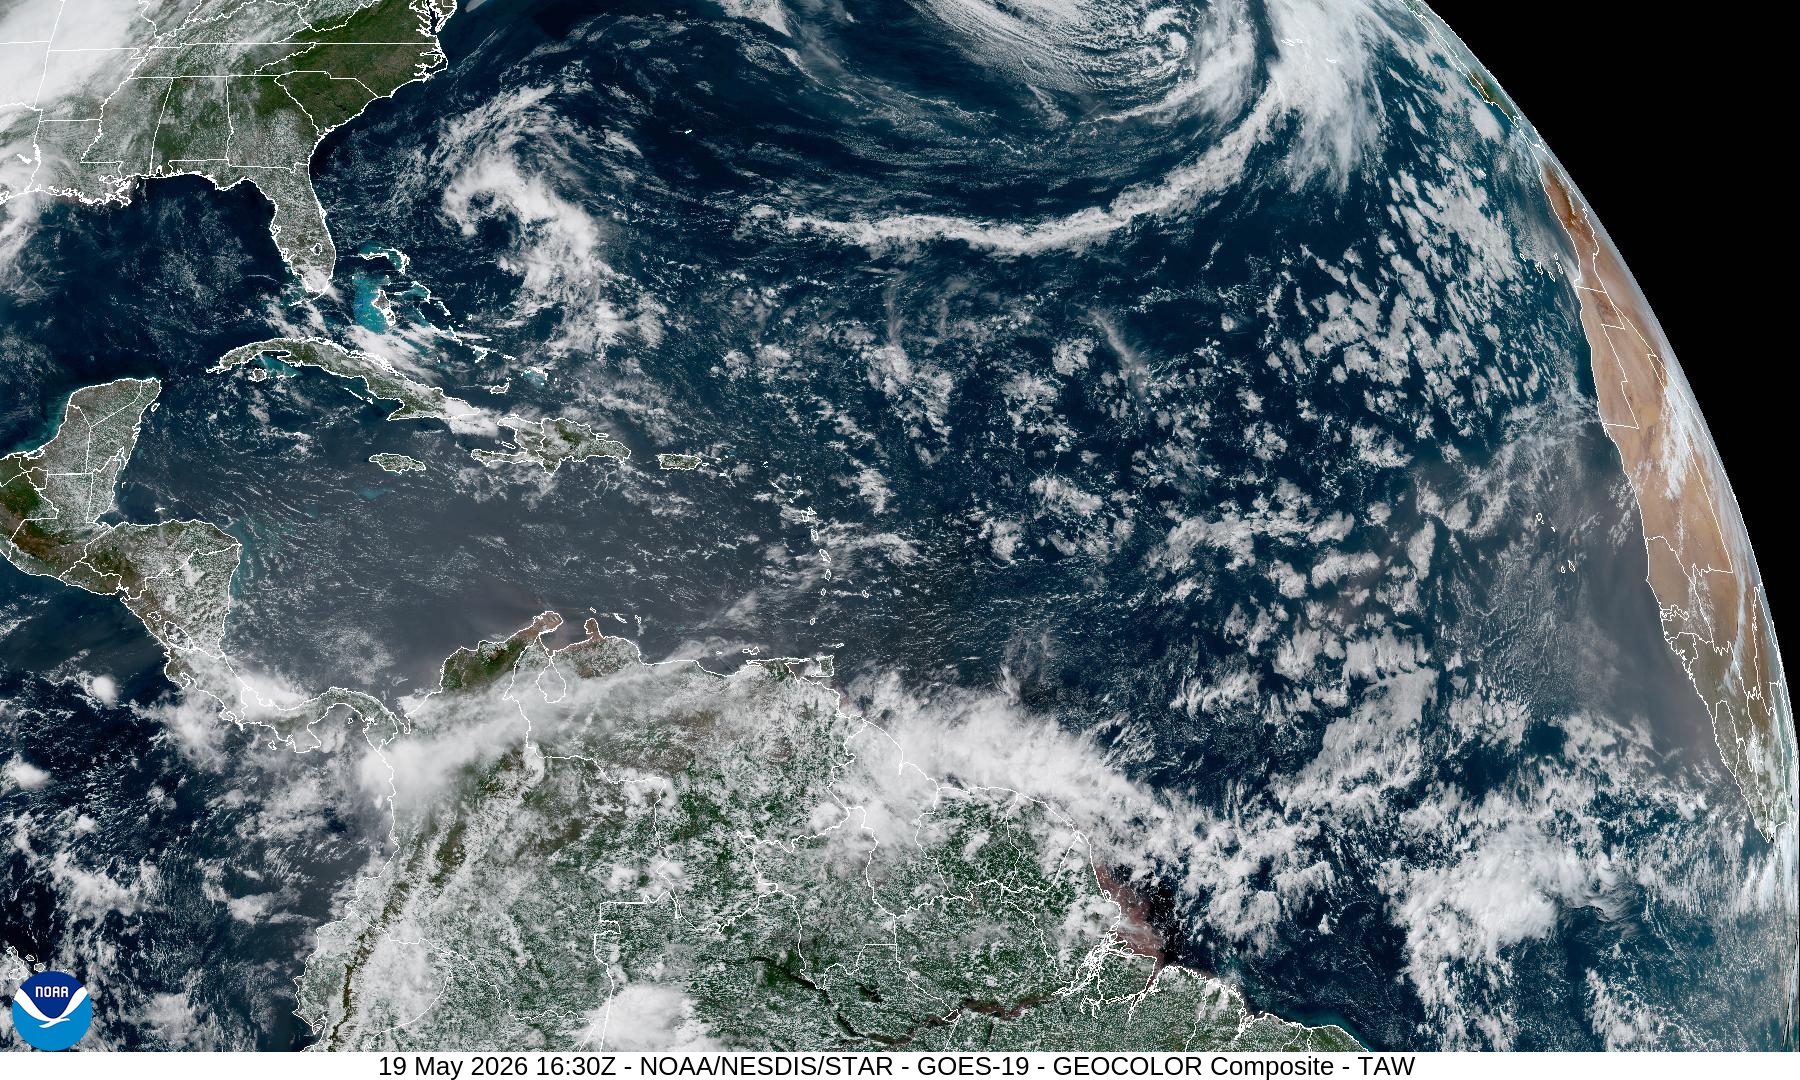
GeoColor show the visible “true color” just as you’d see from space — in geostationary orbit (locked in place to look down) … aside from the puffy clouds and some storms, you can see the milky brown haze = African dust or Saharan Air Layers (SAL) that come off Western Africa into the Atlantic Ocean. SAL is bad for the hurricane business = stable/warm layer that limits instability and convection (storms)
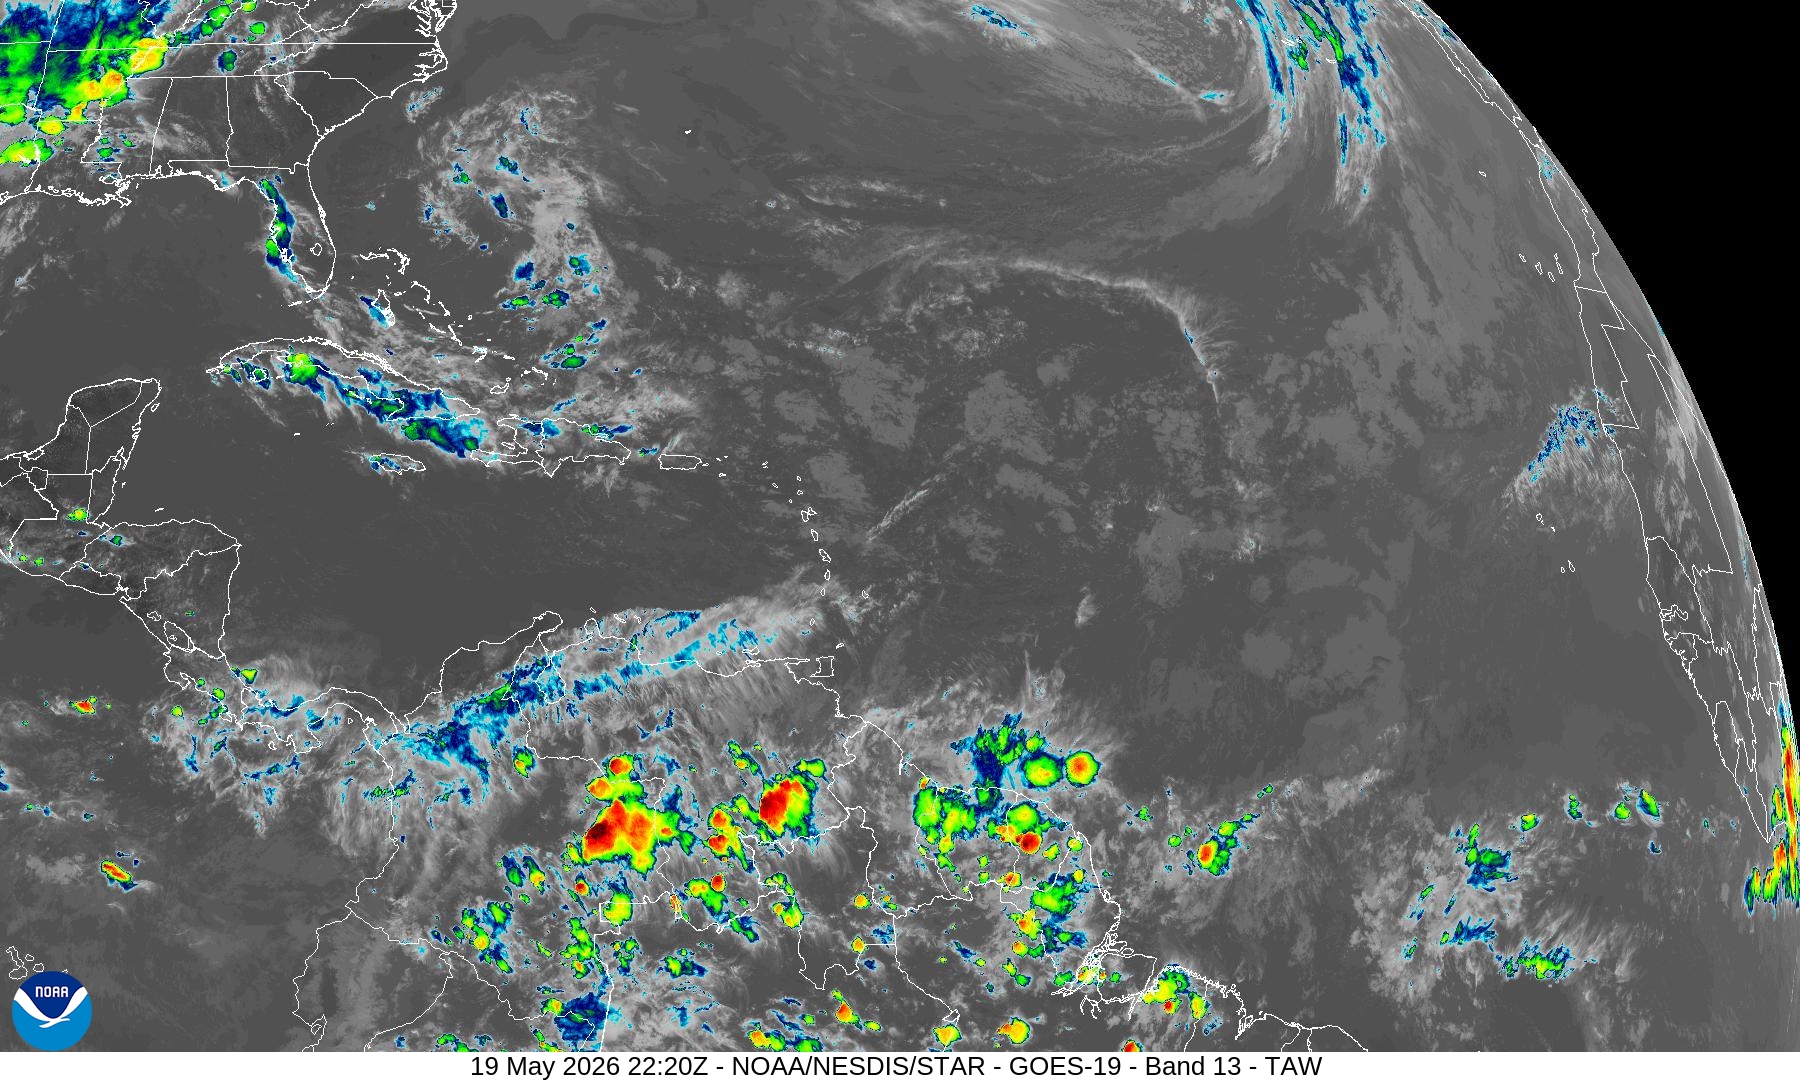
Infrared (Channel 13) colorized —> showers and thunderstorms
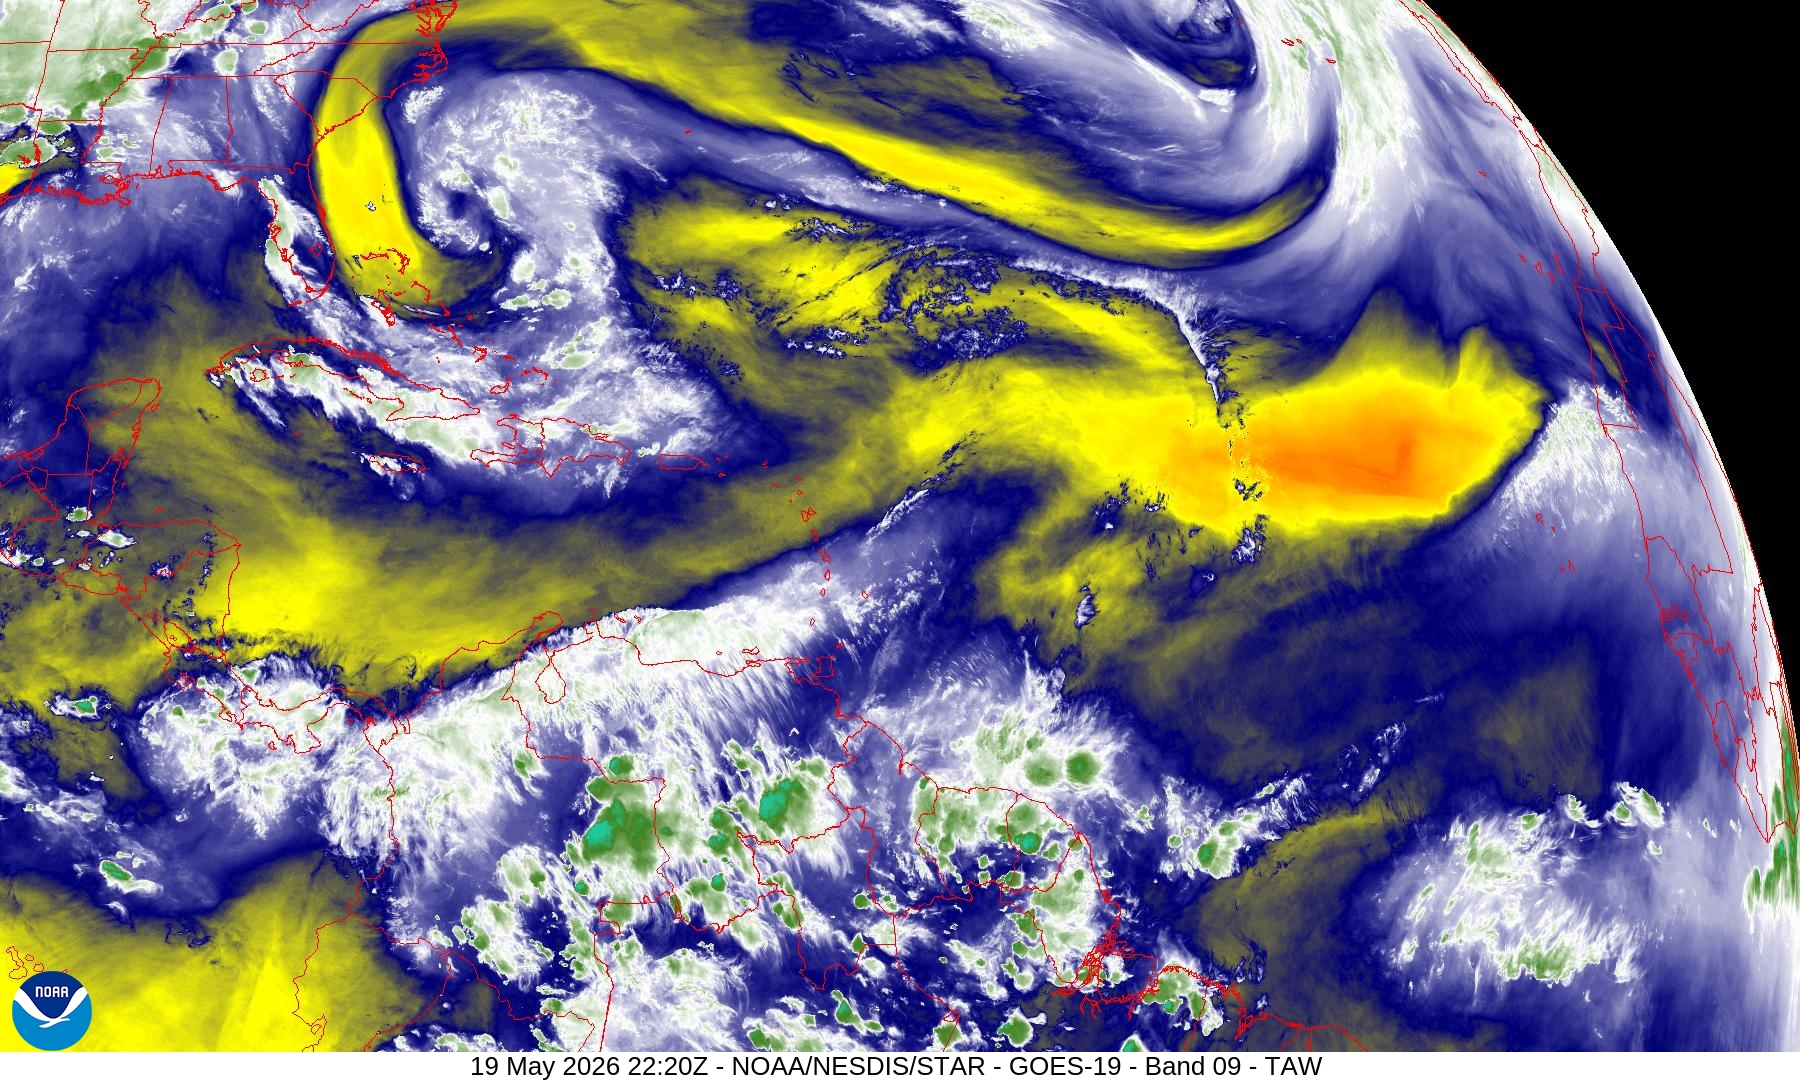
Water Vapor (Mid-Level Channel 9) —> troughs and areas of descending/dry air
ECMWF 12z | Precipitation Type + MSLP | Next 8-days
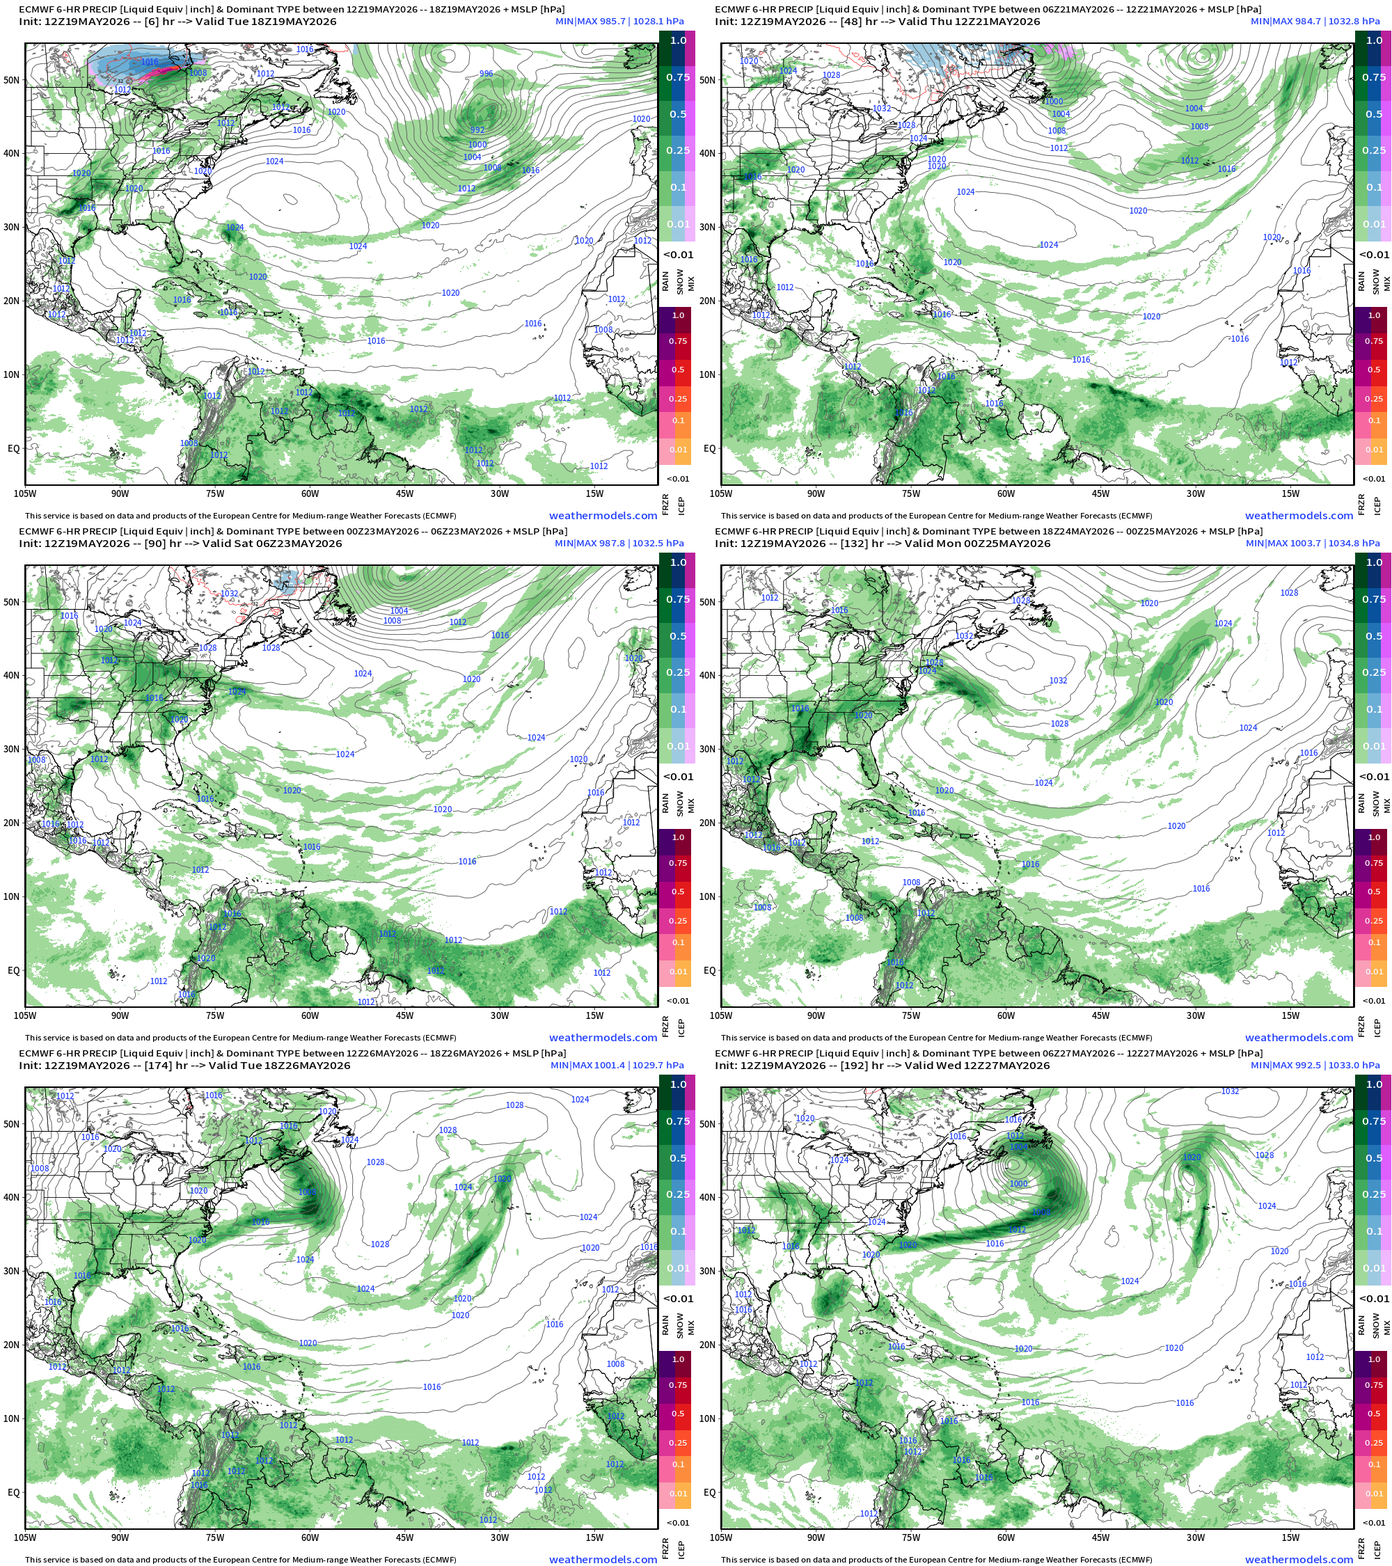
The Intertropical Convergence Zone (ITCZ) in the tropics along 5°N to 10°N is where moist air can ascend and form thunderstorms or like a convective pot boiling over = convection. In the coming weeks, especially into late June, we’ll look for areas of disturbed weather — which means persistent convection — and potential formation of low pressure swirls along the ITCZ with tropical waves, in the Caribbean and Gulf of Mexico (America) with decaying frontal boundaries, and other pathways like tropical transition or subtropical cut-off lows. Lots of options/ways to form a tropical storm in the Atlantic in any given season.
The Bermuda High —> Azores High in the subtropics usually keeps things quiet in the latitude around 30°N and suppresses the ITCZ to the south in late May into June. On the periphery of the Bermuda High, moisture plumes out of the Caribbean into the Gulf and then Texas + Southeast.
NASA GEOS5 —> African dust plume forecast next 10-days
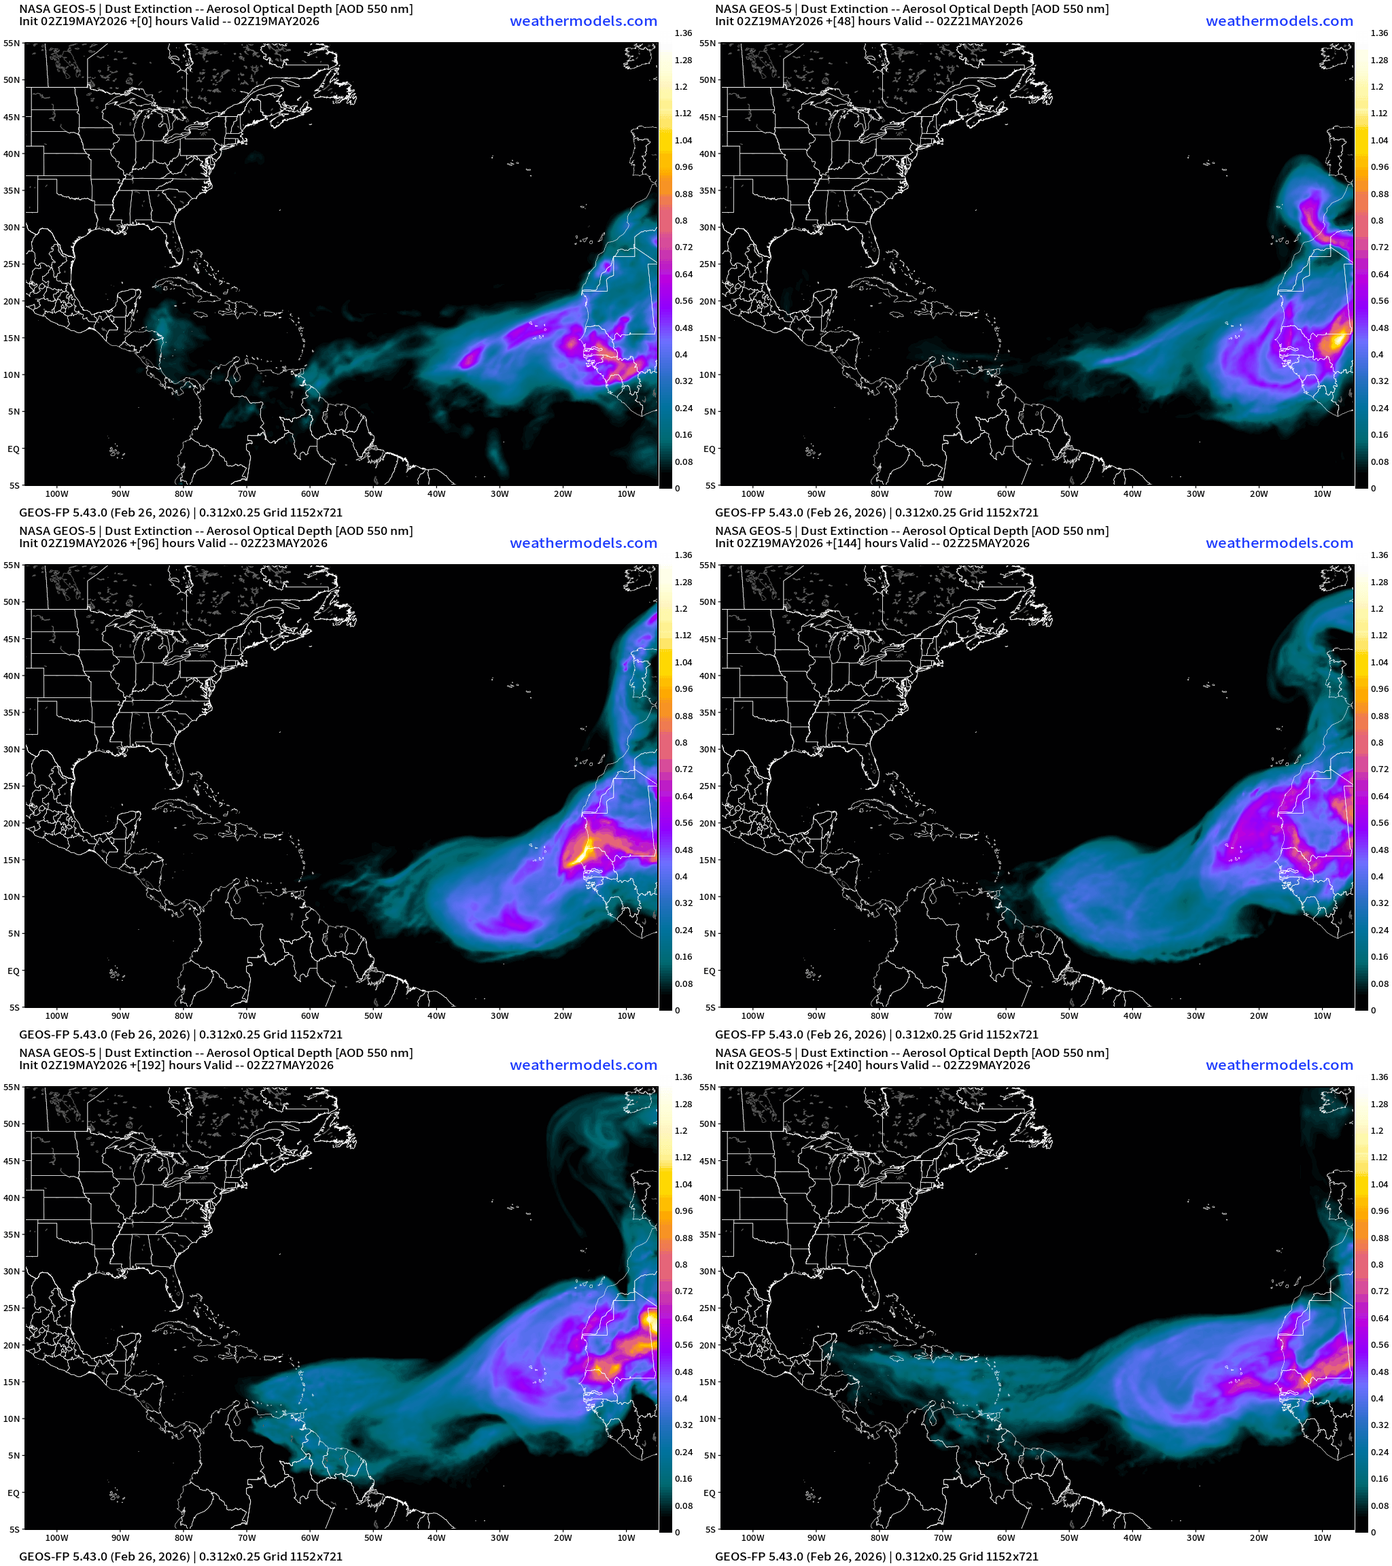
NASA runs a version of GFS internally that is configured to ingest / test various satellite based instruments. Their dust algorithm with GEOS-5 is very good, and I really like to show the evolution of African dust (Saharan Air Layers) over the Atlantic.
Right on schedule into late May, we have a major plume coming off the continent.
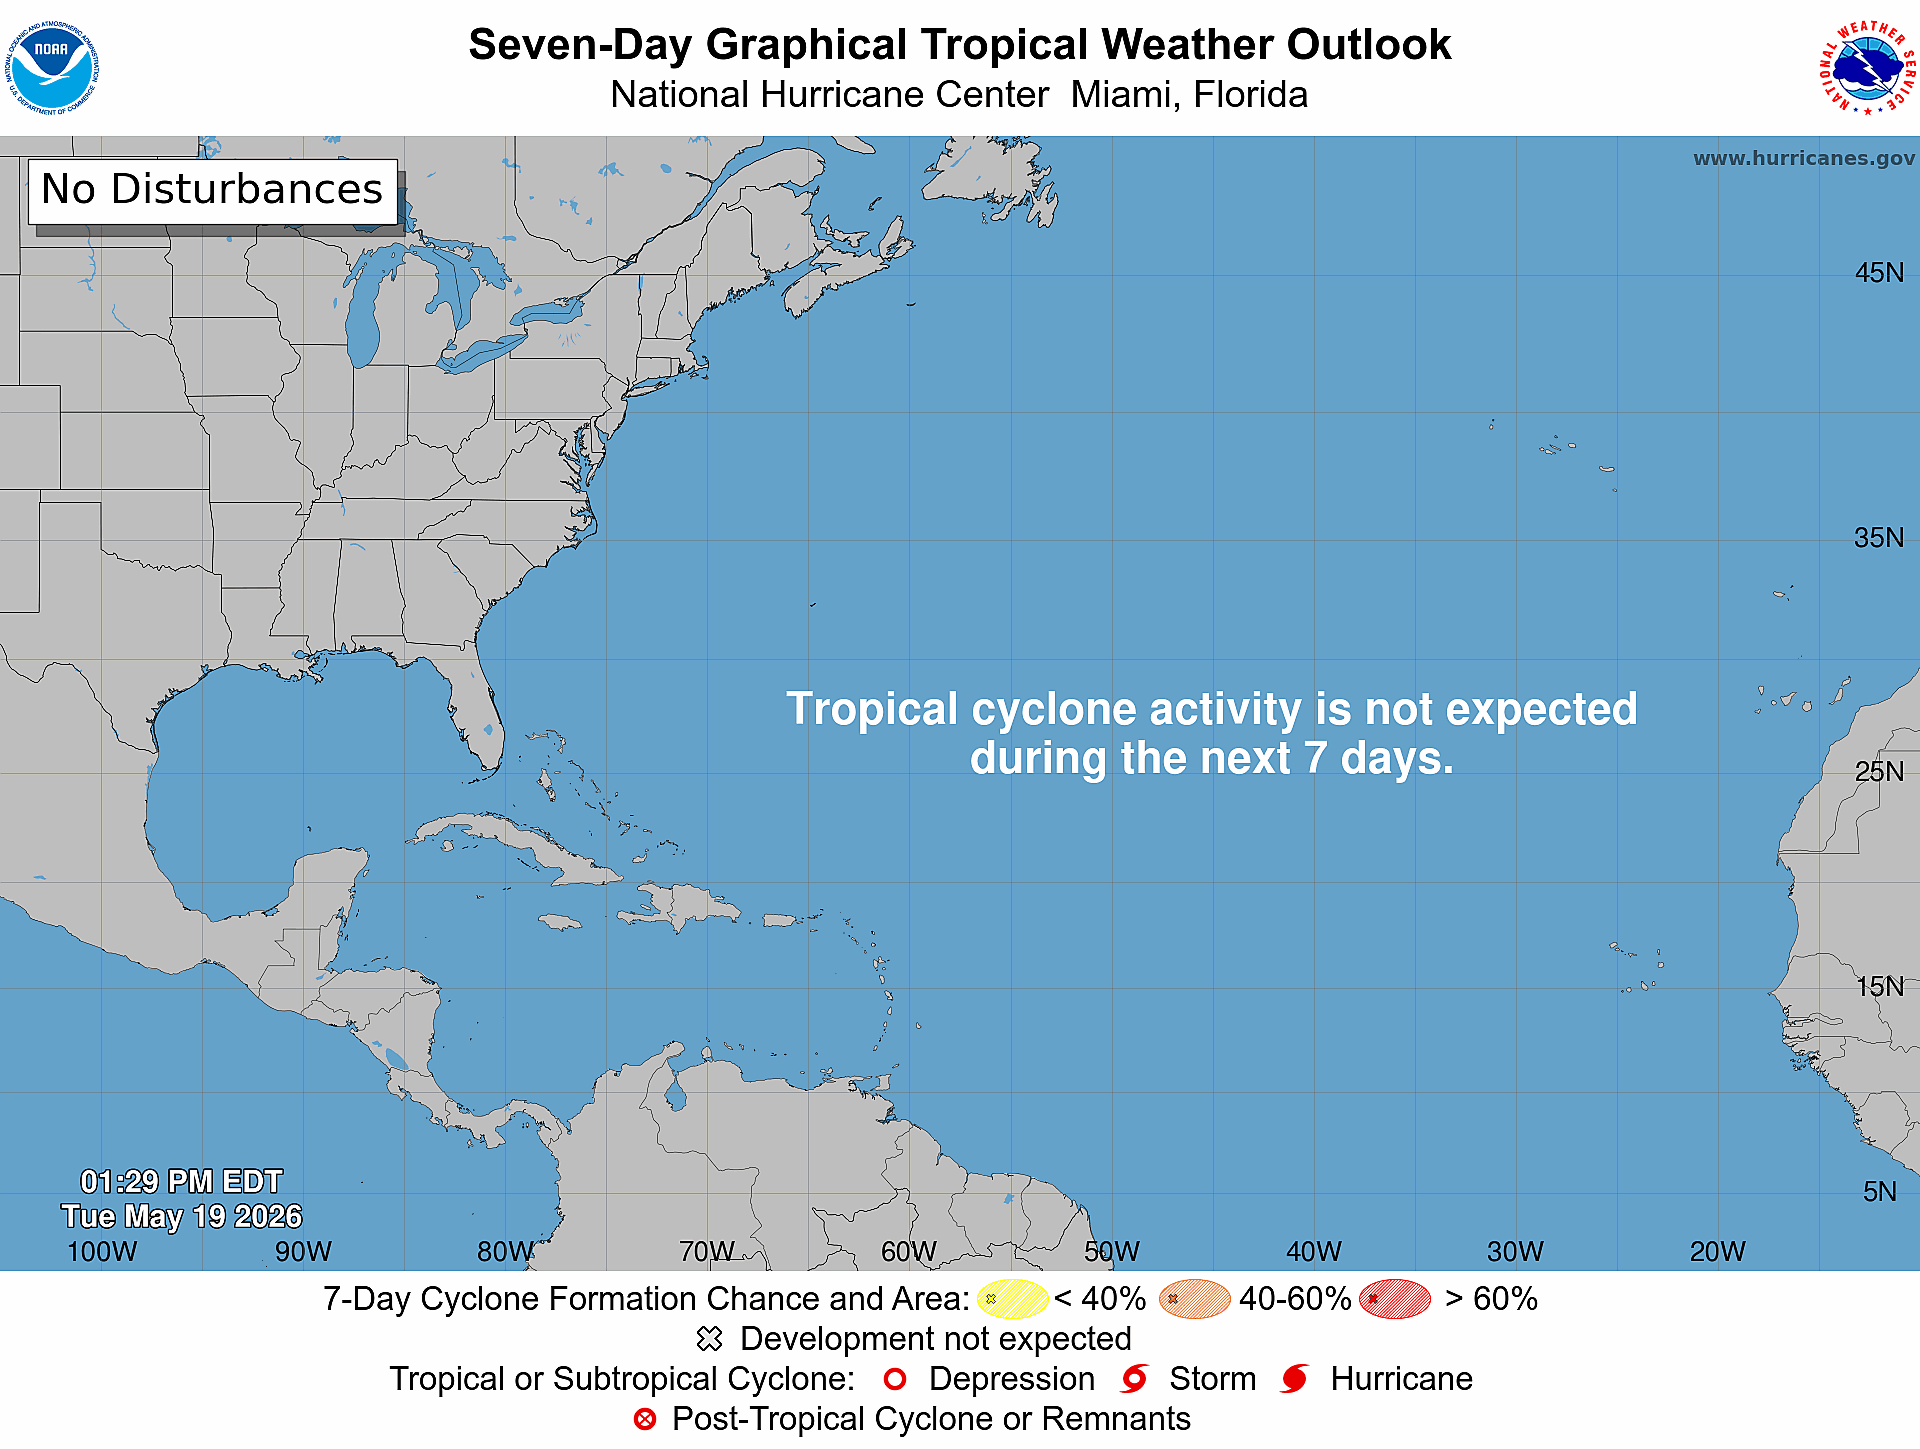
North Atlantic Tropics | Quiet Next 7-days
National Hurricane Center (NHC) is issuing Tropical Weather Outlooks (TWO)
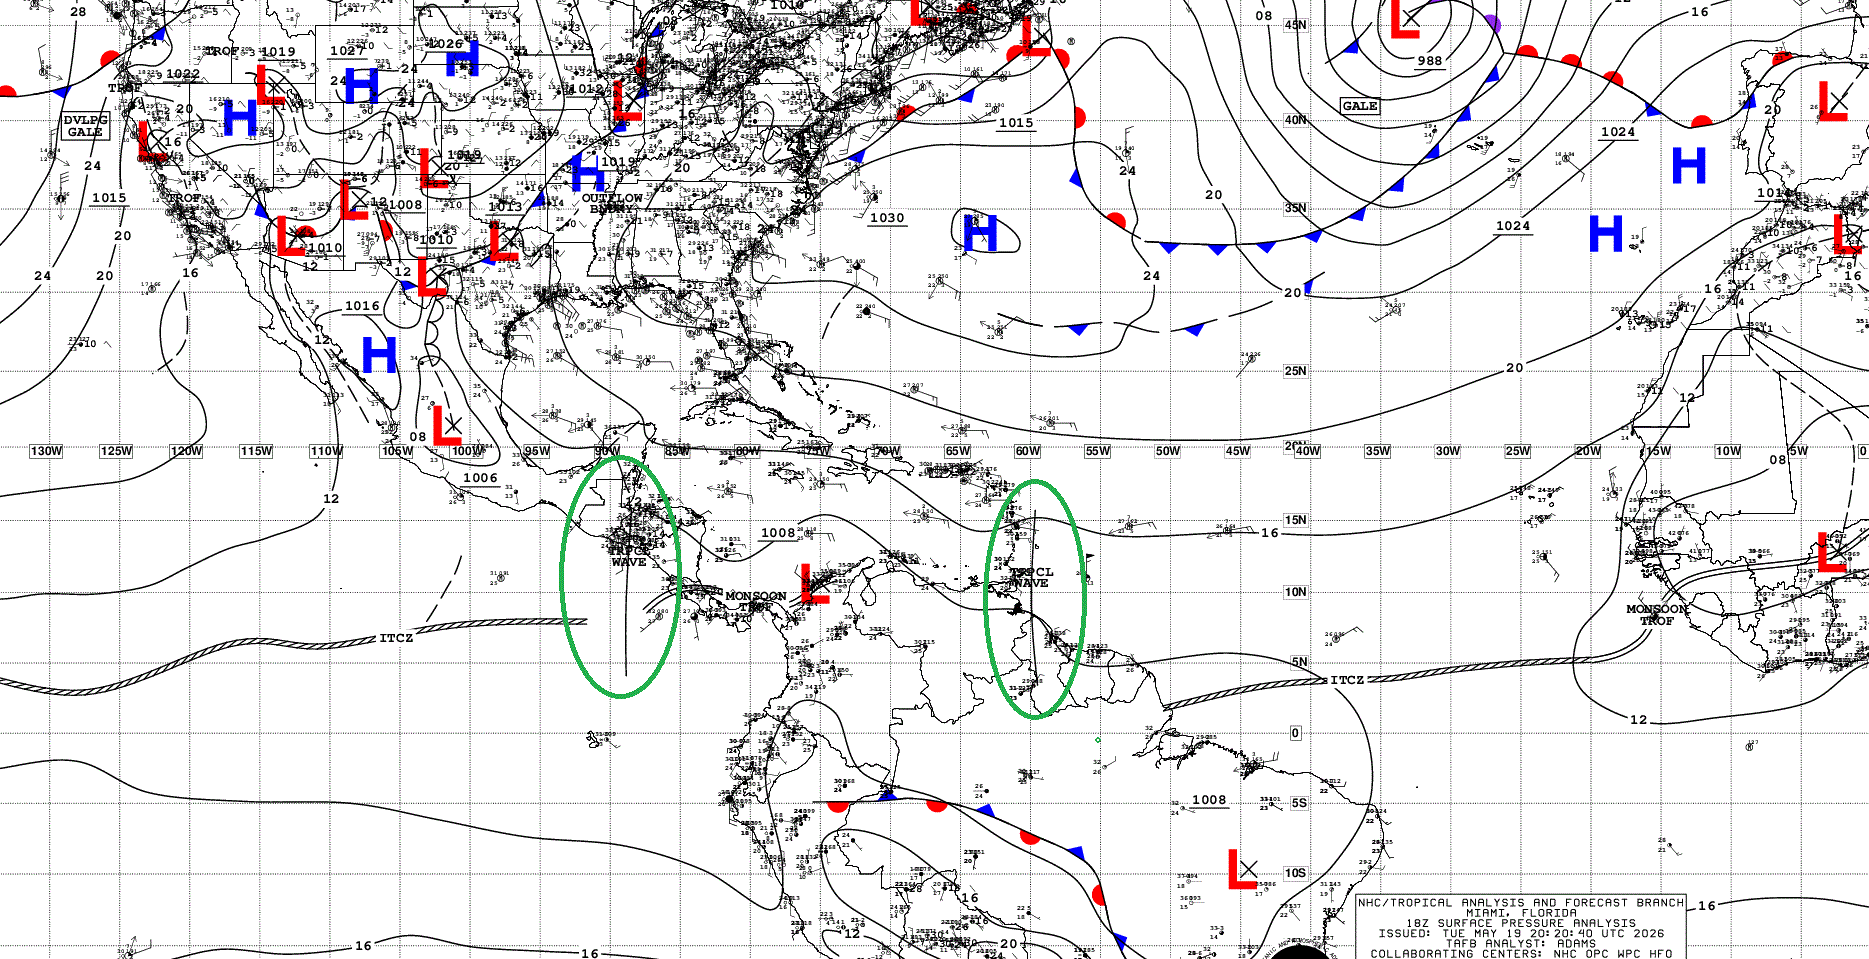
Tropical Wave in northern South America … and another moving through Central America into the Eastern Pacific … neither expected to develop
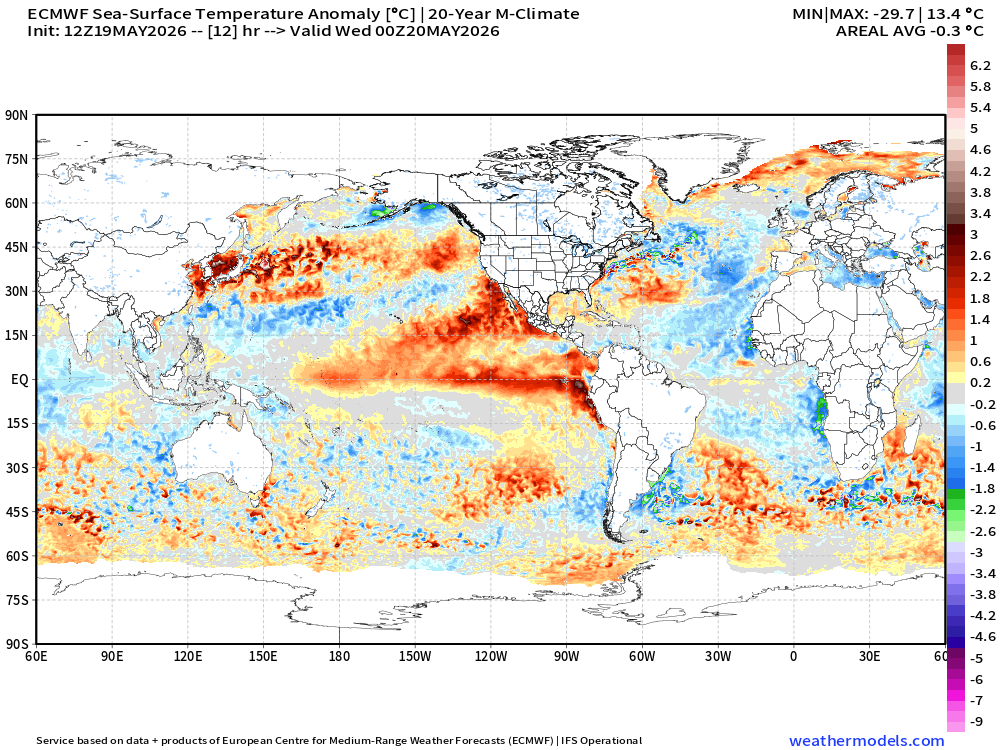
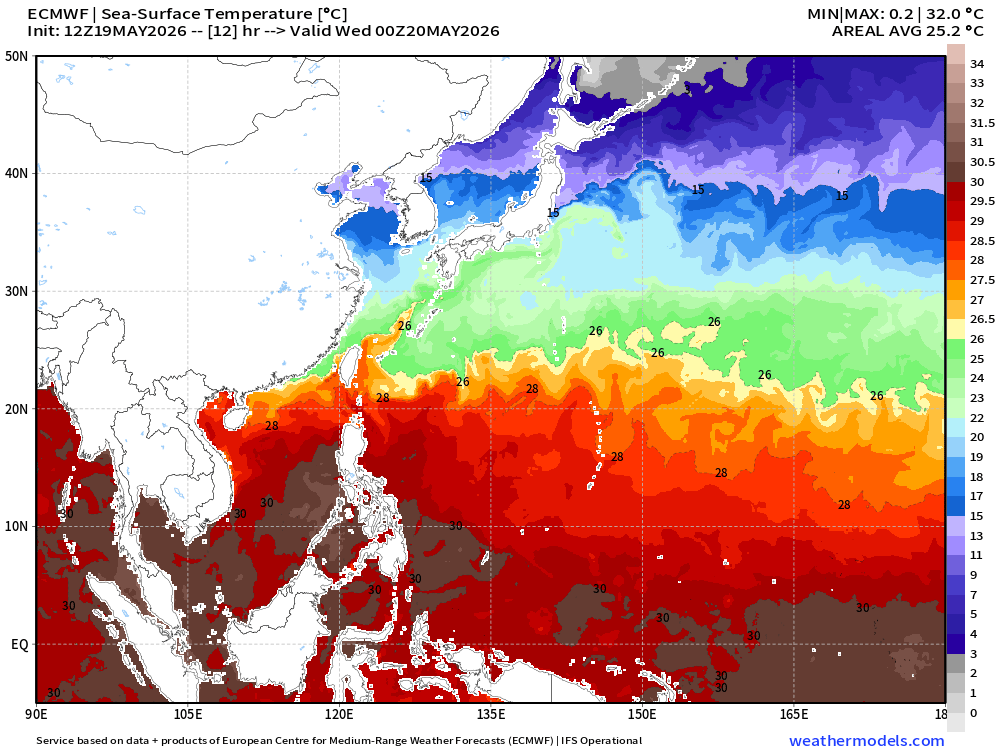
Ocean Temperatures —> Sea Surface Temperature (SST)
Tropical storms need at least 26°C SST to form and intensify … and hurricanes most often become major with 28°C SST (at least) … the Atlantic has plenty of real estate that could support a TS or H, but nothing percolating as the basin is very hostile or unfavorable to formation. Note, it is the “actual” ocean temperatures that fuel hurricanes, not anomalies or deviations from climatology.
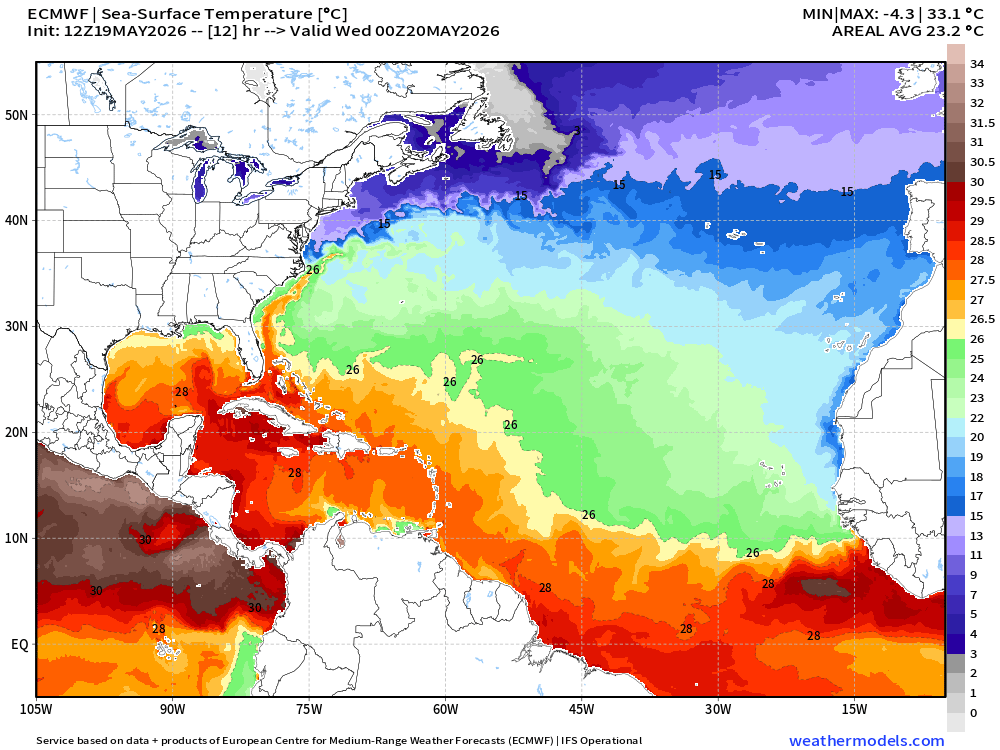
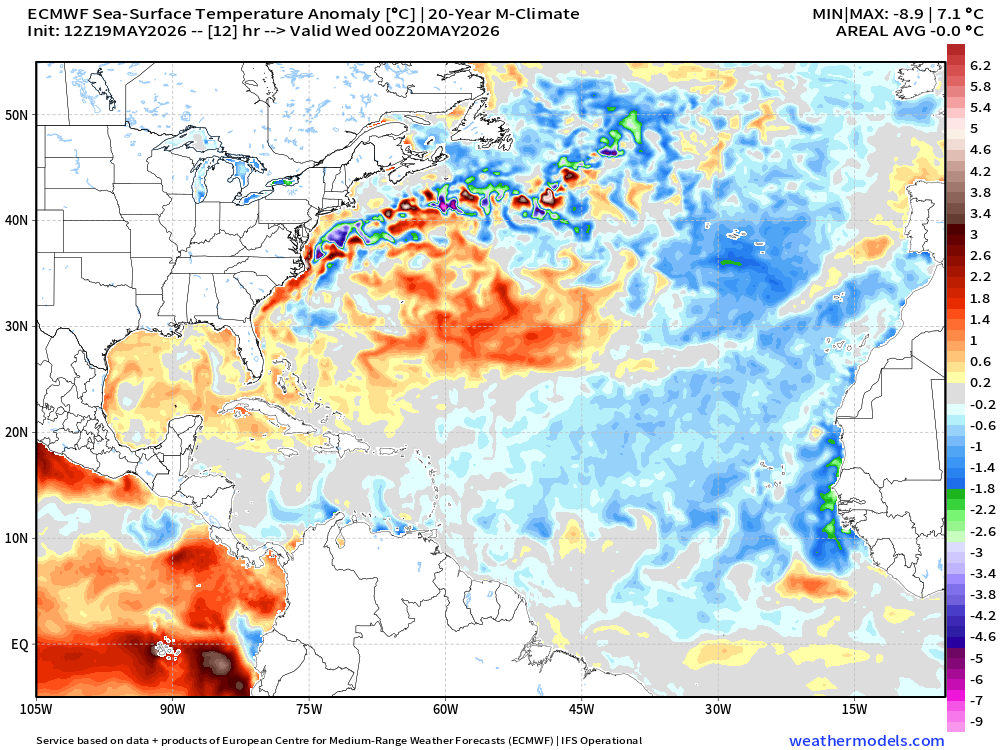
However, we do look at SST anomaly to see where excessive warmth may be located e.g. "marine heat waves” that could fuel stronger hurricanes than otherwise expected.
Here, I use the ECMWF HRES SST anomaly vs. the 20-year model climatology (1996-2025) to show recent trends. The Atlantic is actually cooler than past 2-decades across the Main Development Region from the Lesser Antilles (Caribbean) to the Azores and coast of Africa. This is not a positive signal you’d expect for an active season.
My favorite parameter —> Precipitable Water (PWAT) next 8-days
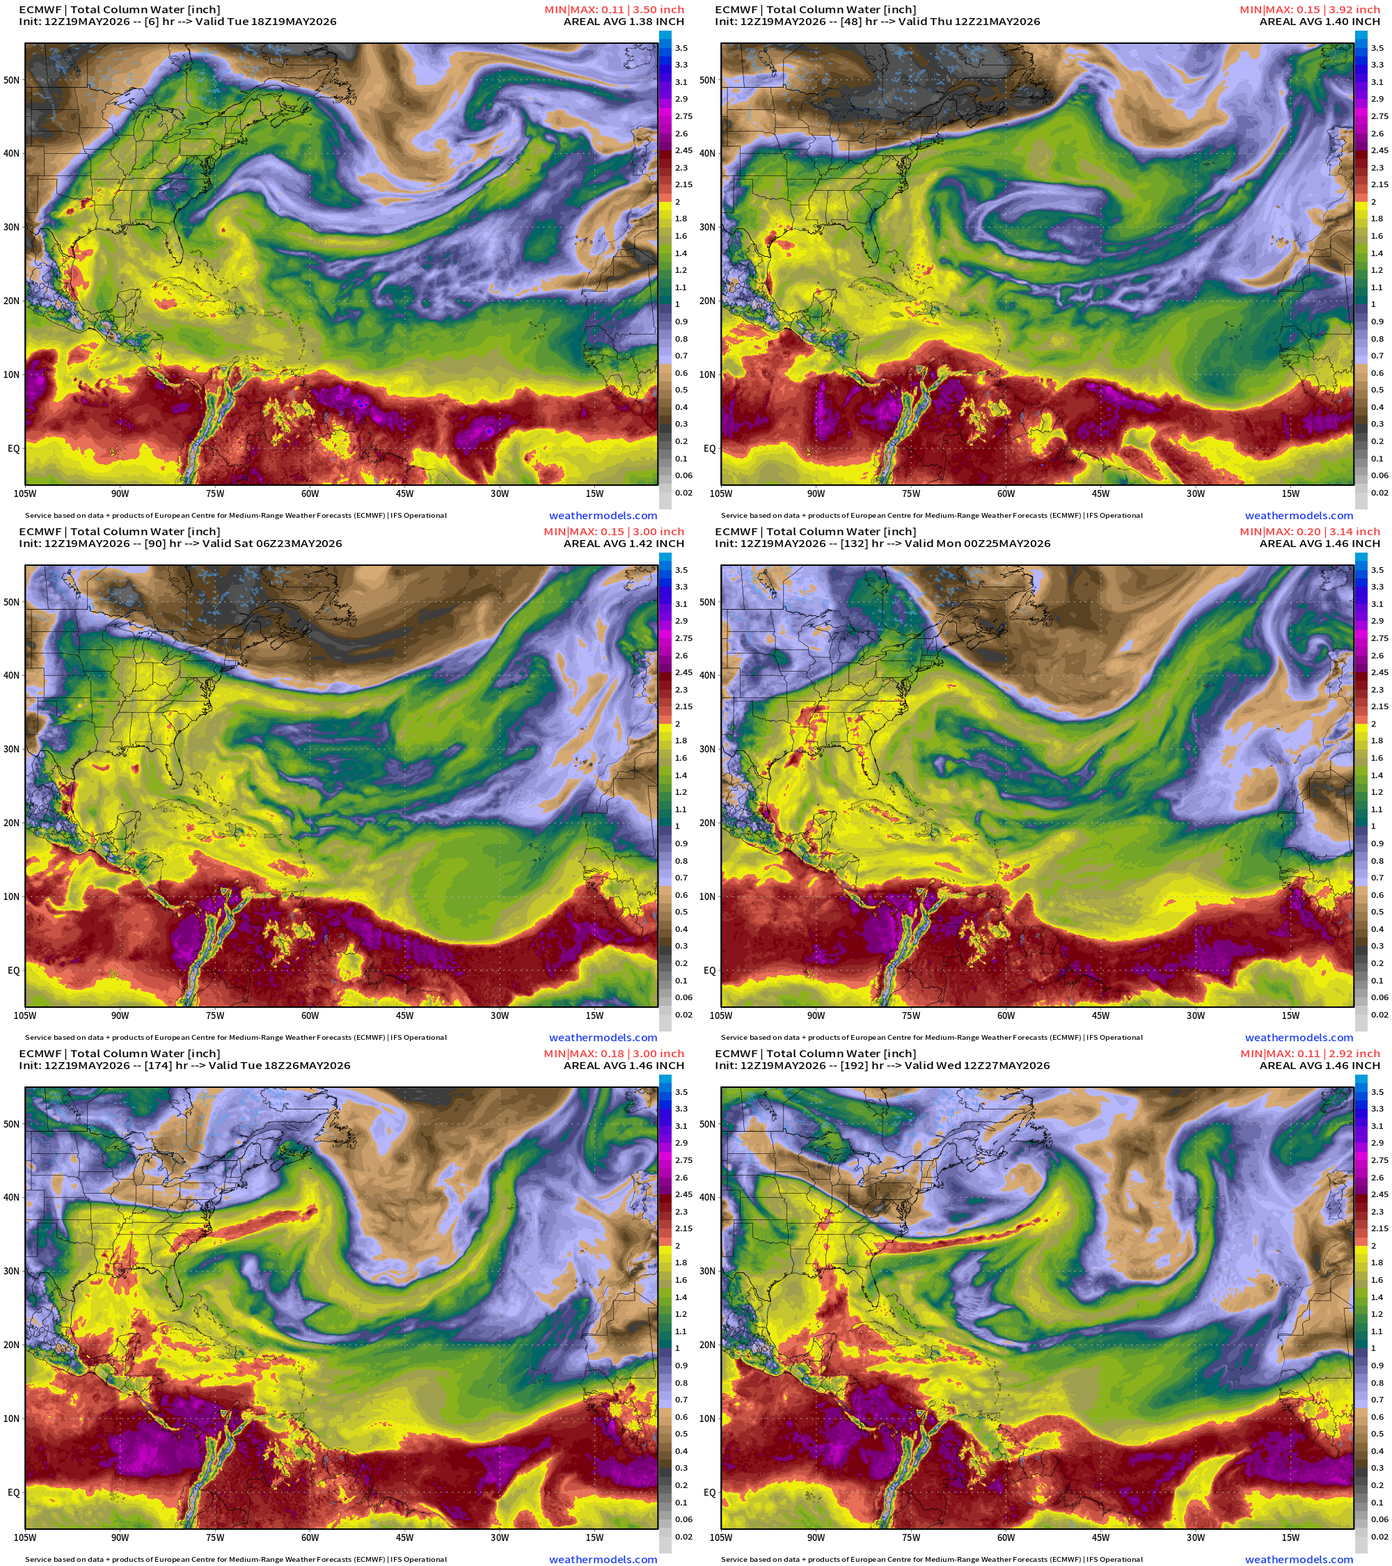
Tropical storms and hurricanes are bundles of high moisture air > 2” in the column (or more) so we look for areas of concentrated high PWAT air in the tropics —> and we also can view frontal boundaries or dry air input from the middle-latitudes into the subtropics or tropics + Saharan Air Layers (dry)
Integrated Vapor Transport —> IVT next 10-days
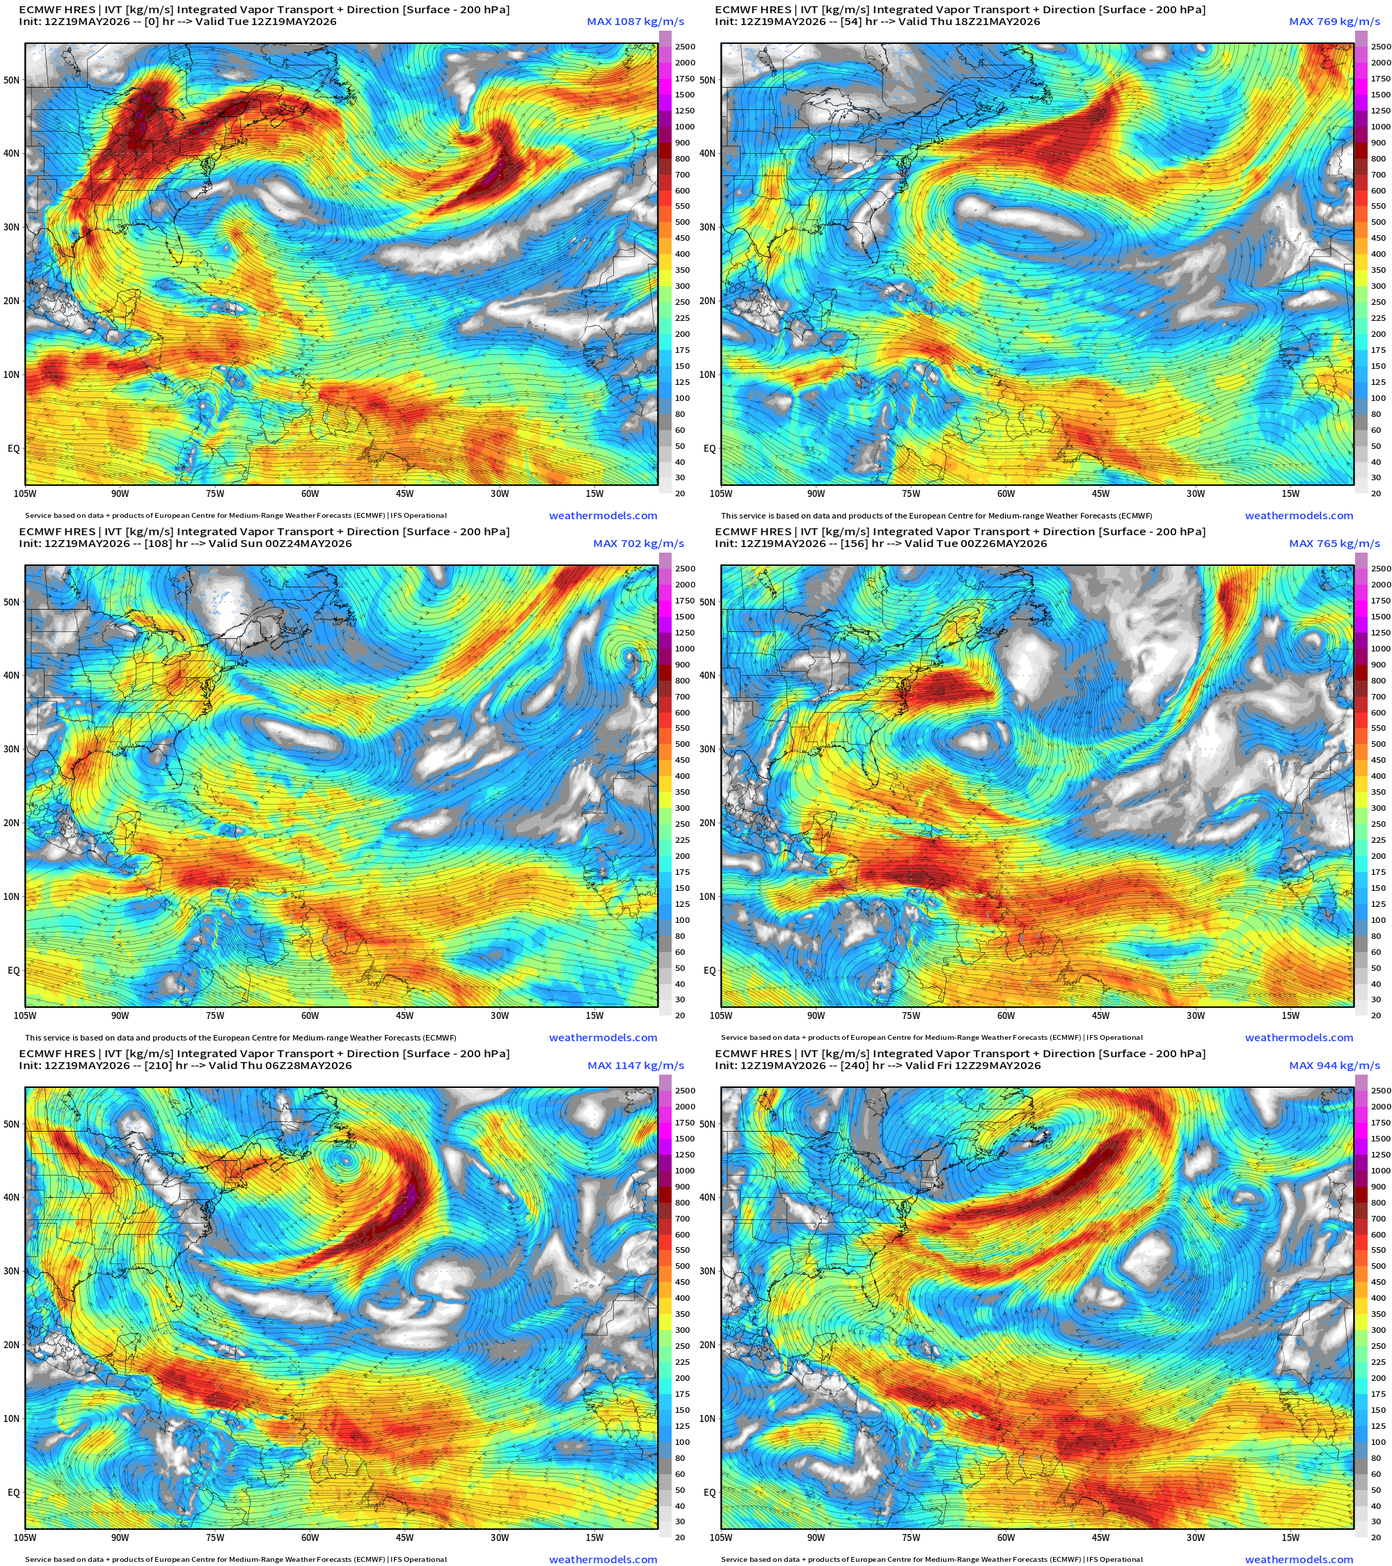
The transport of rivers of moist air —> IVT is great metric to show tropical storm development. Here, we see the Bermuda High / subtropical ridge in charge — extending to the Azores across the Atlantic.
Simulated Water Vapor | ECMWF 12z next 10-days
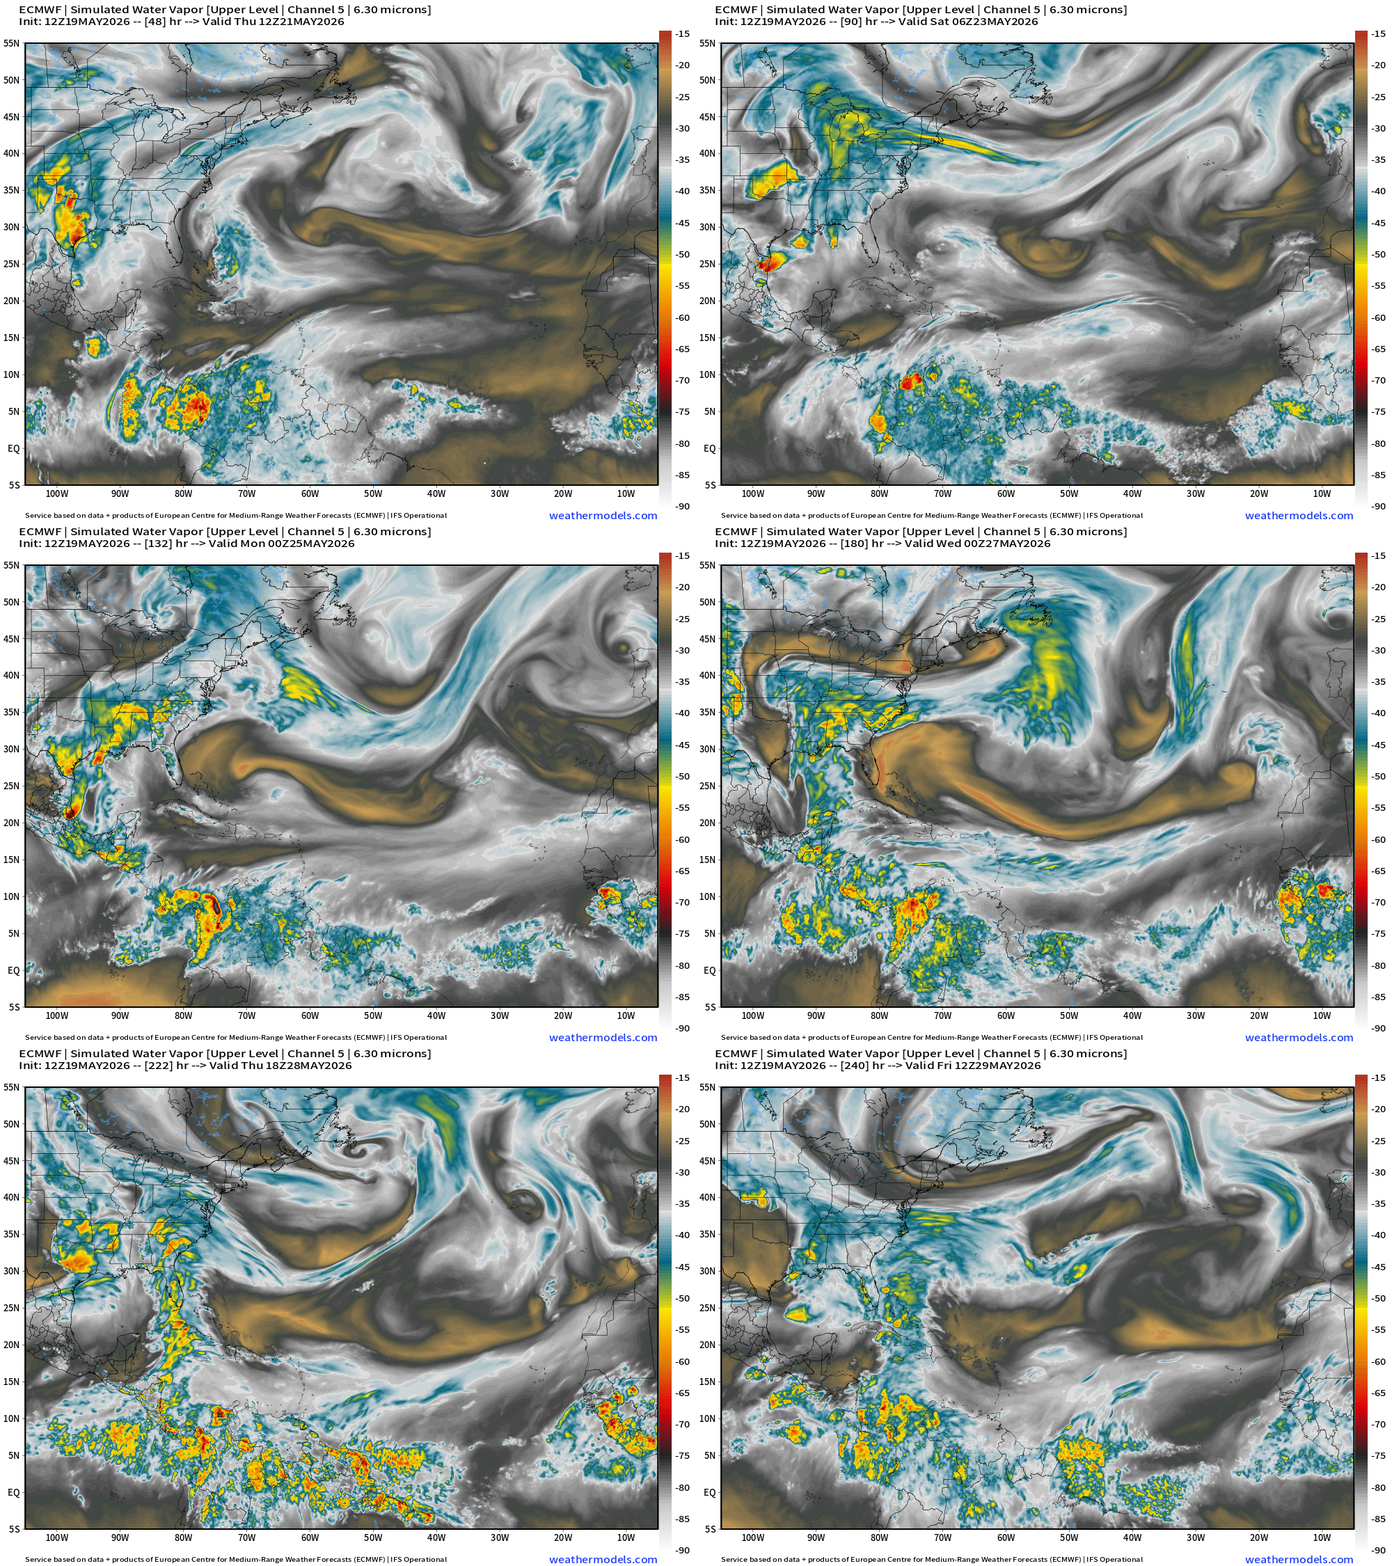
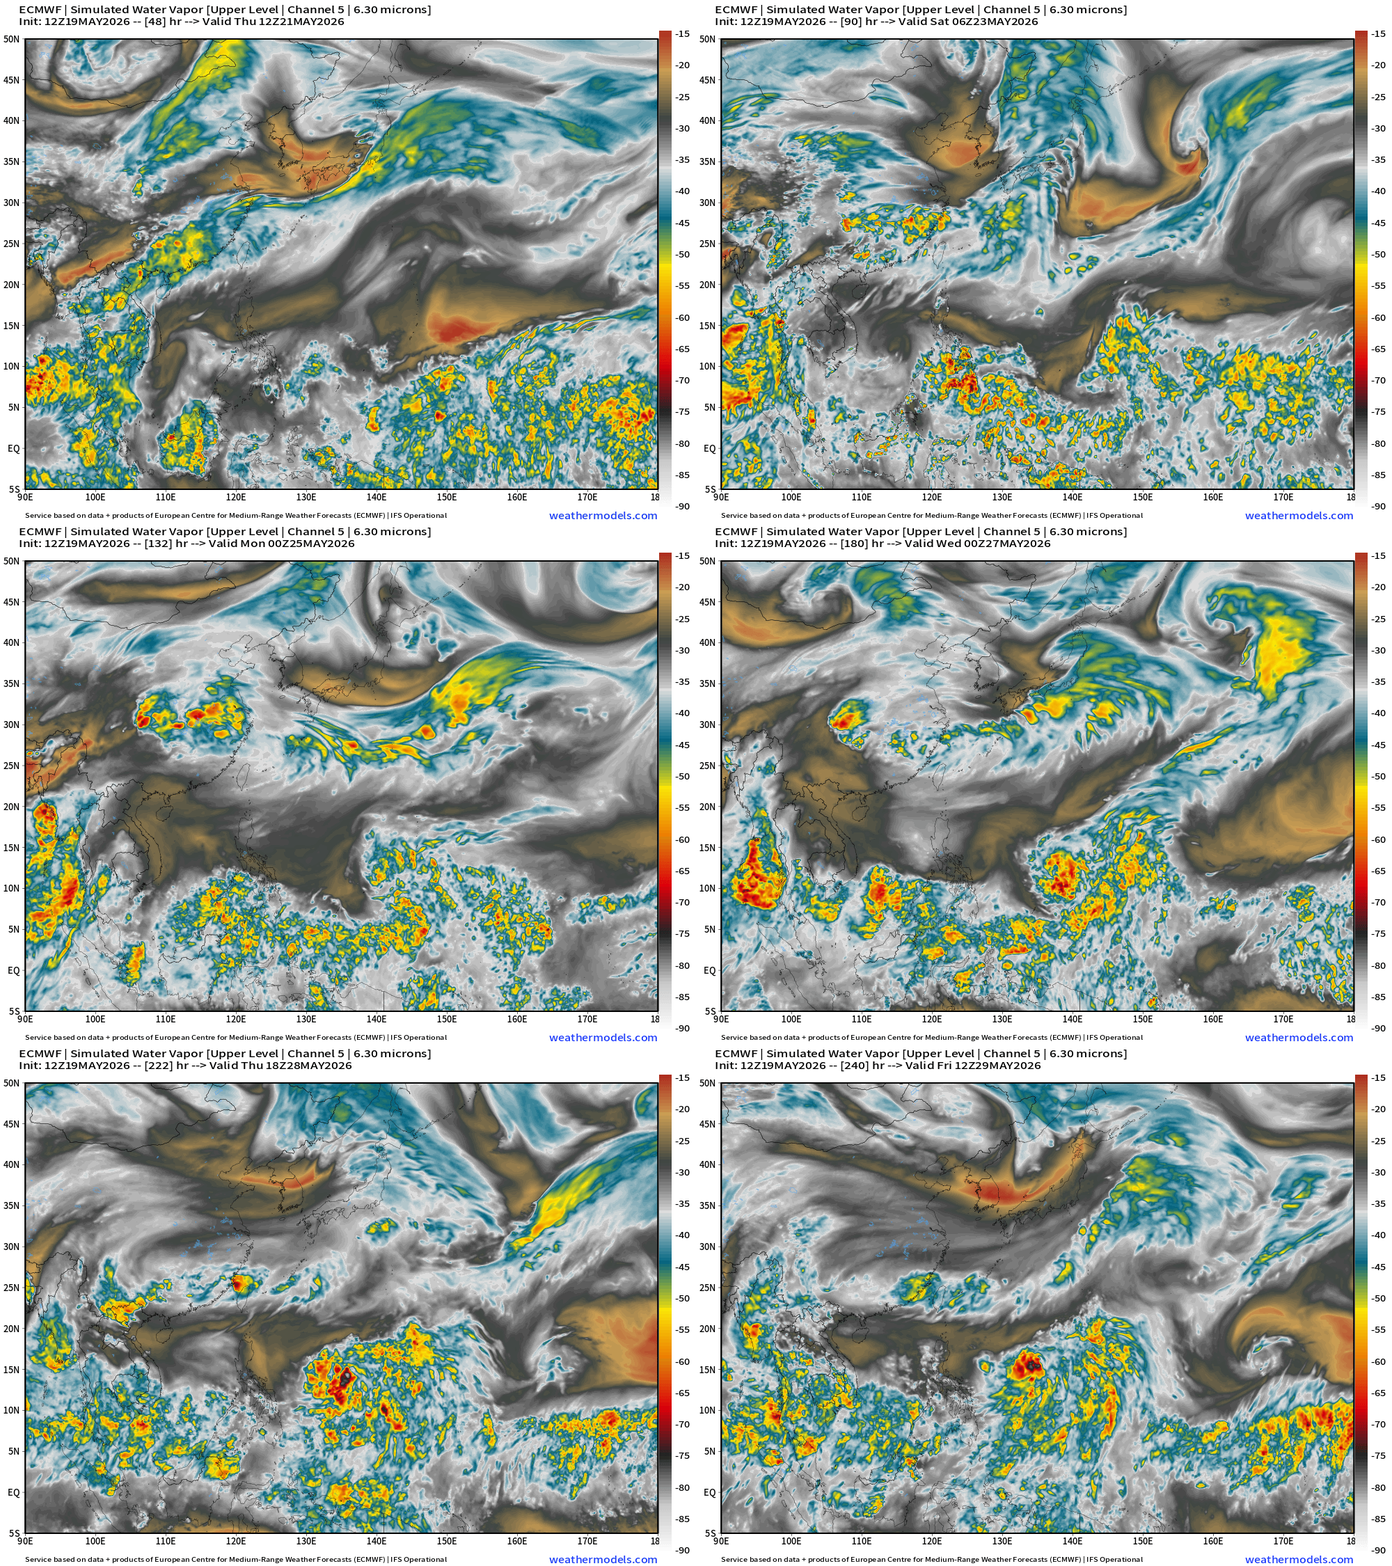
High Resolution global models can “simulate” water vapor as you’d see from geostationary satellites. This is also a fantastic way to quickly visualize the various weather systems e.g. troughs, convection, and other storms.
Western Pacific Basin — Typhoon Season is Underway
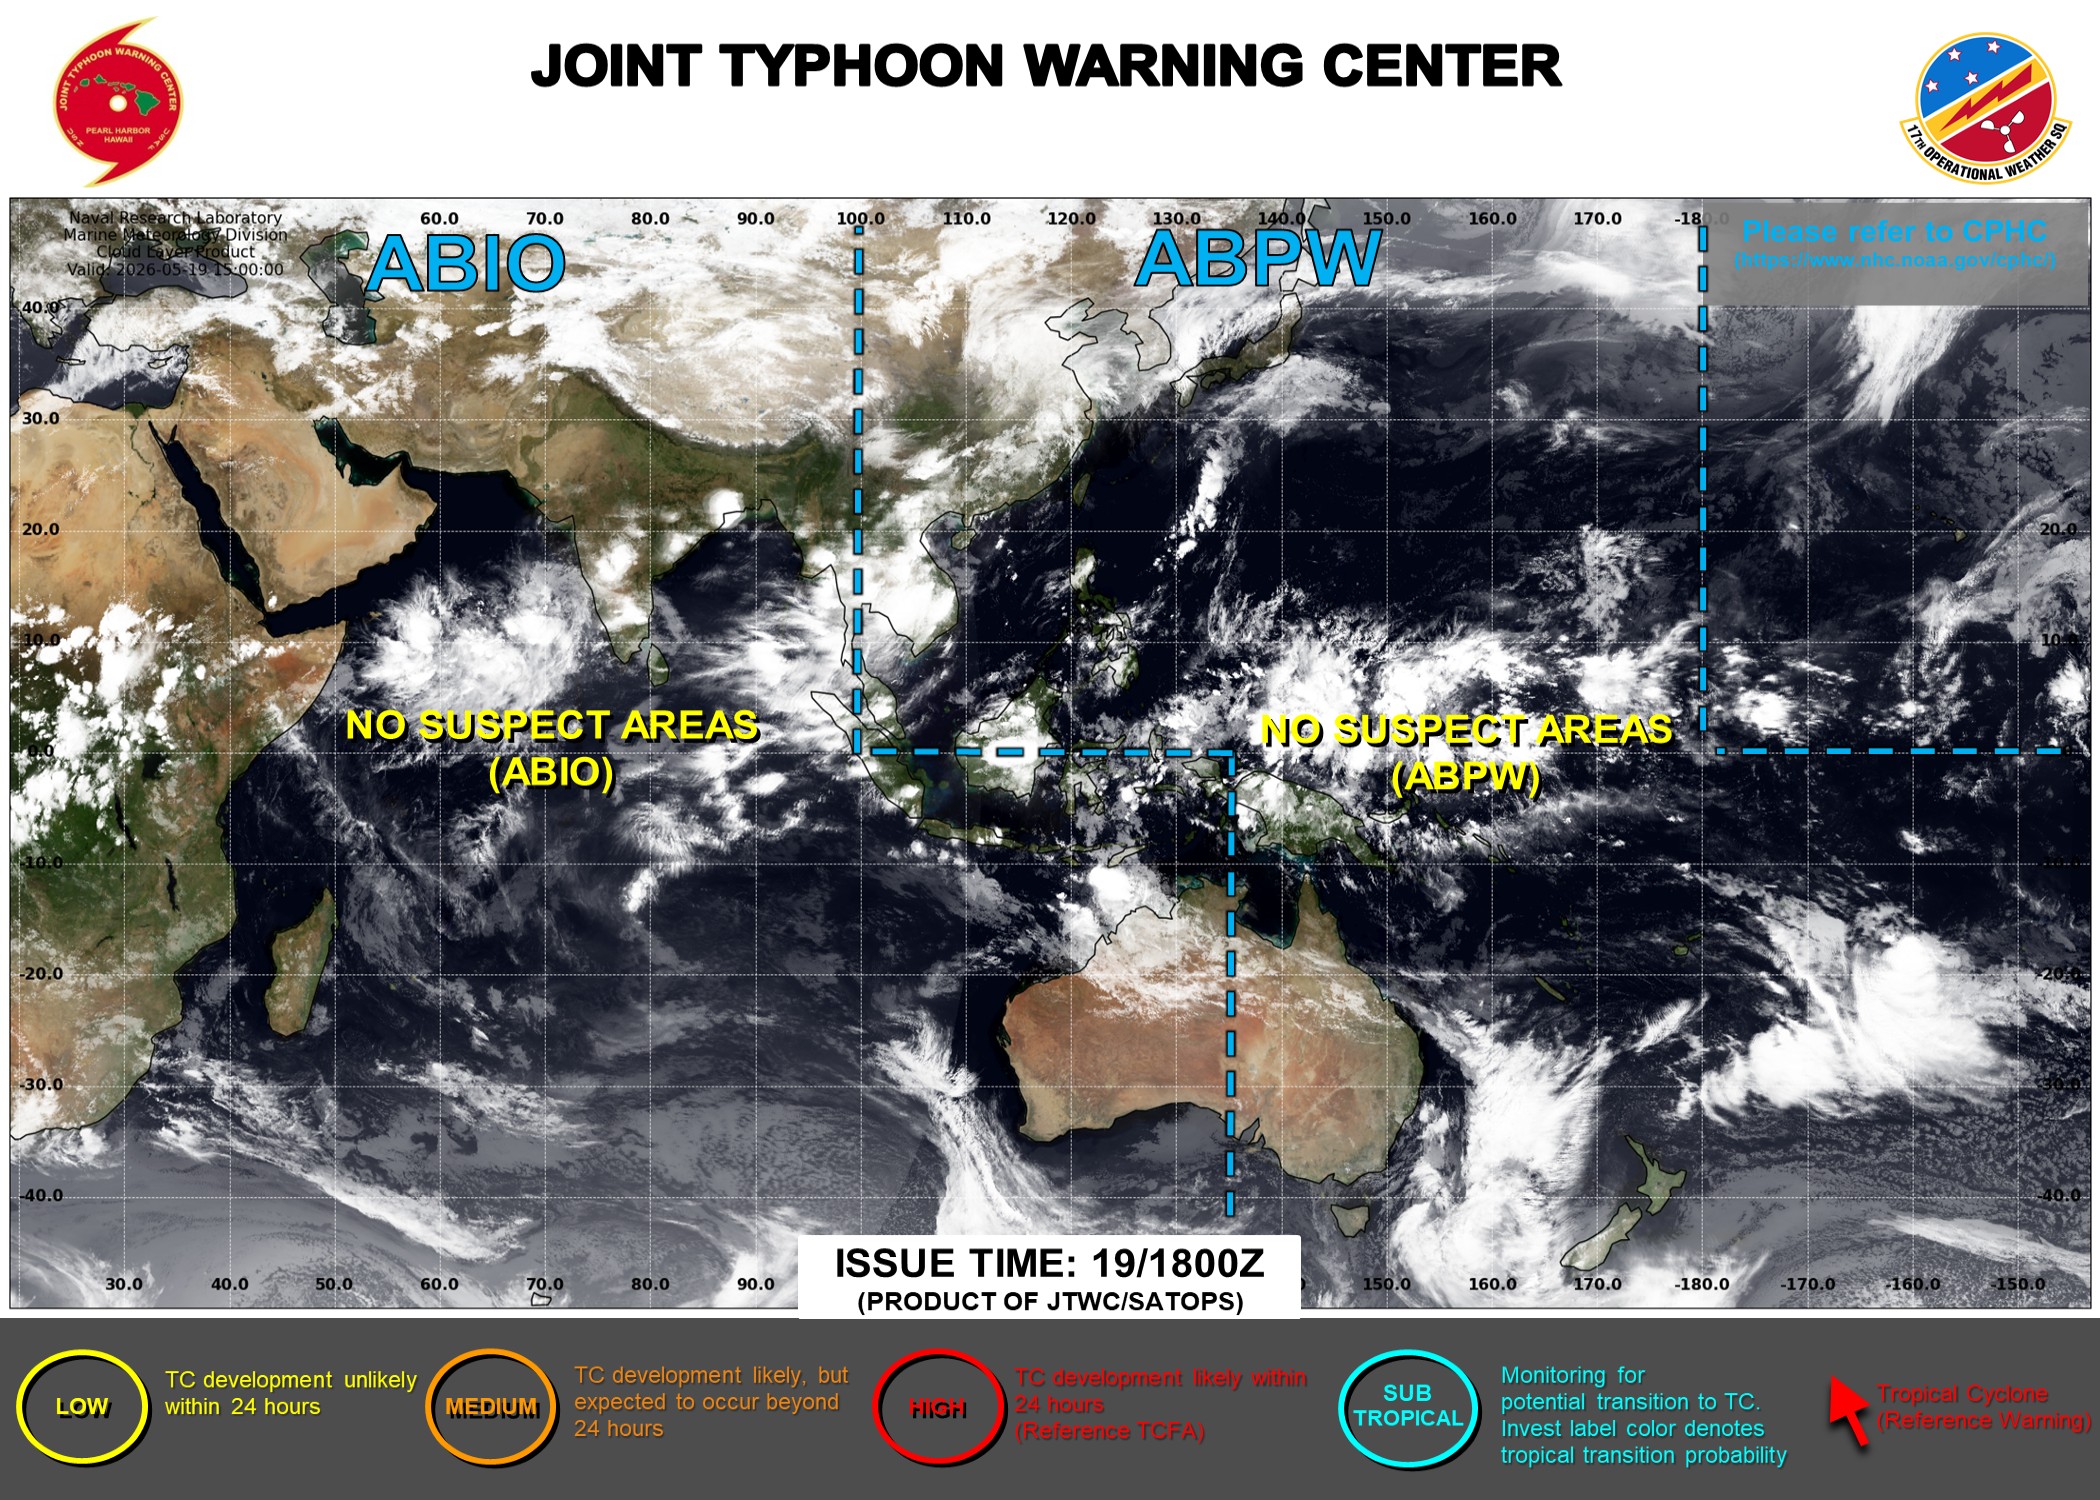
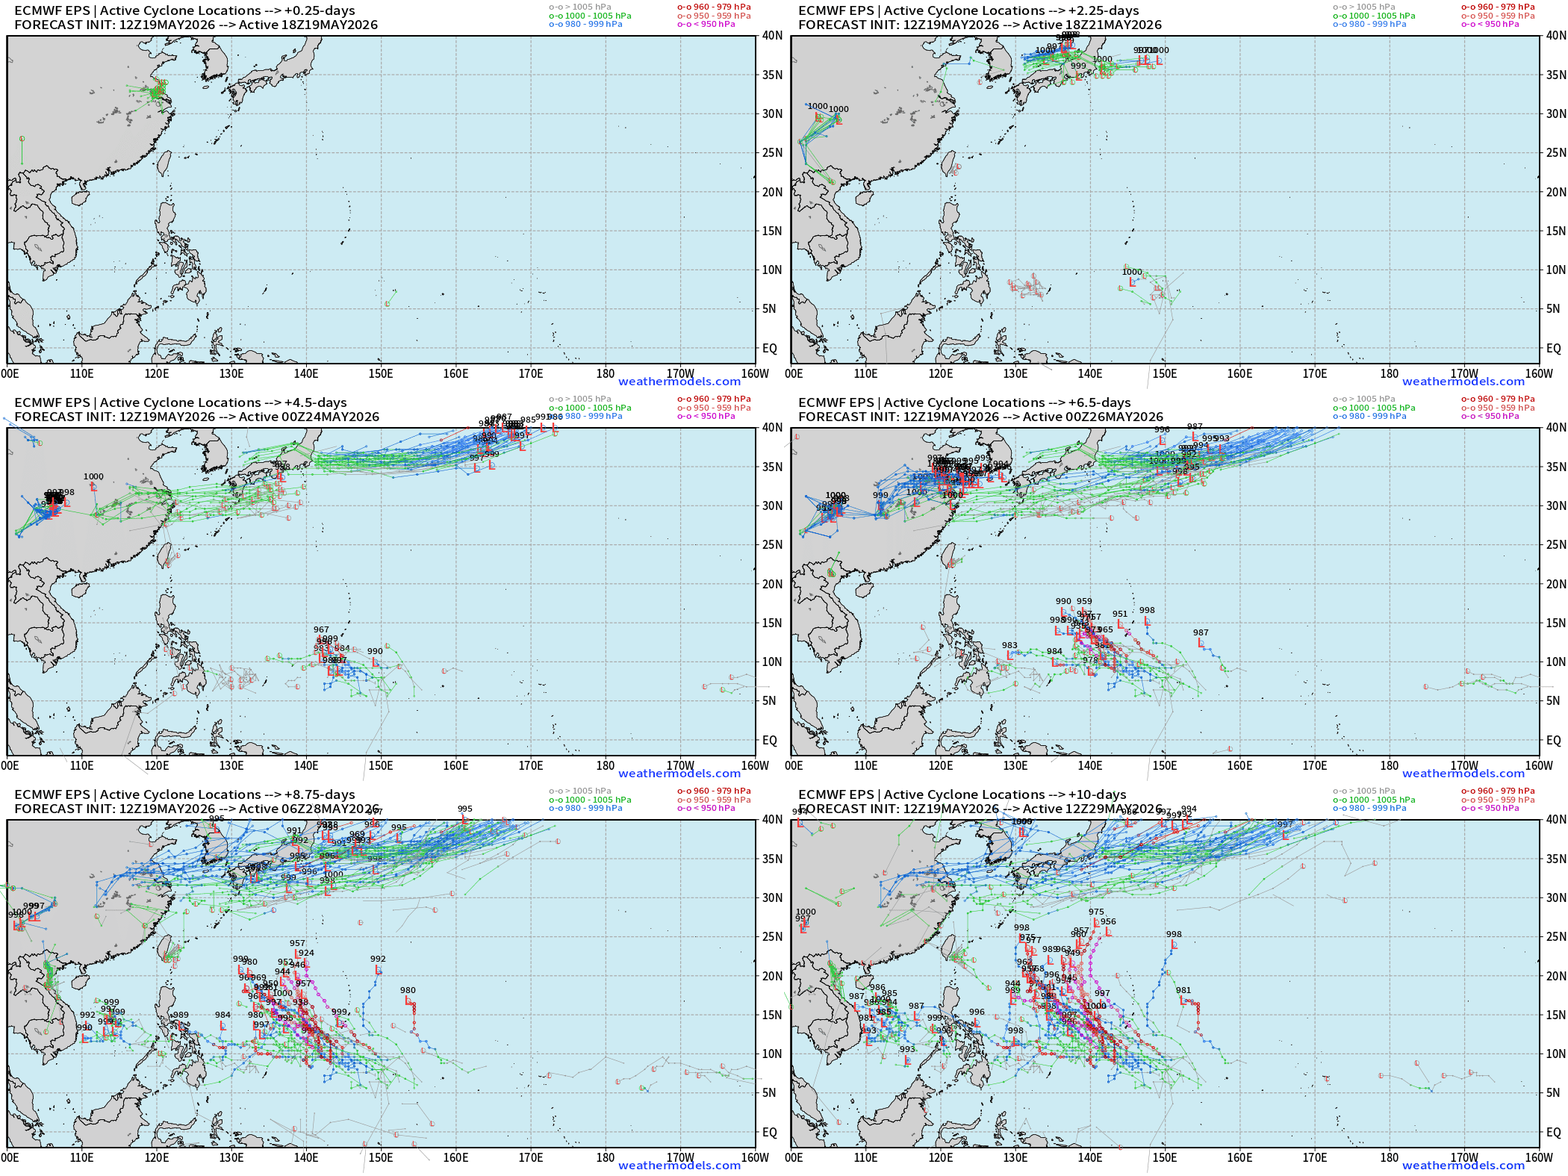
Watching area of possible development in 5-7 days near Mariana Islands, but nothing suspect in the next 48-hours from JTWC.
Ocean Temperatures (SST) very warm > 28°F over the “warm pool” plenty sufficient for any category of Super Typhoon, assuming one can form
ECMWF Full Physics Ensemble Tracks — 50 members
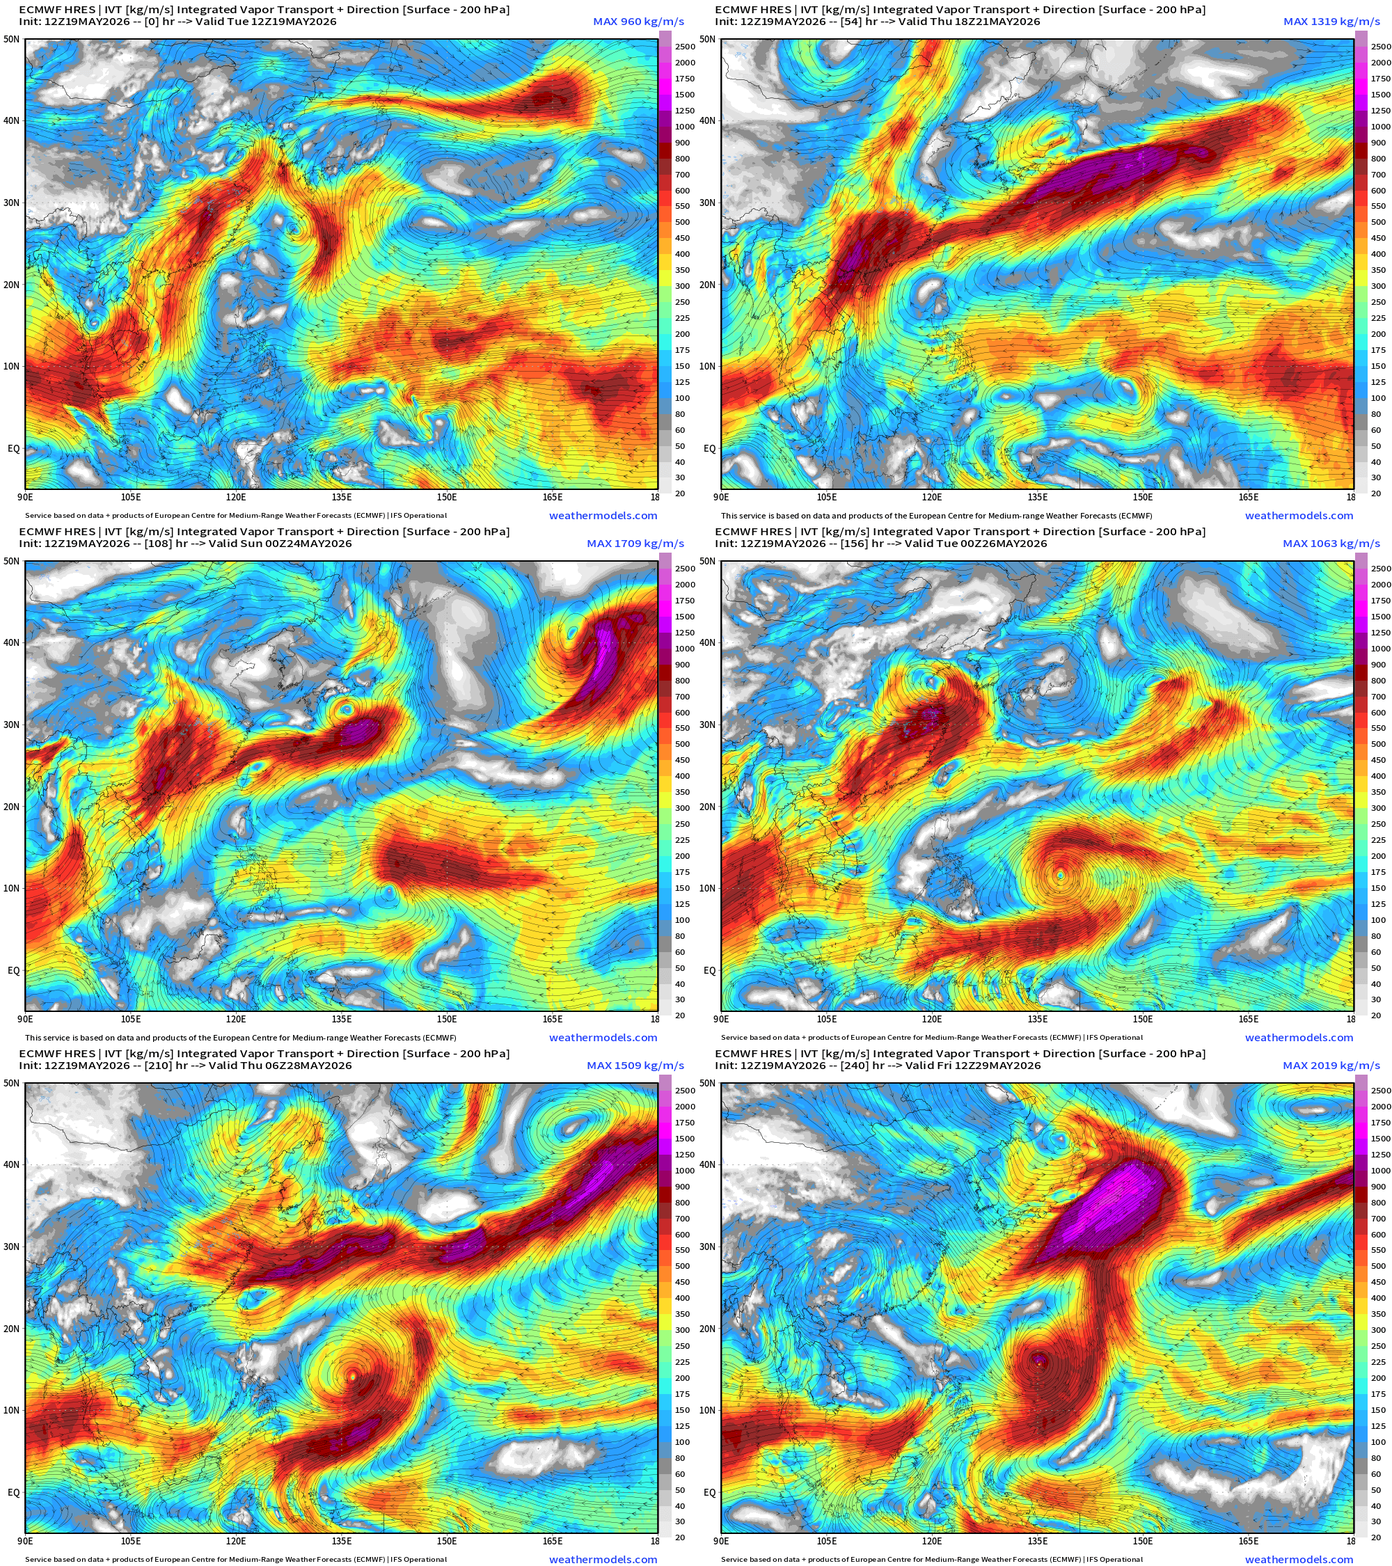
Tropical Storm formation possible in 5-days, and then development into a strong Typhoon
IVT shows the circulation and intensification into Day 10 (May 29th)
WPAC Precipitable Water (PWAT) next 8-days
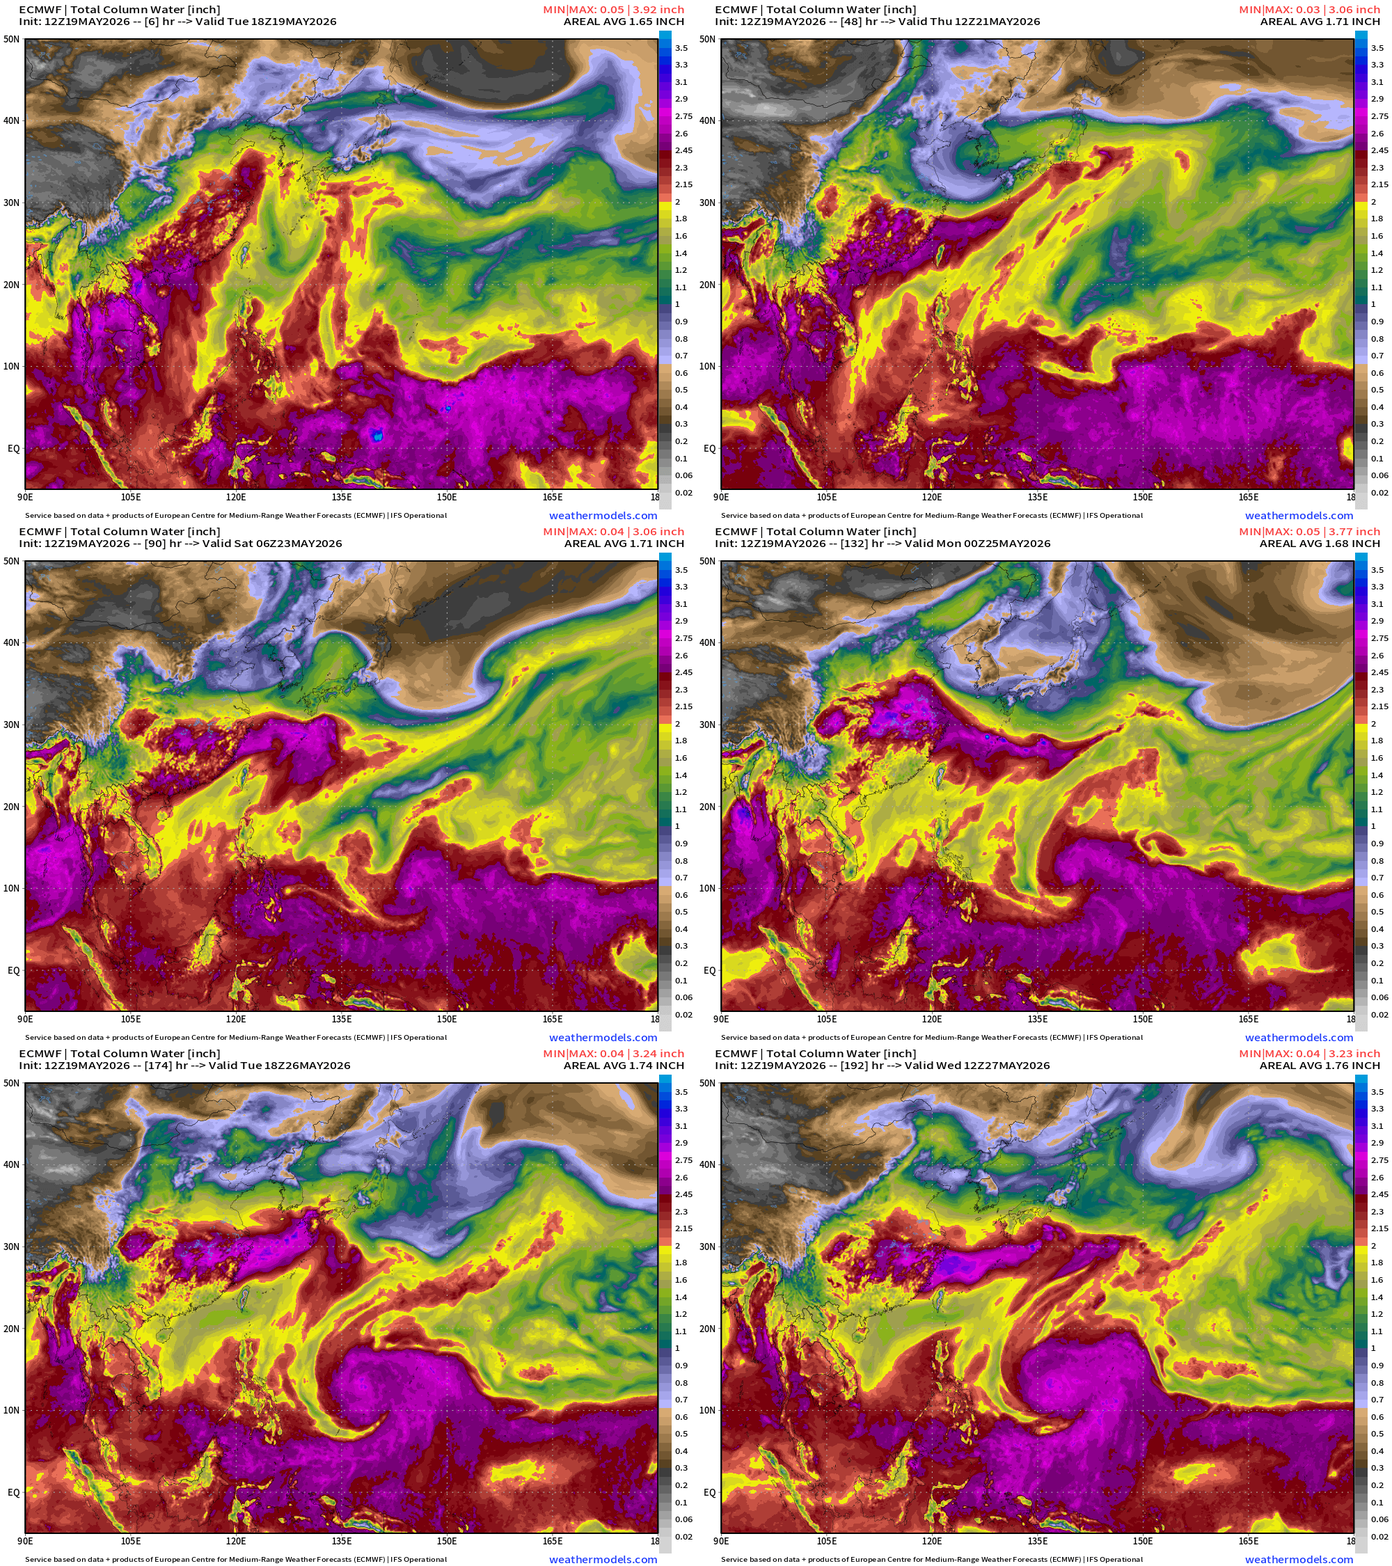
The Western Pacific is quite hostile with subtropical and mid-latitude upper-level troughs constantly mixing into the Main Development Region (sub-20°N) over the warm pool waters. Simulated Water Vapor Satellite next 10-days from ECMWF 12z
ECMWF AIFS-Single v2 (Data Driven Forecast System)
A.I. weather modeling system next 15-days
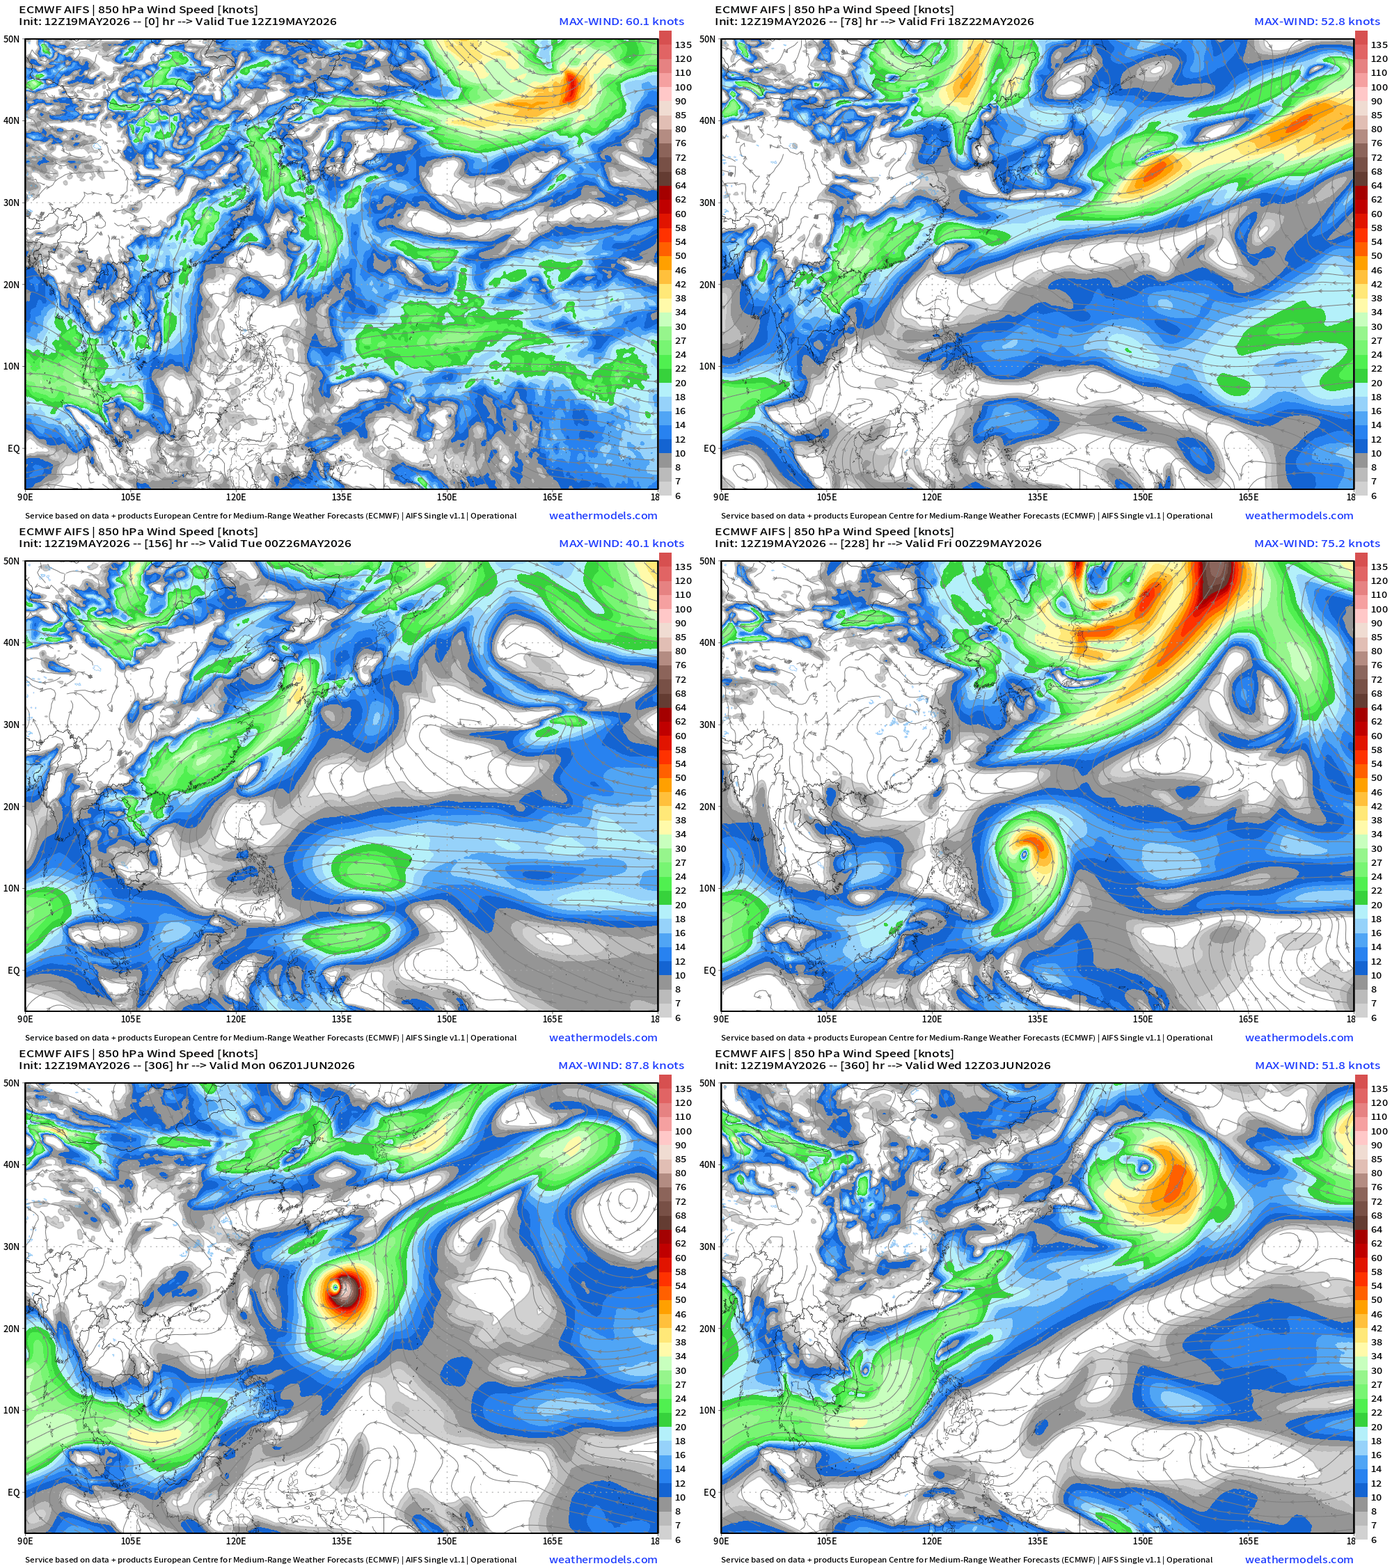
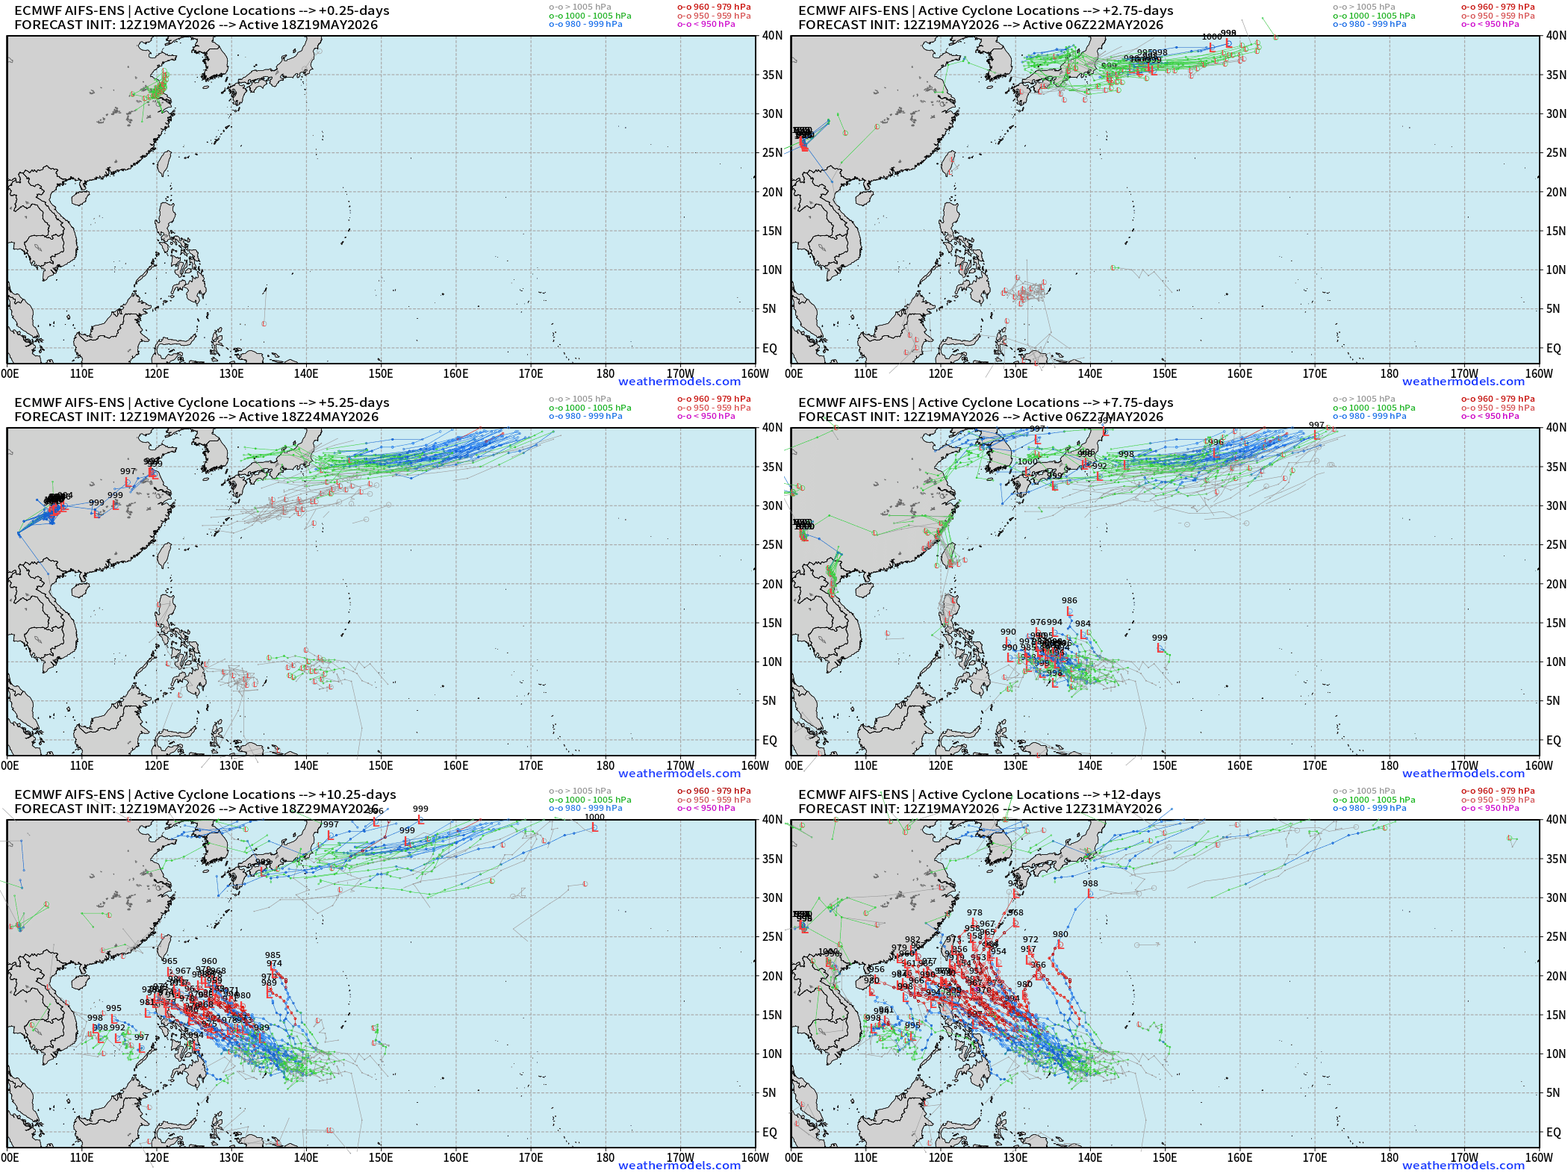
And, the ensembles from AIFS-ENS v2 (different than AIFS-Single) — quite ambitious with the storm formation and intensification!
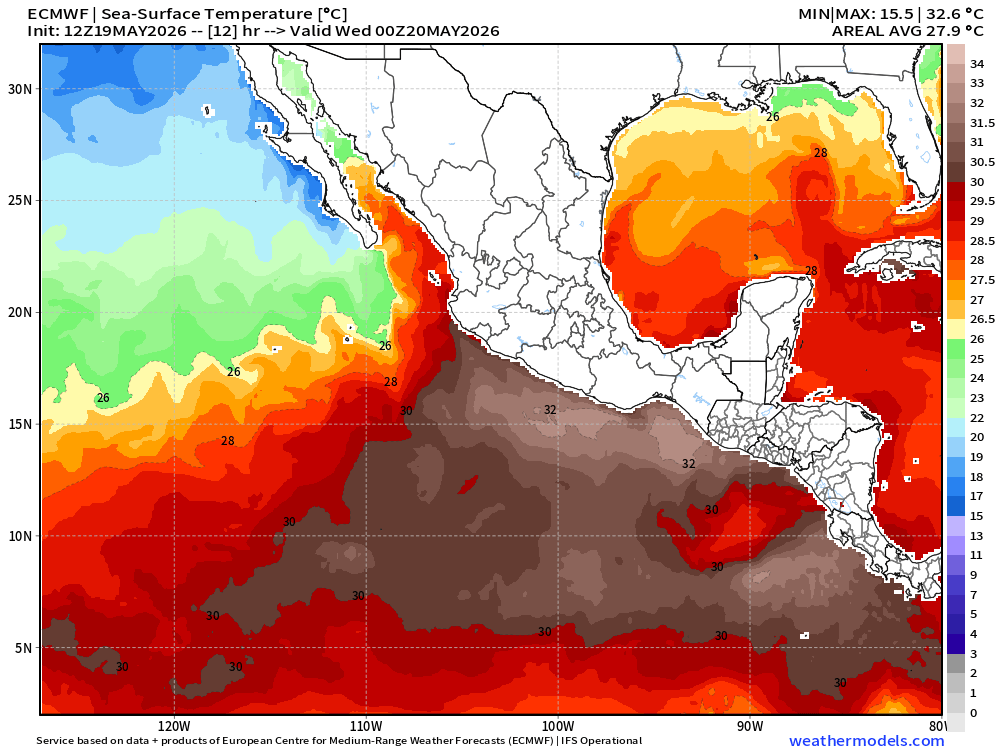
Eastern Pacific Tropics | Quiet next 7-days
Ocean temperatures are very warm across the basin with the cooler water roughly WNW of 15°N and 110°W
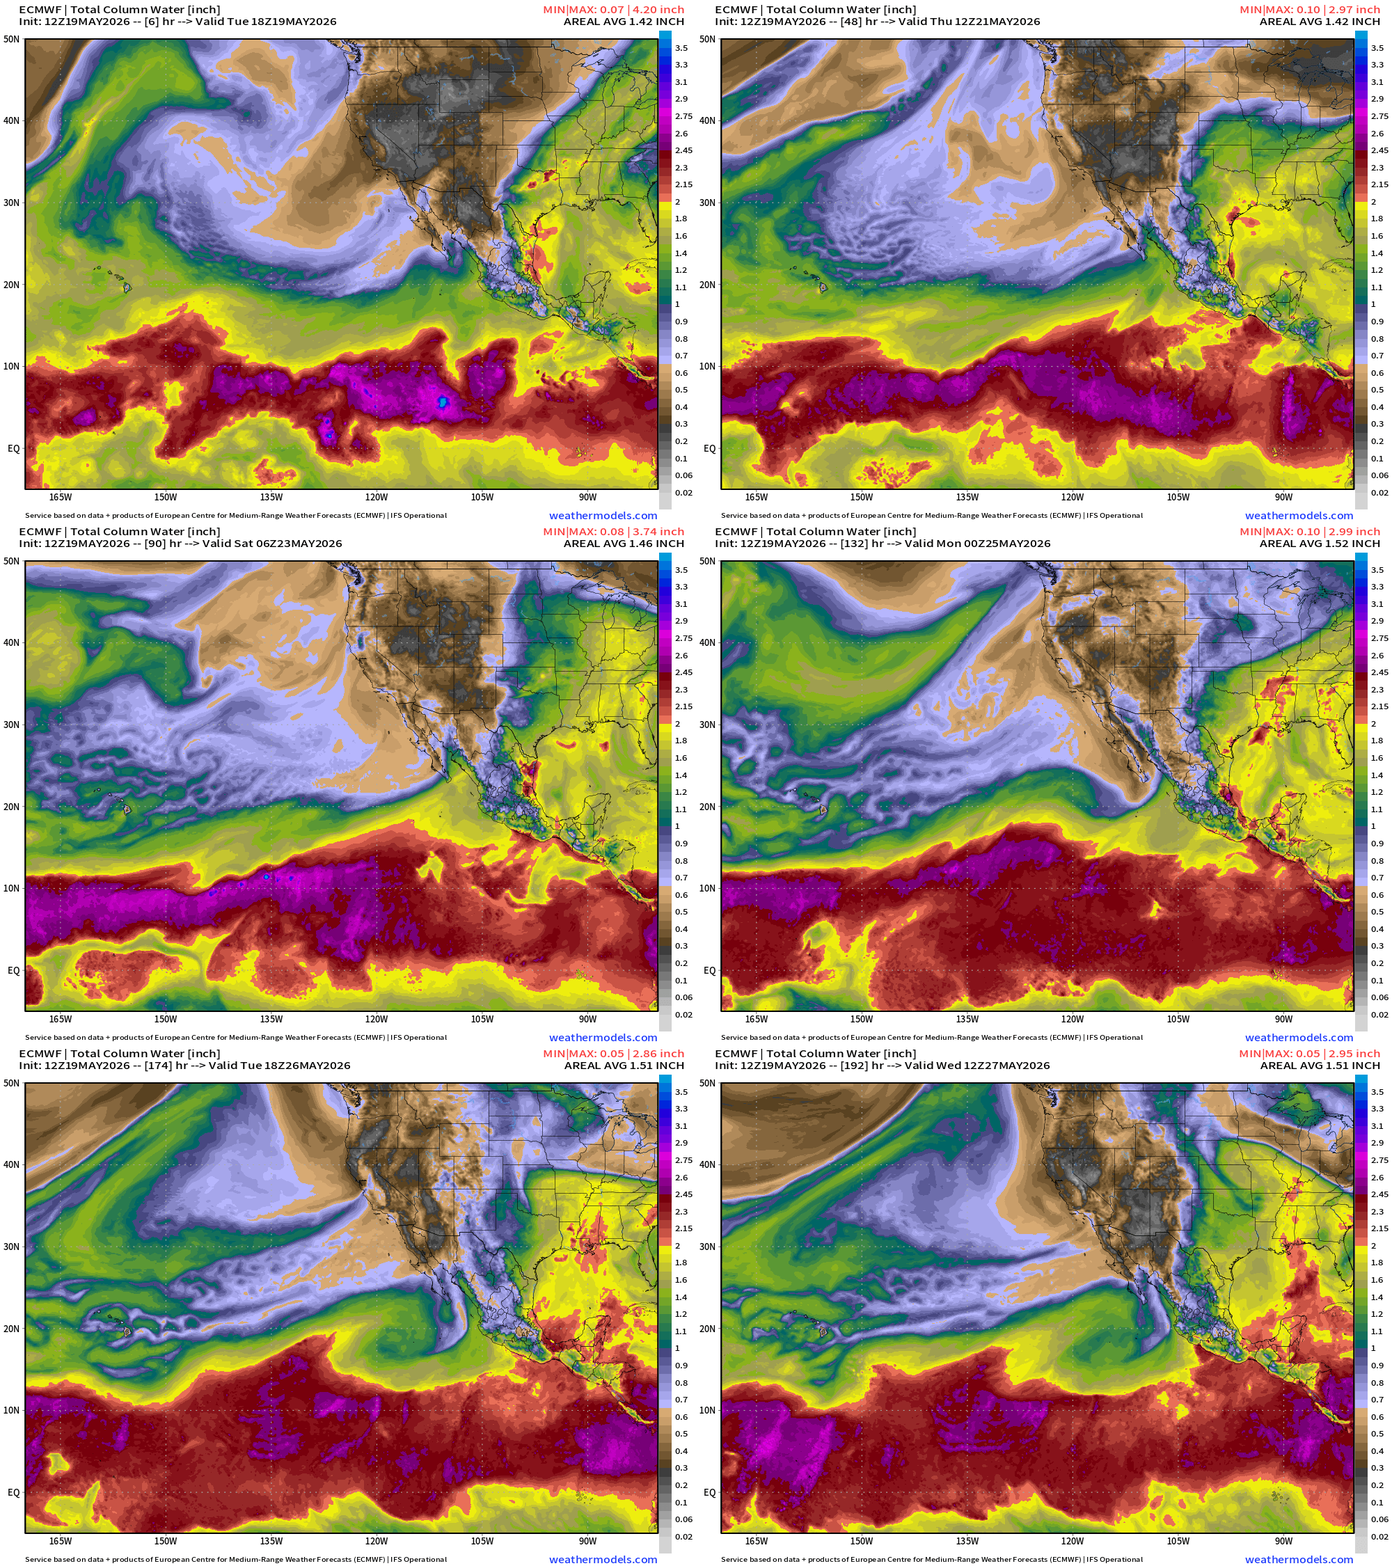
The ITCZ / monsoon trough in the Eastern Pacific has boatloads of moisture … just waiting for a spin or tropical wave or vorticity source to create a tropical storm.
Thank you for reaching the end of this post! Hopefully you enjoyed the tour of the global tropics and what’s coming in the weeks/months ahead in the tropics here on Weather Trader on Substack.
Maps sourced from weathermodels.com designed and innovated by yours truly! Please subscribe there for real-time access to the newest maps, charts from all of the weather models including ECMWF and AIFS, and NOAA GFS/GEFS, HRRR/RRFS and Blend of Models (NBM). NOAA WPC and SPC for fronts/convective outlooks.
- Milepost
- 939 · laid 2026-05-20T00:10:06.156000Z
- Source
- https://weather.substack.com/p/may-19-2026-tuesday-tropical-update
- Digest
- 76827ebf6c2d408a5282cd9655cad0ee977265d5bcf43bd8781b8947fedbafd7
- Machine
- JSON