March 19, 2026 Thursday Weather Update
Polar Vortex vs. Heat Dome battle royale underway
March 2026 was the warmest March in the 132-year national record (1895–2026), at 50.8°F against a 1991–2020 normal of 43.6°F (+7.3°F).
March 2026 was the 8th-driest March in the 132-year national record (1895–2026), at 1.8in against a 1991–2020 normal of 2.5in (-0.7in).
NOAA/NCEI Climate at a Glance, contiguous United States. This is the observed record for the month, not a score of anything said in this piece — the forecast ledger begins 2026-08-17 and cannot reach earlier posts.

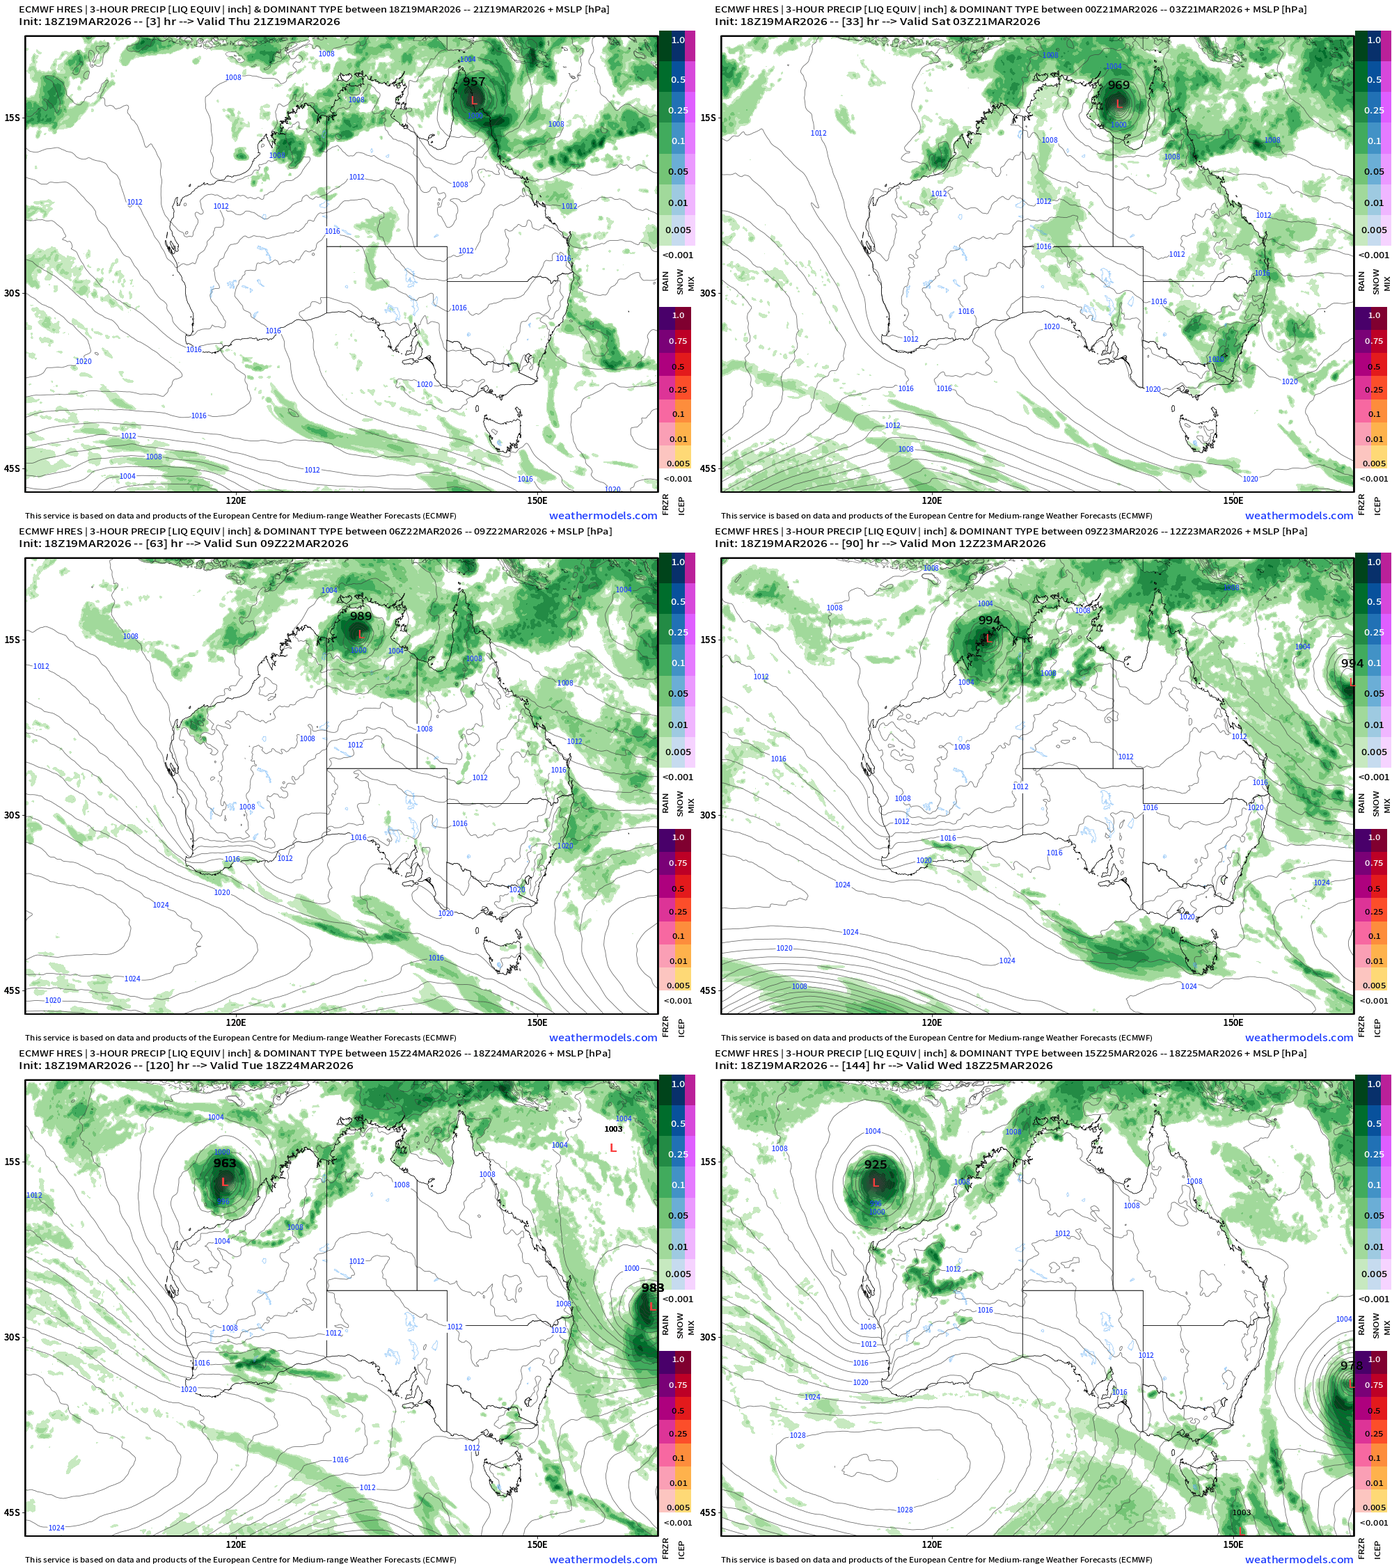
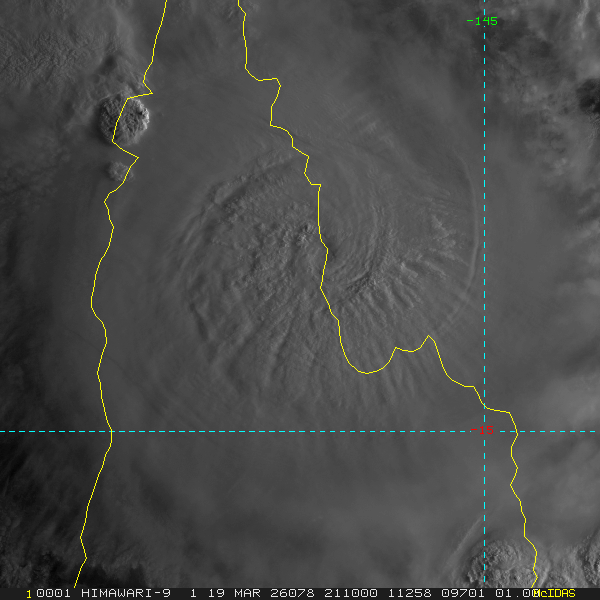
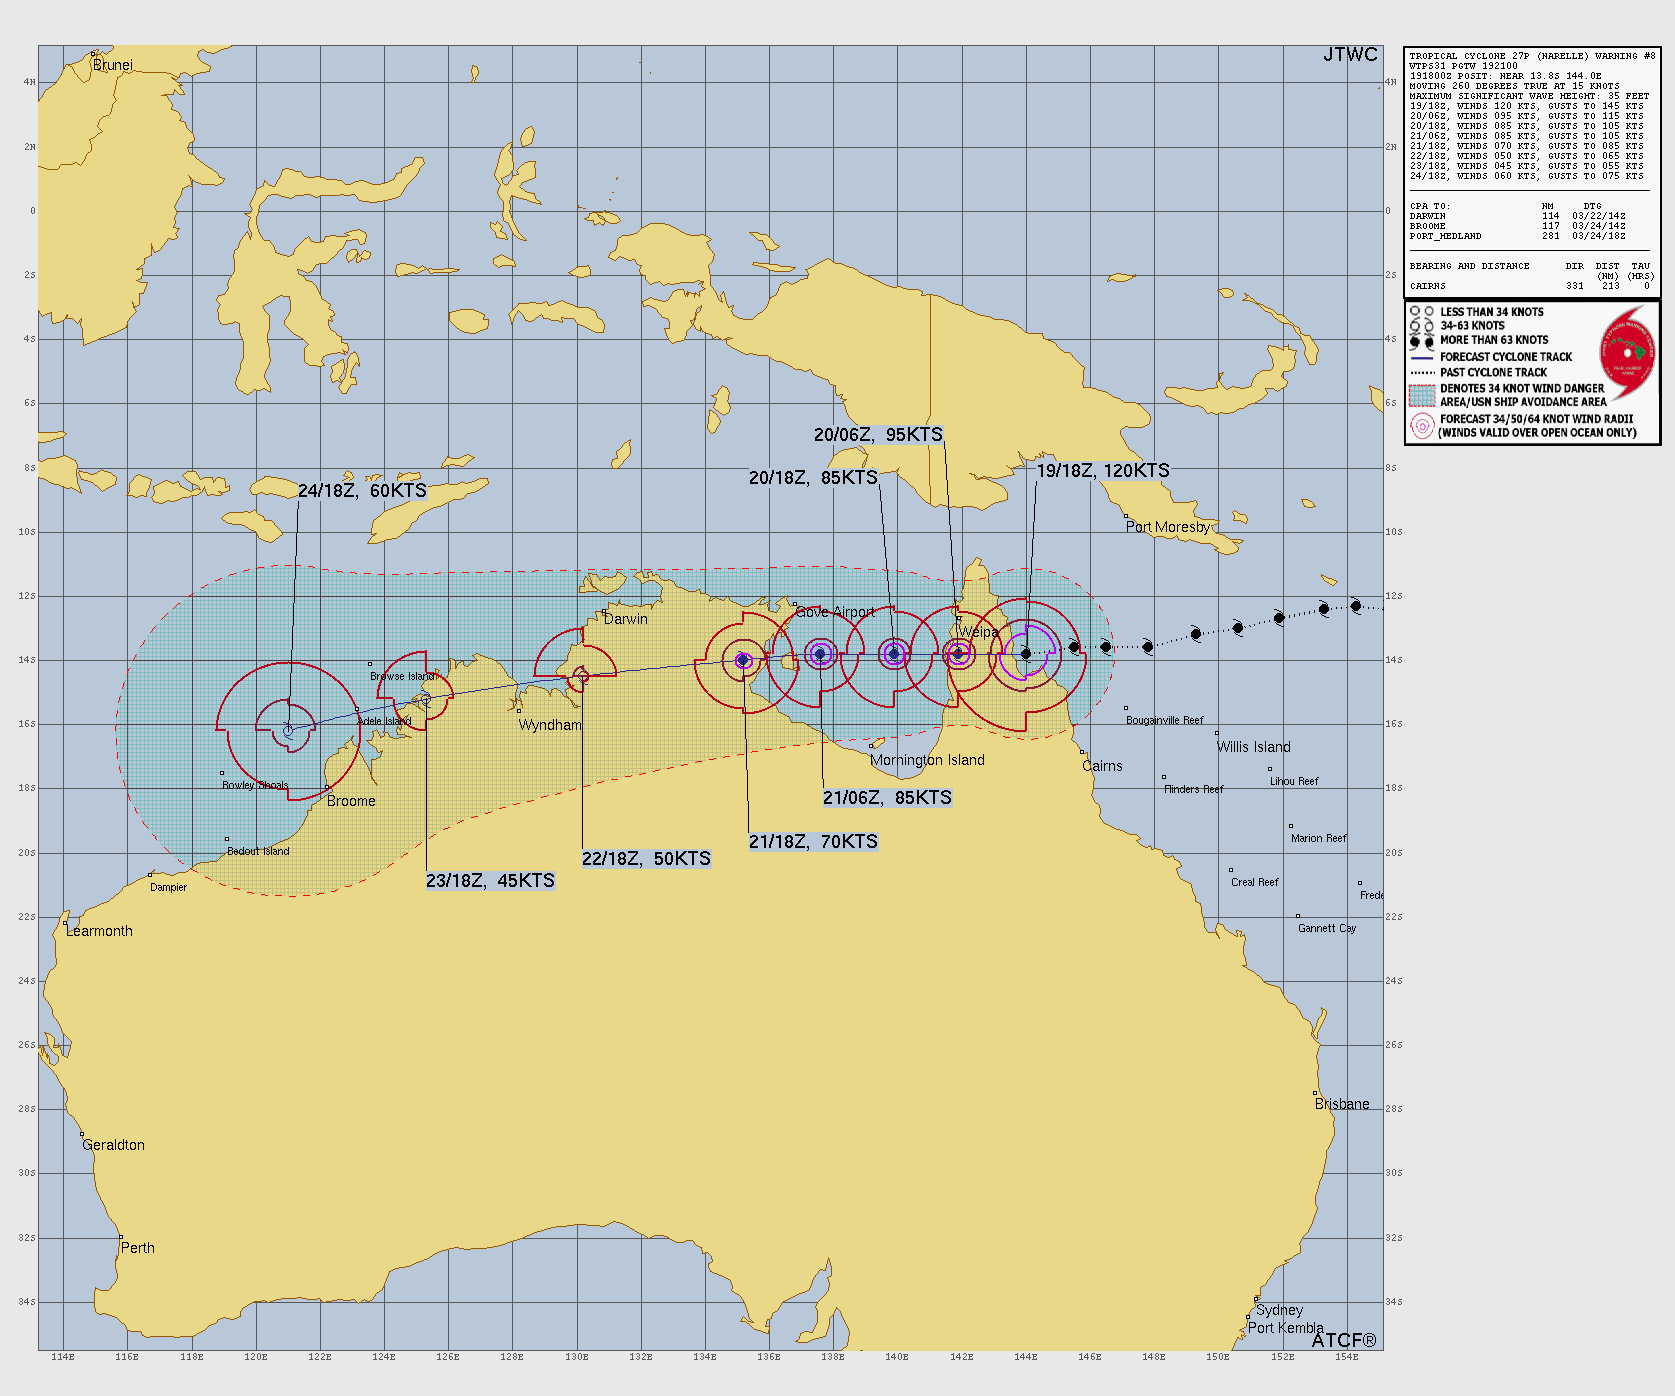
Tropical Cyclone Narelle (27P) made landfall along the coast of far northern Queensland a few hours ago (21Z) with maximum sustained winds of 120-125 knots — a solid Category 4 on the Atlantic hurricane scale. The eye was cloud-filled and likely undergoing a replacement cycle as Narelle reached land helping to somewhat soften the blow. Narelle will continue into the Gulf of Carpentaria and then emerge into the Indian Ocean in a few days to continue its lifecycle.
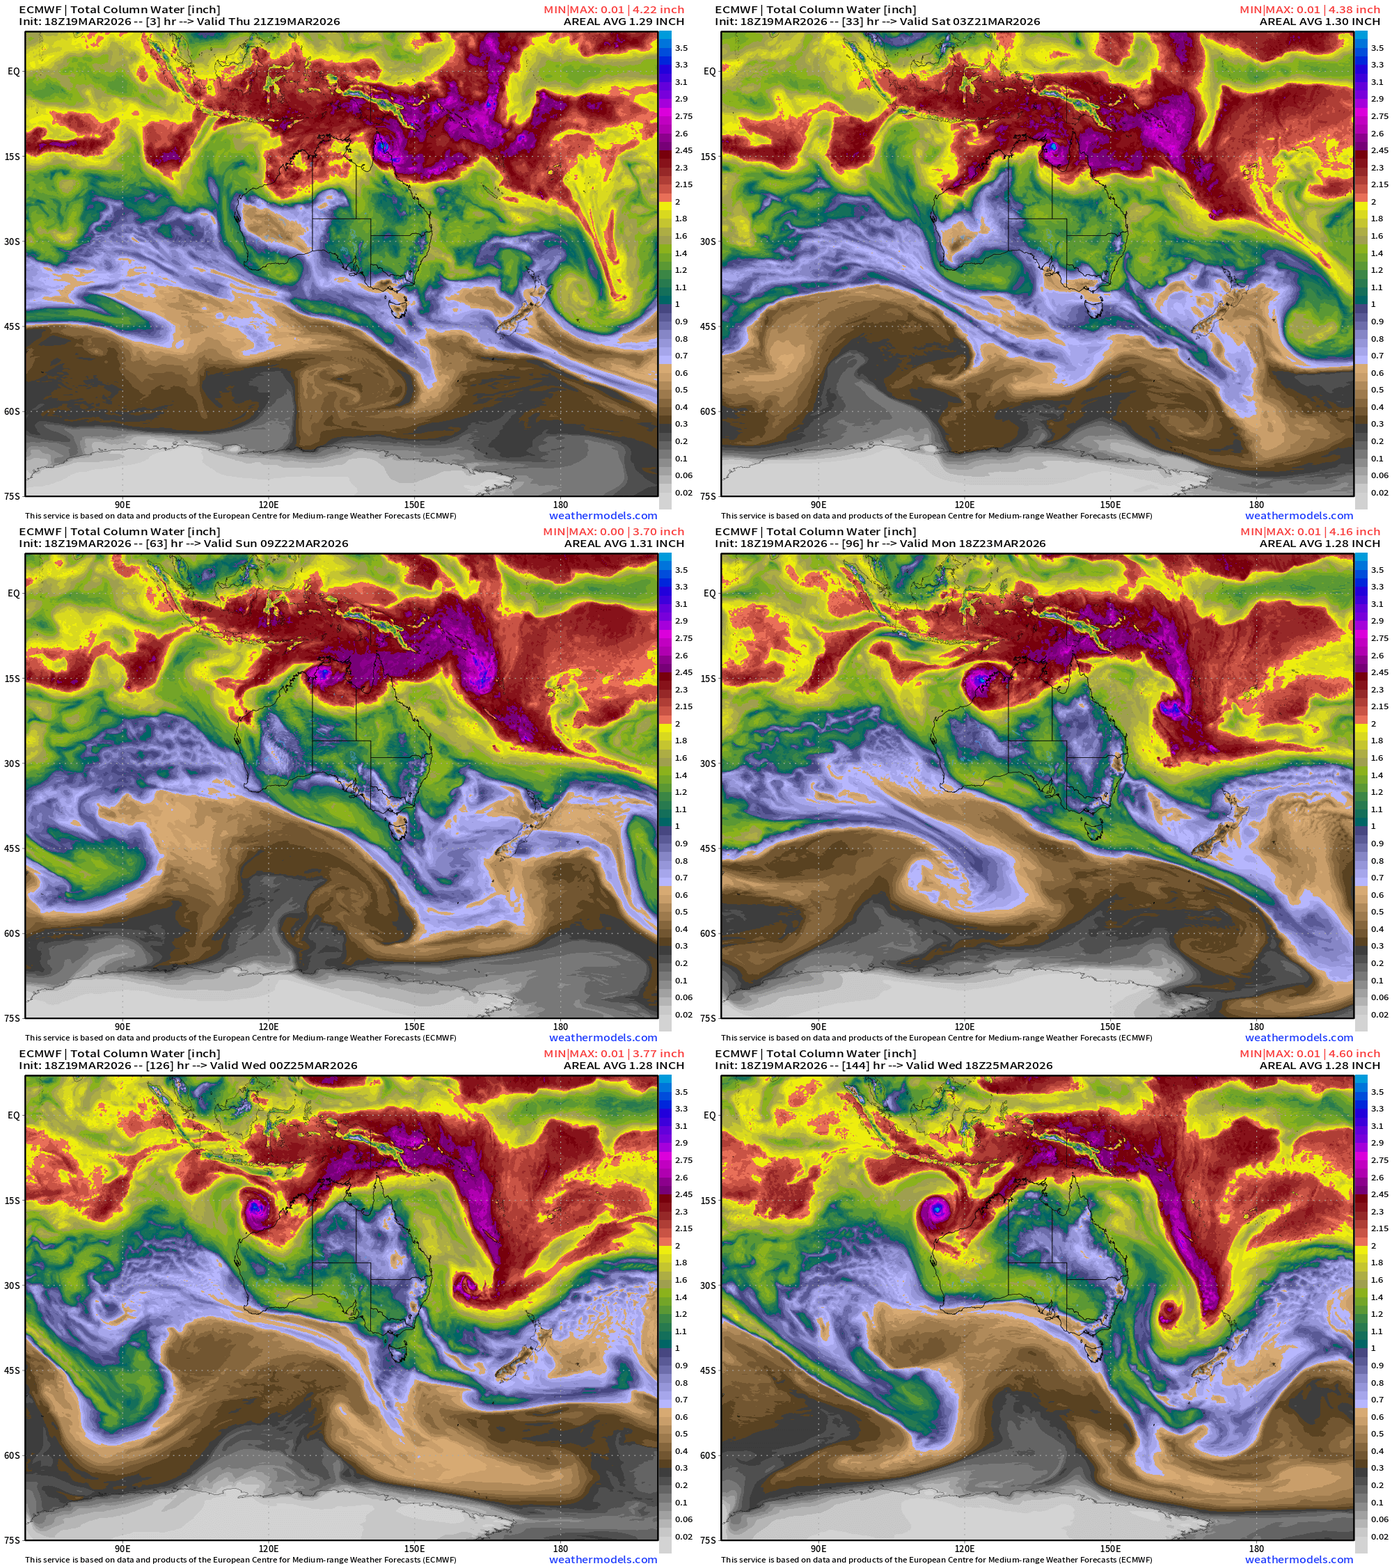
For the next 3-4 days, Narelle will be directly affecting the top end of Australia.
Sunrise on Narelle a few hours ago showing the cloud-filled eye and vigorous convection with transverse gravity waves emanating outward from the center into the upper-troposphere (exhaust system).
Southern Hemisphere “hurricane season” continues into April with the Southwest Pacific usually the most active basin.
Discussed the formation of the Heat Dome in yesterday’s post. I think I got it pretty much right. I should have added more information about the “atmospheric river” that streamed out of Hawaii into the Pacific Northwest on-top of the ridge … which helped diabatically (not diabetic) force additional height increases and warming. The “heat dome” formed off the California coast over the Pacific Ocean and then migrated eastward over the U.S. Southwest. The land is dry and continued subsidence = more height rises / ridge formation = hotter and hotter. This is similar to the Pacific Northwest Heat Wave from June 2021 that had multiple ingredients.
The intensity of the Canadian tropospheric polar vortex is also likely a critical component assisting with the block persistence over the Pacific, but I’m not sure how the recent stratospheric PV stretching is incorporated. A way to figure out what caused what would be to look at ensembles ~7-days prior and look at the members that did or did not develop this heat dome.
Blend of Models Temperatures | Highs through Saturday March 28th.
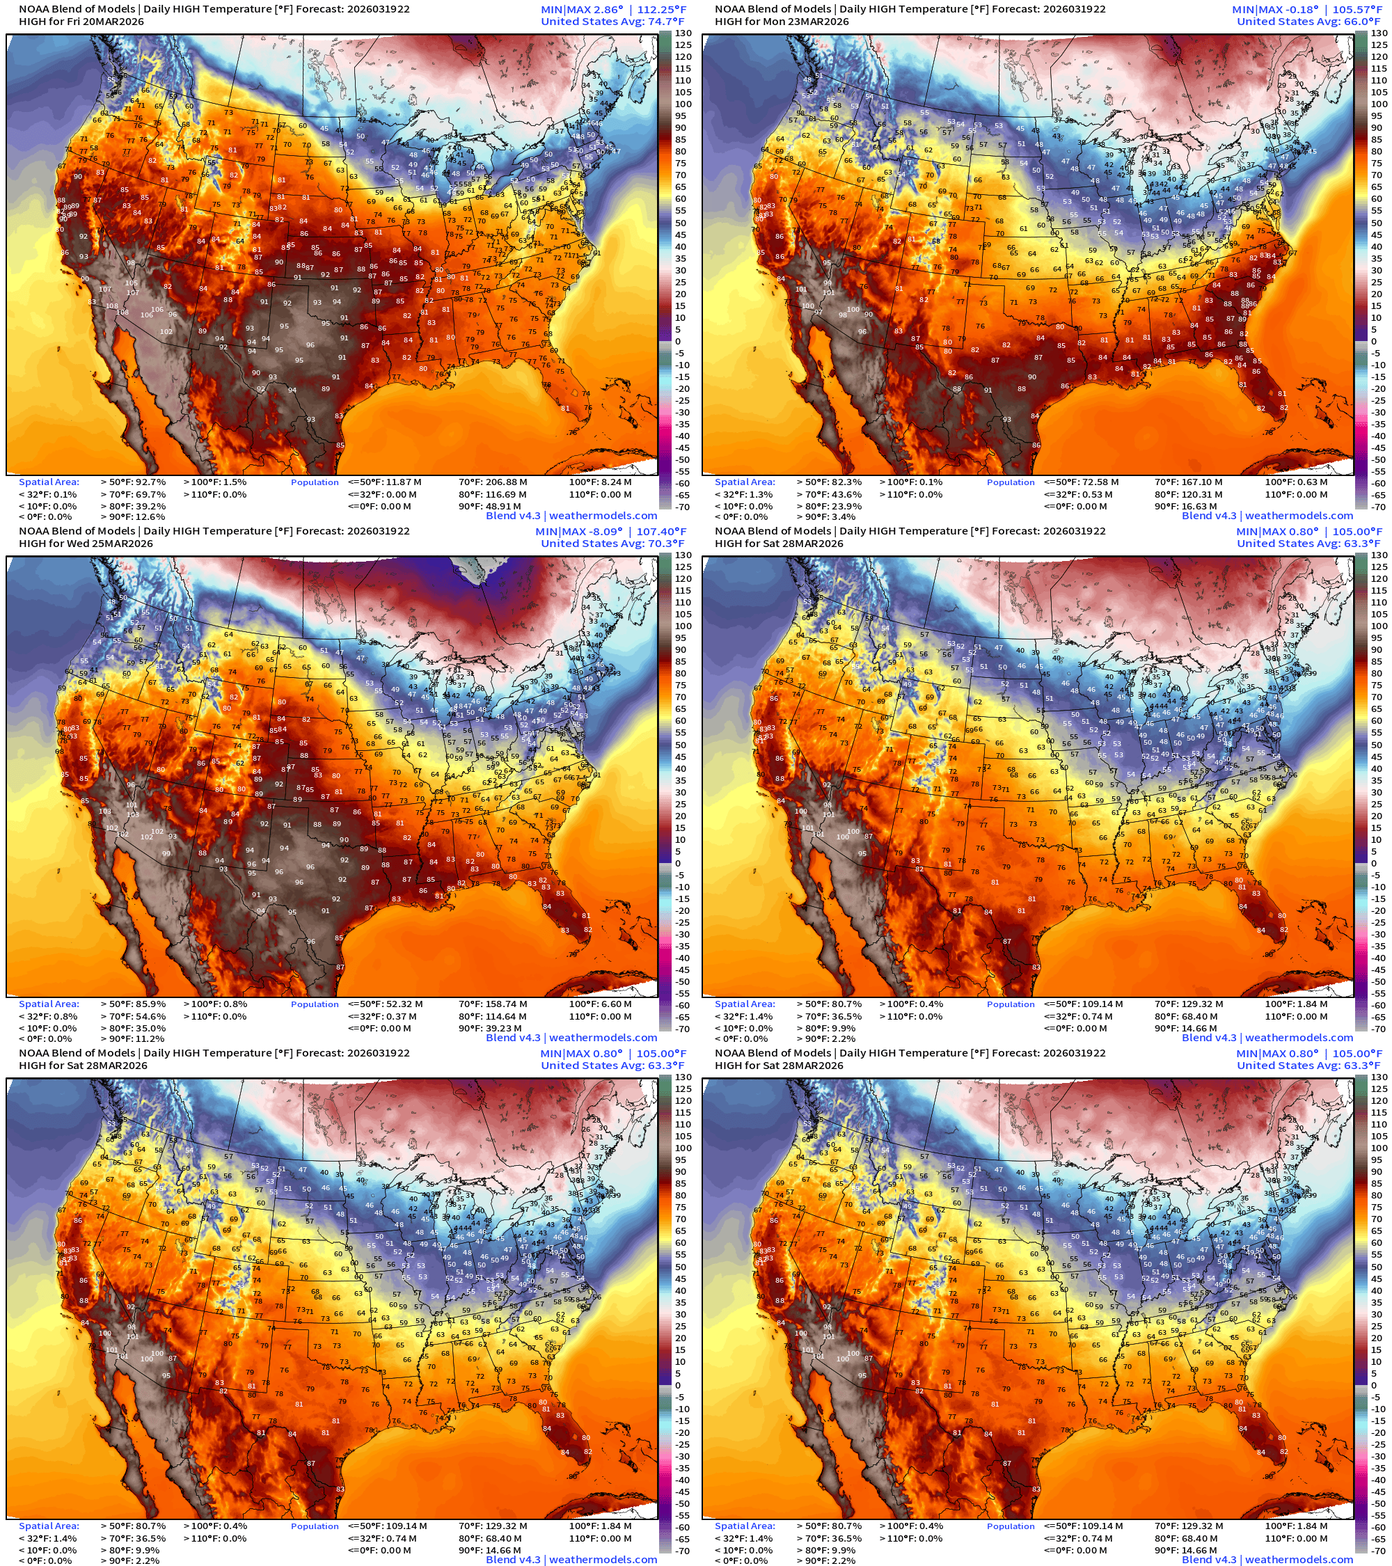
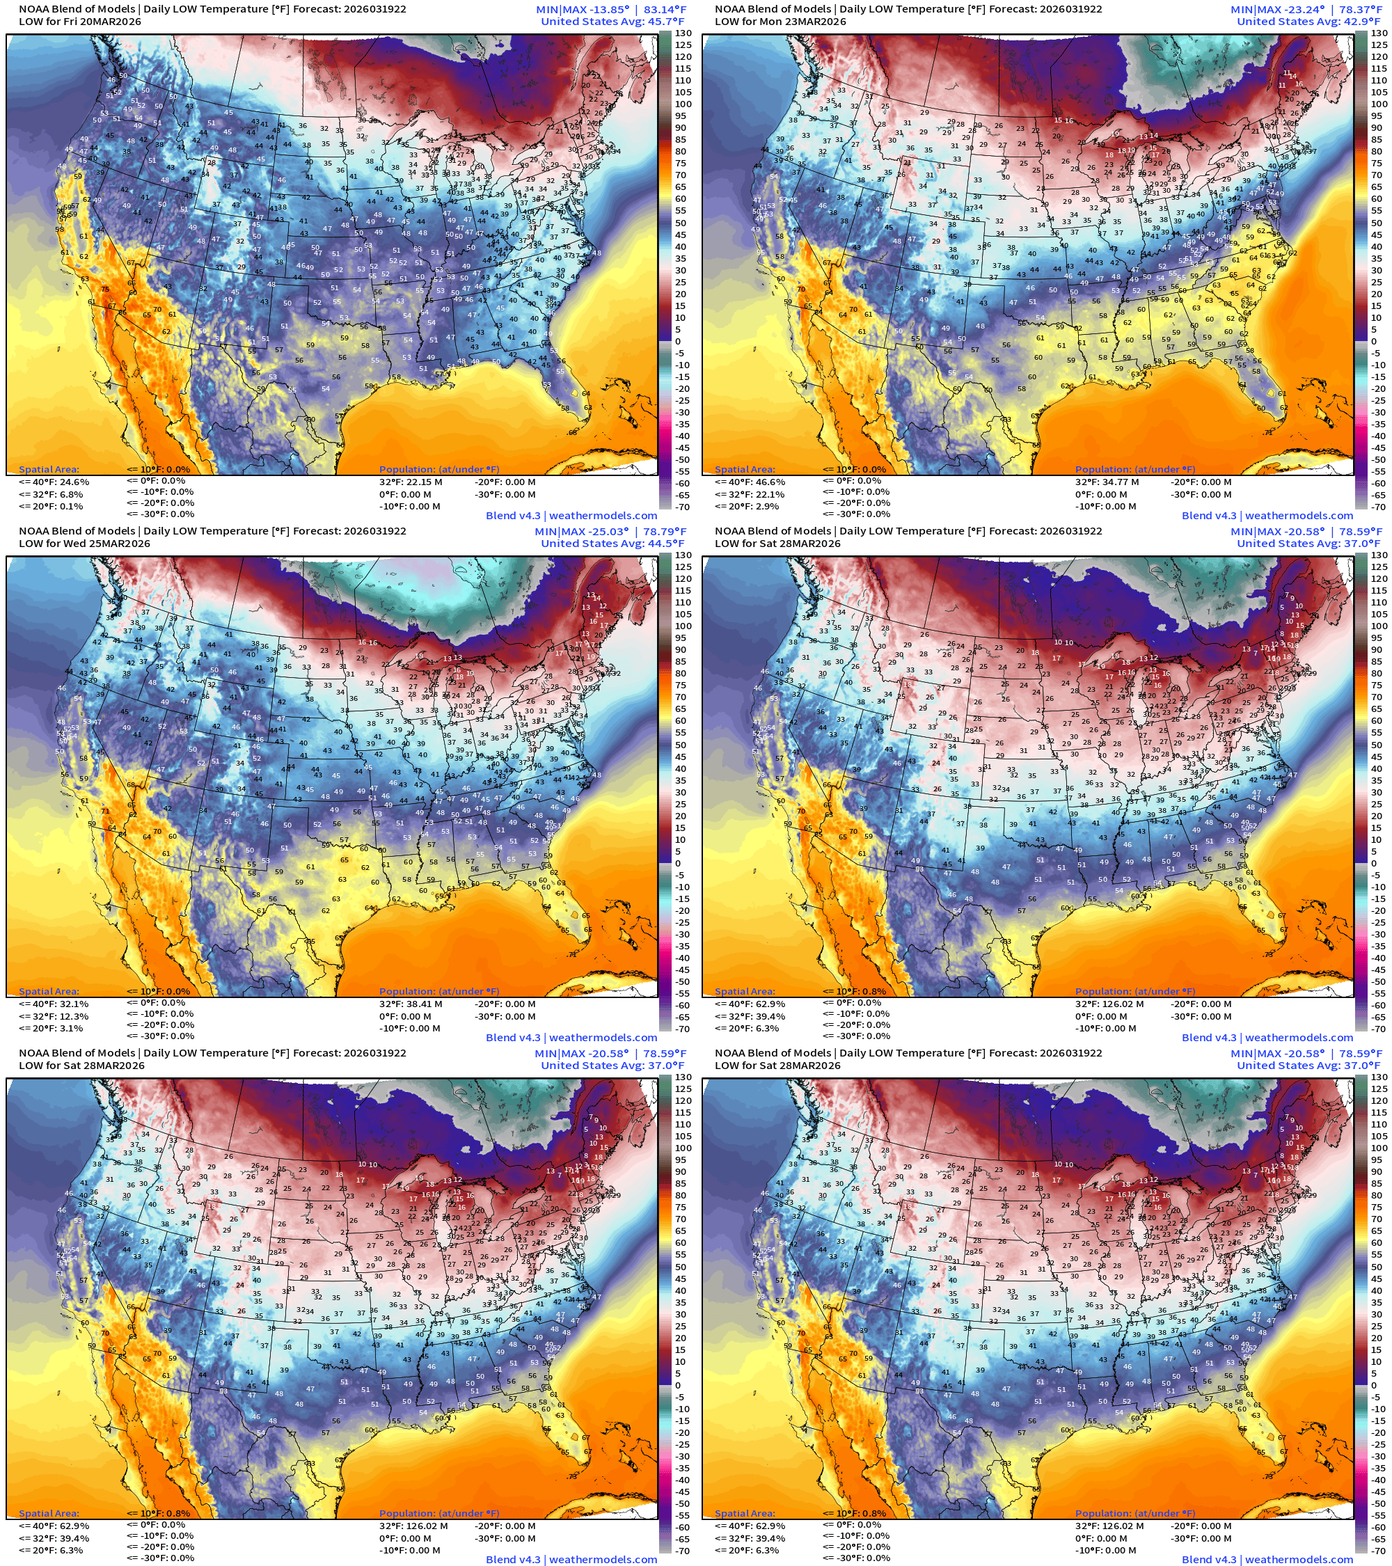
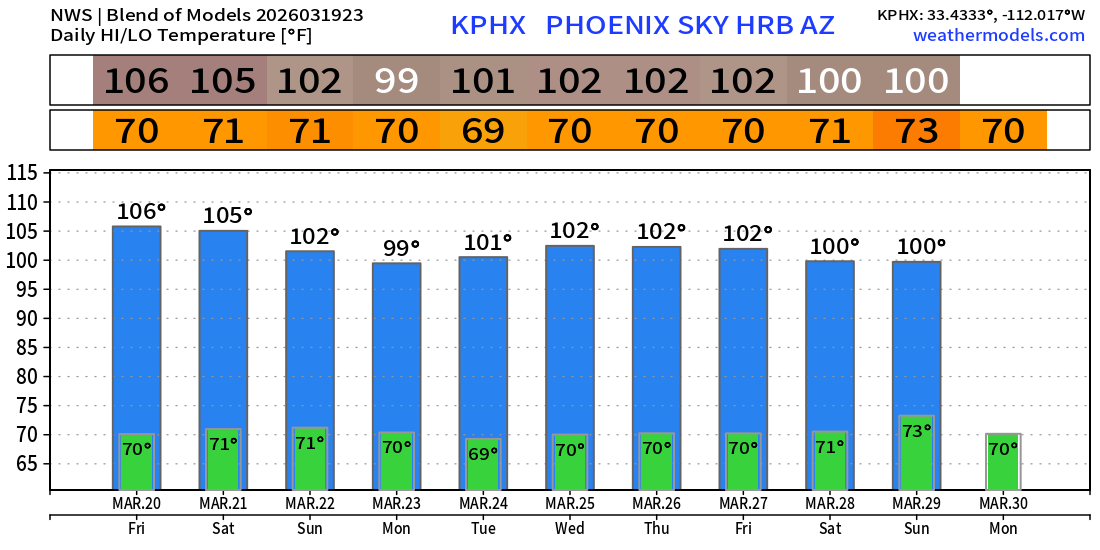
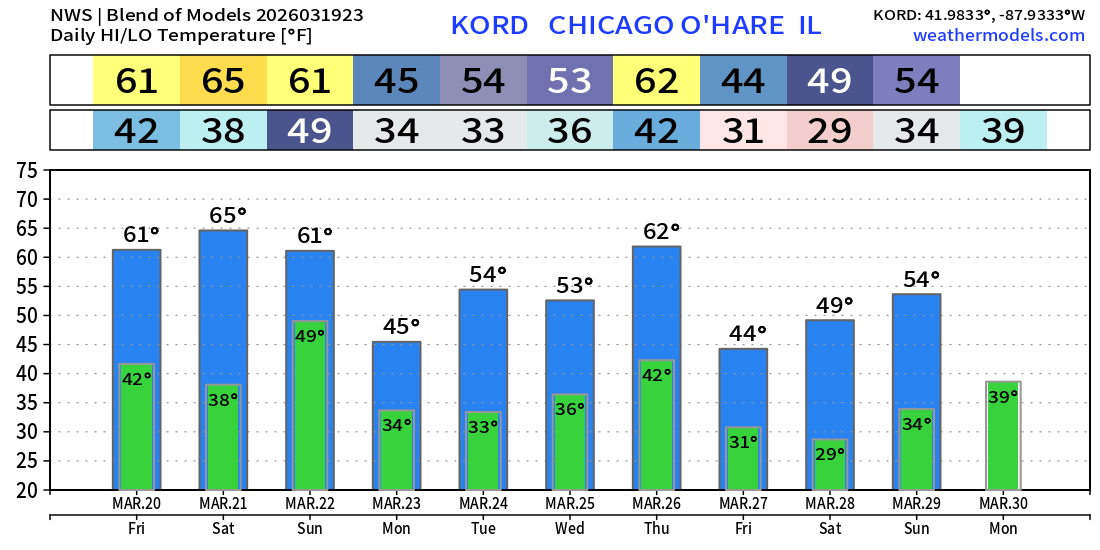
100s in the Southwest continue for the next 10-days … only a minor reprieve in Phoenix. Heat builds across Texas and the Plains into next week with “cool fronts” mainly affecting the Midwest, Great Lakes, and Northeast with bouts of “Arctic” chill. Thankfully we are heading into Spring proper and any “cold blasts” will be significantly tamer and shorter duration.
Blend of Models Temperatures | Lows through Saturday, March 30th
Blend of Models | Total Snowfall Next 10-Days
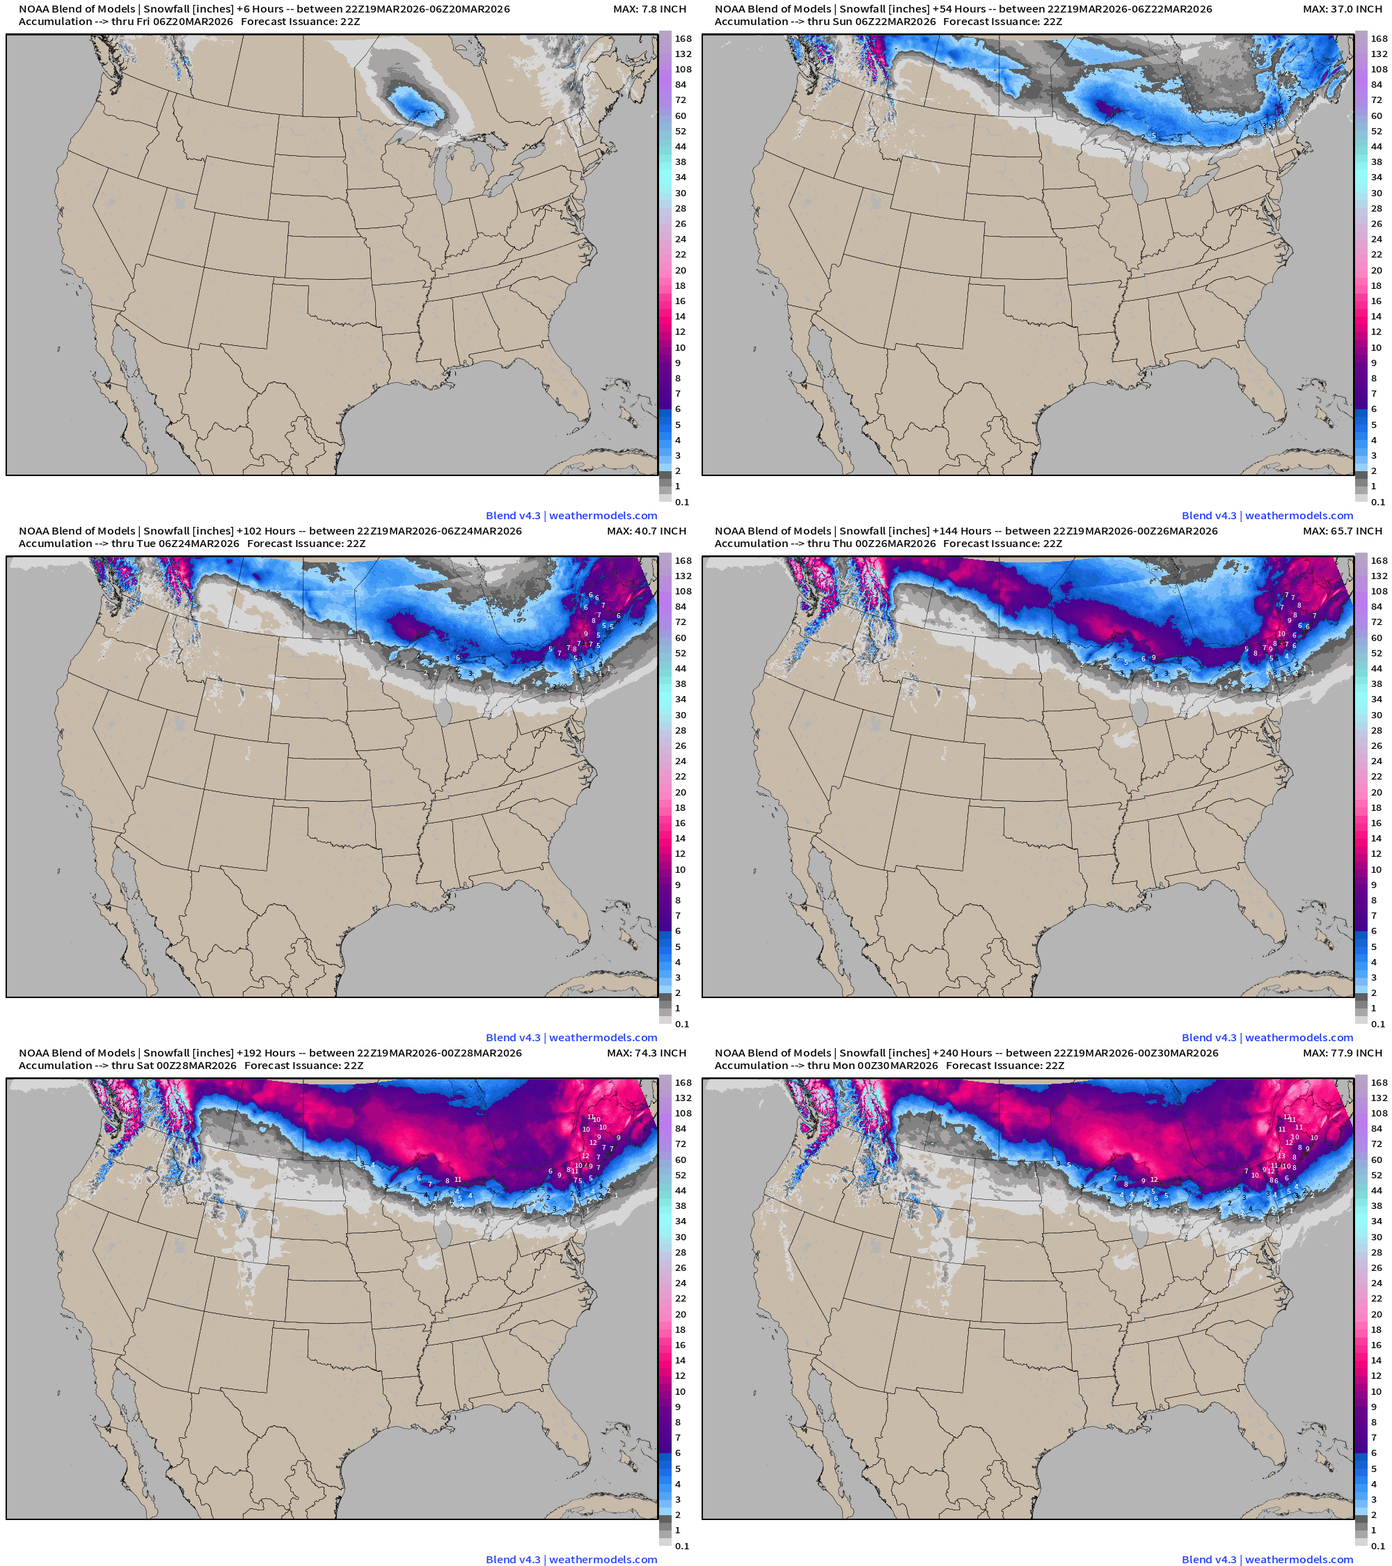
Still threat of snowfall along the Canadian border of the Lower 48 … but we’re trending in the right direction with minimal chance of a major storm … instead Clipper Systems with just enough cold air on their backside to provide brief snowfalls.
Blend of Models | 10-Days Precipitation Total
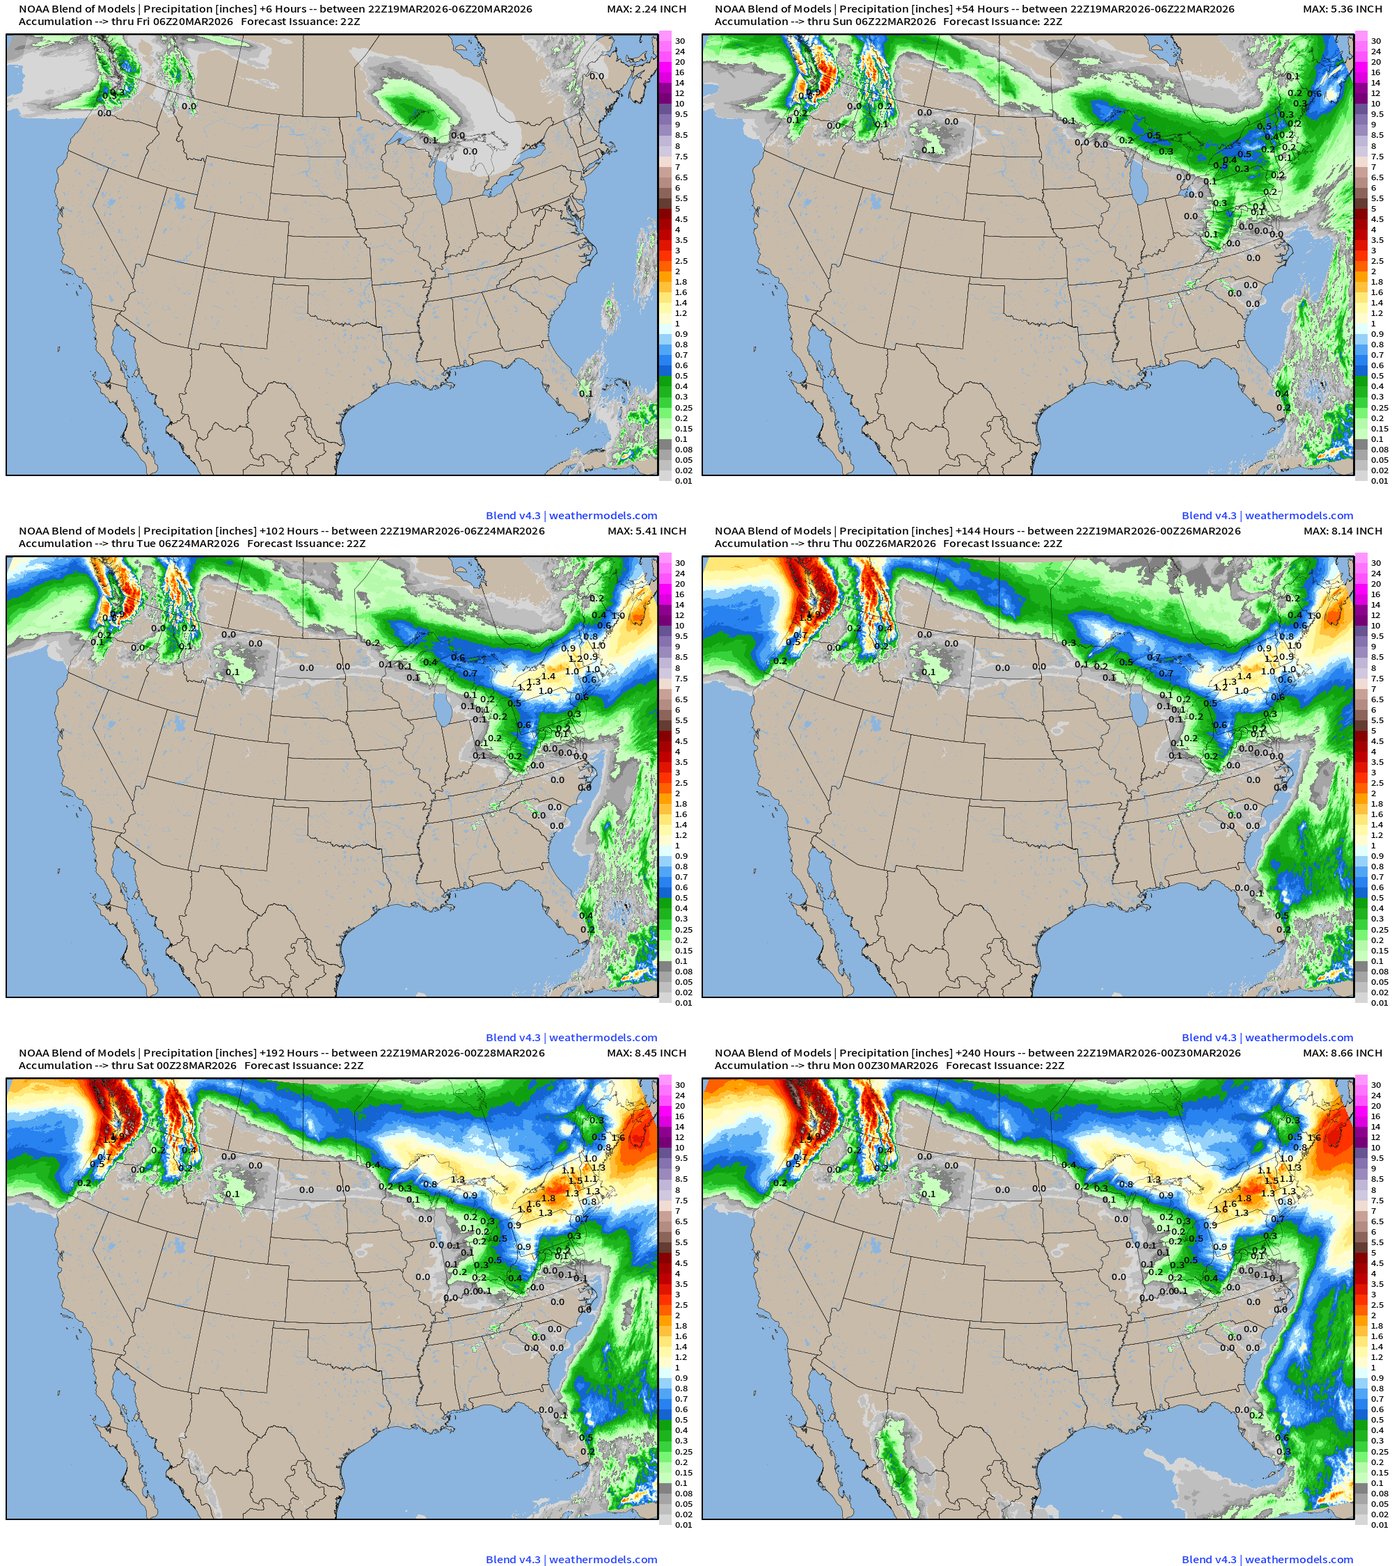
The heat dome / ridging pattern across the Western U.S. is sufficiently large and stretches eastward shutting down the moisture feed out of the Gulf of Mexico — very dry for the next 10-days across much of the Lower 48! That would mean little to none severe weather threat into end of March with this upper-level pattern.
HRRR 18z — Radar Simulation Next 48-hours to Saturday 2 PM ET
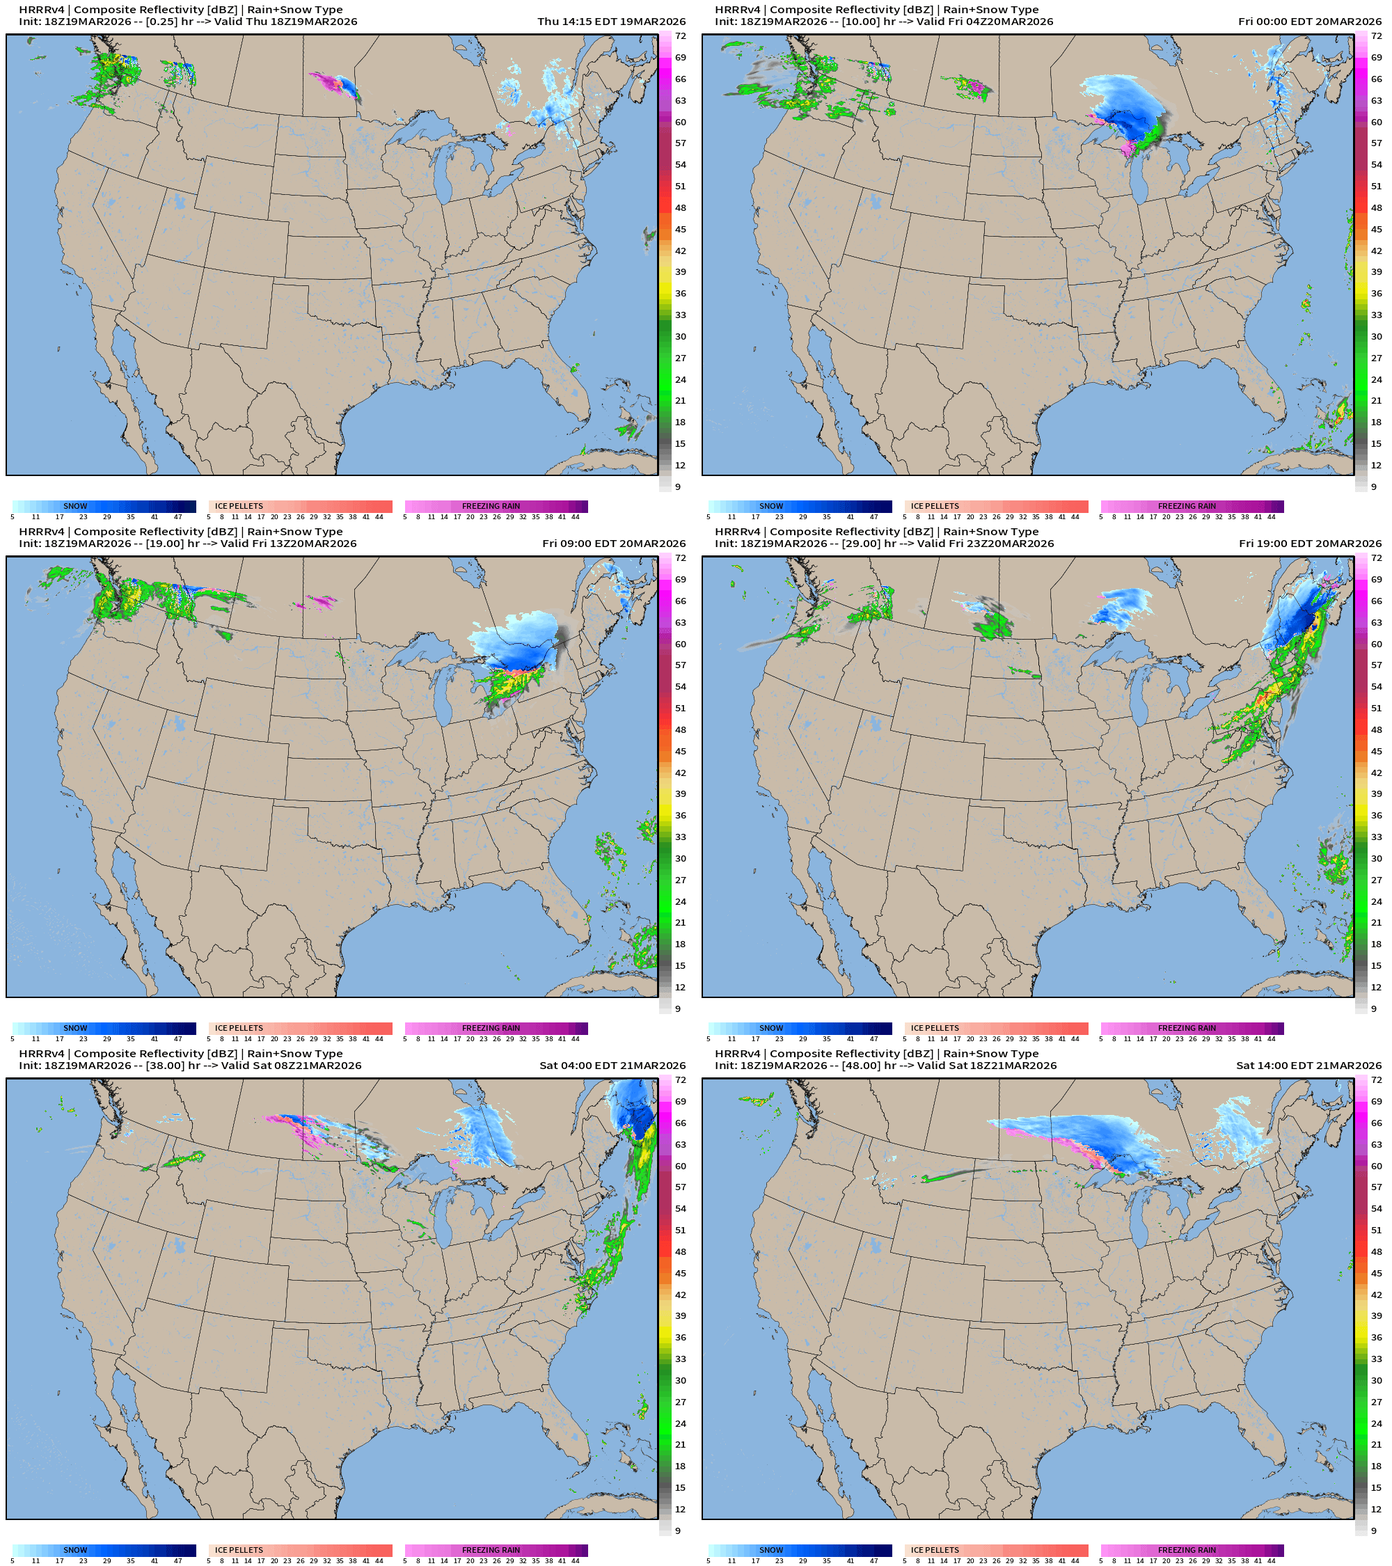
Very quiet —> Only a Clipper system through Great Lakes into New England on Friday
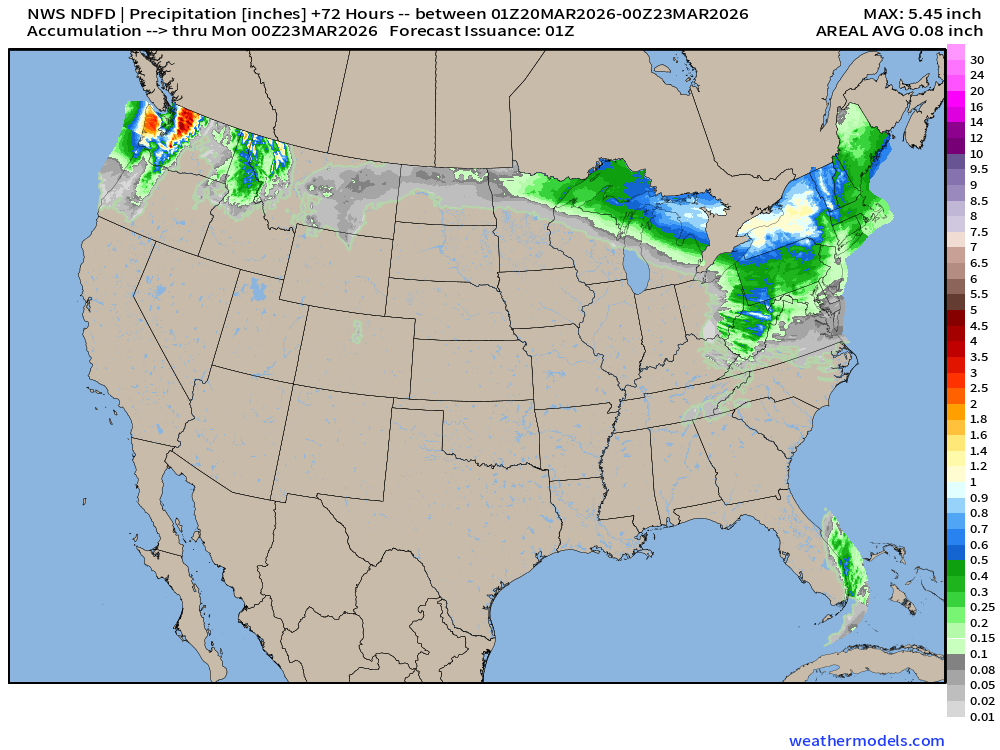
NDFD NWS Total Precipitation Next 72-hours through Sunday Evening
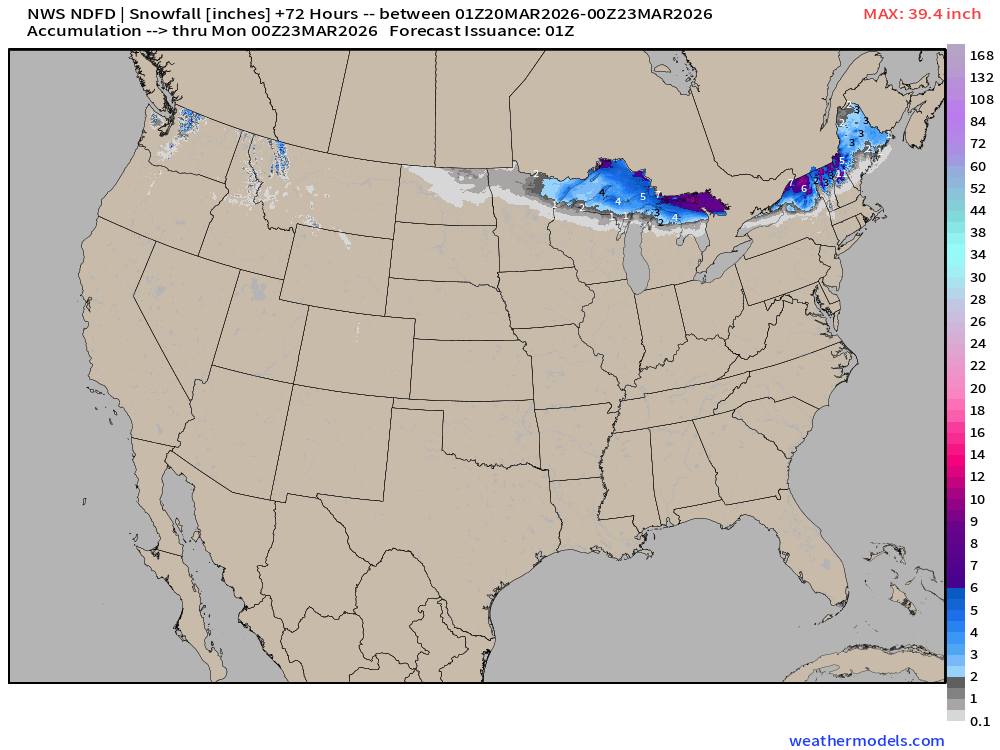
NWS Snowfall Next 72-hours — through Sunday Evening
RTMA Current Temperature Analysis | 8:45 PM ET
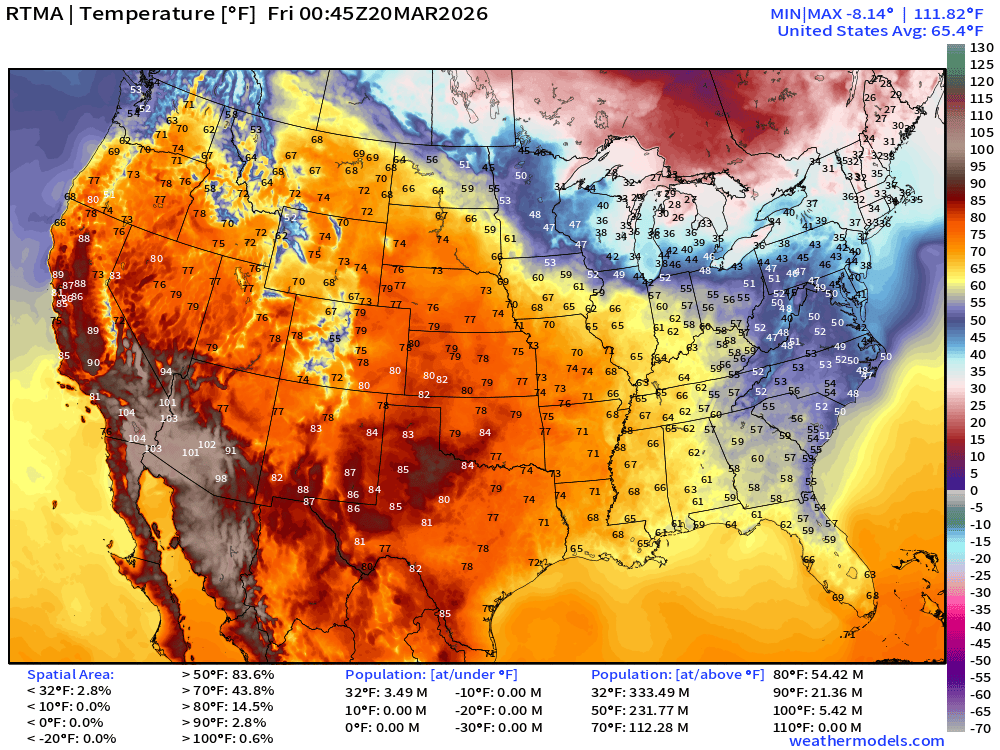
3.5 million below freezing … Lower 48 average was 65.4°F
RTMA Current Temperature Anomaly Analysis | 8:45 PM ET
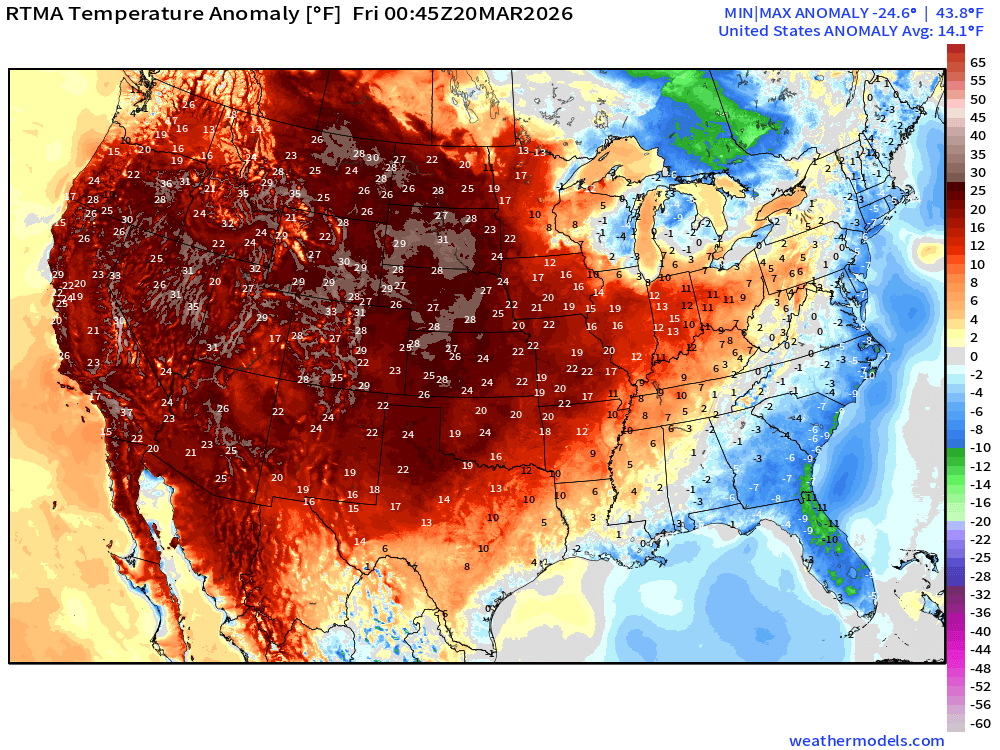
Lower 48 is a massive 14.1°F ABOVE normal
ECMWF 18z Precipitation Type + Intensity | Next 6-days
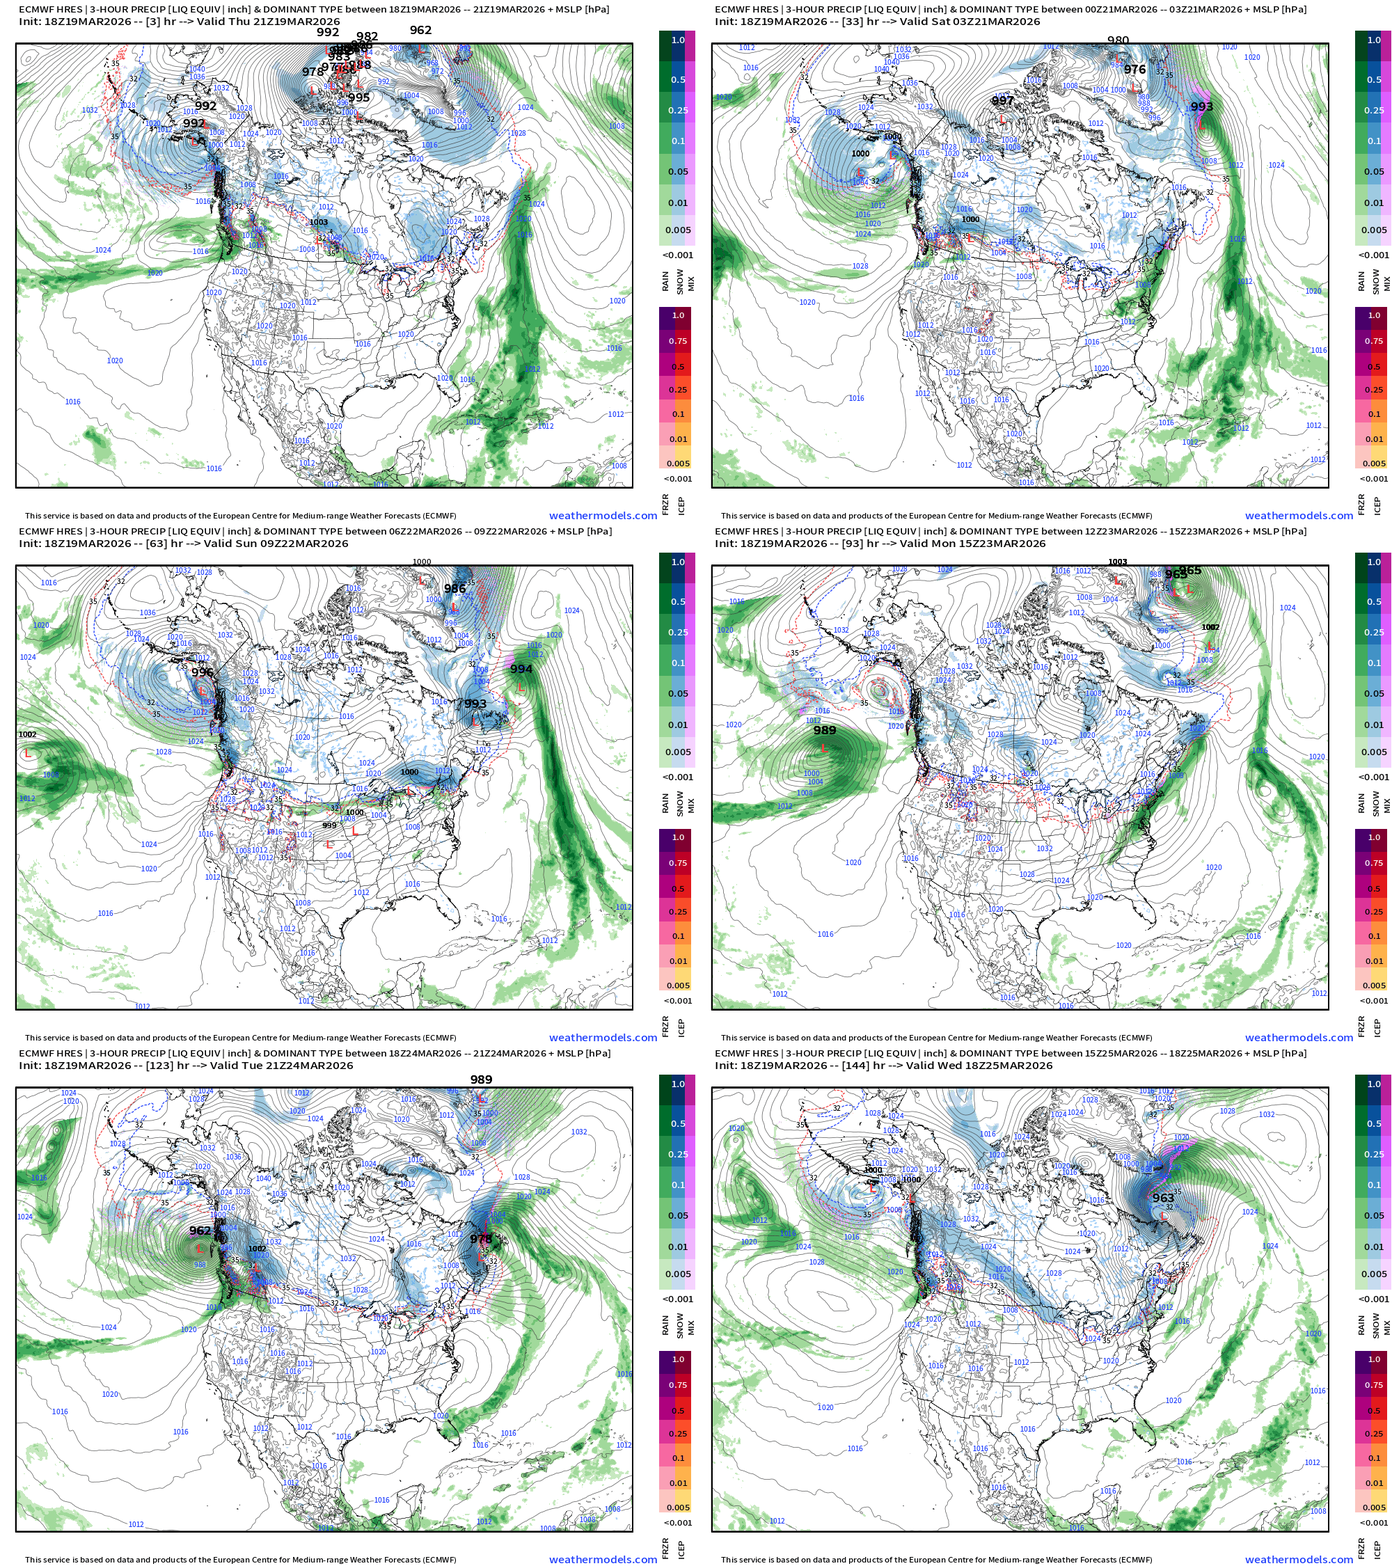
Not seeing much in the way of precipitation / active weather aside from Clipper Systems across the Northern Tier with moisture supplied by the Pacific Northwest atmospheric rivers. Still some snowfall from the Great Lakes into the Northeast into next week along this northern storm track.
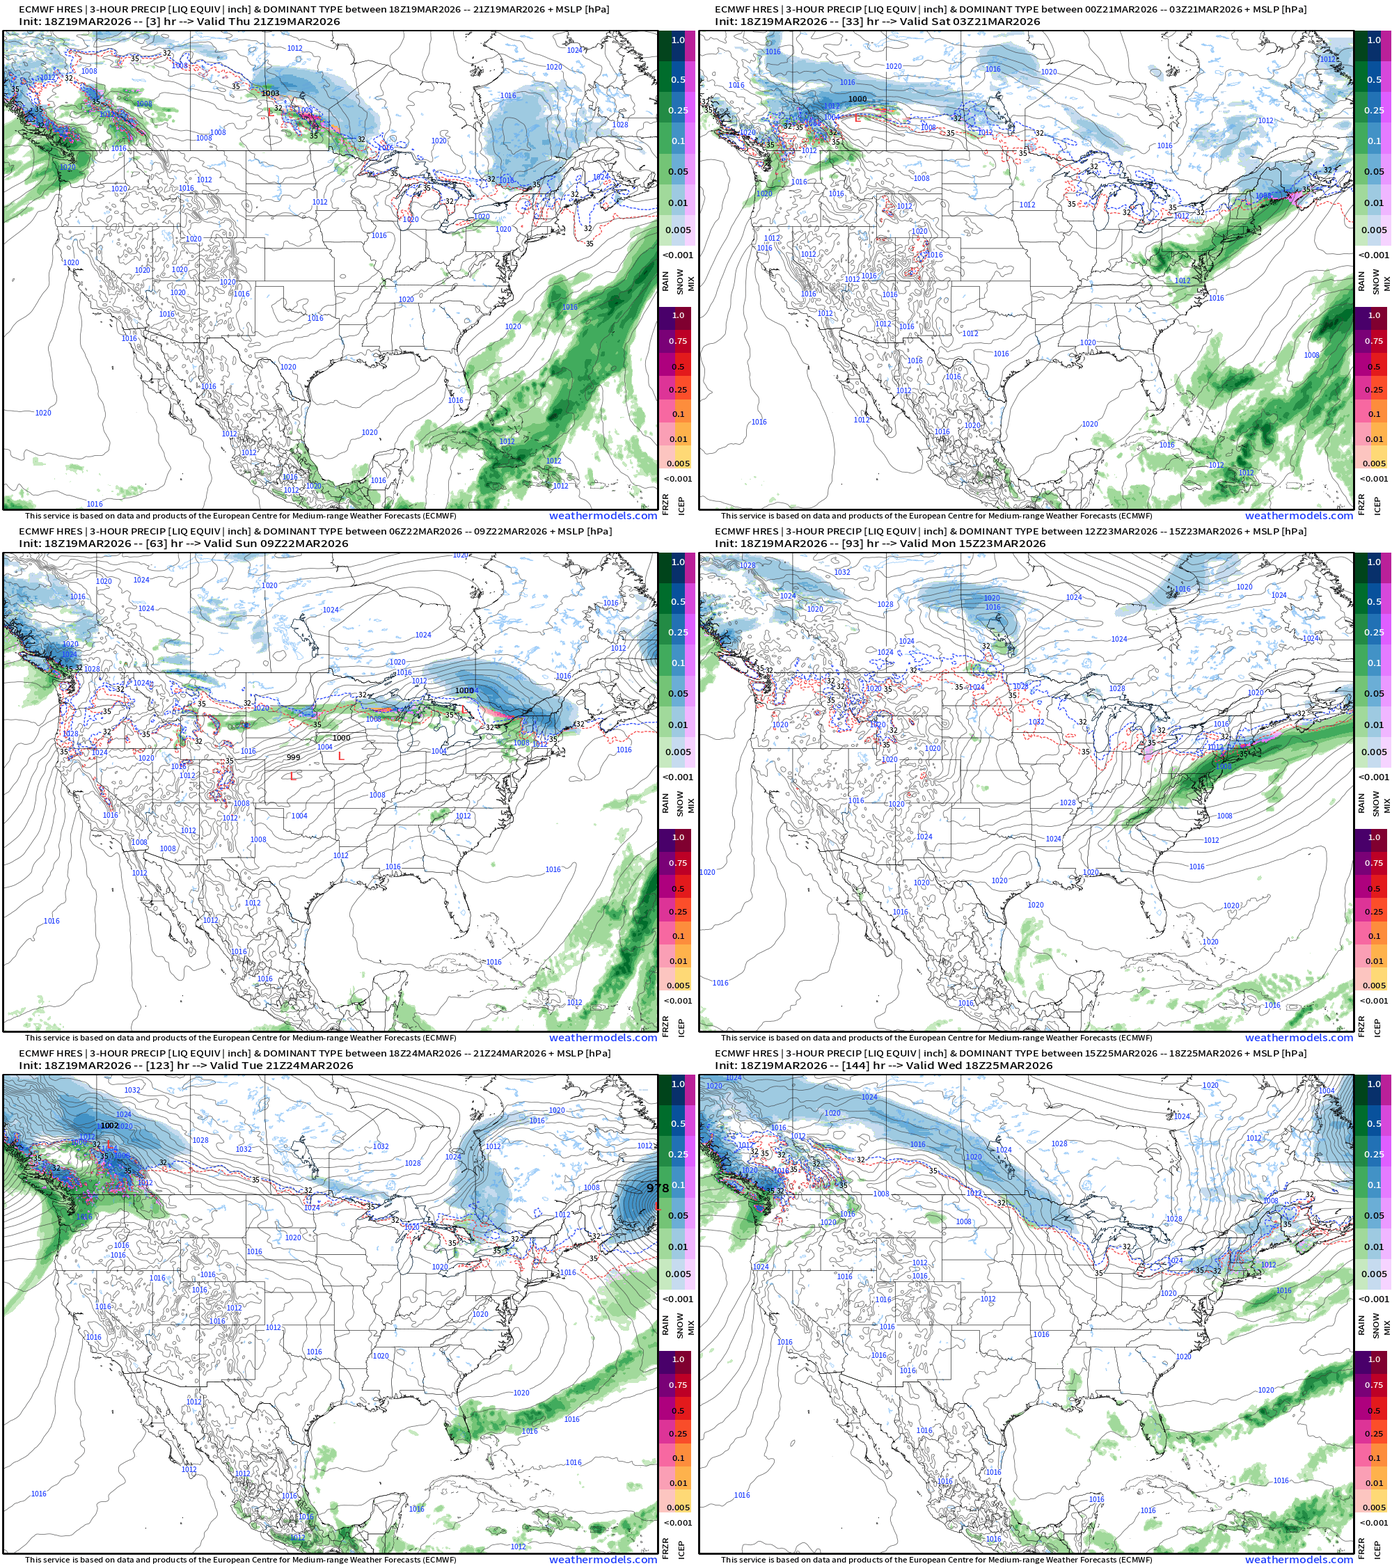
Temperature Anomaly Next 6-days
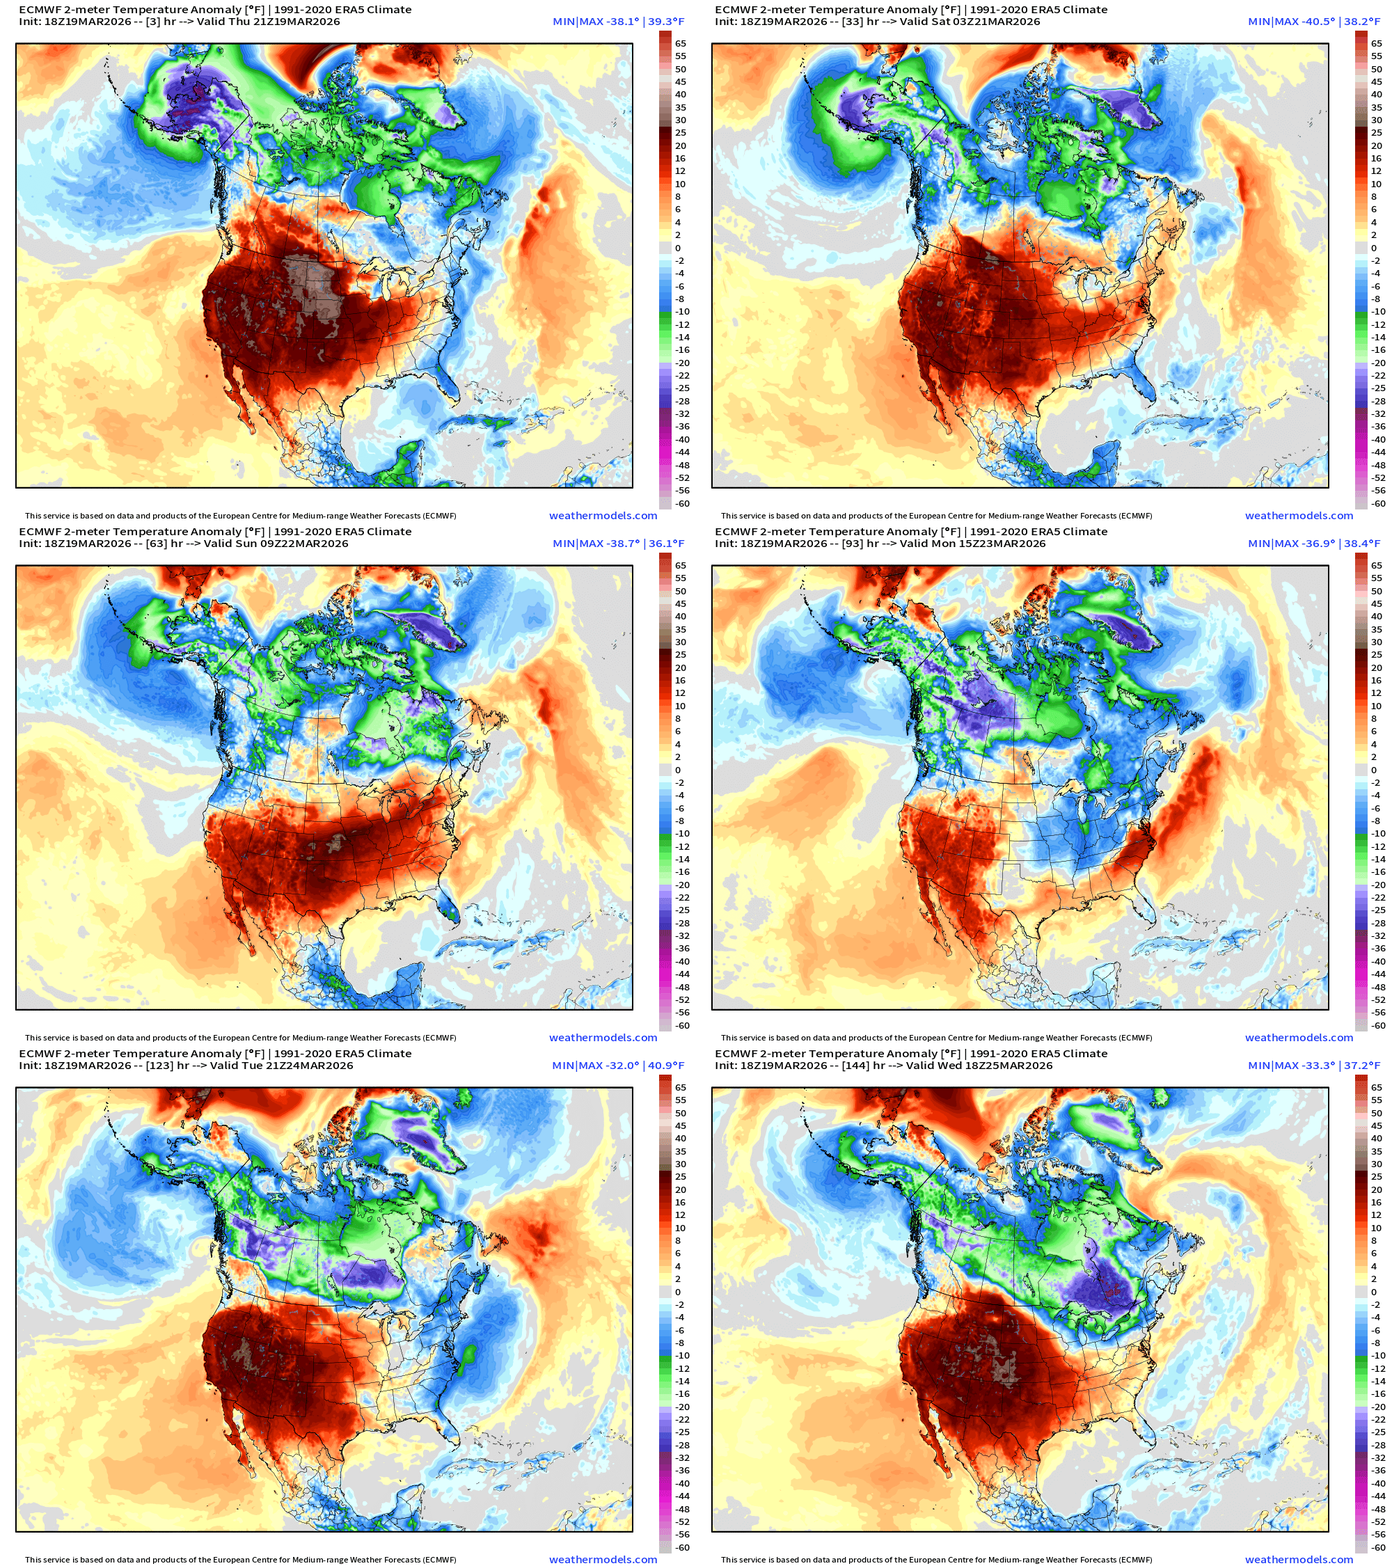
Record heat across the Western U.S. does shift eastward into the weekend and early next week before Canadian cool air sags southward. Much of Canada remains very cold!
Next 6-days of Precipitable Water (my favorite parameter)
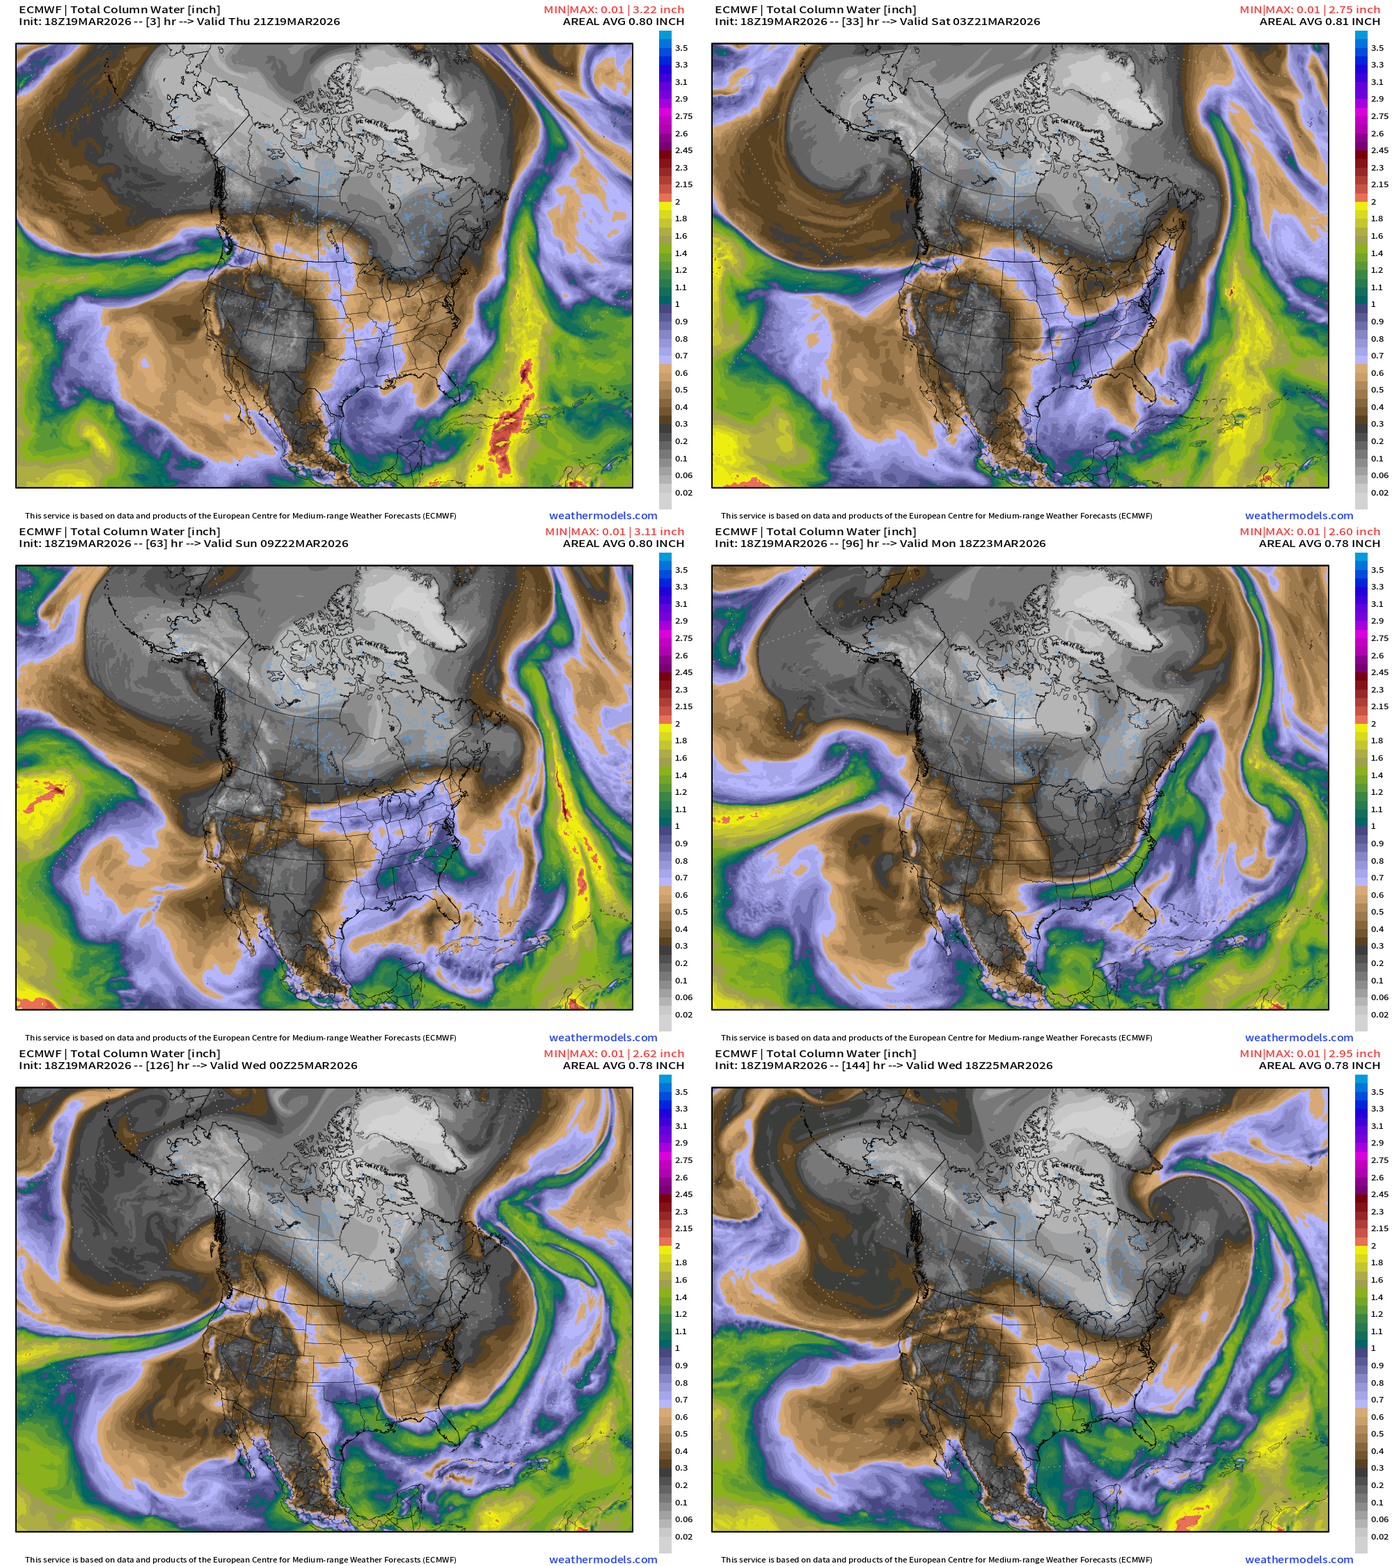
Significant atmospheric rivers (2 of them) into Pacific Northwest in next 7-days.
The heat dome circulation is forcing northerly flow to it east — and thankfully not tapping into the Canadian cold pool too significantly until maybe next week = moderating Lower 48 temperatures!
Phoenix next 10-days
Chicago next 10-Days
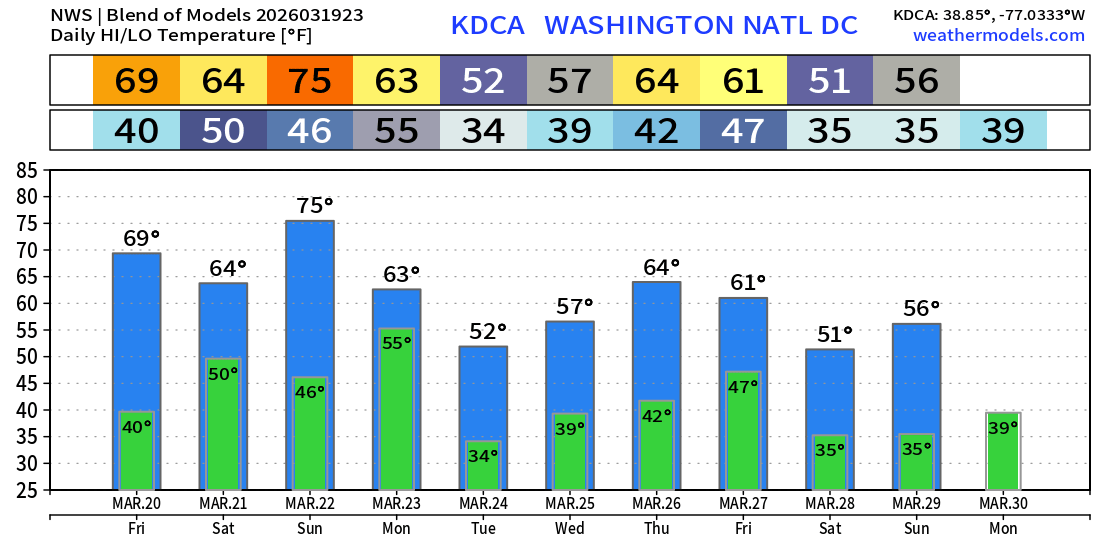
Washington D.C. next 10-days
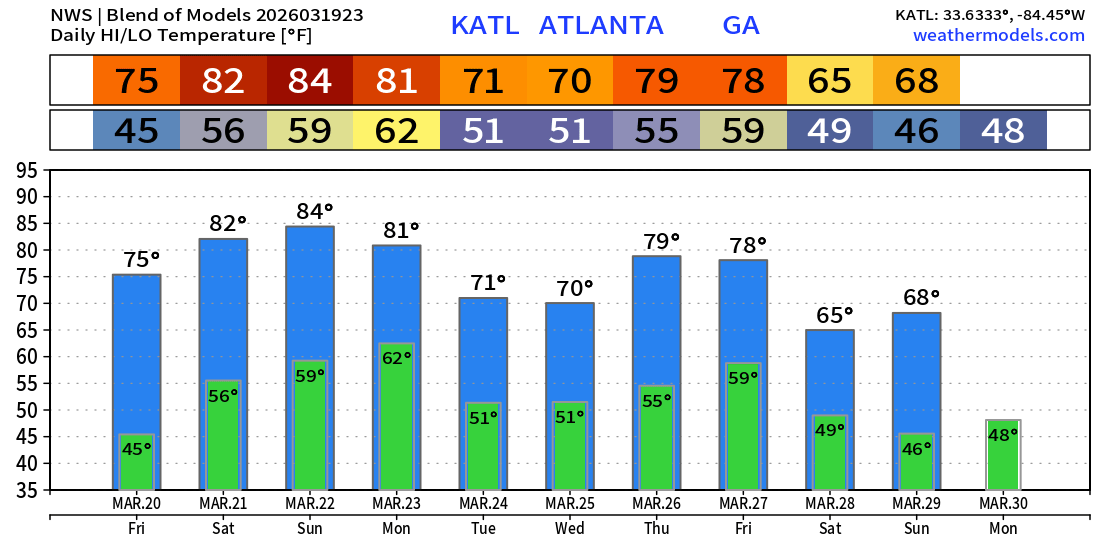
Atlanta next 10-days
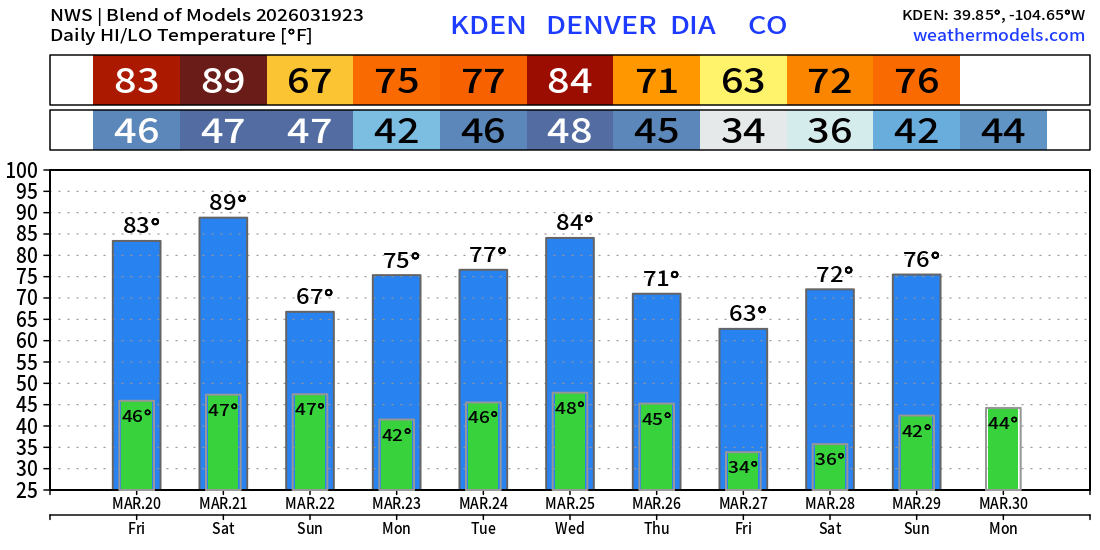
Denver next 10-days
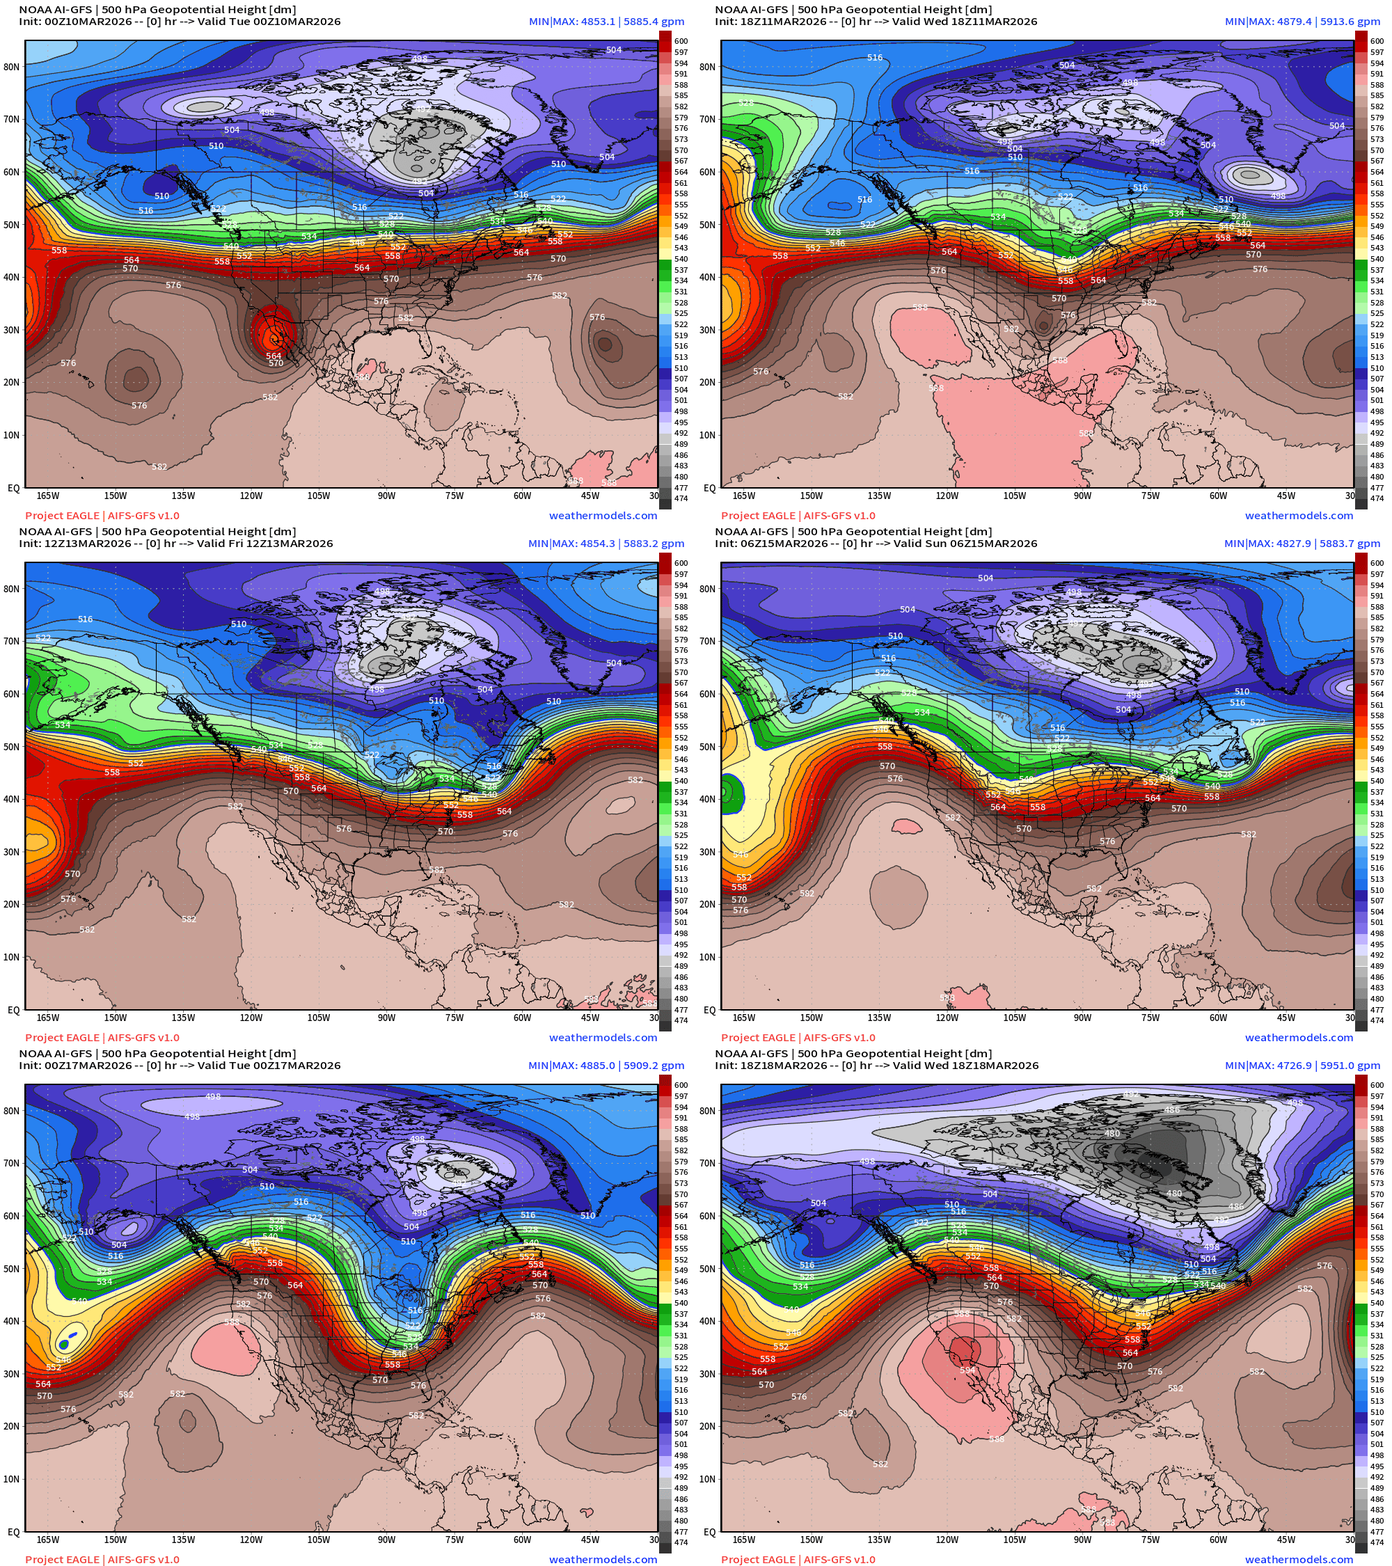
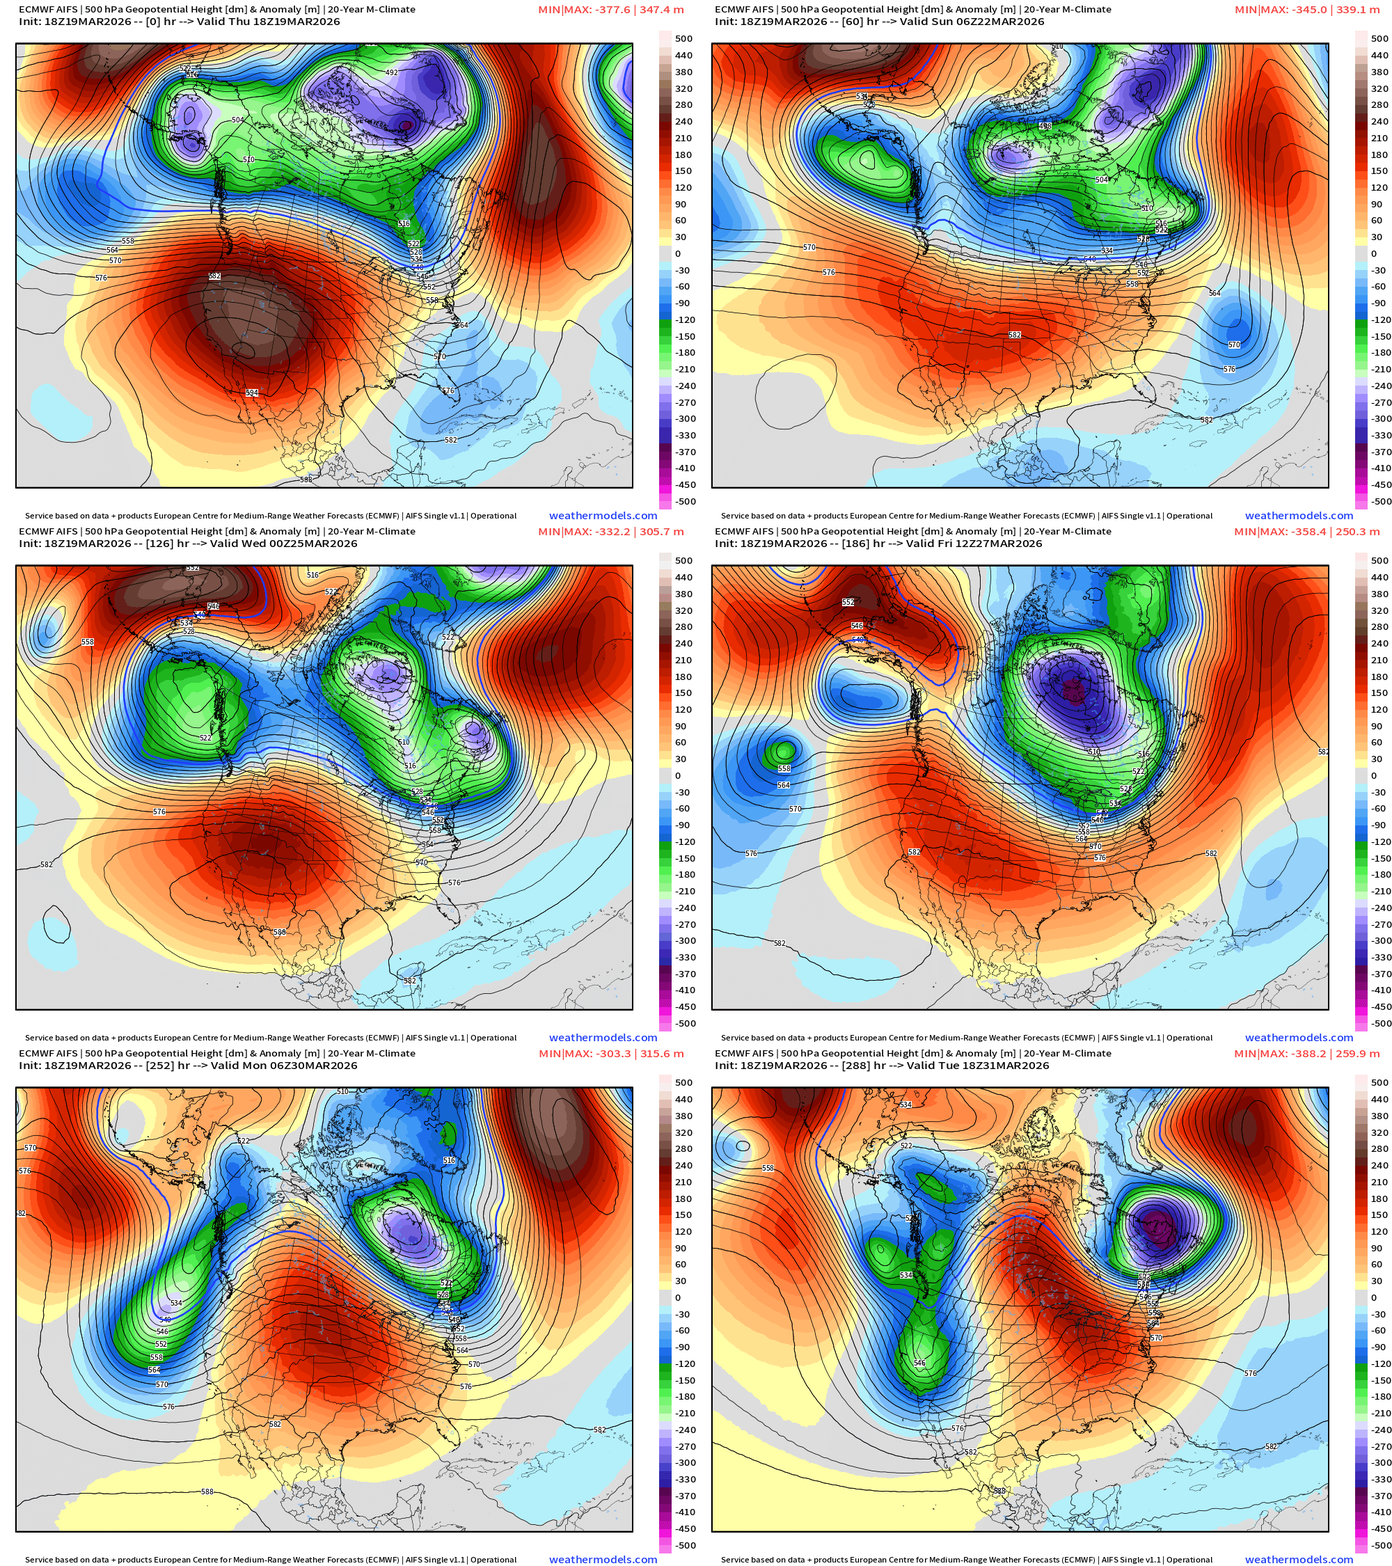
ECMWF AIFS 18z | Temperature at 500 mb | Next 15-days
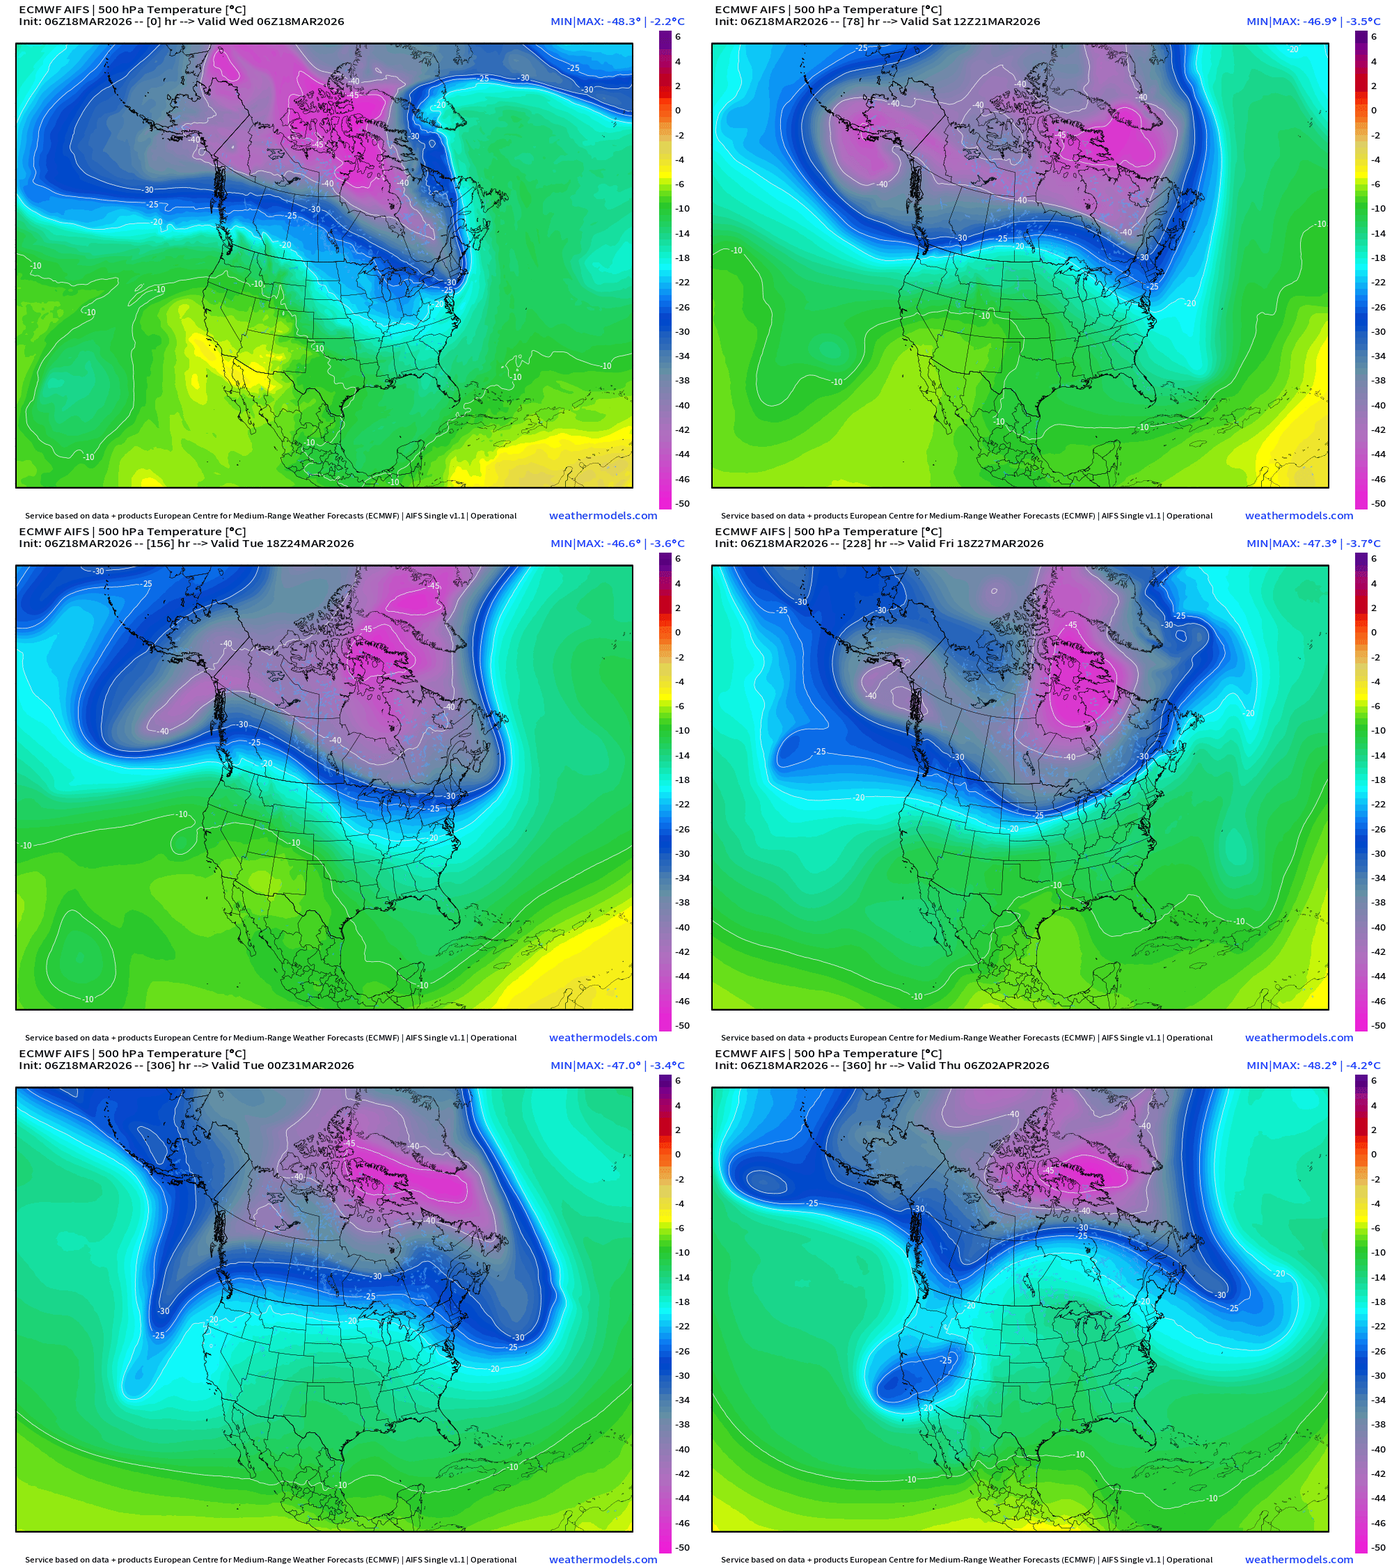
The tropospheric polar vortex remains “cold” and spinning strongly through end of March. Still a pool of -40°C to -48°C temperature air at 500 mb.
GFS Day 8 — Polar Vortex still powerful with nearly -50°C centroid under the “white fuzzball” on the dynamic tropopause map
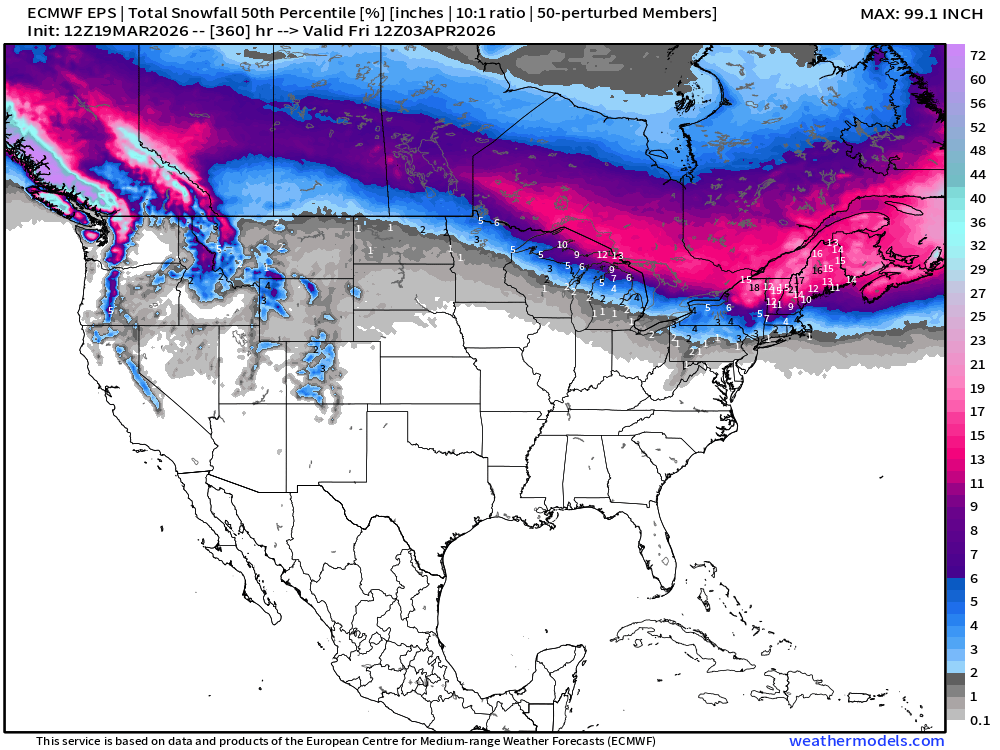
Snowfall | Median of ECMWF Ensembles [12z] | Next 15-days
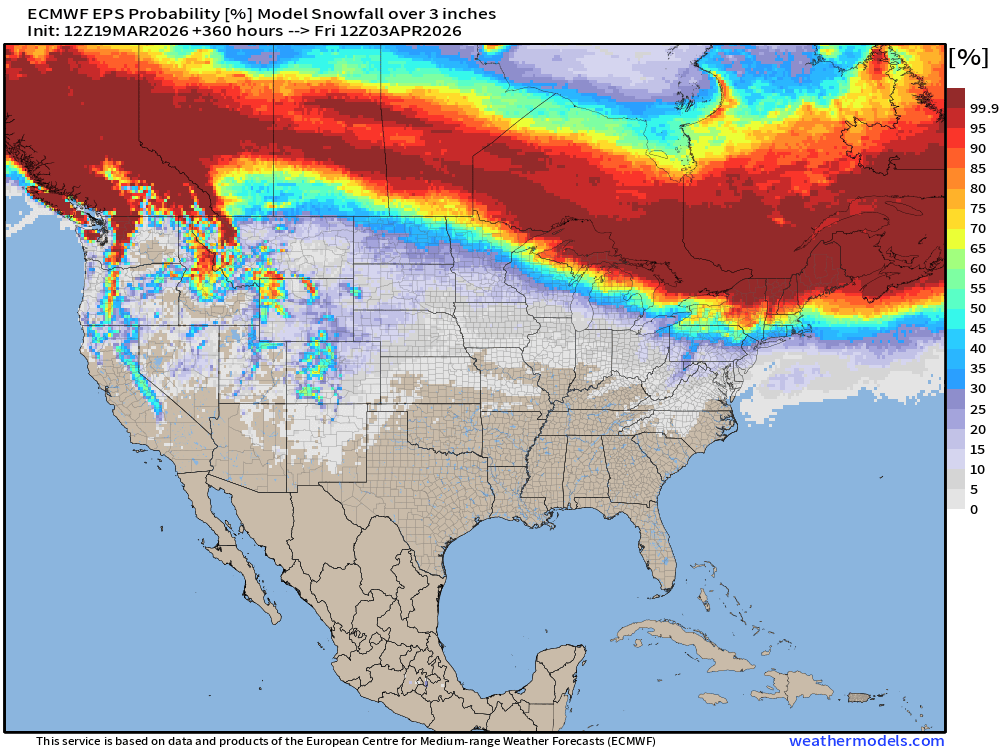
Probability of at least 3” of Snowfall Next 15-days
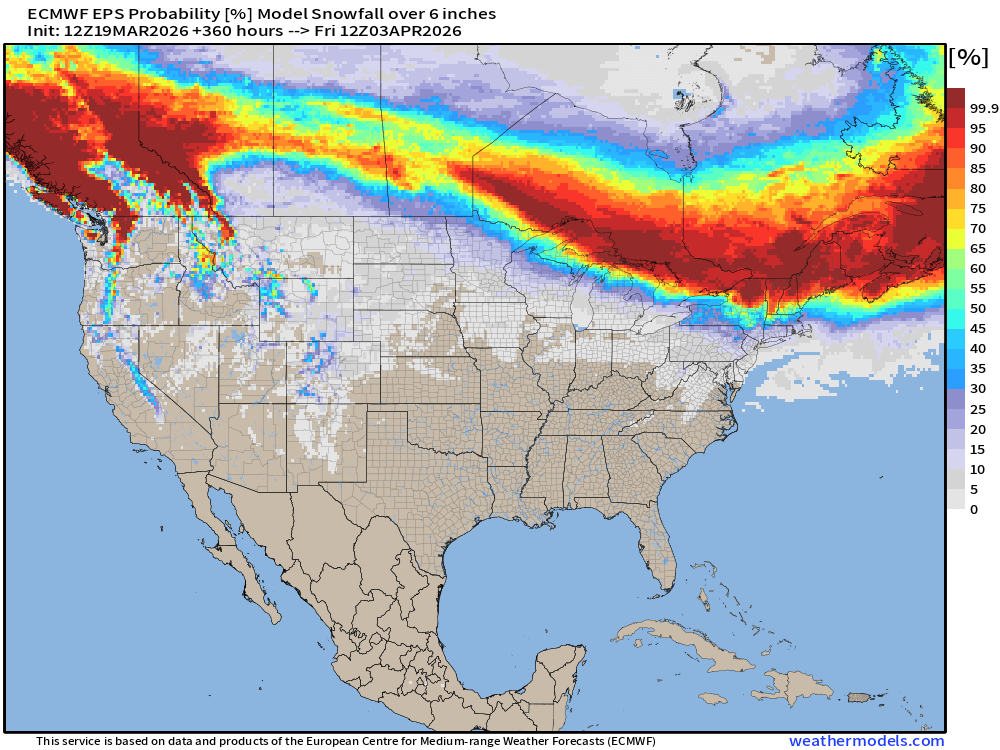
Probability of at least 6” of Snowfall Next 15-days
Temperature Anomaly | Next 15-days | ECMWF EPS 12z Ensemble Mean
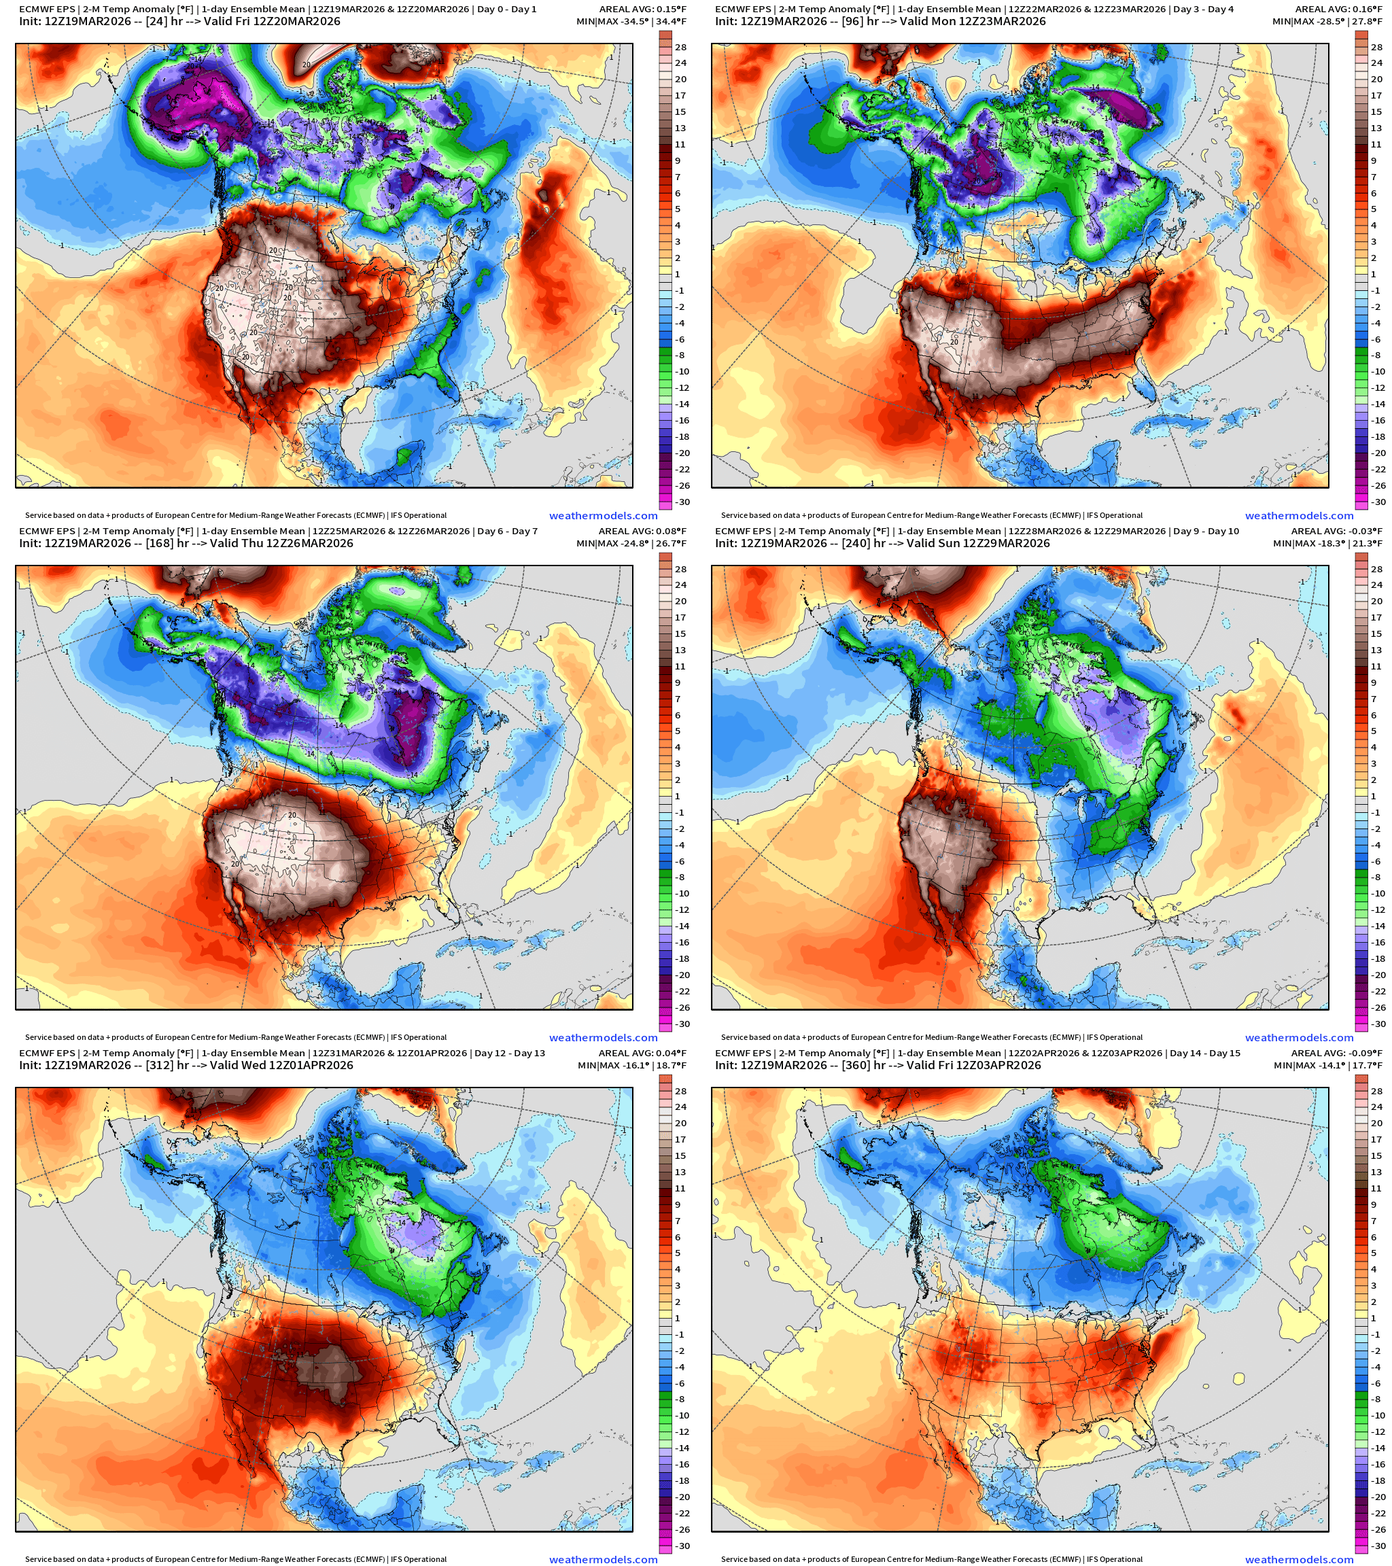
The heat dome rebuilds into middle of next week — perhaps twice reinforcing before finally breaking down. This is a long lasting ridge.
AIFS next 12-days of Height Anomaly shows the persistence of the western ridge for next 10-days … with the Canadian / Hudson Bay polar vortex continuing to spin
5-Day Chunk #1 | Temperature Anomaly | March 19 - March 23
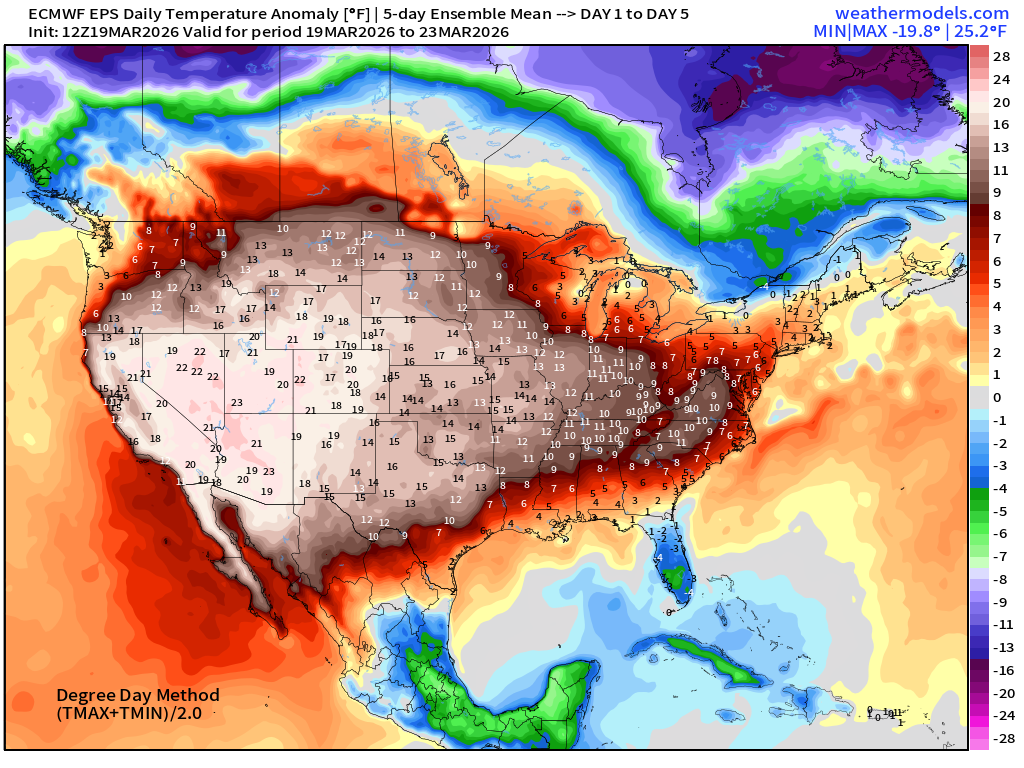
Amazing 23°F to 25°F maximum temperature anomaly for 5-days across the Western U.S.
5-Day Chunk #2 | Temperature Anomaly | March 24 - March 28
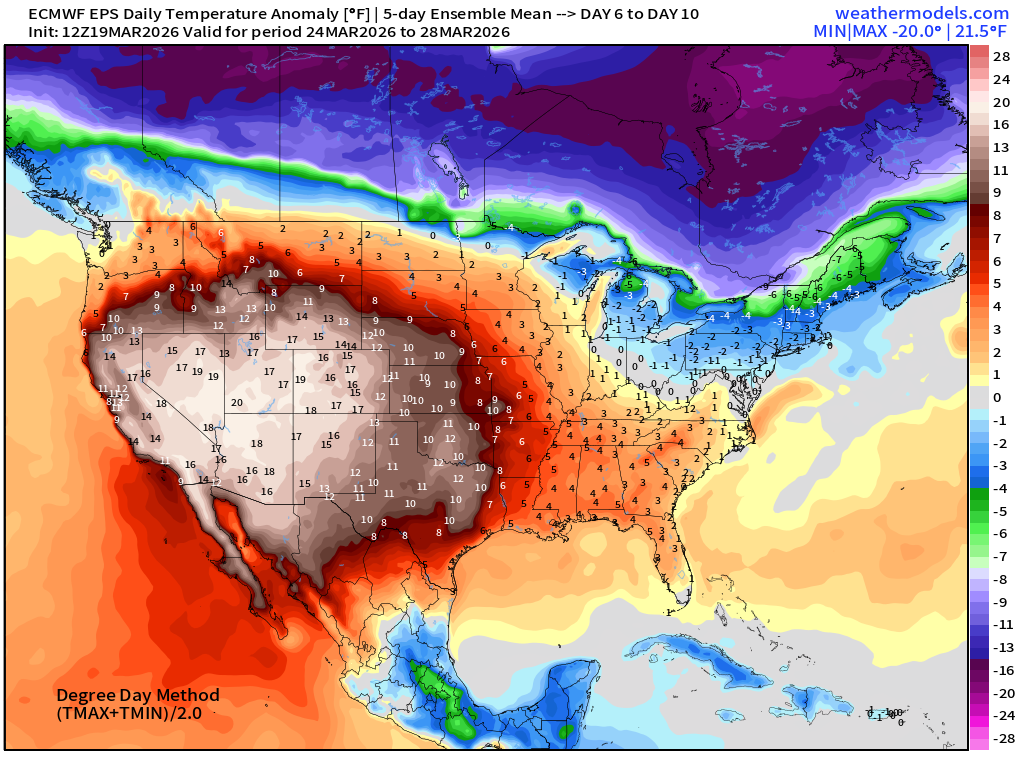
Heat dome continues into following 5-day period … but seeing some cold air trying to invade from Ontario into Lower 48.
5-Day Chunk #3 | Temperature Anomaly | March 29 - April 2
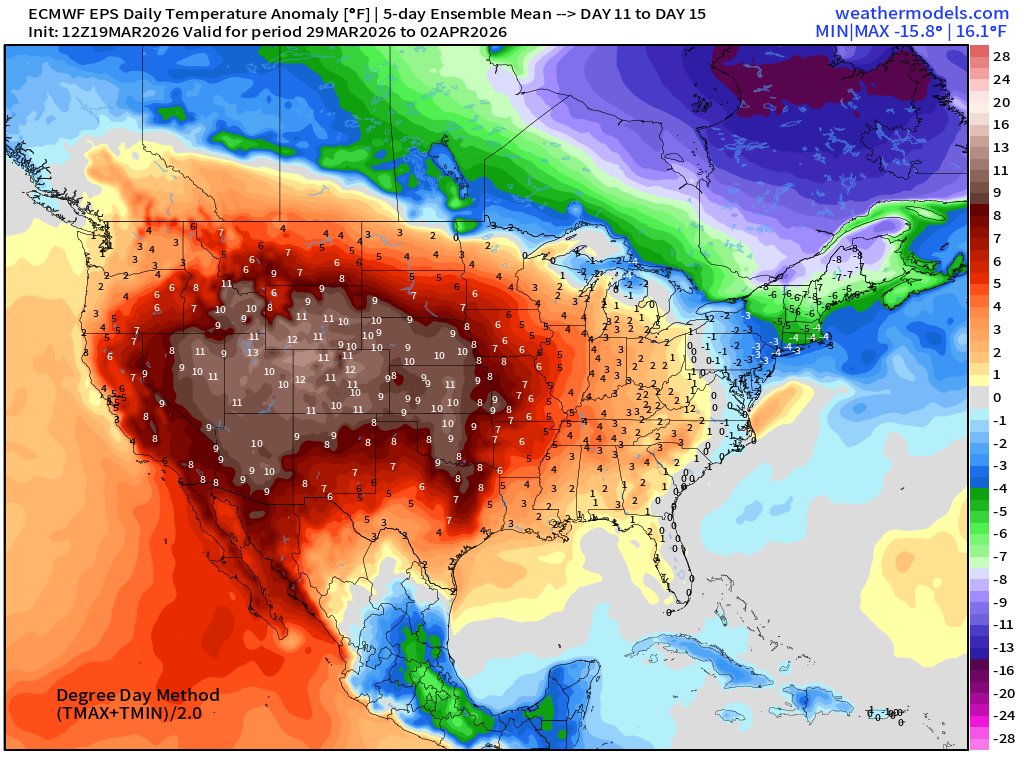
Colder than normal only in New England into early April otherwise Western U.S. much above normal.
Maps sourced from weathermodels.com designed and innovated by yours truly! Please subscribe there for real-time access to the newest maps, charts from all of the weather models including ECMWF and AIFS, and NOAA GFS/GEFS. NOAA WPC and SPC for fronts/convective outlooks.
- Milepost
- 900 · laid 2026-03-20T01:20:37.332000Z
- Source
- https://weather.substack.com/p/march-19-2026-thursday-weather-update
- Digest
- 4c60865514d3d21f3fbb2c0b944c2ef014671230eb076e61863765ec5173ea22
- Machine
- JSON