June 1, 2020 Tropical Update
Official beginning of 2020 Atlantic Hurricane Season
June 2020 was the 29th-warmest June in the 132-year national record (1895–2026), at 70.3°F against a 1991–2020 normal of 69.5°F (+0.8°F).
June 2020 was the 40th-driest June in the 132-year national record (1895–2026), at 2.7in against a 1991–2020 normal of 3.1in (-0.4in).
NOAA/NCEI Climate at a Glance, contiguous United States. This is the observed record for the month, not a score of anything said in this piece — the forecast ledger begins 2026-08-17 and cannot reach earlier posts.
The upcoming hurricane season is anticipated by most seasonal forecasting outfits to be exceptionally active. The outlook that gets the most press is from NOAA:
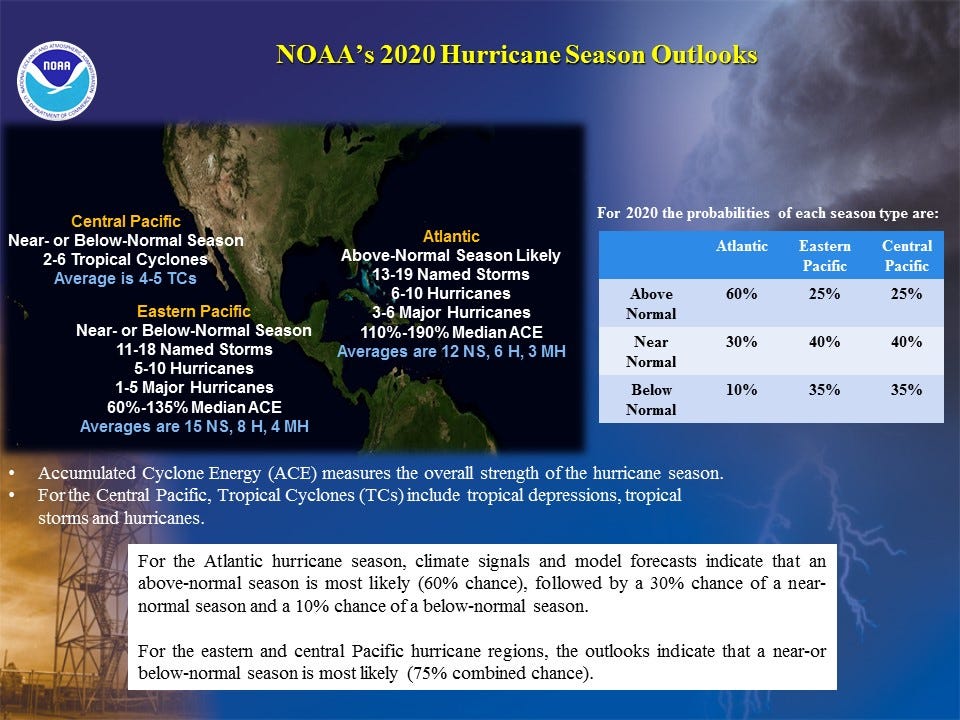
13-19 total named tropical storms (we already have had Arthur and Bertha)
6-10 hurricanes (74 mph+)
3-6 major hurricanes (111 mph+)
Since 1995, the North Atlantic has been in an “active phase” with considerably more hurricanes than in the 25-year prior.
Ocean temperatures of the sea-surface (SST) are warm enough (> 26°C) for tropical storm development in the Gulf of Mexico. For stronger hurricanes, we look for a bit warmer water like 28°C.

SST valid for May 27, 2020 from weathermodels
Remnants of Amanda
Tropical Storm Amanda made landfall earlier on Sunday (May 31) into Guatemala and the center of circulation remains embedded within a larger “Caribbean gyre”. The remnants of Amanda will move into the southeastern Bay of Campeche on Monday and conditions appear conducive for development. The storm would get a new name from the Atlantic list in this case.
Week ahead
A challenging forecast ahead as we currently do not have a handle on the location of the new area of low pressure in the southern Gulf of Mexico.
The European Ensemble system run 4-times per day continues to show about a 50/50 chance of a tropical storm or hurricane by the end of the week. More than a few of the ensemble members show a powerful hurricane — hopefully that doesn’t happen.
My favorite way to visualize a variable within the context of climatology is to use the “normalized anomaly” framework. 50-ensembles at the same time in the panel charts below show the high uncertainty or variability in the forecast. Your eyeball can tell you a lot from effectively displayed weather model maps. These are from https://weathermodels.com (Subscription).


Update schedule:
Lunch hour to discuss the 11 AM NHC Tropical Weather Outlook and satellite imagery. And, then after 5 pm EDT to discuss the new model suite including ECMWF & EPS 12z. I really don’t put much effort into other modeling systems until there is a named Depression.
Update: This system has been designated as Invest 93L
- Milepost
- 9 · laid 2020-06-01T03:41:06.617000Z
- Source
- https://weather.substack.com/p/june-1-2020-tropical-update
- Digest
- 87119e368da73622c8ed59d7a03b5ff243fe4d376a058419af2730d838cd7f4d
- Machine
- JSON