March 18, 2026 Wednesday Weather Update
Western US Heat Dome will bring record heat typical of summer
March 2026 was the warmest March in the 132-year national record (1895–2026), at 50.8°F against a 1991–2020 normal of 43.6°F (+7.3°F).
March 2026 was the 8th-driest March in the 132-year national record (1895–2026), at 1.8in against a 1991–2020 normal of 2.5in (-0.7in).
NOAA/NCEI Climate at a Glance, contiguous United States. This is the observed record for the month, not a score of anything said in this piece — the forecast ledger begins 2026-08-17 and cannot reach earlier posts.

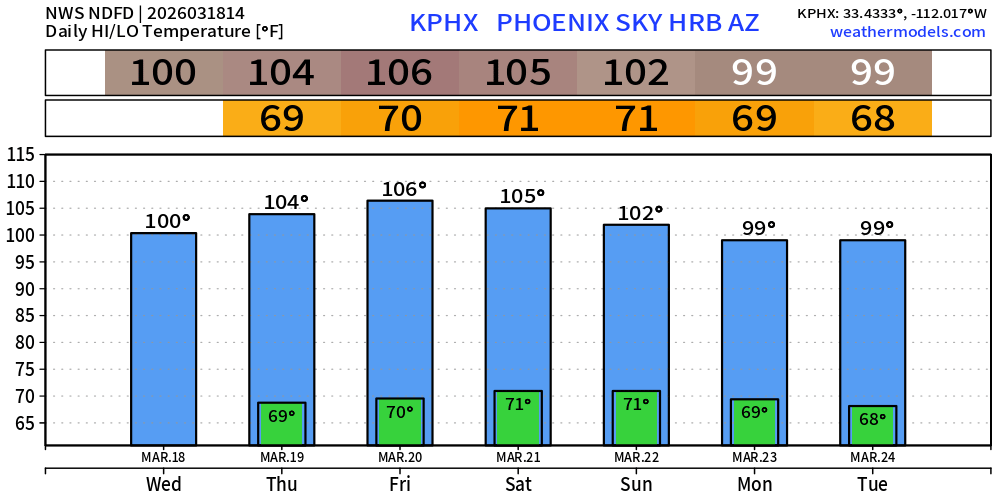
NWS forecasts take Phoenix up to 106°F on Friday, March 20th — when Spring arrives later in the day. For context, this 106°F would set every record high until May 2nd when 107°F was reached back in 1947.
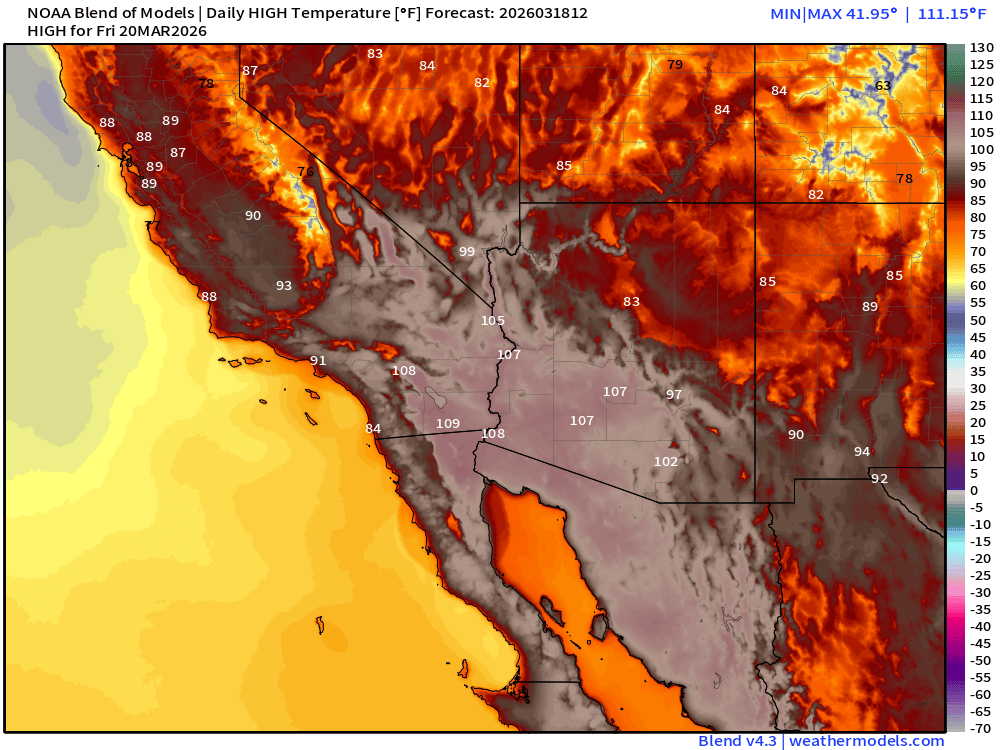
The U.S. Southwest will be well into the 100s … a map typical of June not March.
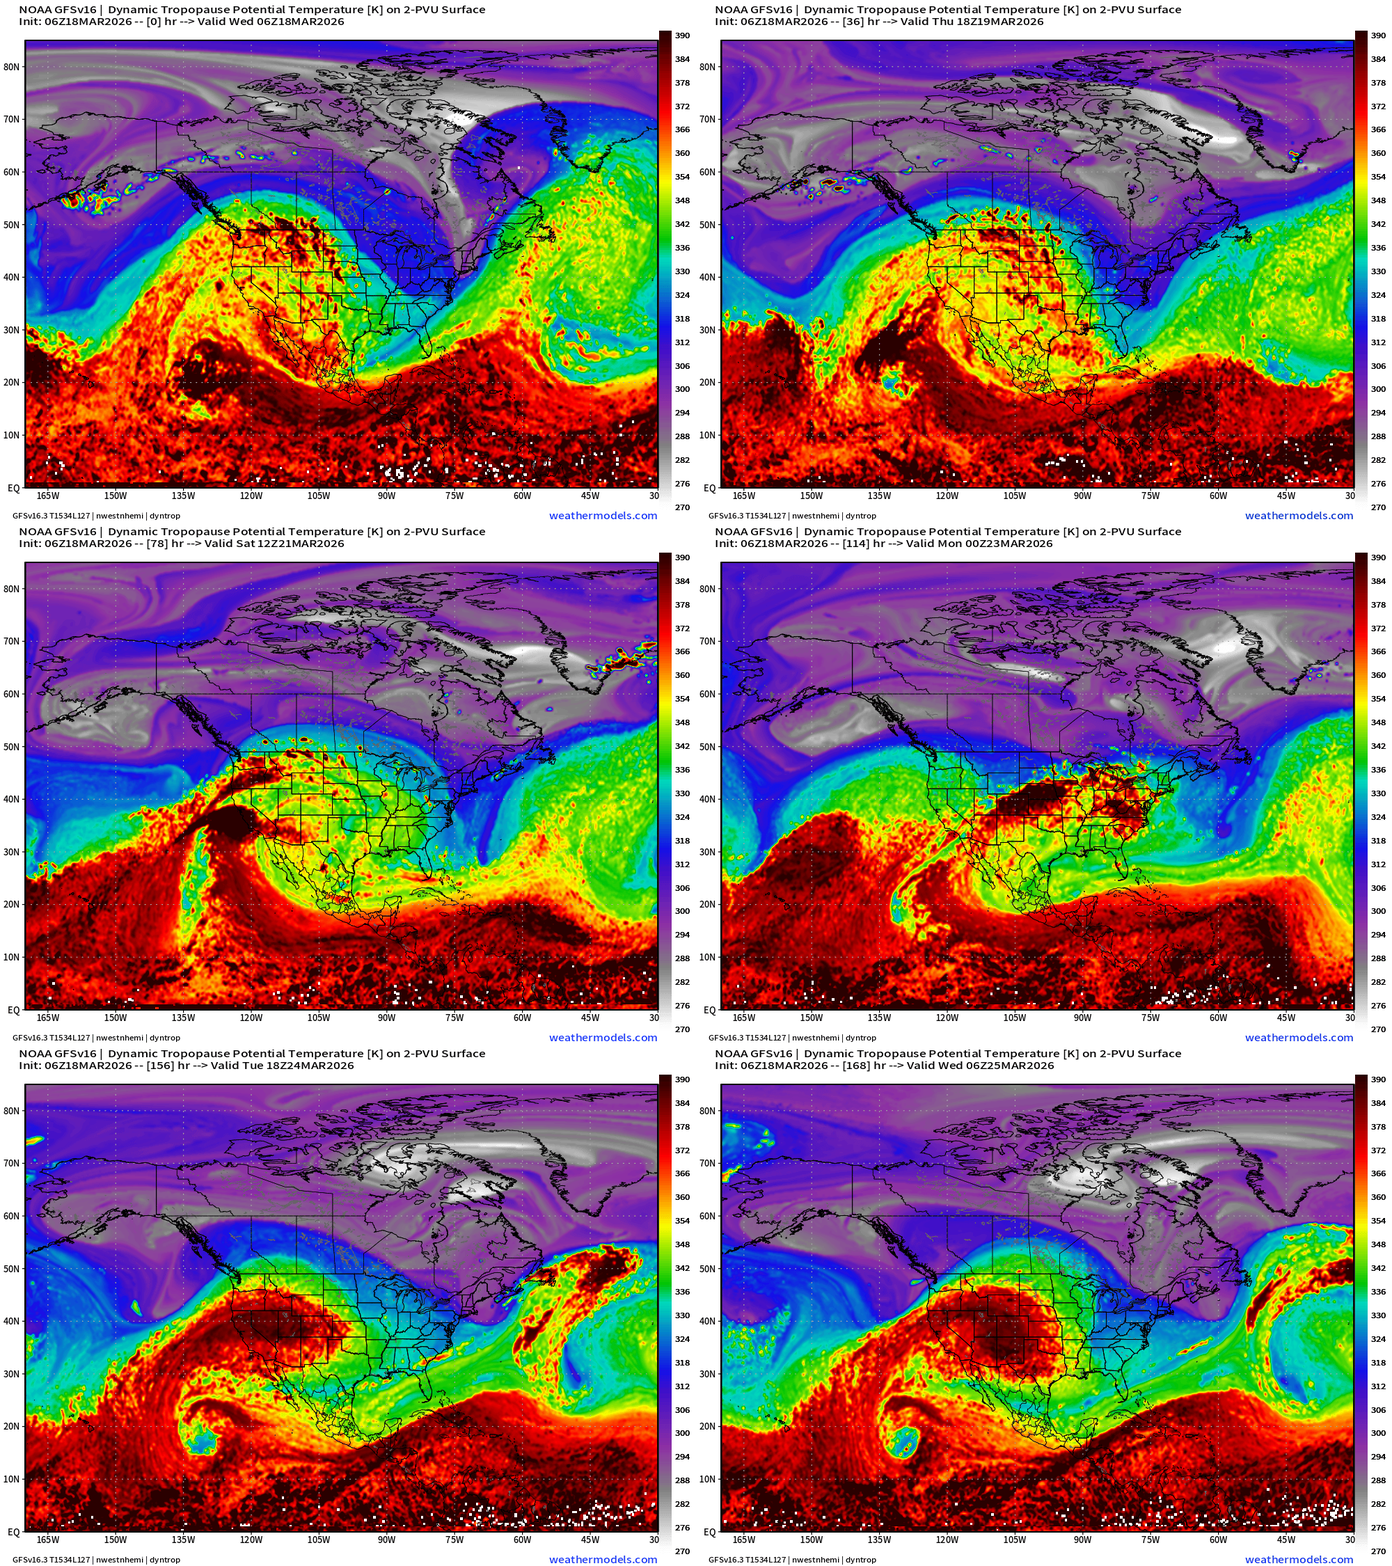
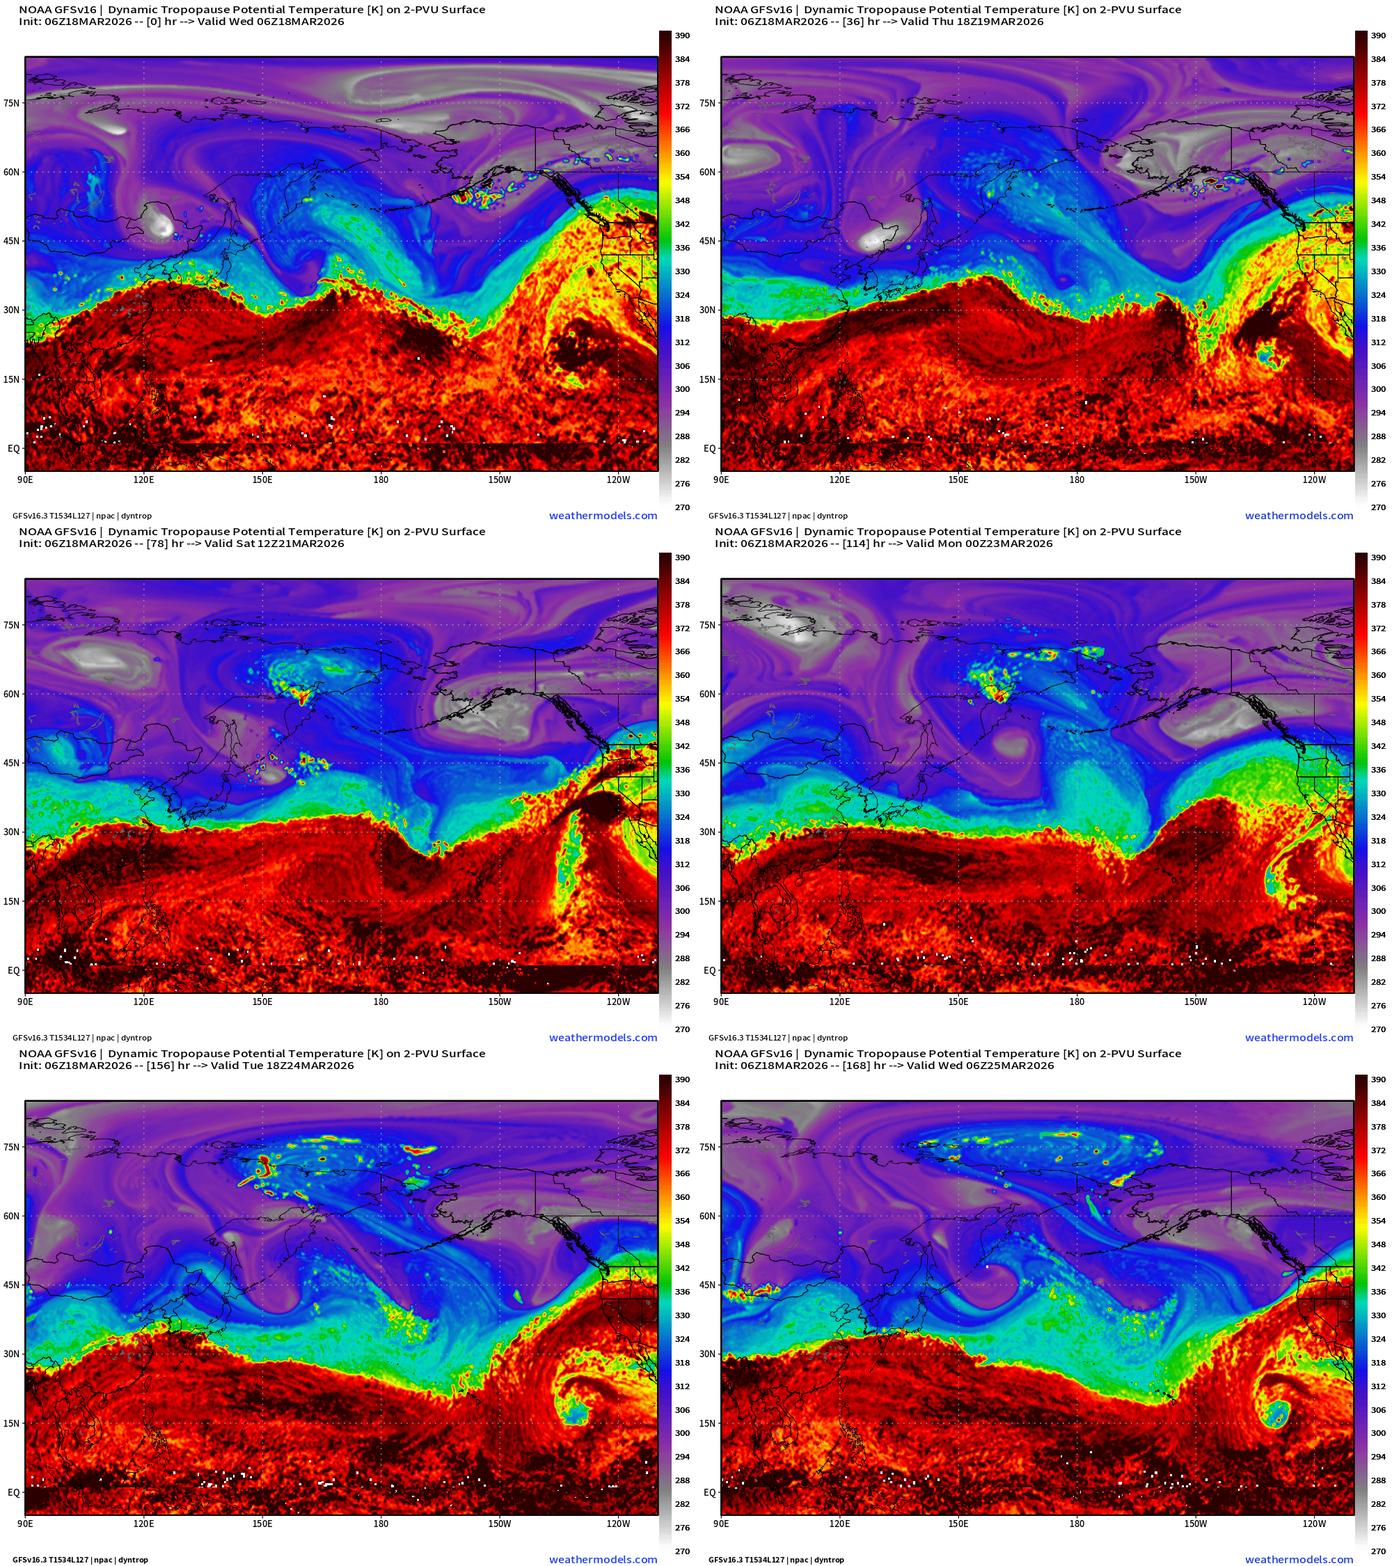
The Upper-Level Pattern (dynamic tropopause) shows the “ridge” or heat dome toppling over clockwise out of the Pacific Ocean east of Hawaii across the western U.S.
The thermal ridging is part of a larger scale pattern upstream — blocking over the North Pacific — that is all connected.
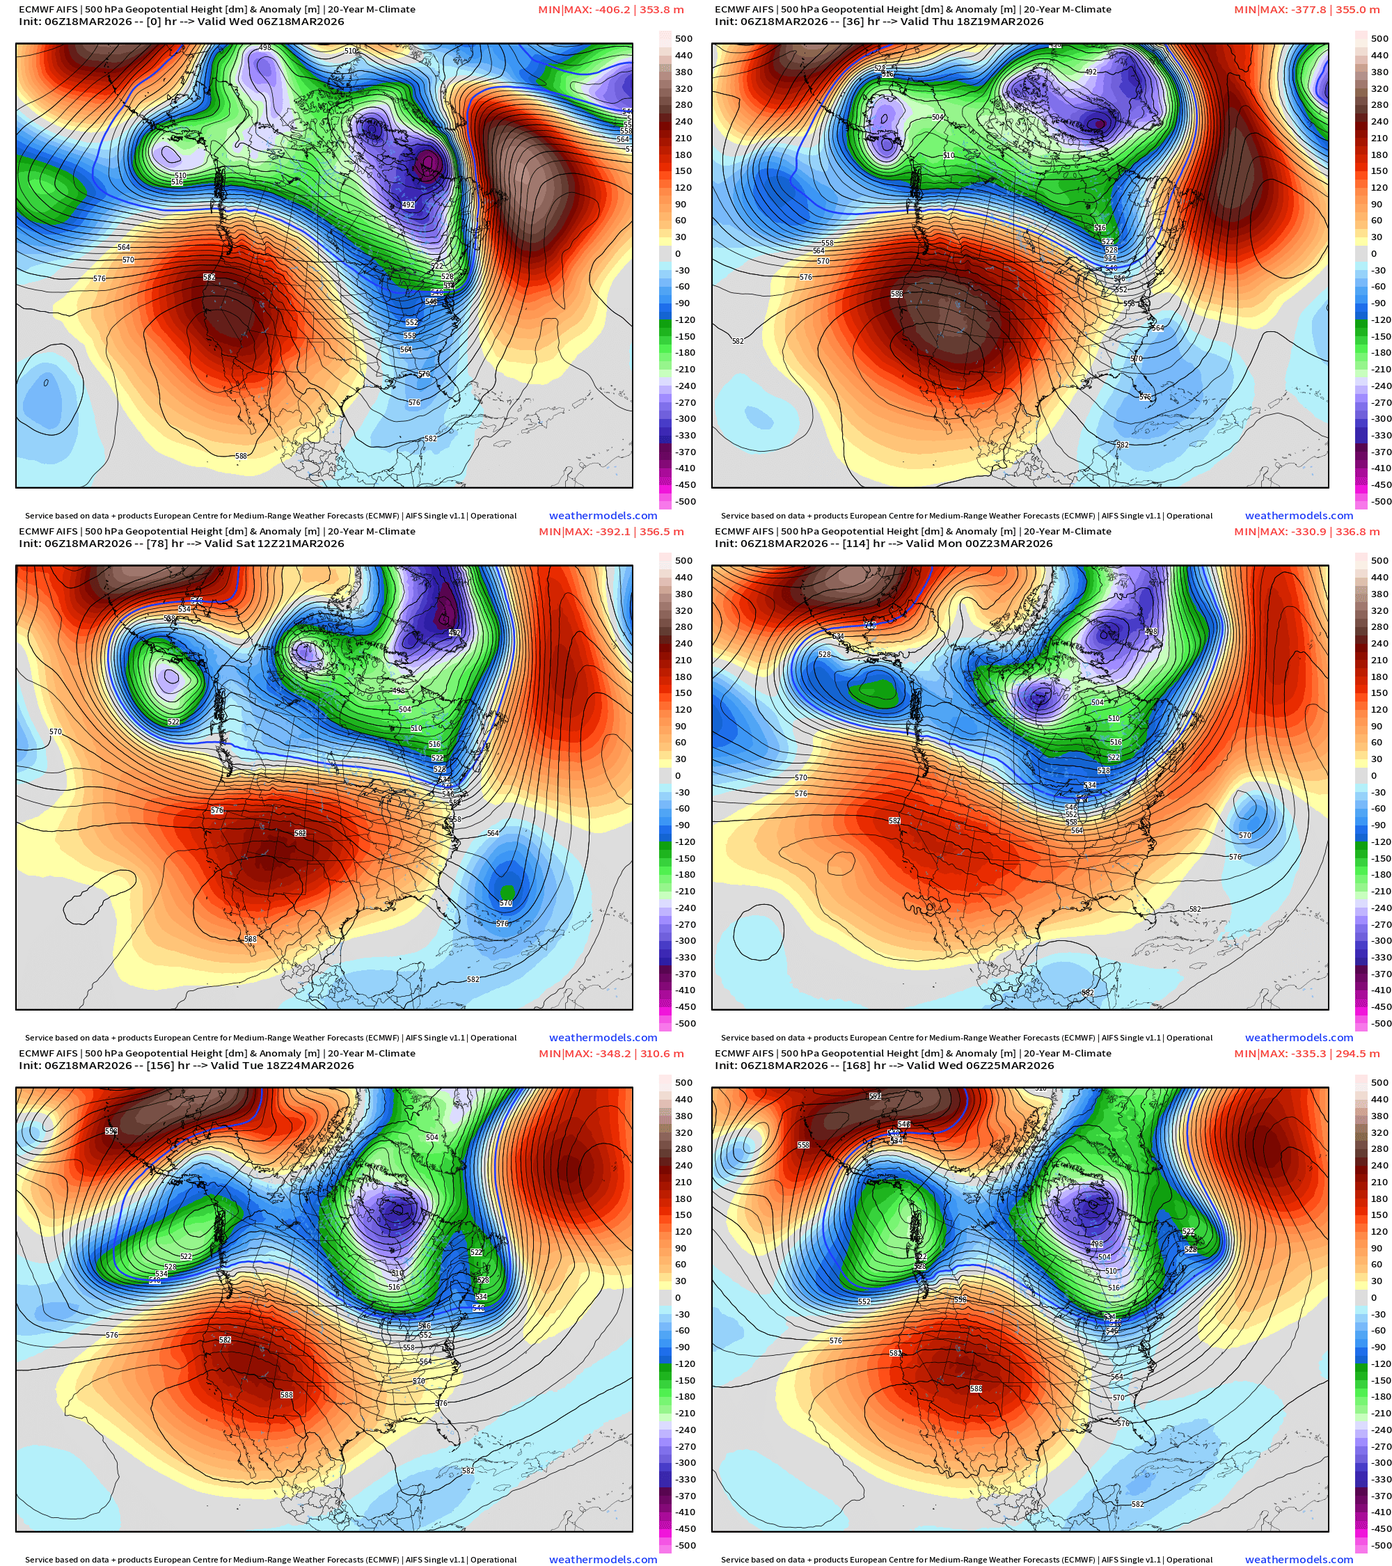
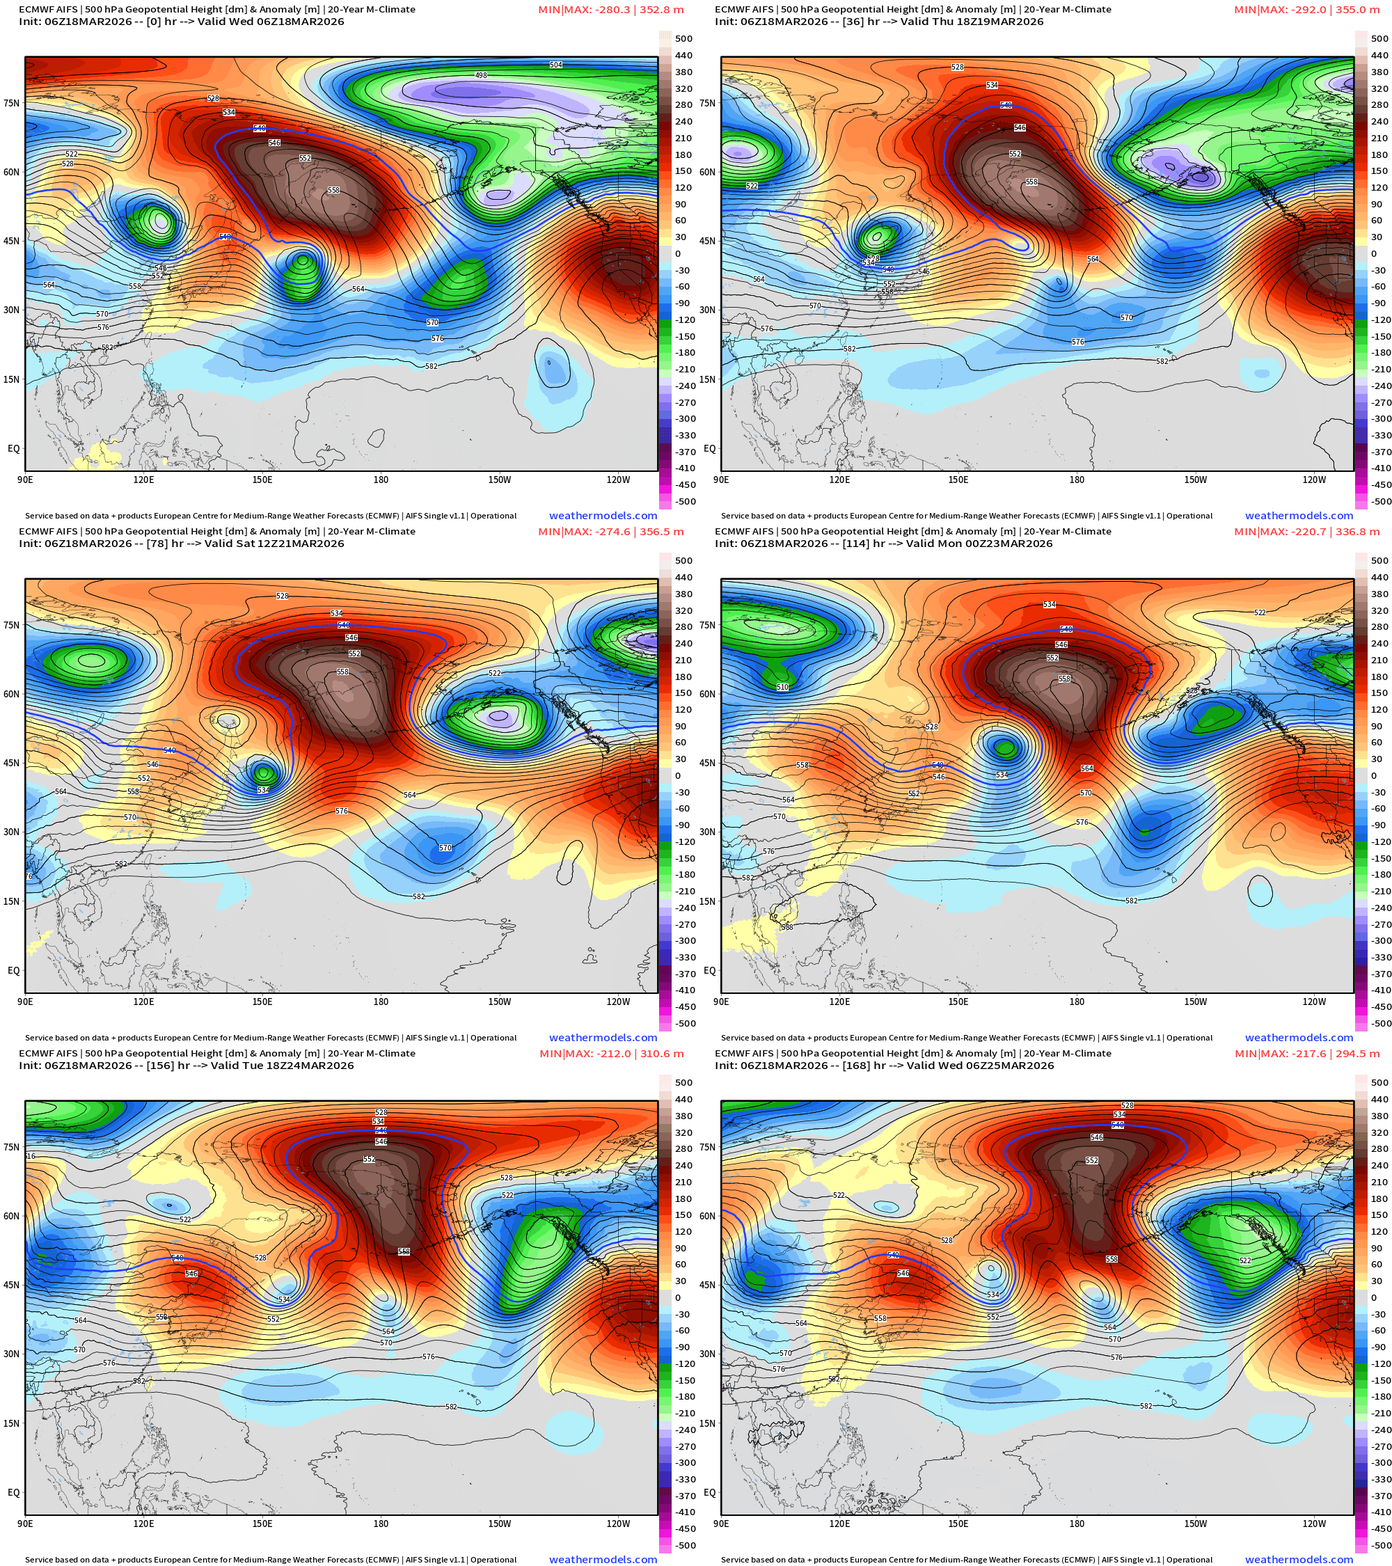
The 500 mb height anomaly map shows the huge (+) anomaly centered on the Four Corners … in July, this pattern would crush all-time records for many locations including Phoenix. Note, the polar vortex over Canada continues “chilling” with very cold air at low to mid-levels especially over Alaska.
Zooming out to look at the dynamic tropopause over the North Pacific: downstream Rossby waves are radiating out of the far Western Pacific warm pool where convection (and Tropical Cyclone 27P Narelle) is firing over very warm SSTs. The entire pattern is originally forced out of the Pacific supplying energy to the jet stream … but the Arctic polar vortex is still very intense and shunting the jet stream southward from its climatological location. The interaction between the jet stream and the strong polar vortex constructs a blocking ridge over the farthest reaches of the North Pacific.
The height anomaly map best shows the persistent blocking over the North Pacific with the 540 meter line crossing to 80°N in the Arctic. The lobes of the “omega” block are where extreme weather can occur in terms of troughs like the “Kona Low” over Hawaii in recent days.
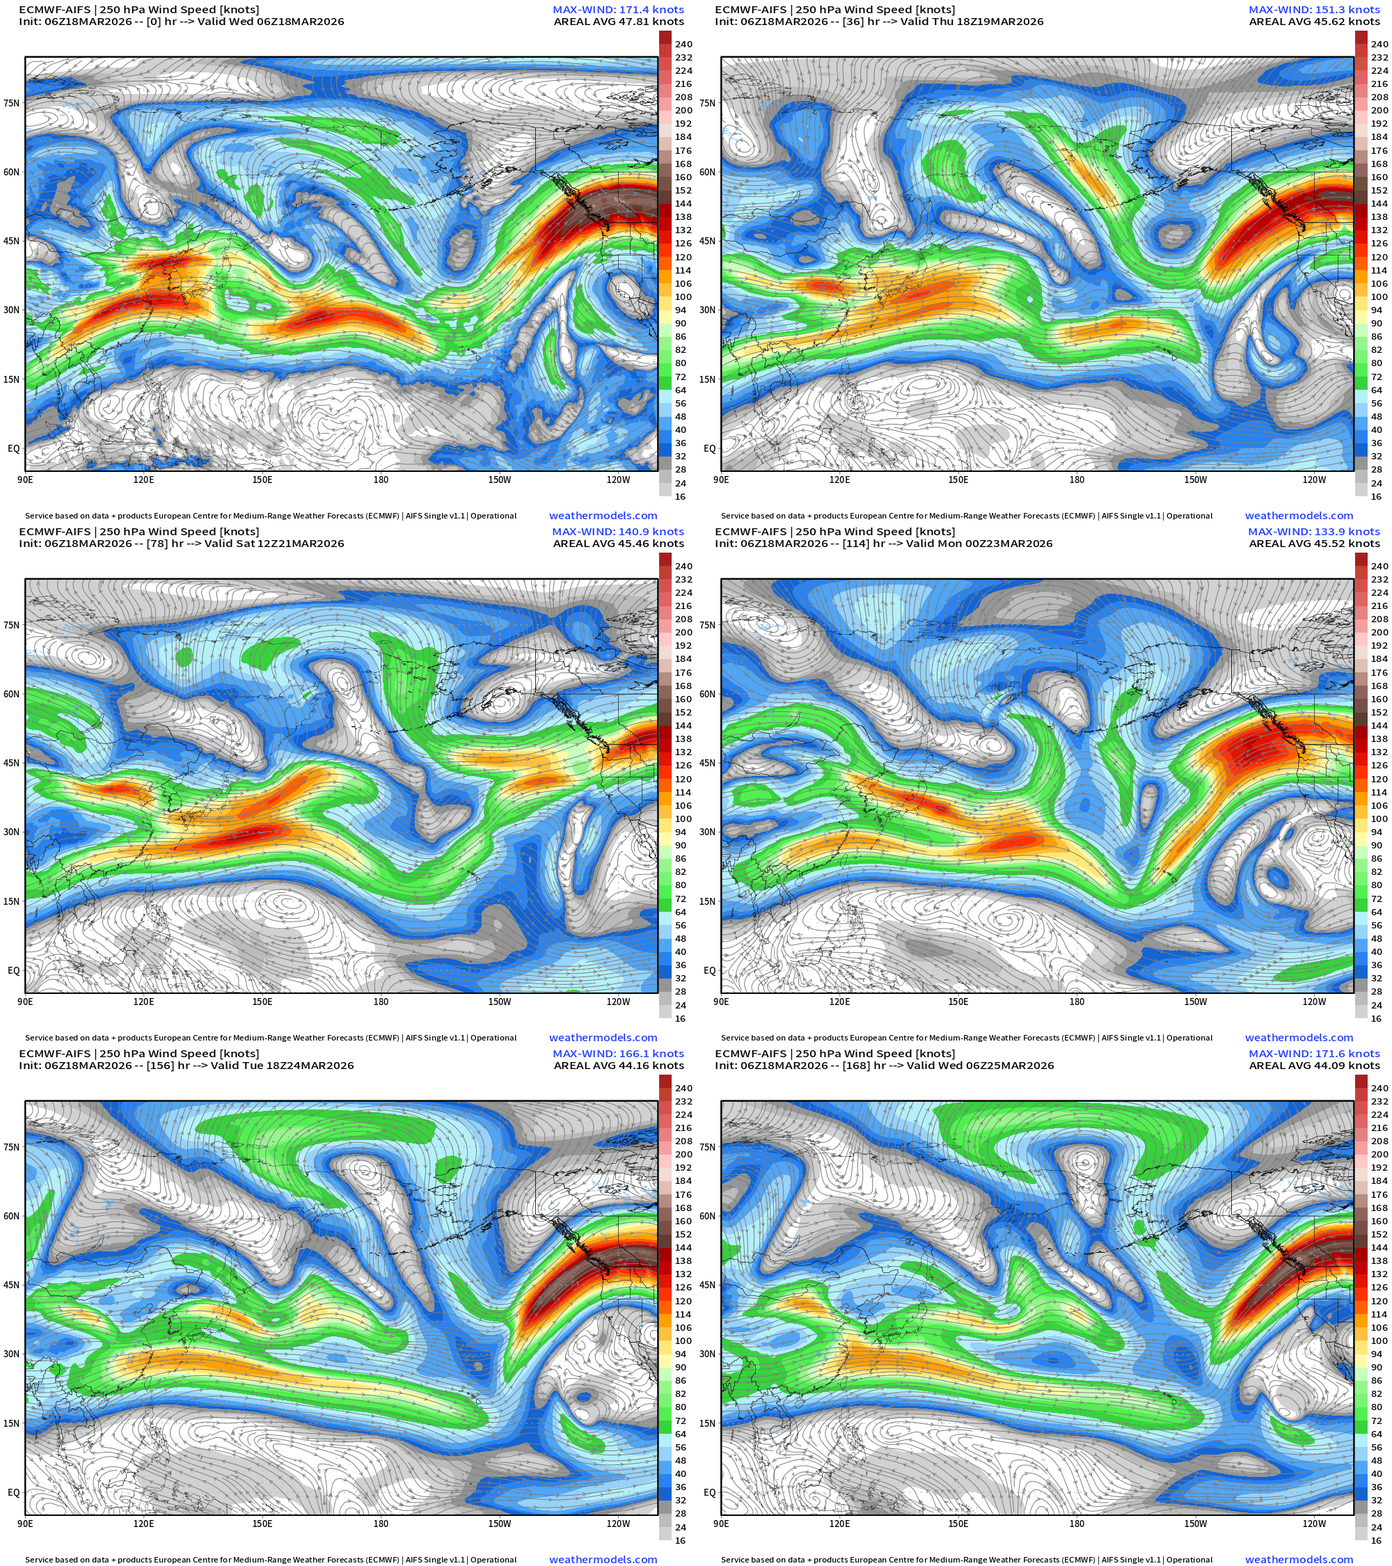
The puzzle makes more sense when you can visualize all of the pieces.
Origin: convection from heat source in Western Pacific and Maritime Indian Ocean continent fuels the jet stream and spurs Rossby waves downstream
The polar vortex (mid-level cold pool) remains intense for mid-March and battles back with cut-off troughs descending equatorward. The interplay creates the weather we experience near the surface.
Jet Stream next 6-days shows a weaker than normal / diffuse North Pacific jet stream with Rossby wave breaking evident near Hawaii (troughing), and then the downstream half-wavelength we get a massive “heat dome” ridge on the downstream side of Alaska polar vortex anomaly.
Blend of Models Temperatures | Highs through Thursday, March 26
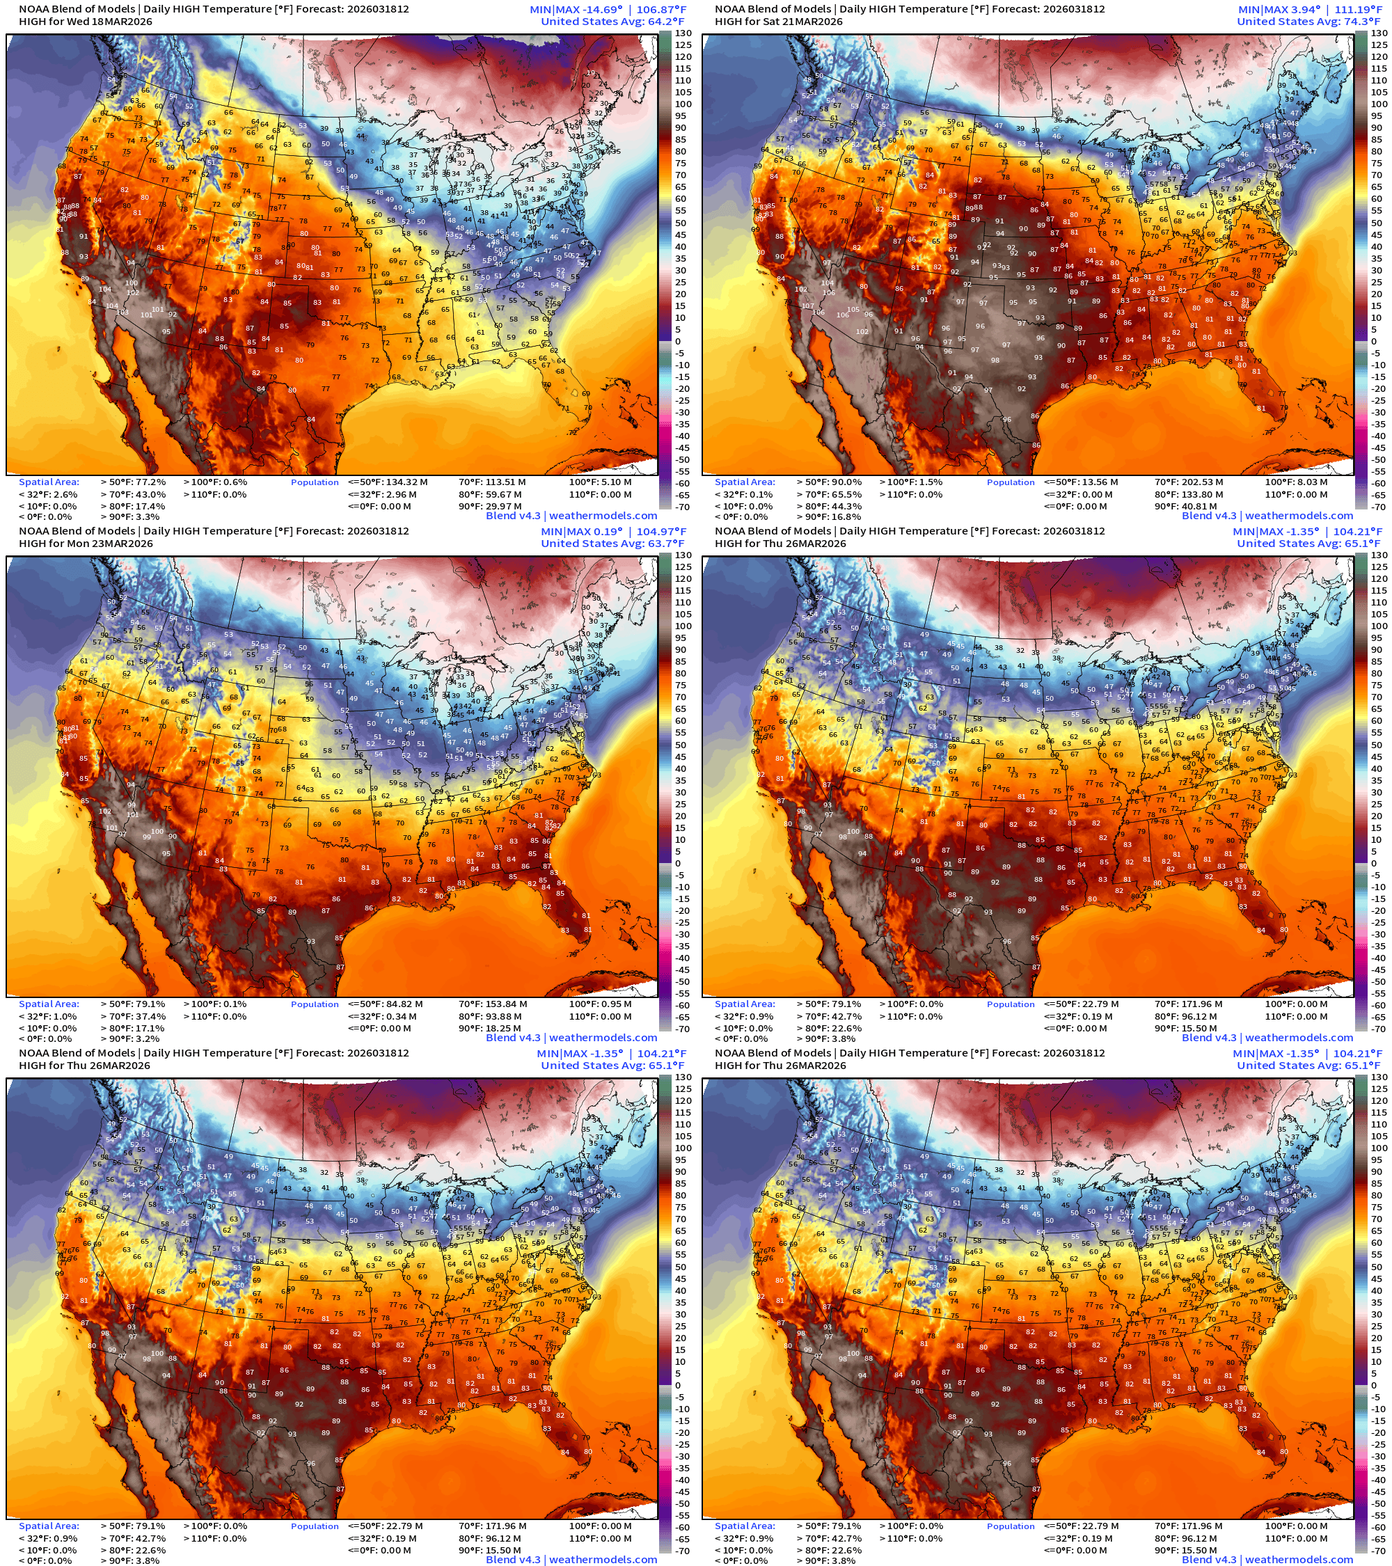
The Lower 48 moderates nicely in the coming 7-days with only a minor return of colder air next Tuesday across the Great Lakes and Northeast.
It’s going to be extremely hot in the Southwest and that Heat Dome bleeds eastward across the Rockies into the Plains and Texas with 90s.
Blend of Models Temperatures | Lows through Thursday, March 26th
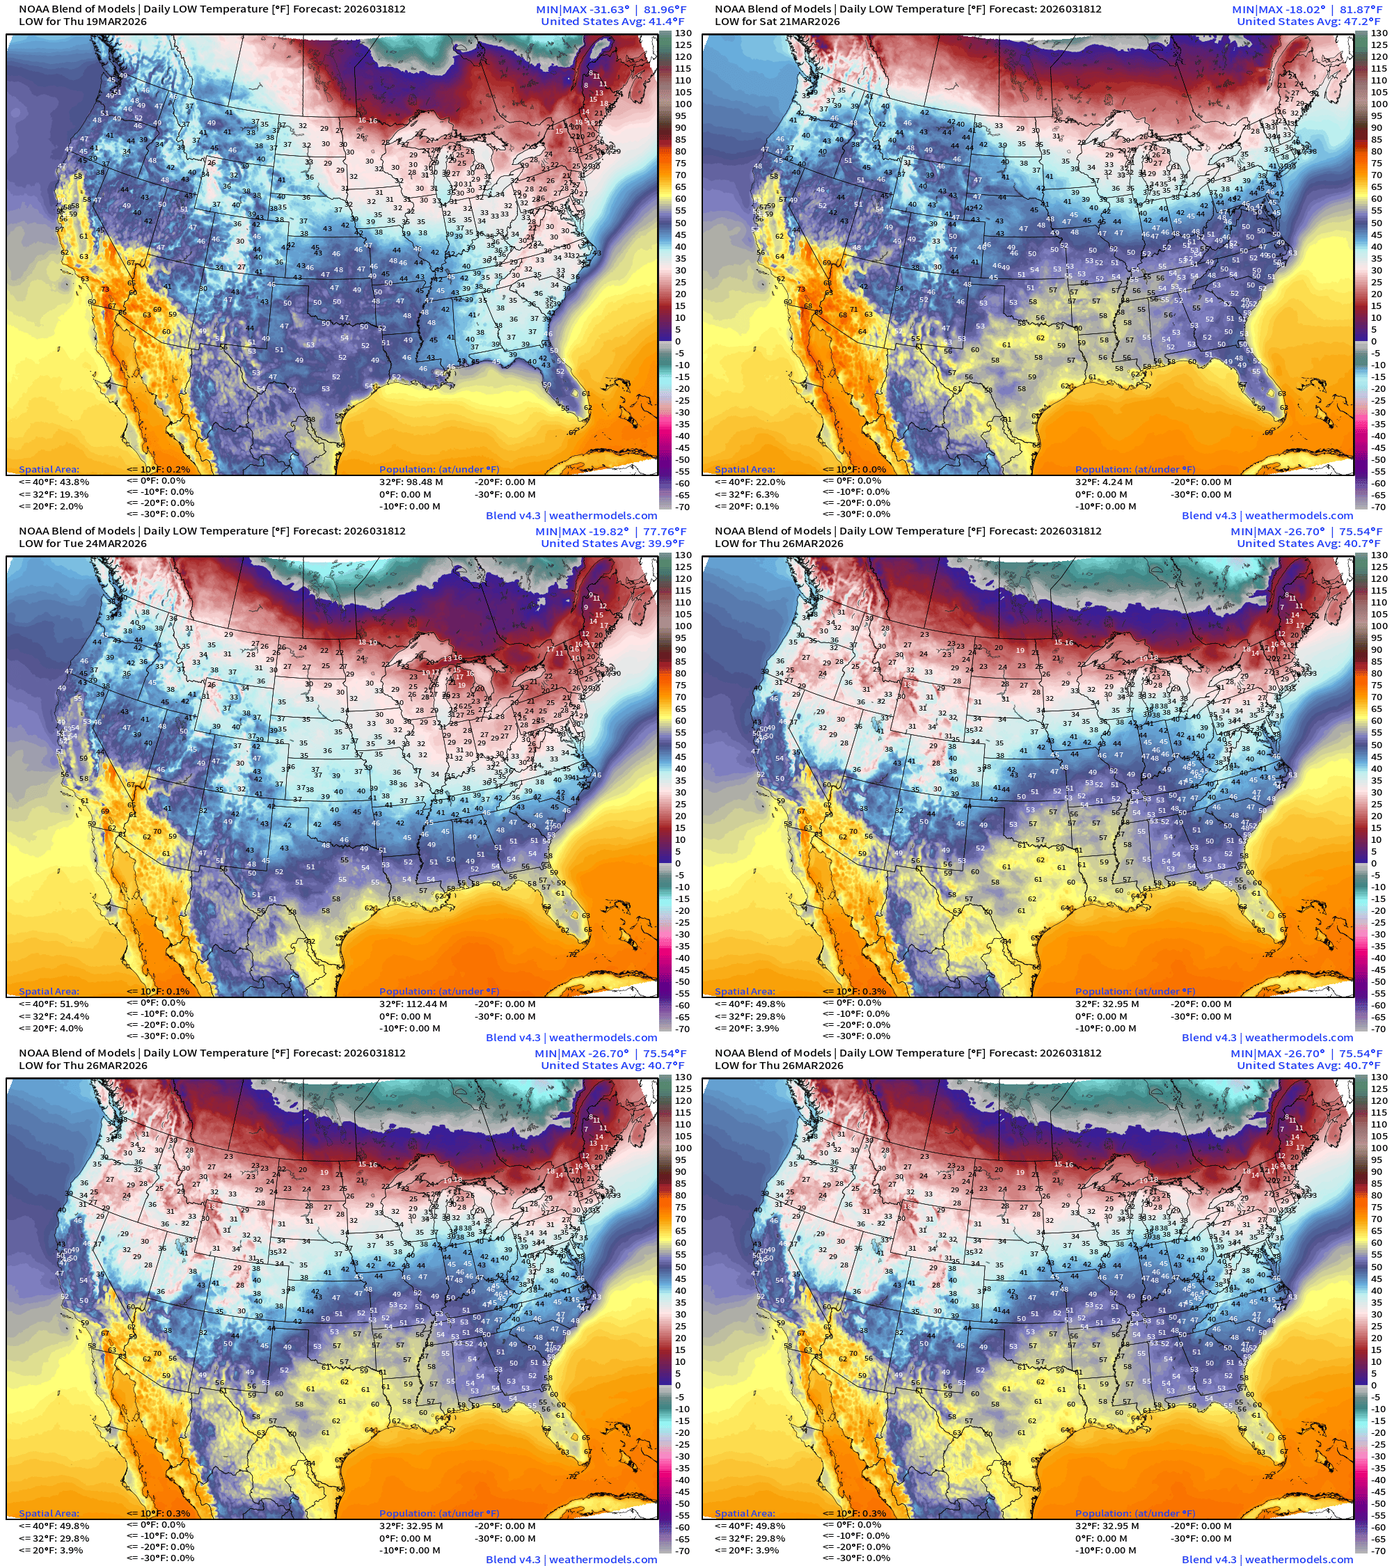
Hopefully done with the “hard freezes” across the Southeast so I can plant some flowers and start Spring on schedule here in Atlanta.
Blend of Models | Total Snowfall Next 10-Days
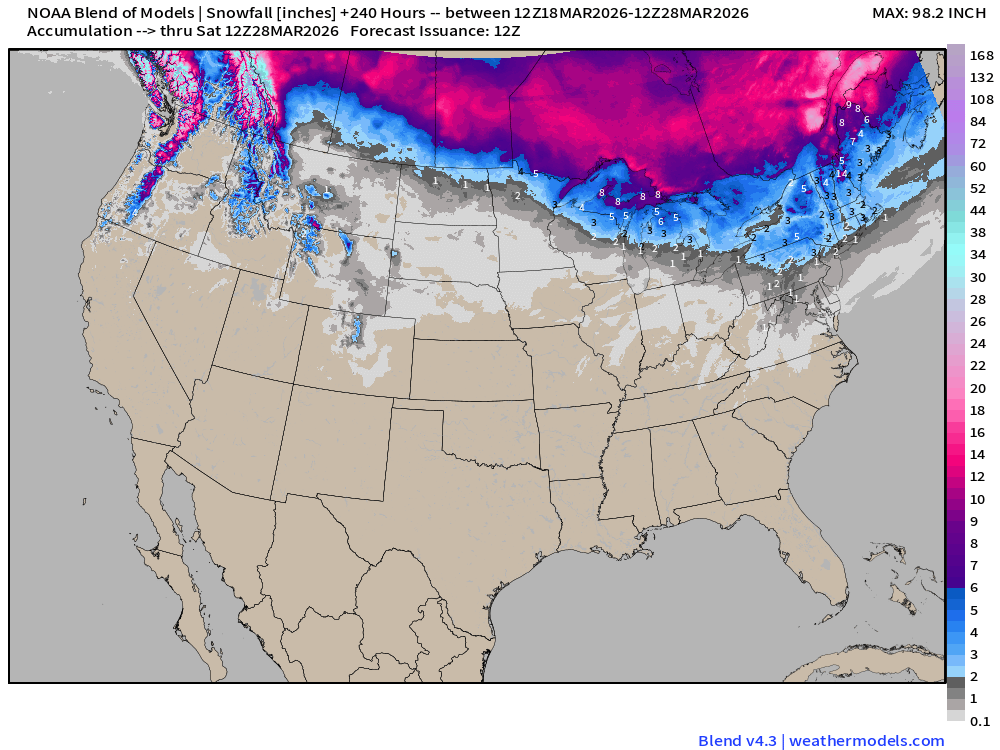
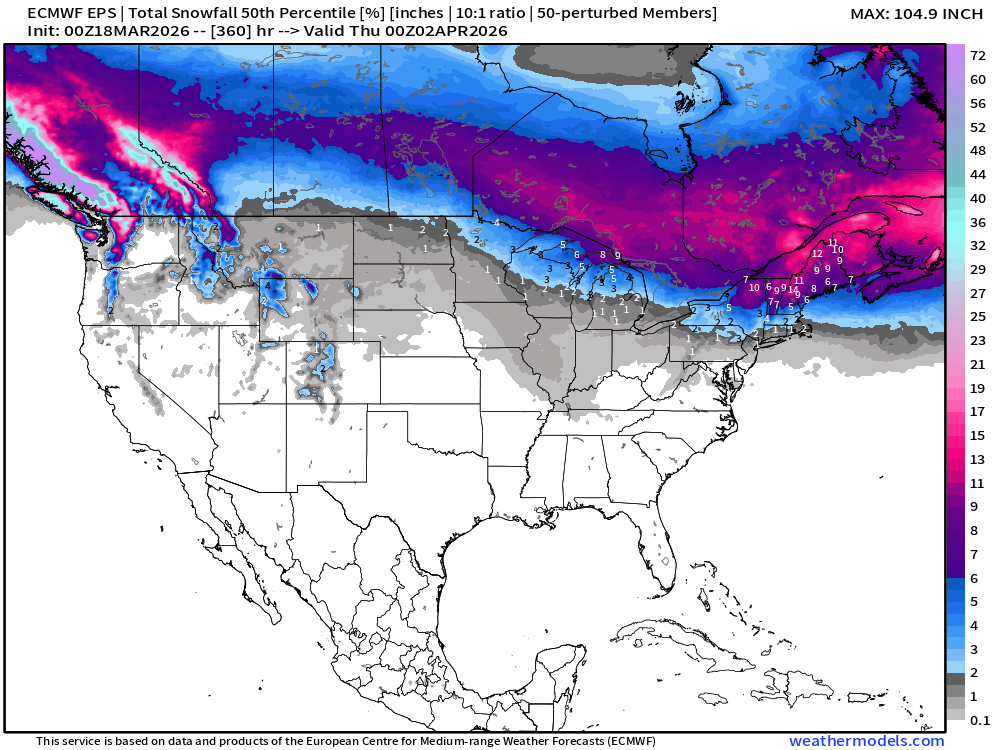
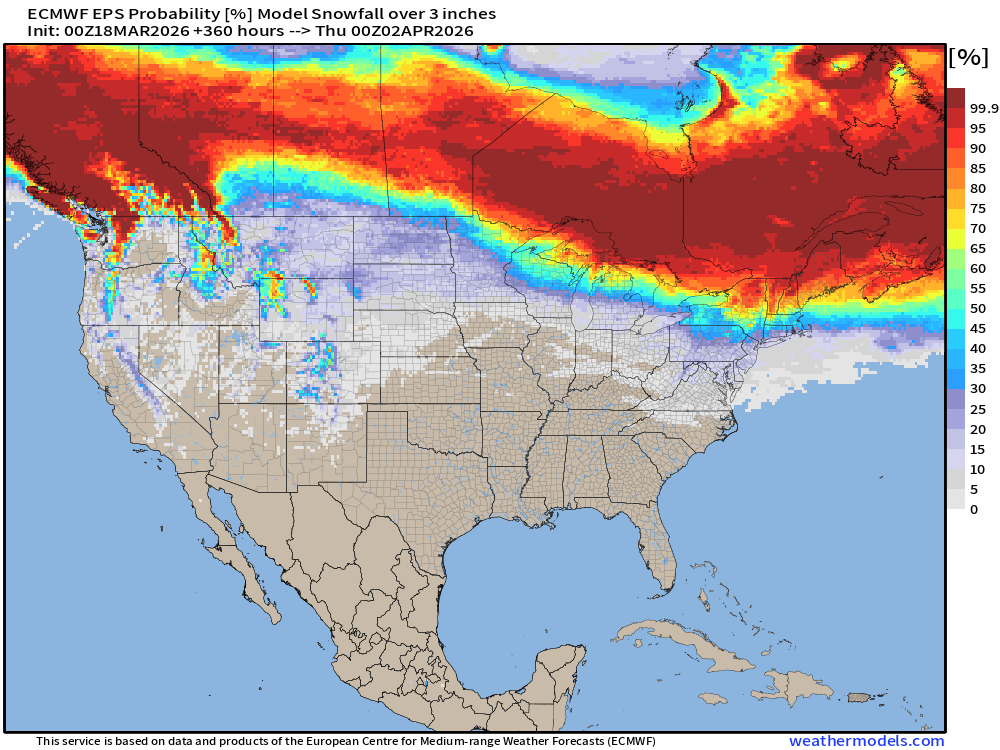
Still threat of snowfall along the Canadian border of the Lower 48 … but we’re trending in the right direction with minimal chance of a major storm … instead Clipper Systems with just enough cold air on their backside to provide brief snowfalls.
Blend of Models | 10-Days Precipitation Total
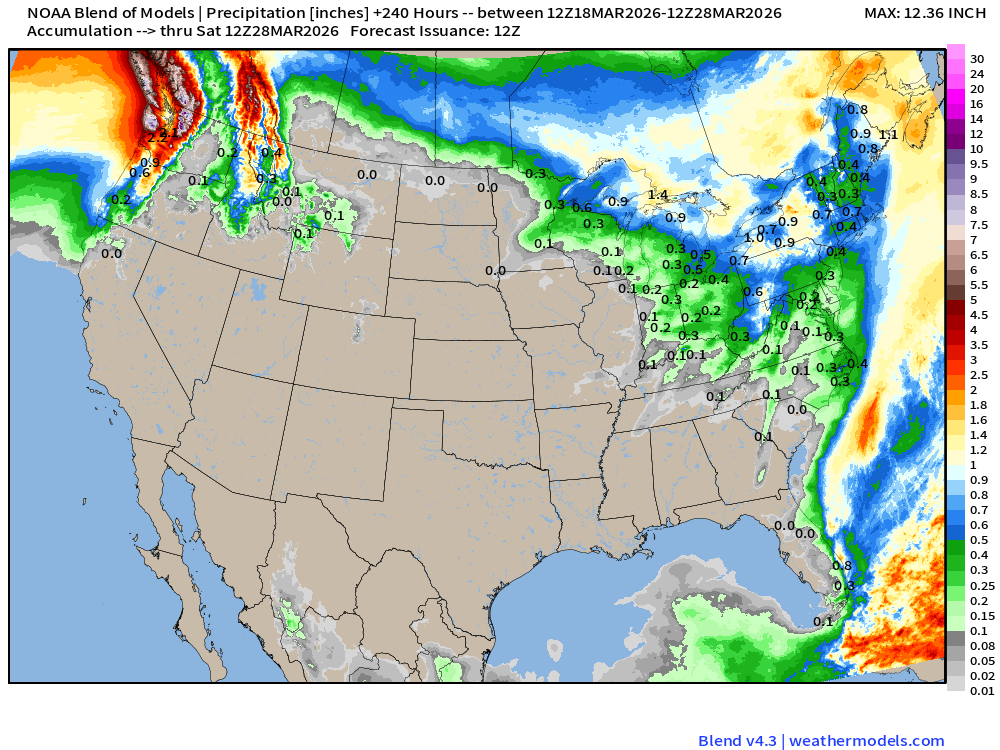
The heat dome / ridging pattern across the Western U.S. is sufficiently large and stretches eastward shutting down the moisture feed out of the Gulf of Mexico — very dry for the next 10-days across much of the Lower 48! That would mean little to none severe weather threat into end of March with this upper-level pattern.
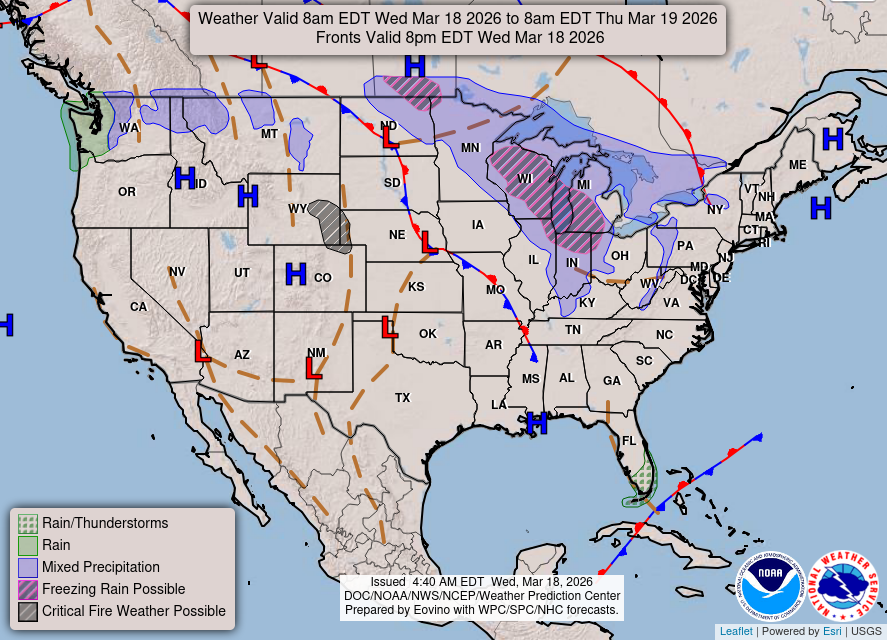
Today’s Weather — just a weak Clipper System bringing some light snow showers or mixed precipitation
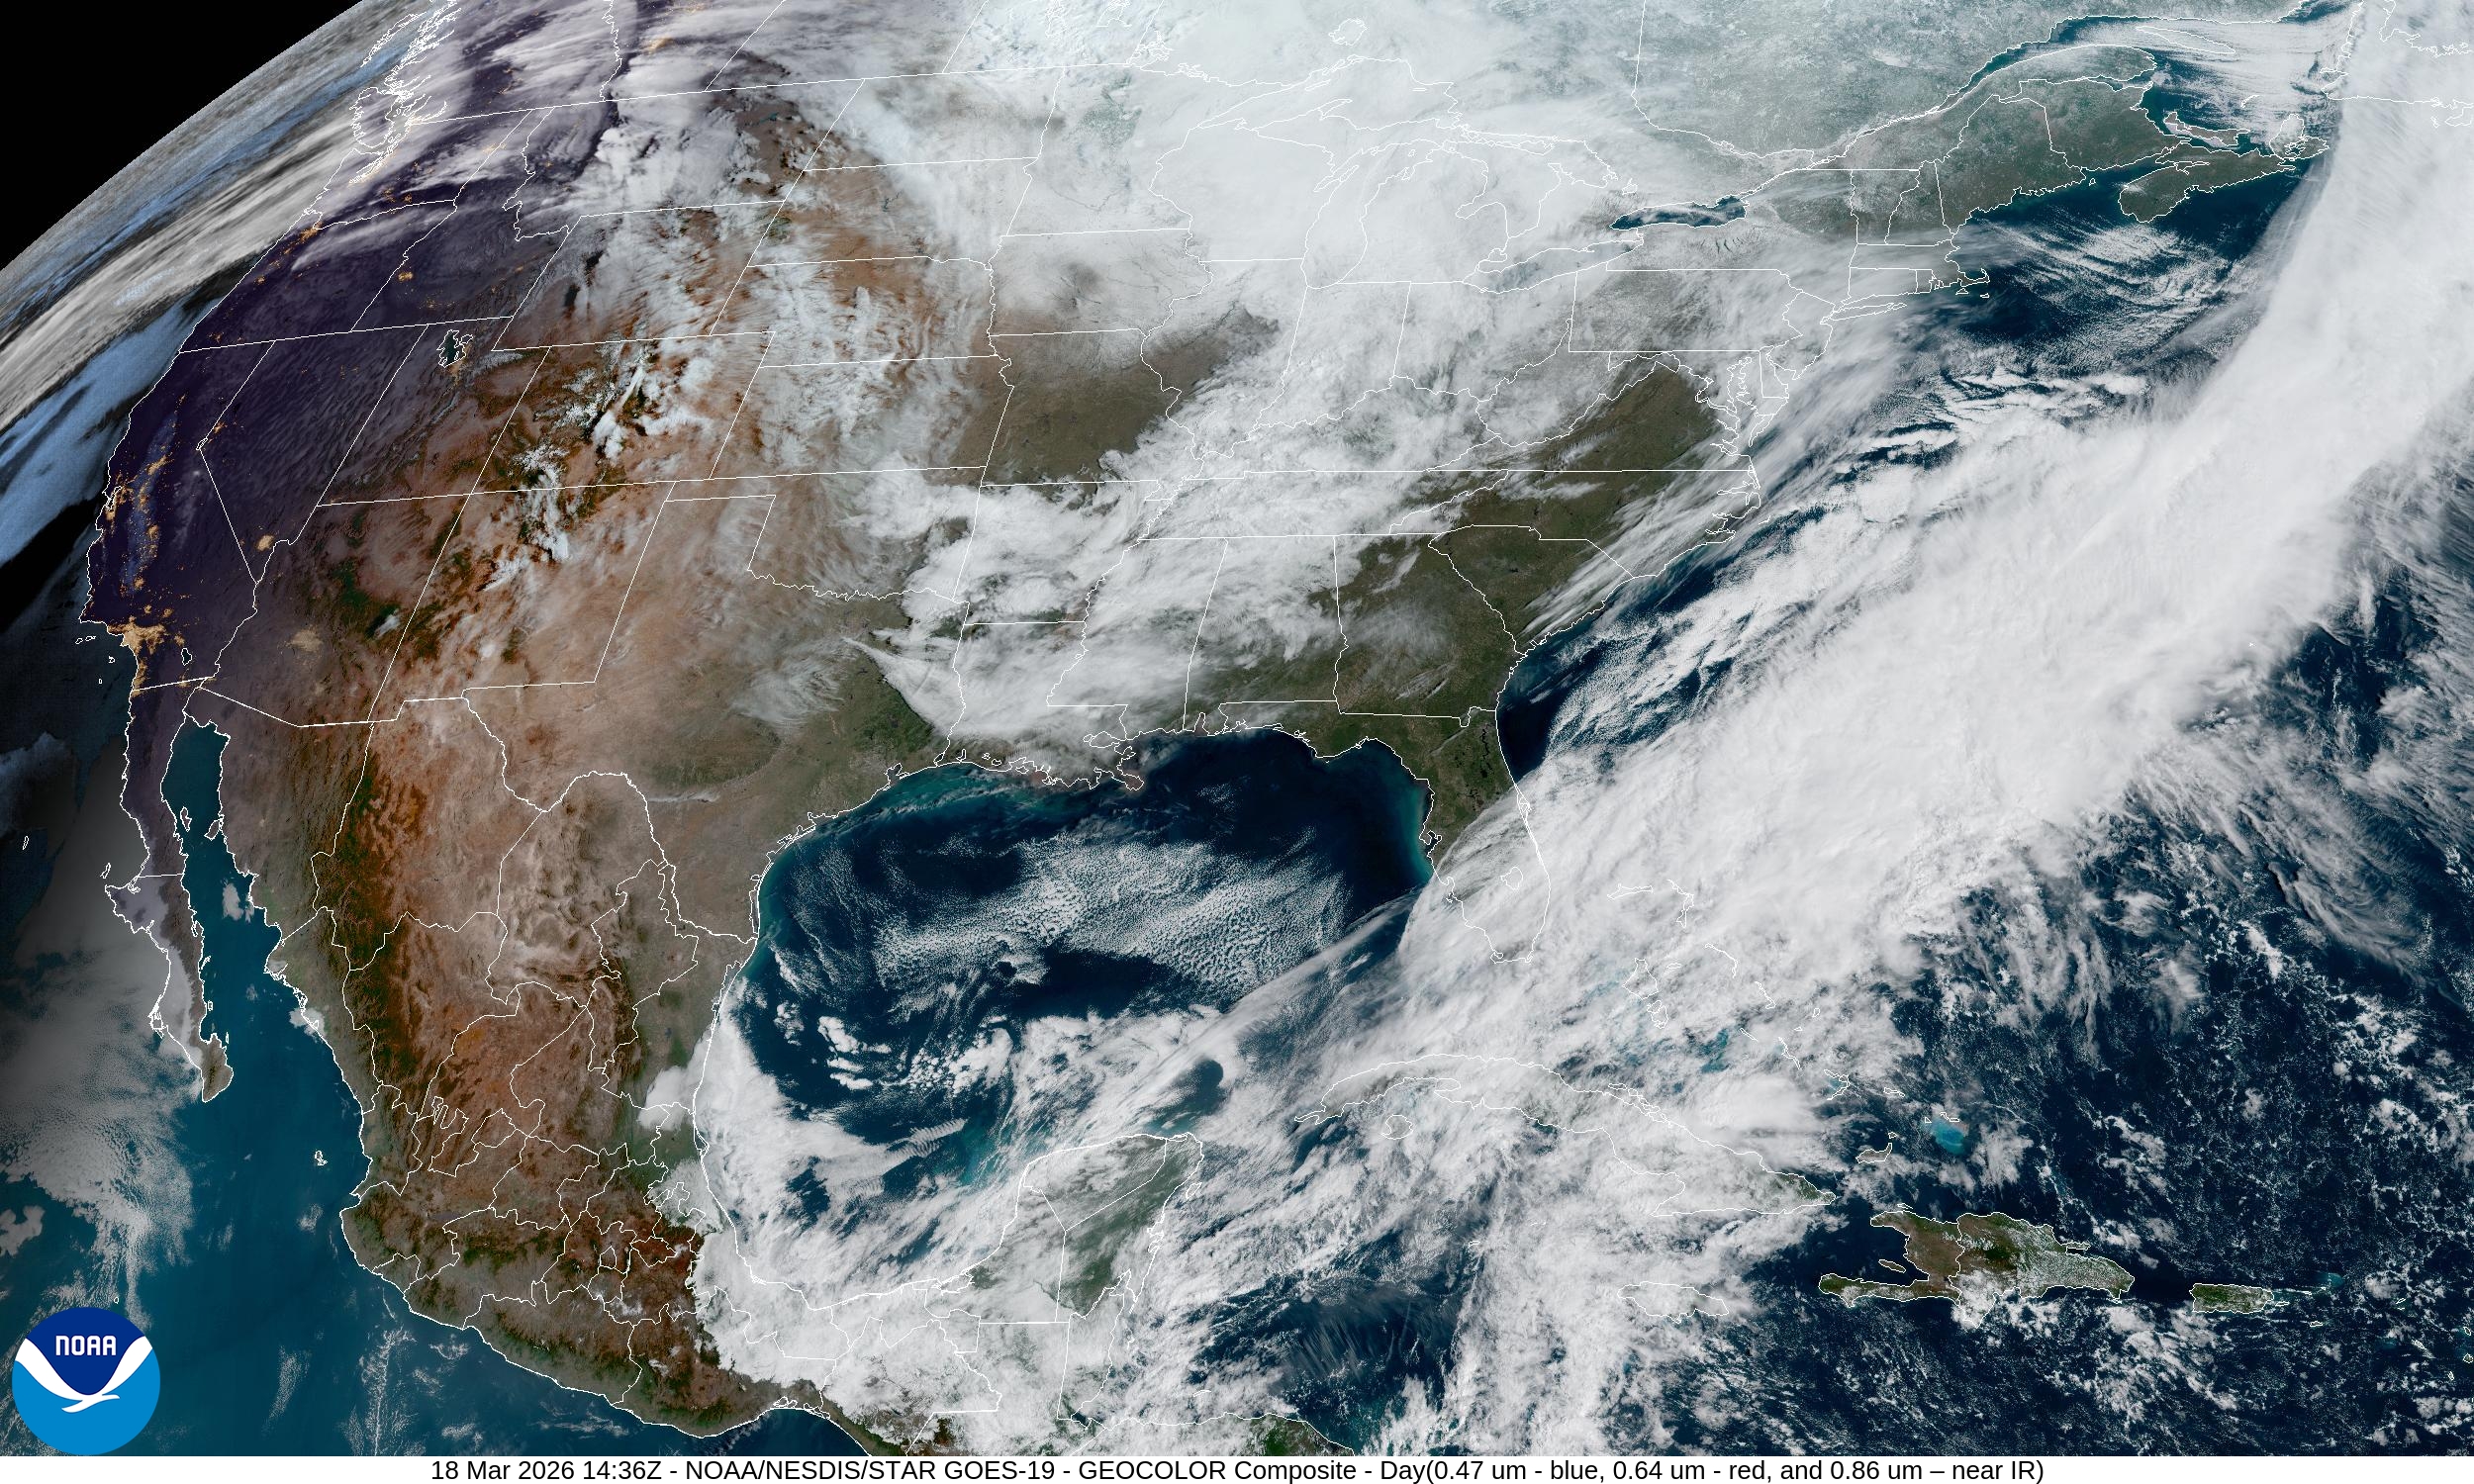
Morning Satellite Imagery showed the clouds from the storm system well off the East Coast … sunshine across the Southeast
HRRR 12z — Radar Simulation Next 48-hours to Friday 8 AM ET
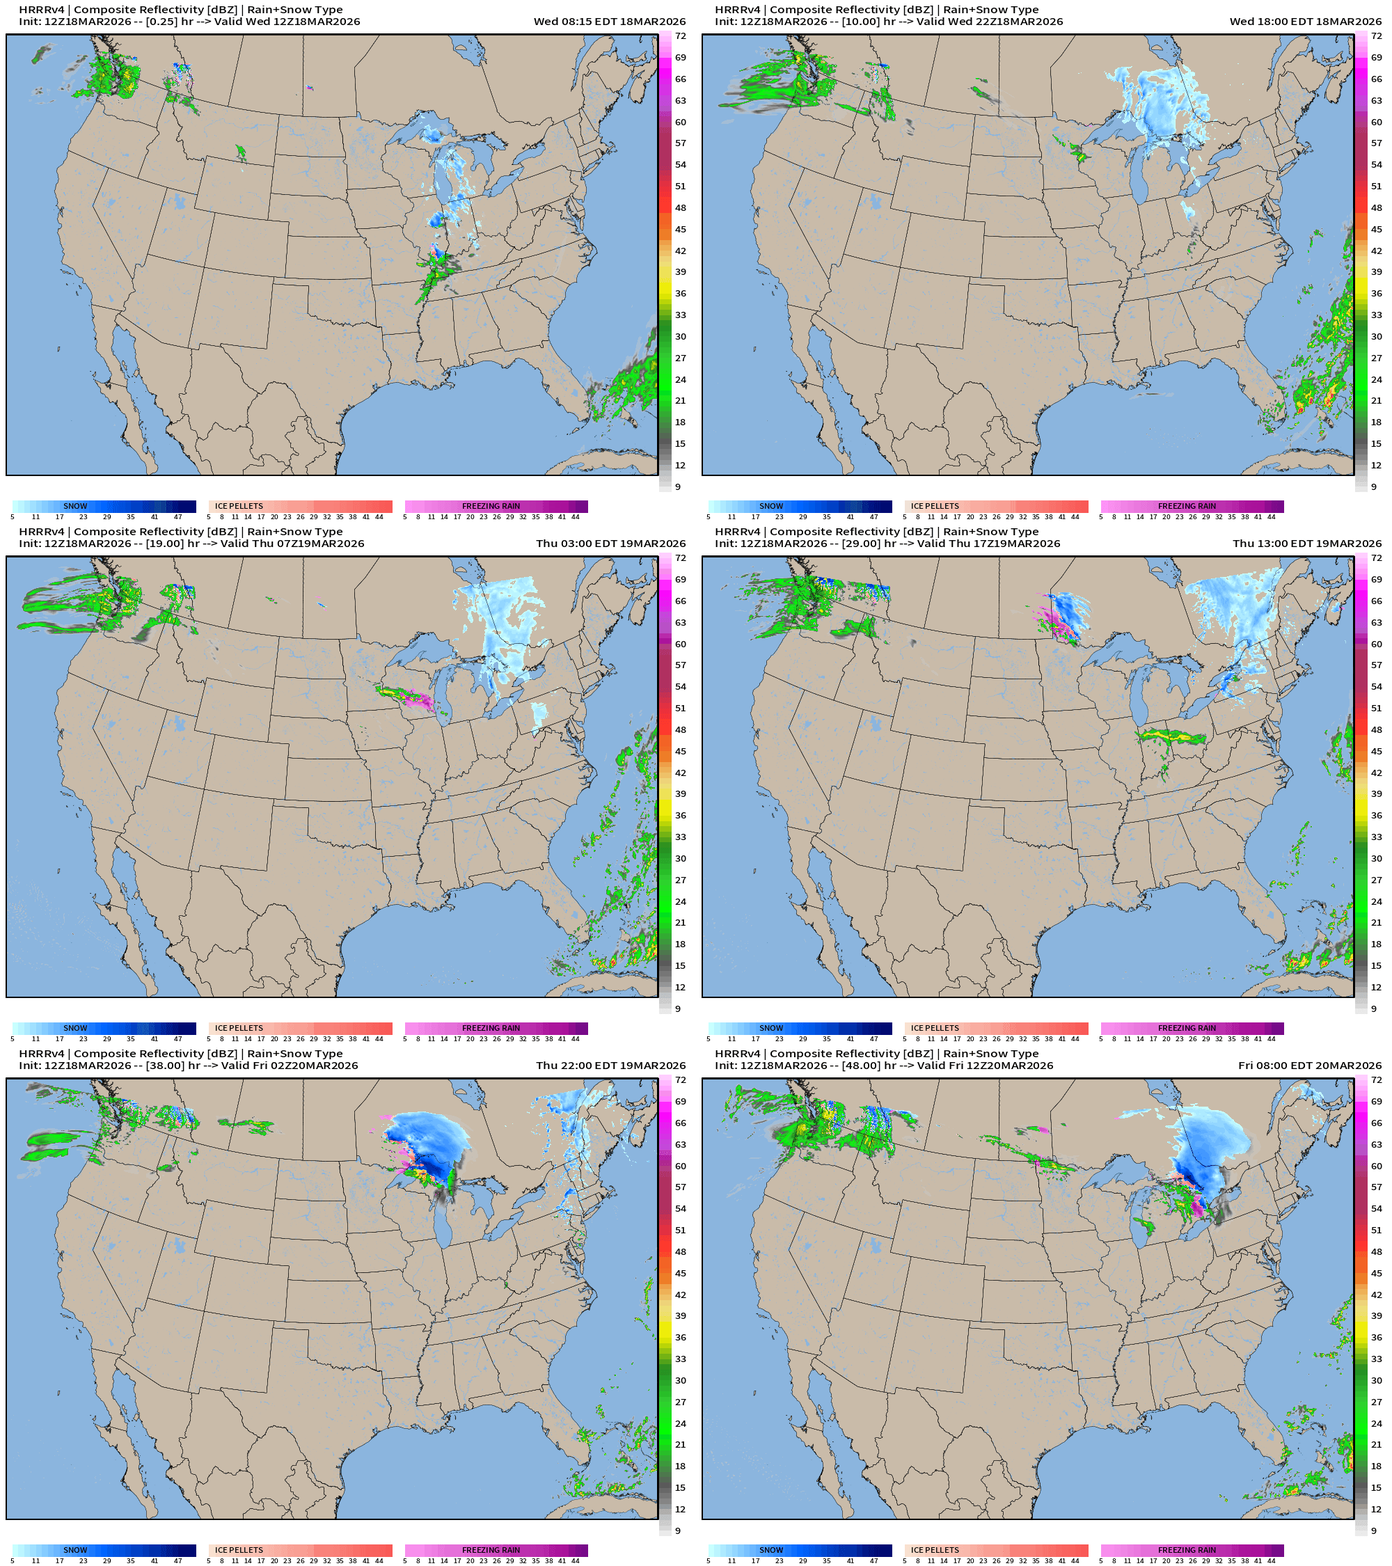
Only weather maker is a weak Clipper System through the Great Lakes today … and moisture streaming into the Pacific Northwest with an atmospheric river for Washington State.
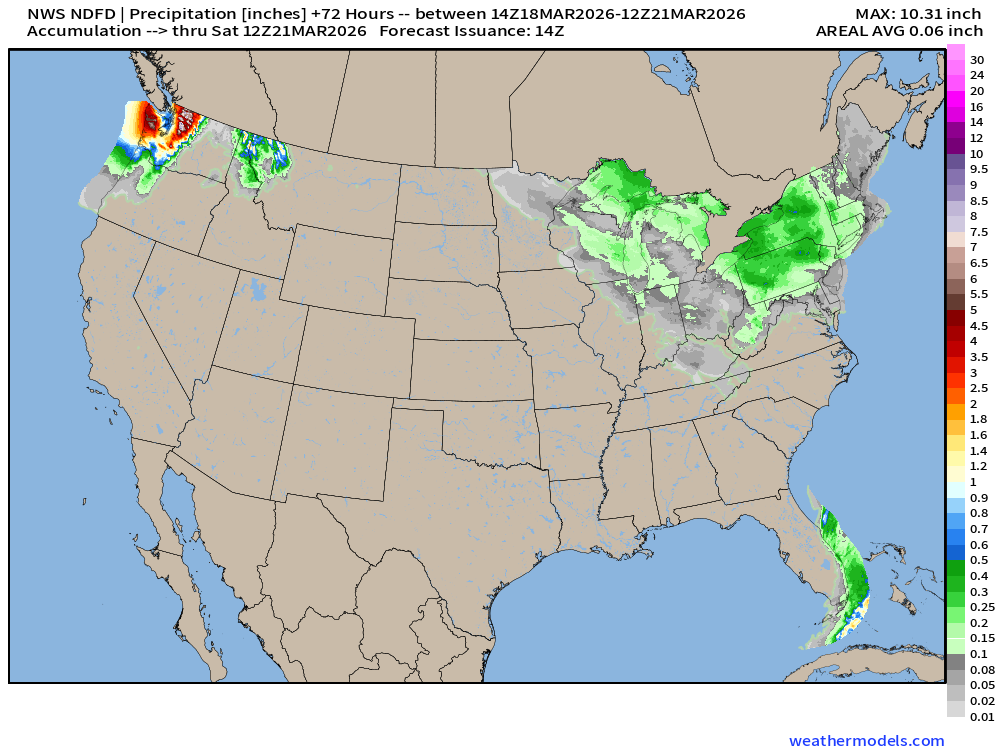
NDFD NWS Total Precipitation Next 72-hours through Saturday Morning
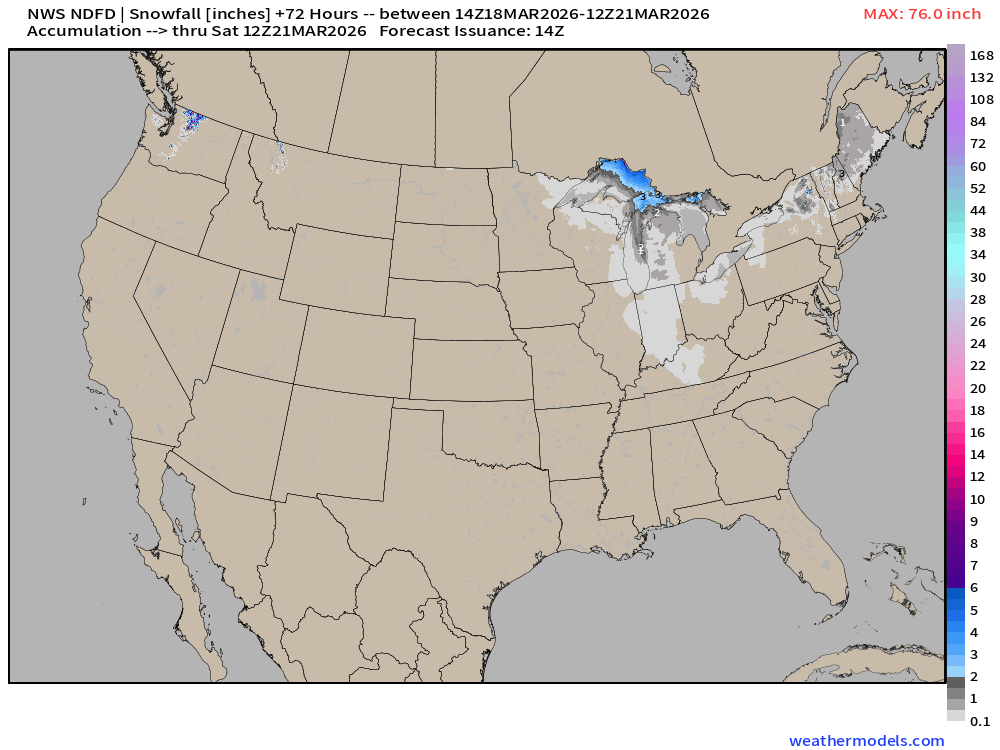
NWS Snowfall Next 72-hours — through Saturday Morning
RTMA Current Temperature Analysis | 9:30 AM ET
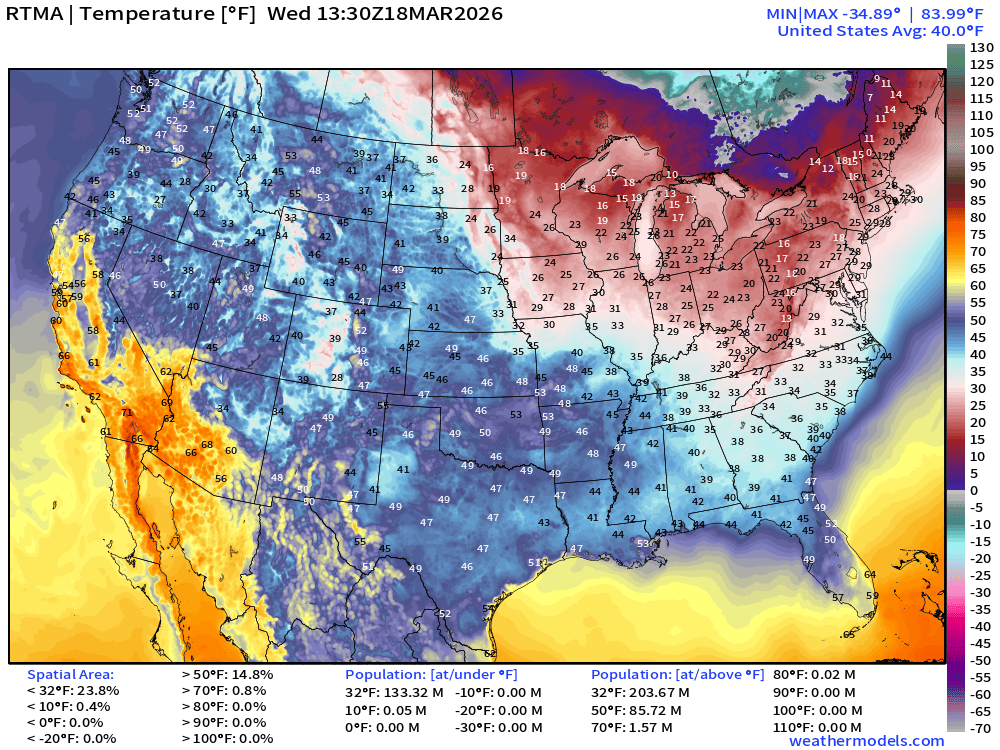
133 million below freezing … Lower 48 average was 40.0°F at 9:30 AM ET
RTMA Current Temperature Anomaly Analysis | 9:30 AM ET
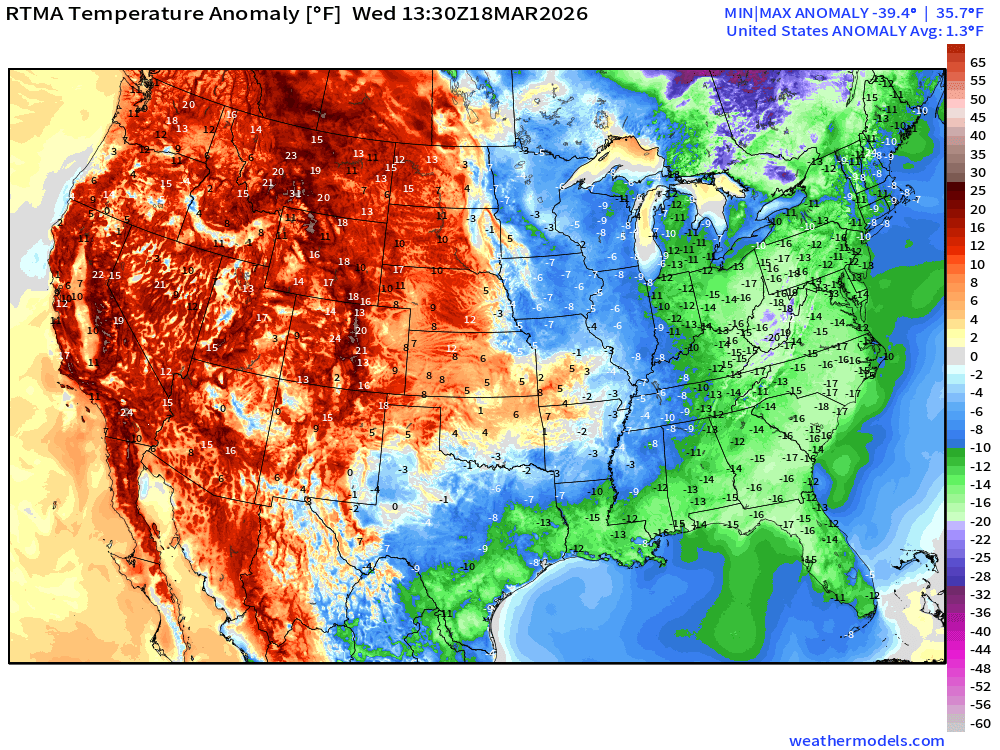
Lower 48 is 1.3°F ABOVE normal
RTMA Current Temperature 24-hour Change | 9:30 AM ET
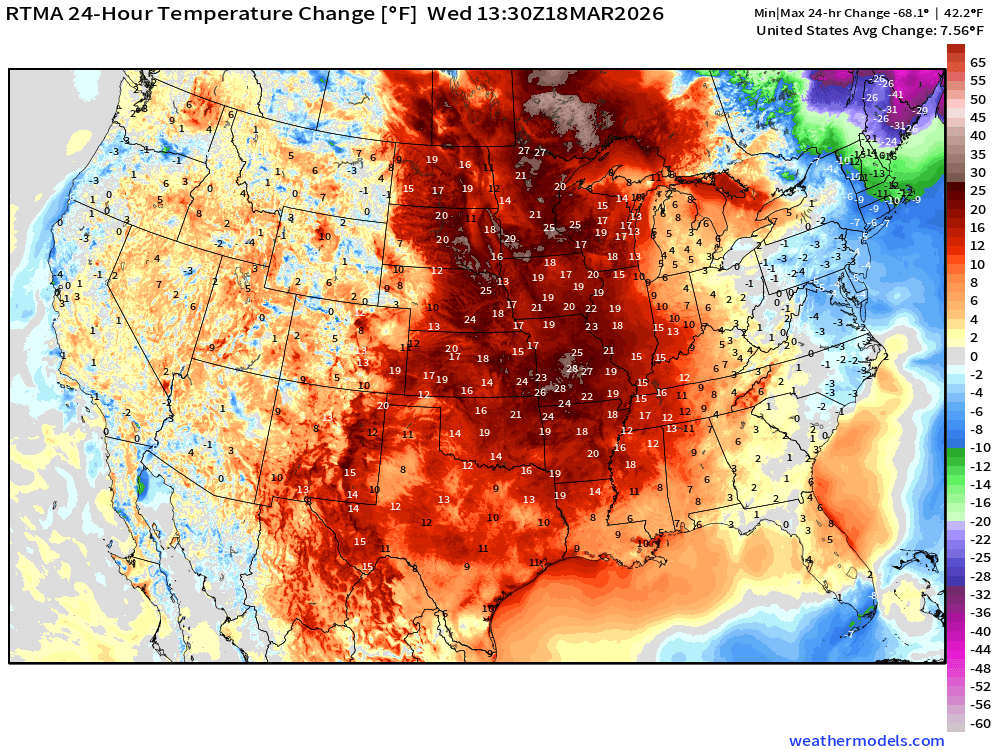
Welcome warming across the central U.S.
ECMWF 06z Precipitation Type + Intensity | Next 6-days
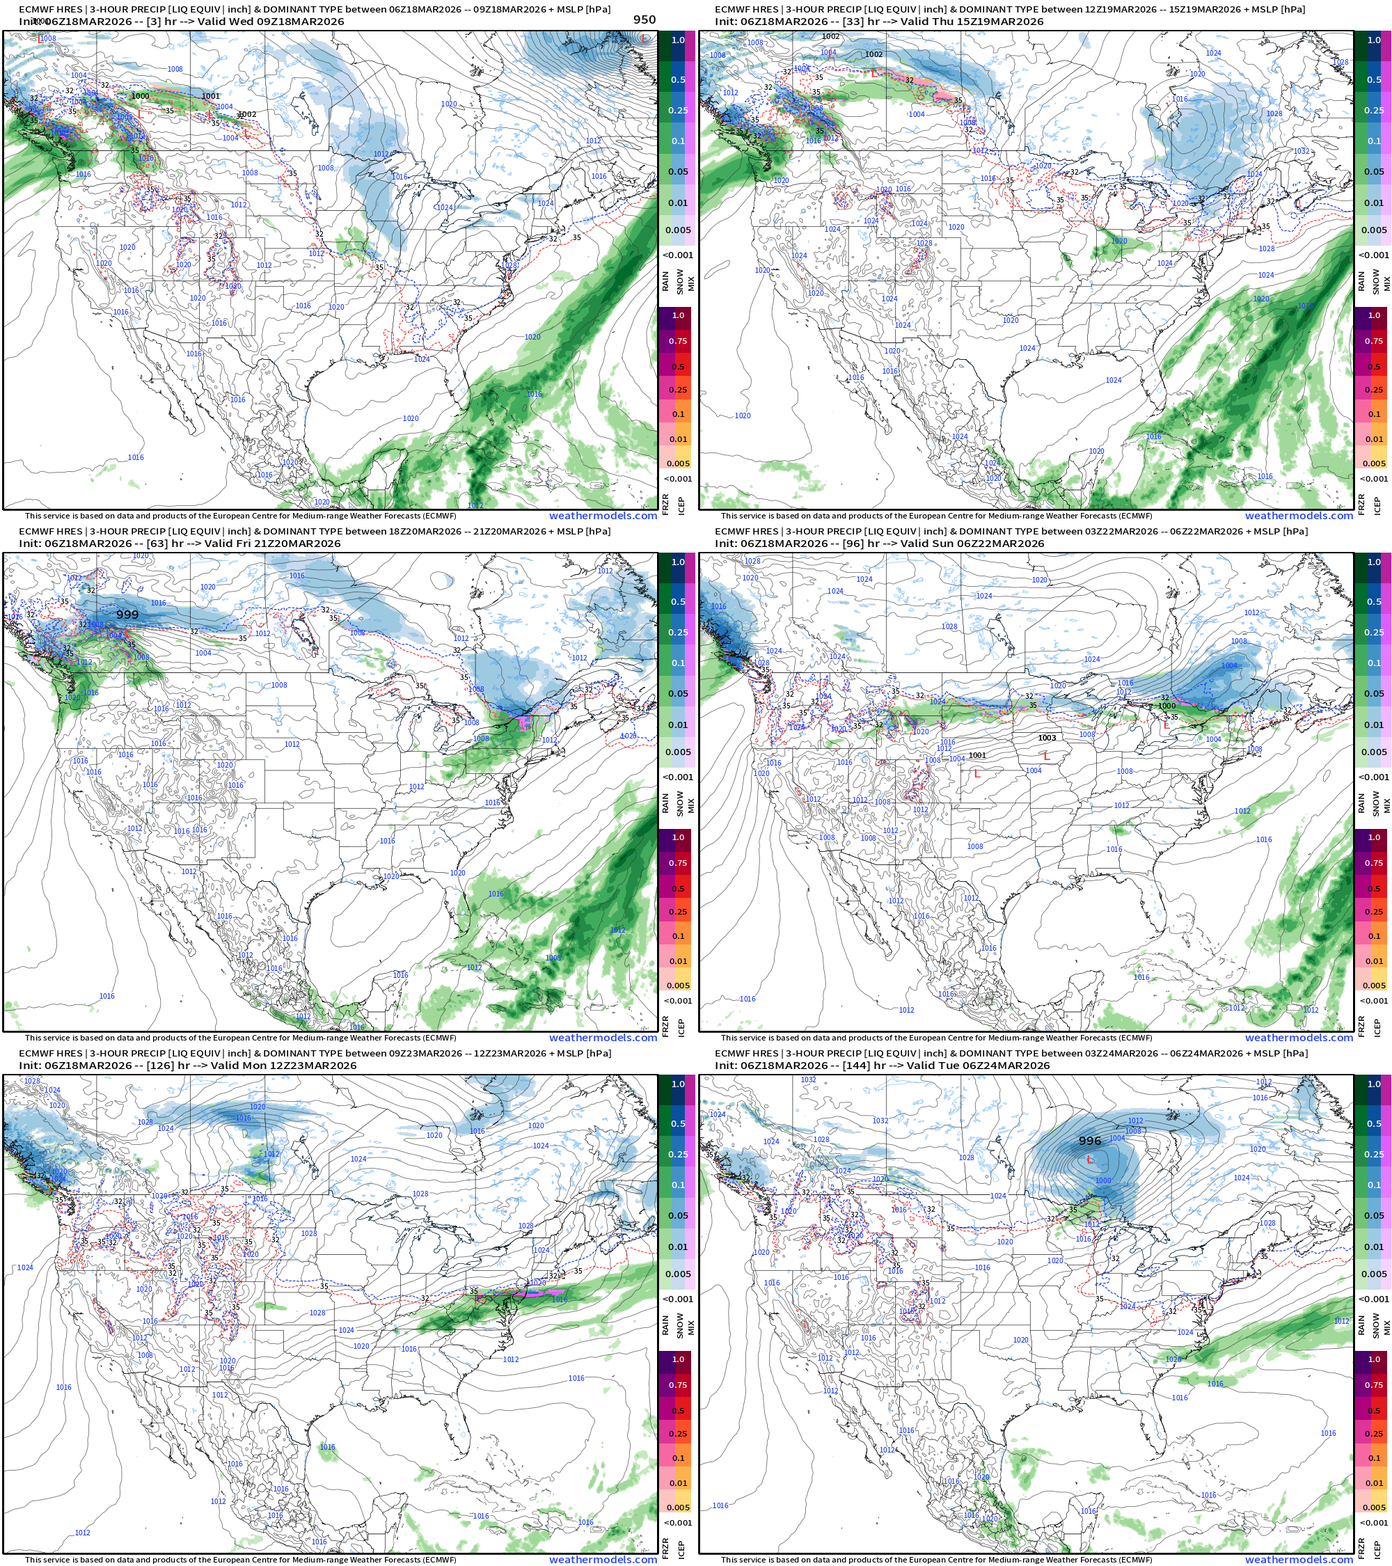
Not seeing much in the way of precipitation / active weather aside from Clipper Systems across the Northern Tier with moisture supplied by the Pacific Northwest atmospheric rivers.
Western U.S. | Heat Dome
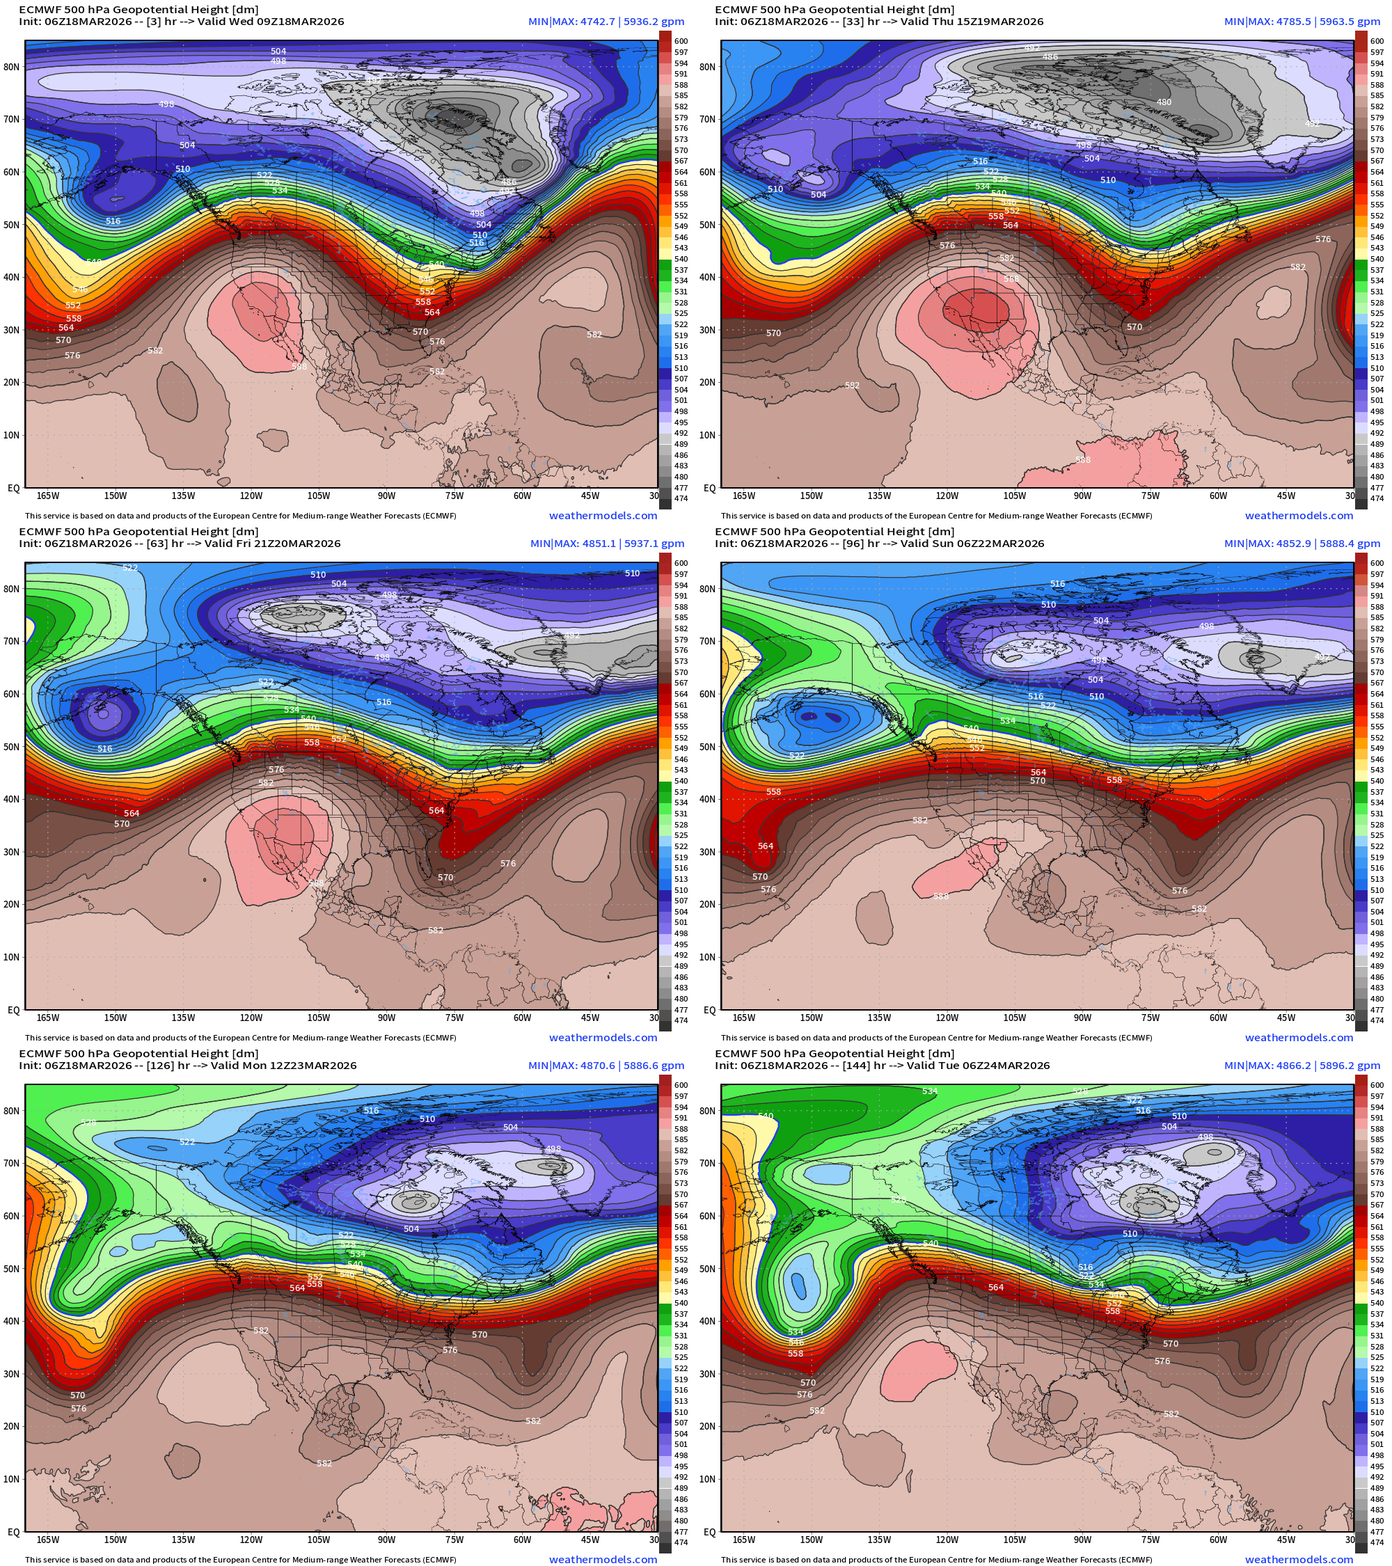
Height at 500 mb > 5960 meters centered over Las Vegas … exceptional for any time of the year let alone mid-March.
Temperature Anomaly Next 6-days
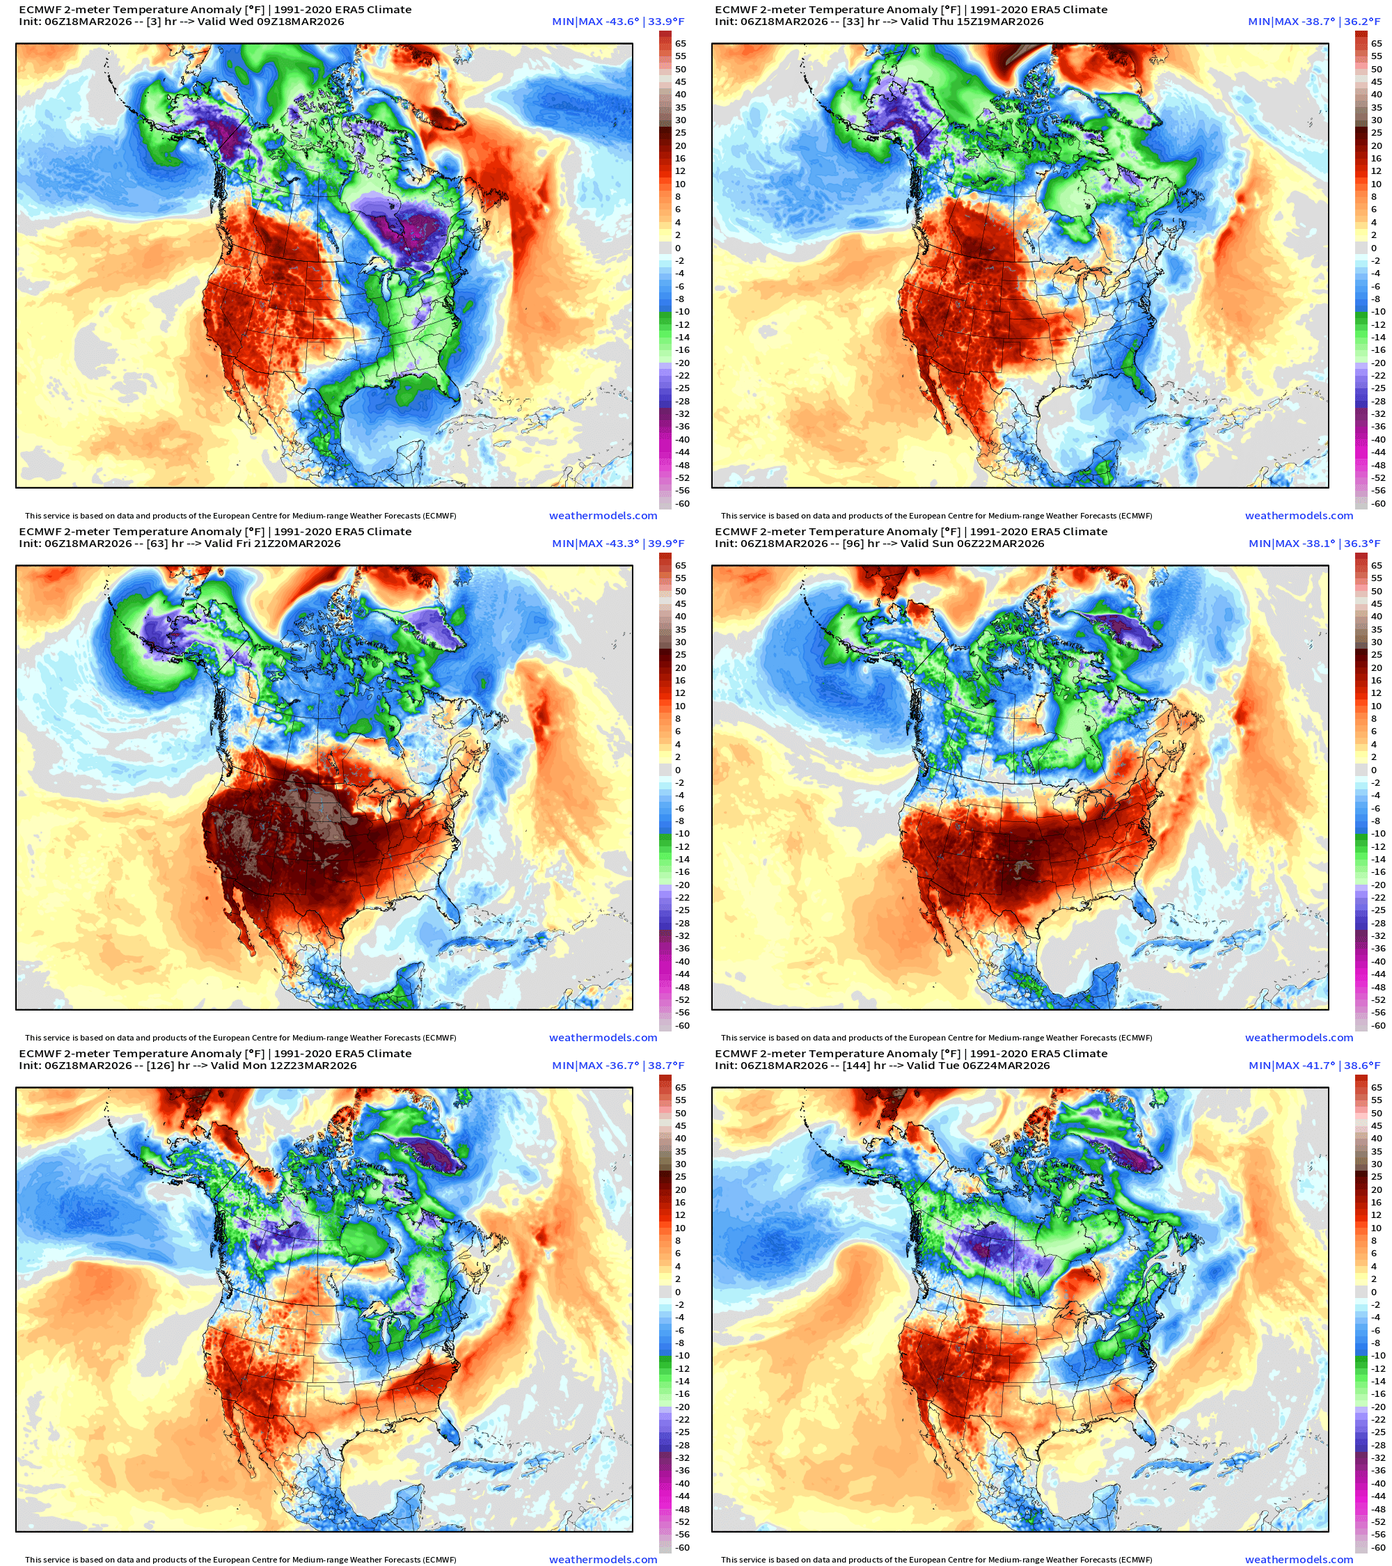
Record heat across the Western U.S. does shift eastward into the weekend and early next week before Canadian cool air sags southward. Much of Canada remains very cold!
Next 6-days of Precipitable Water (my favorite parameter)
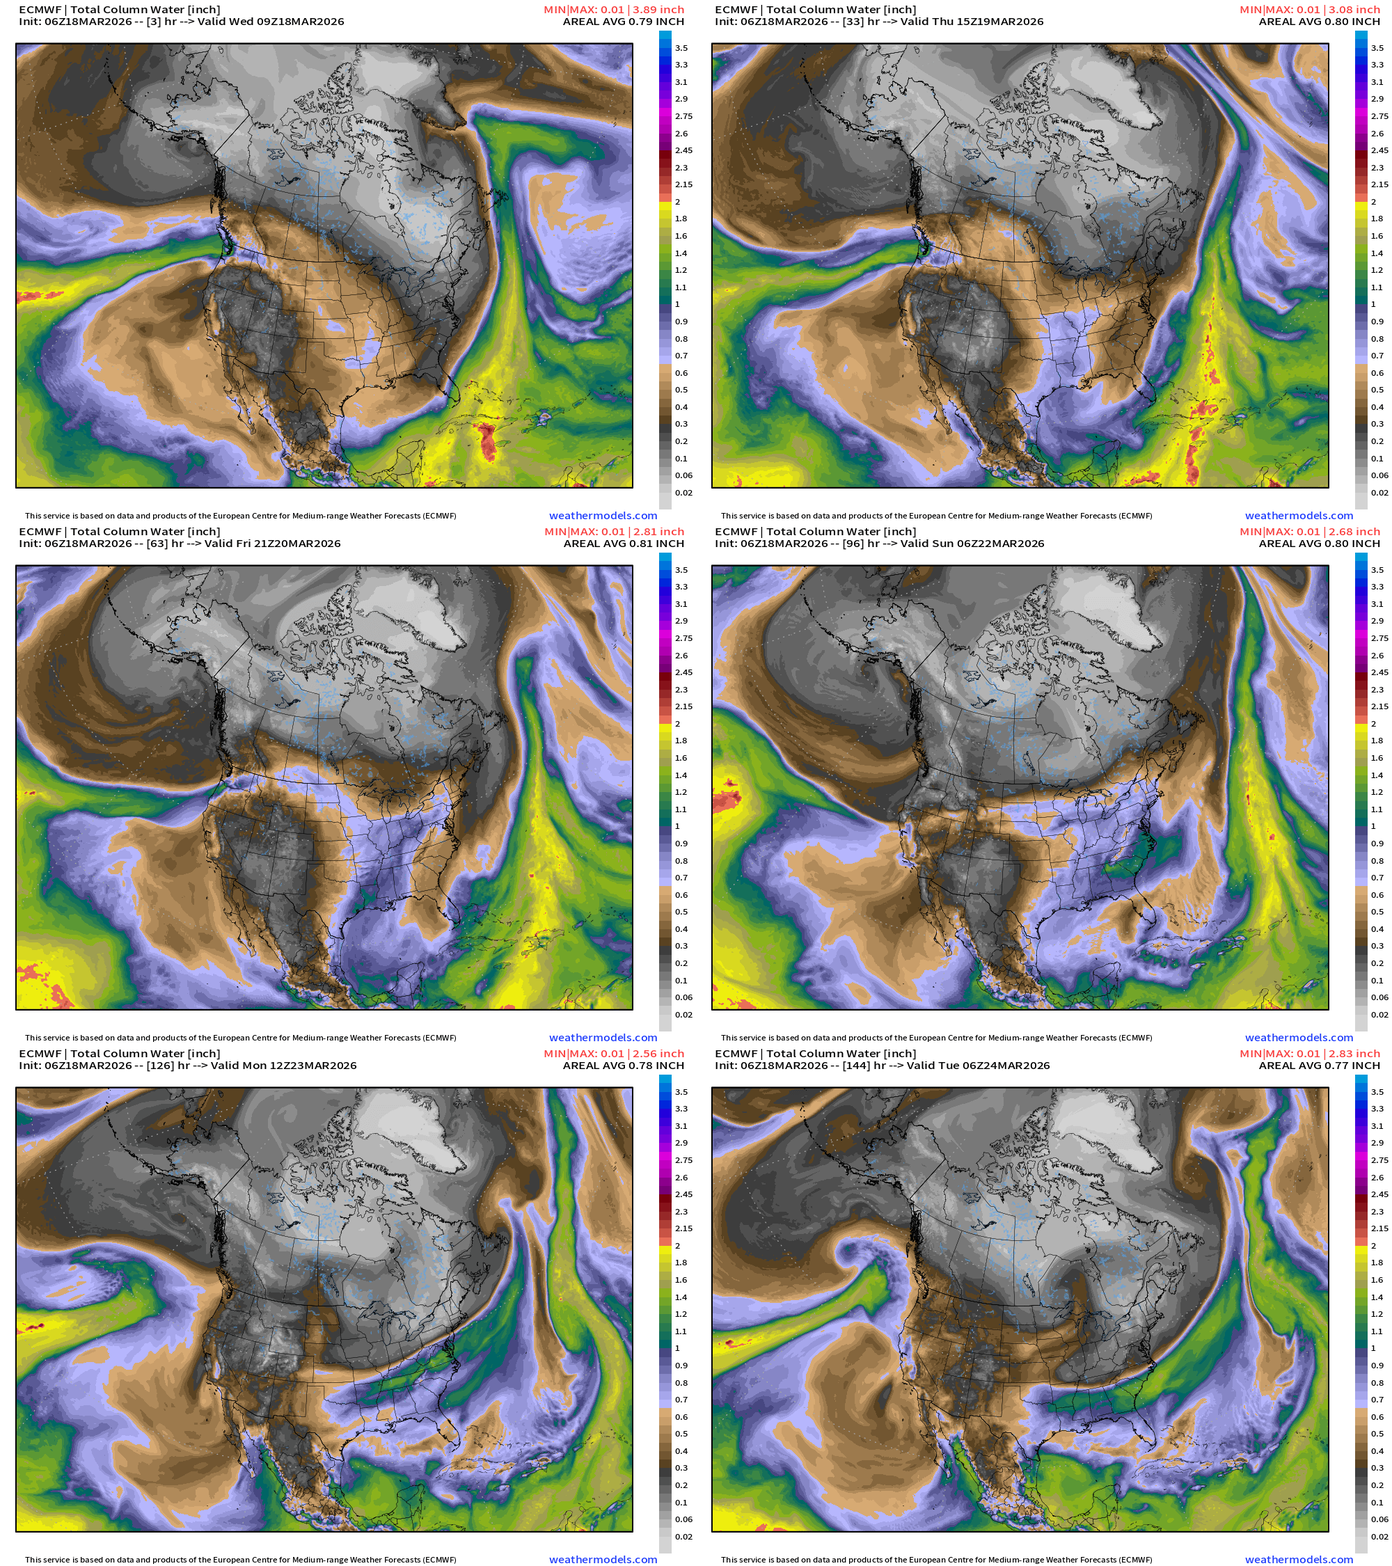
Significant atmospheric rivers (2 of them) into Pacific Northwest in next 7-days.
The heat dome circulation is forcing northerly flow to it east — and thankfully not tapping into the Canadian cold pool too significantly until maybe next week = moderating Lower 48 temperatures!
Chicago next 7-Days
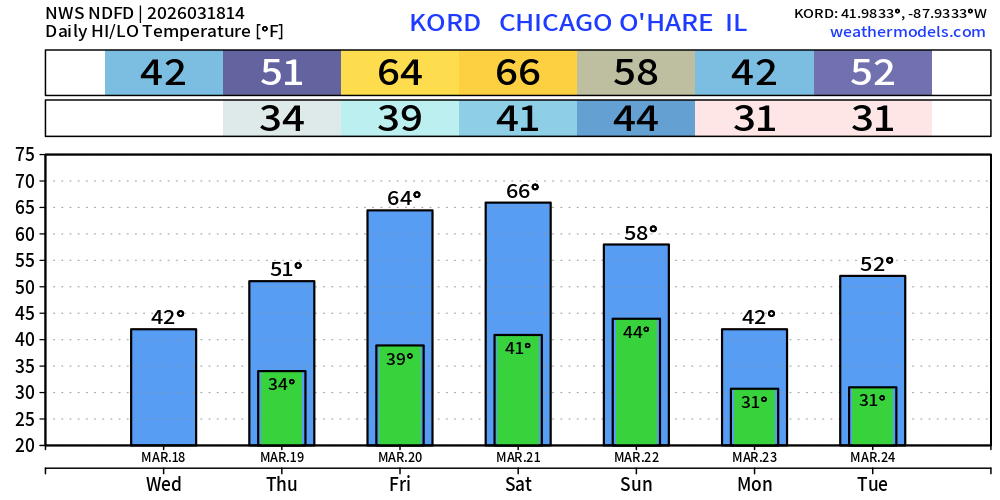
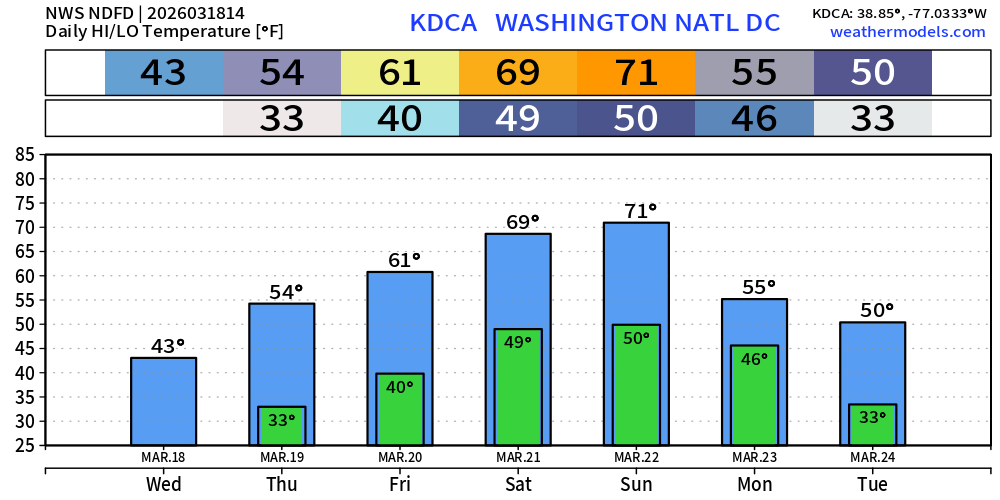
Washington D.C. next 7-days
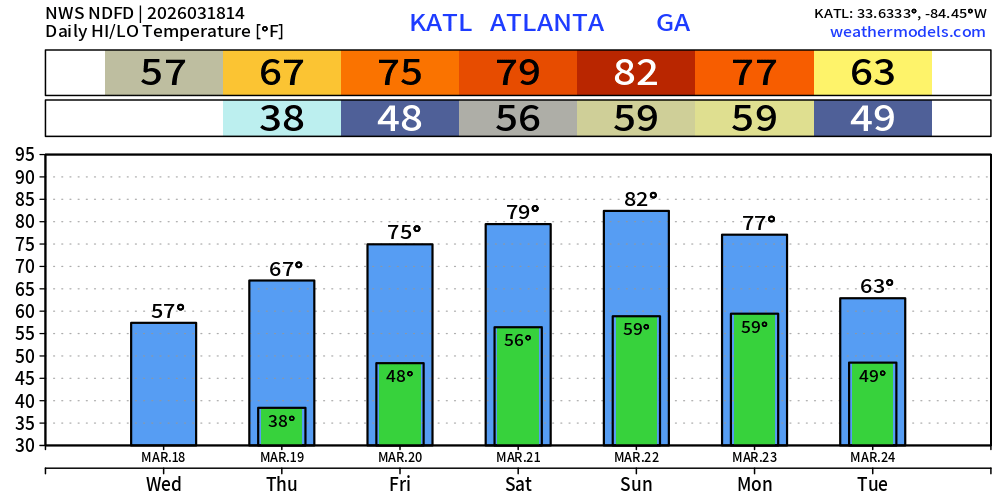
Atlanta next 7-days
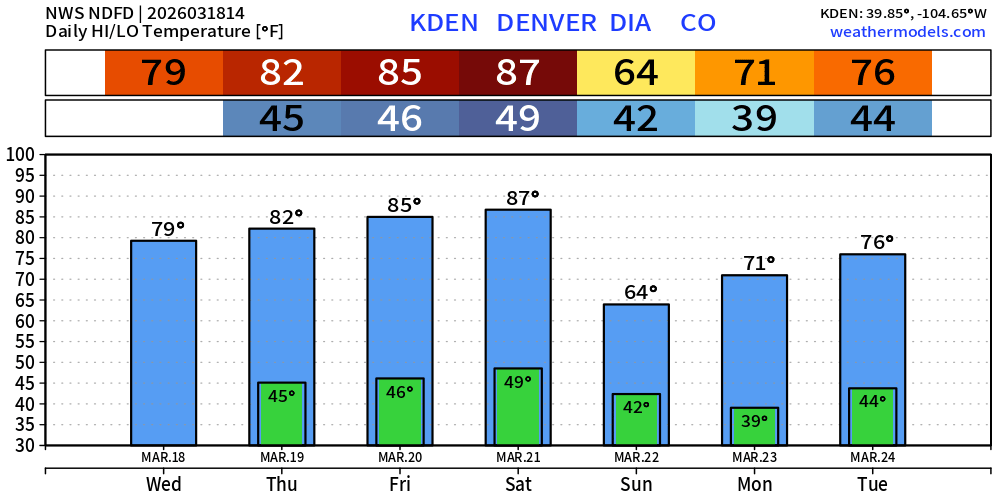
Denver next 7-days
ECMWF AIFS 06z | Temperature at 500 mb | Next 15-days
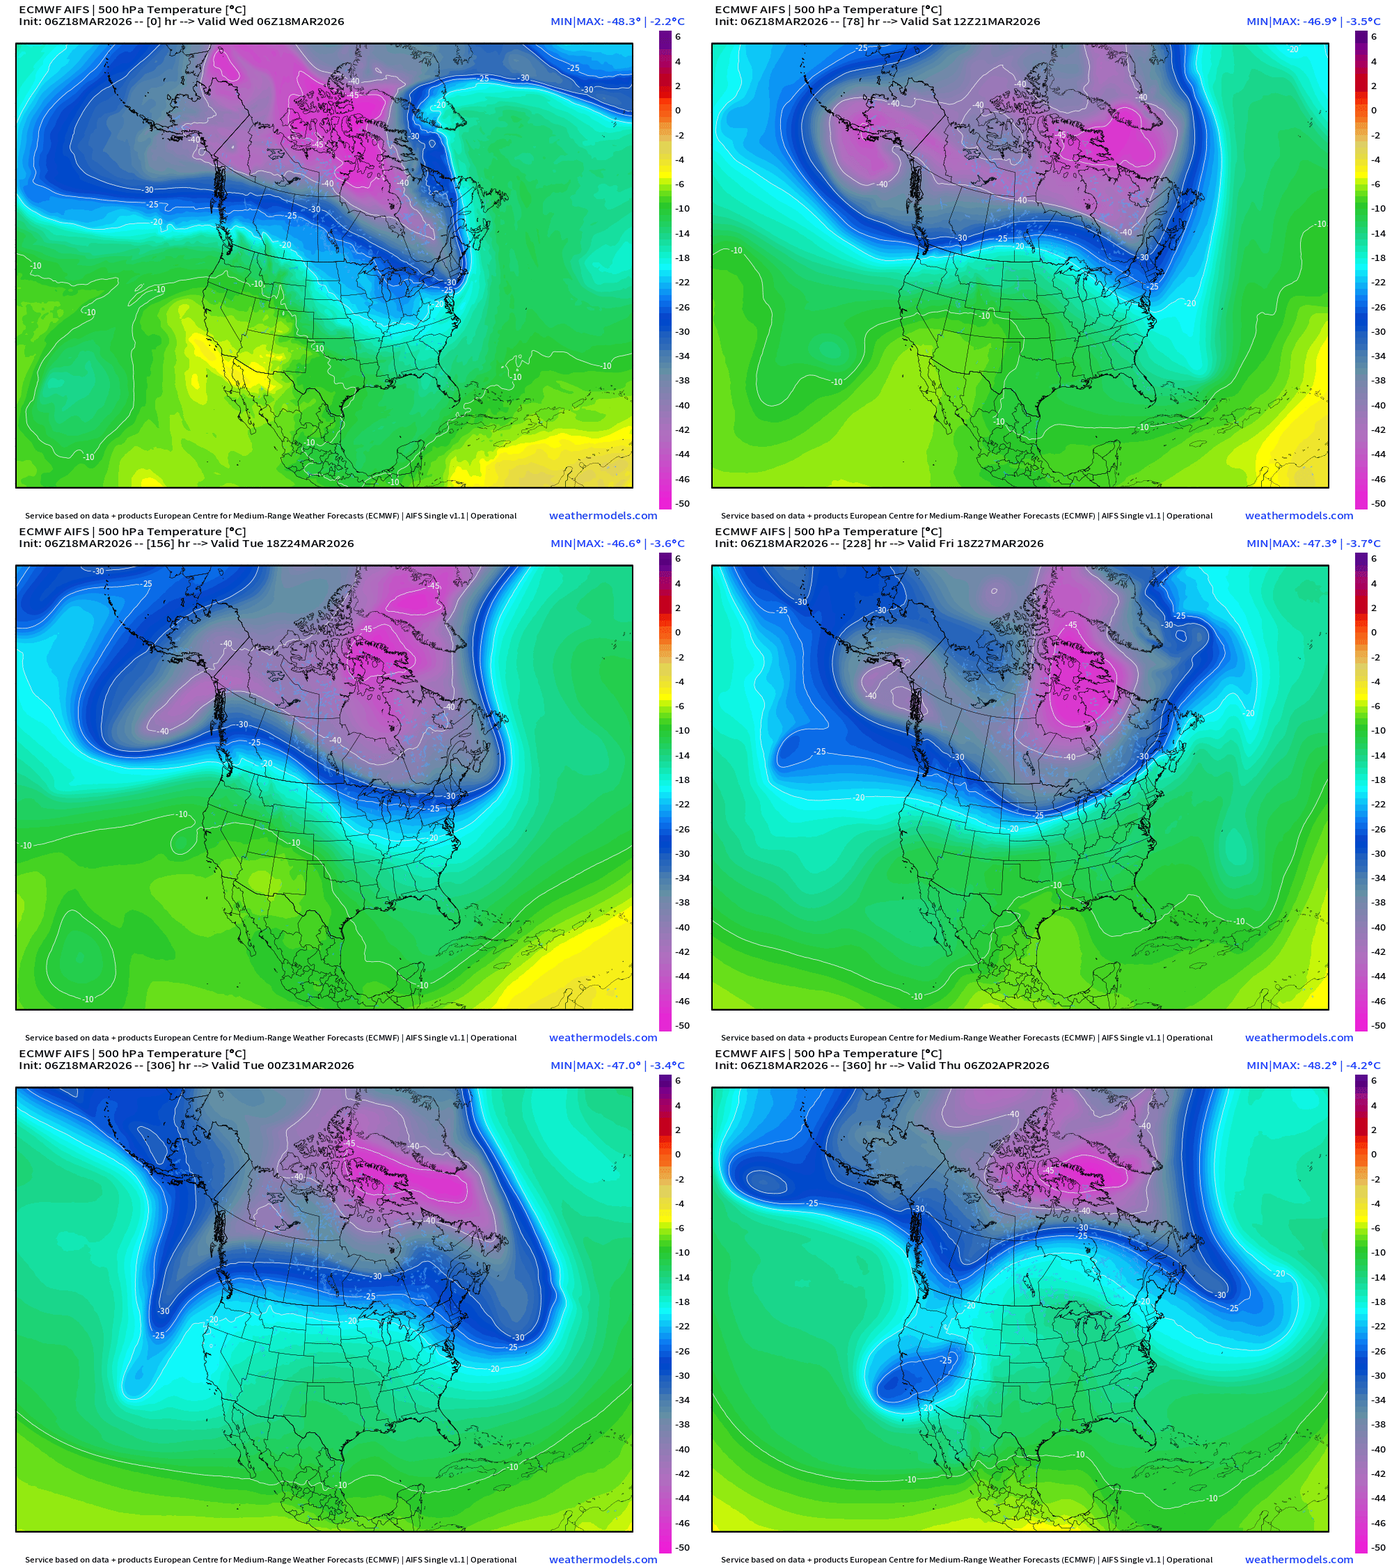
The tropospheric polar vortex remains “cold” and spinning strongly through end of March. Still a pool of -40°C to -45°C temperature air at 500 mb.
Snowfall | Median of ECMWF Ensembles [00z] | Next 15-days
Probability of at least 3” of Snowfall Next 15-days
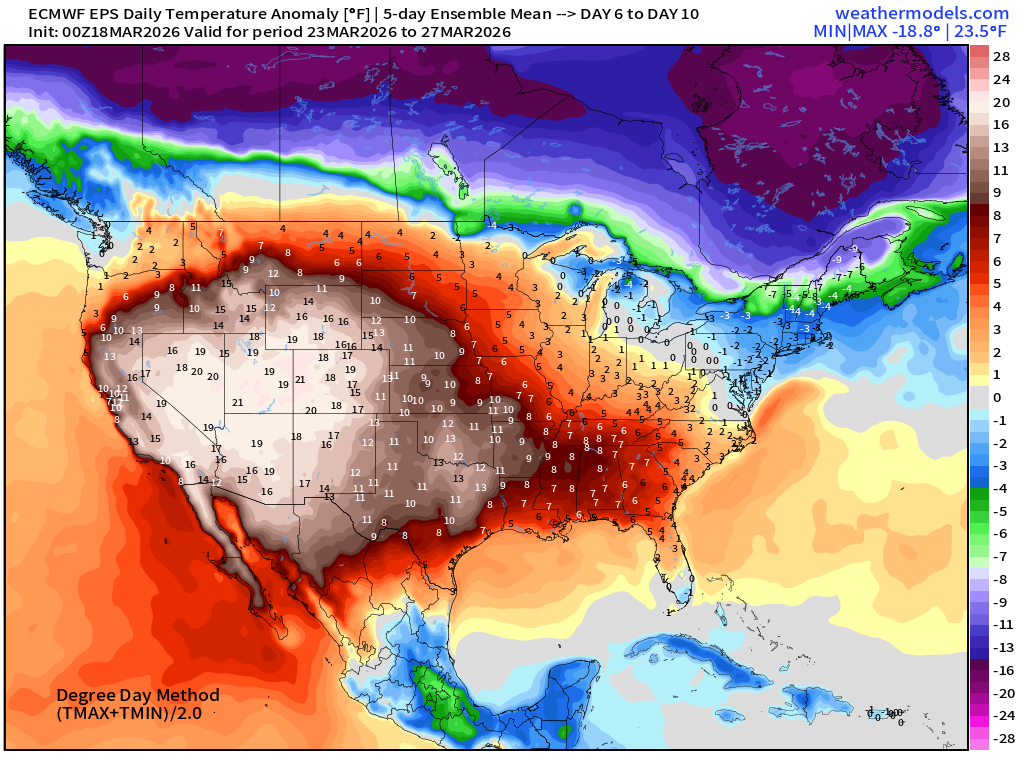
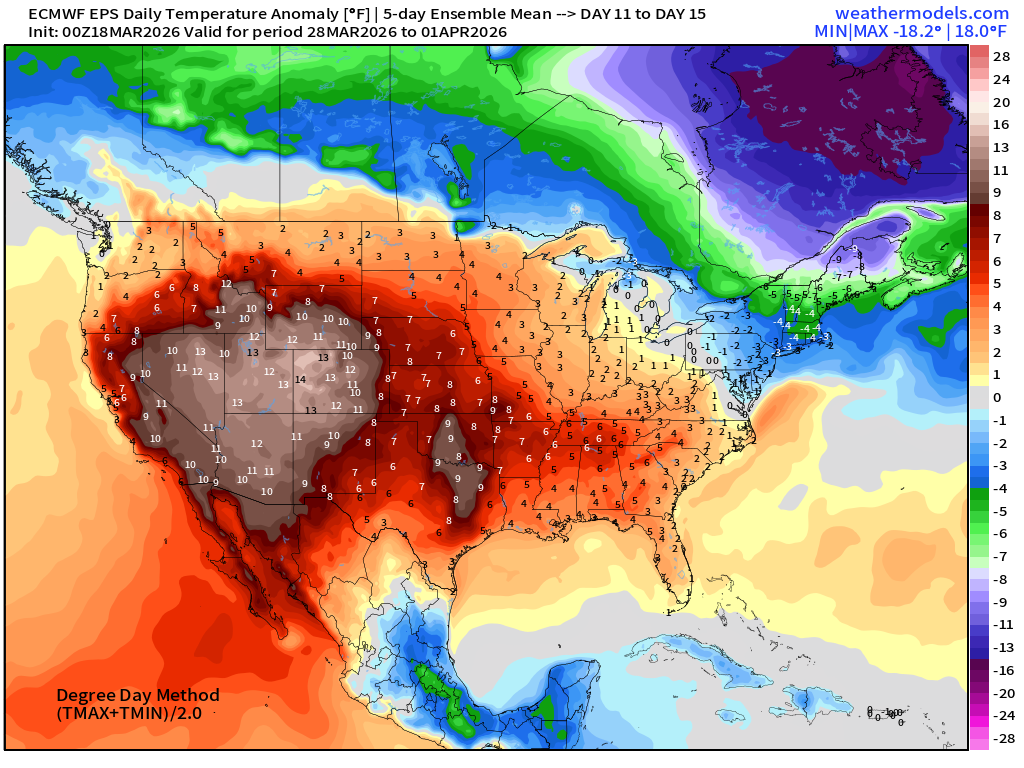
Temperature Anomaly | Next 15-days | ECMWF EPS 00z Ensemble Mean
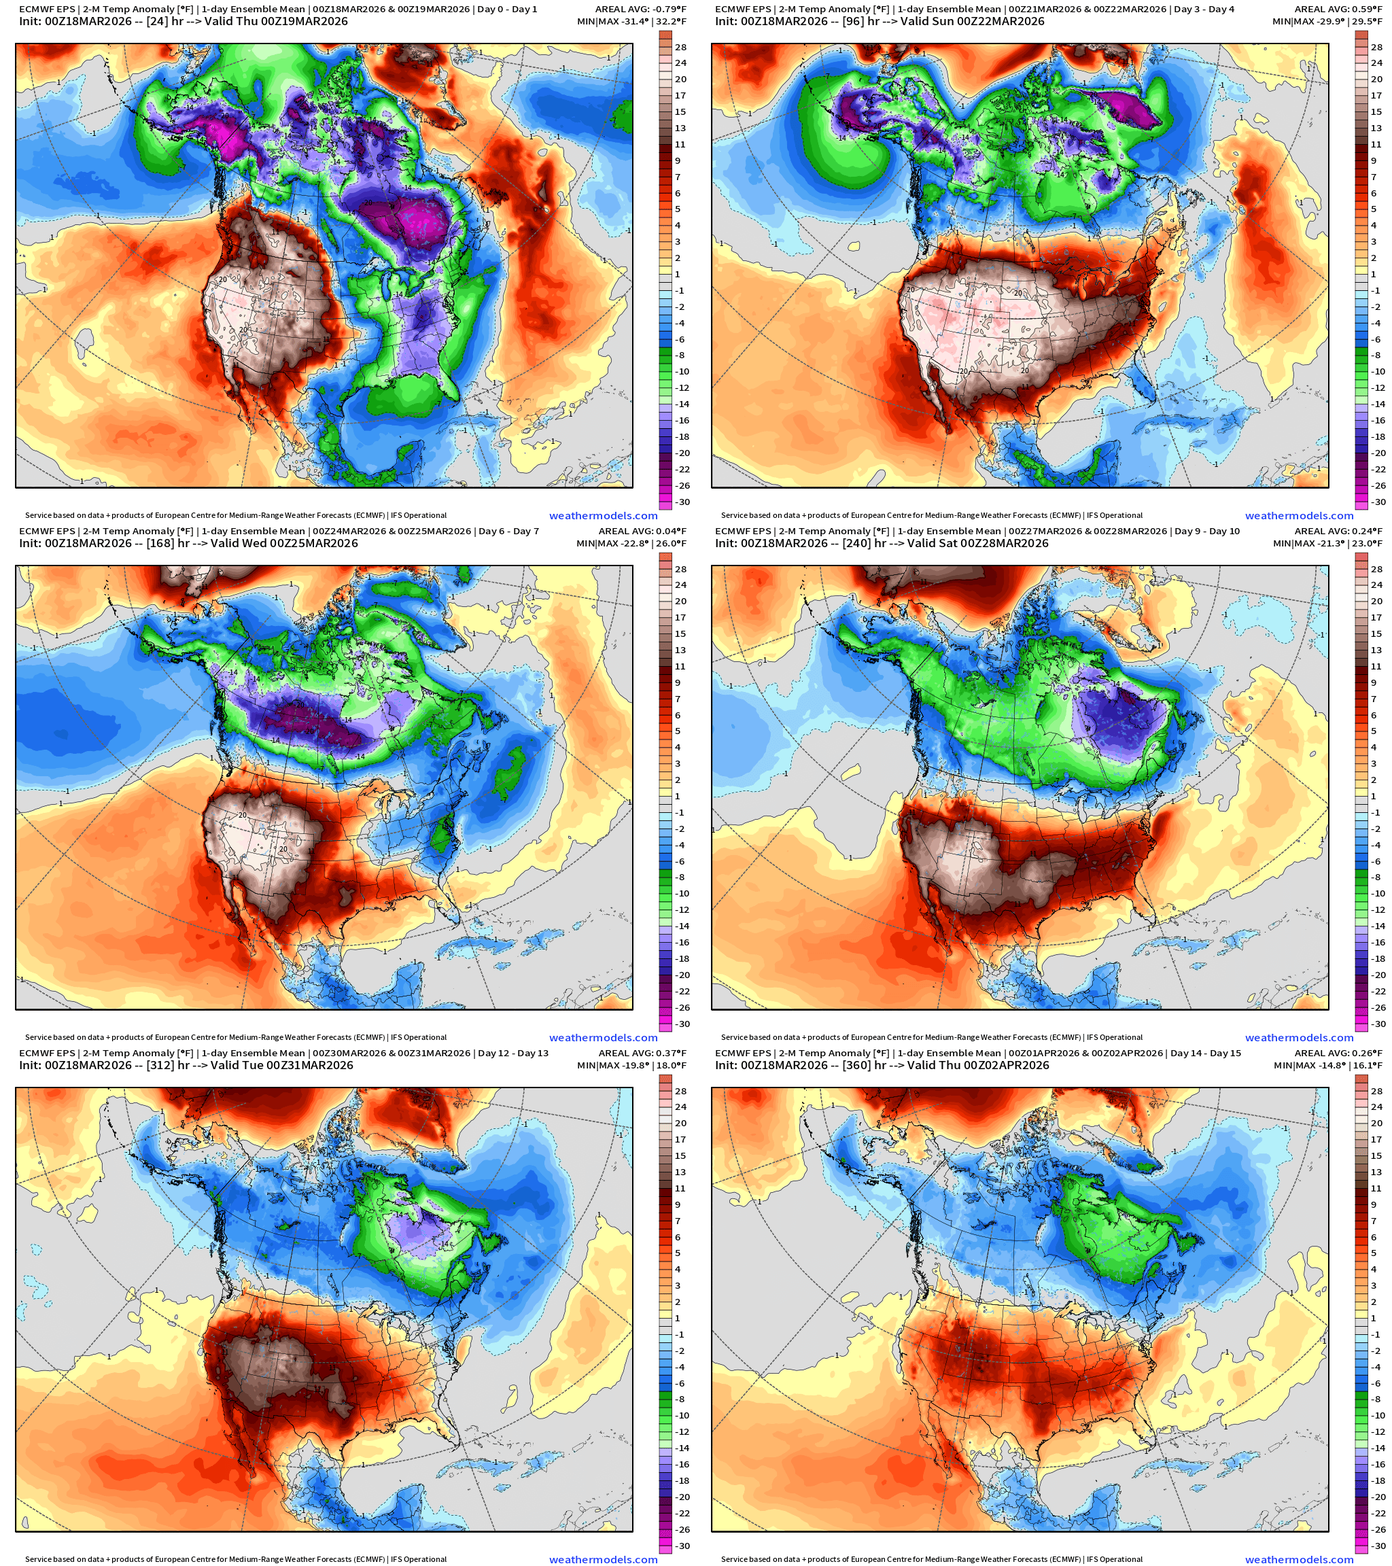
The Canadian cold pool NEEDS to stay up there … but any passing shortwave or Clipper could access it and drag it southward.
5-Day Chunk #1 | Temperature Anomaly | March 18 - March 22
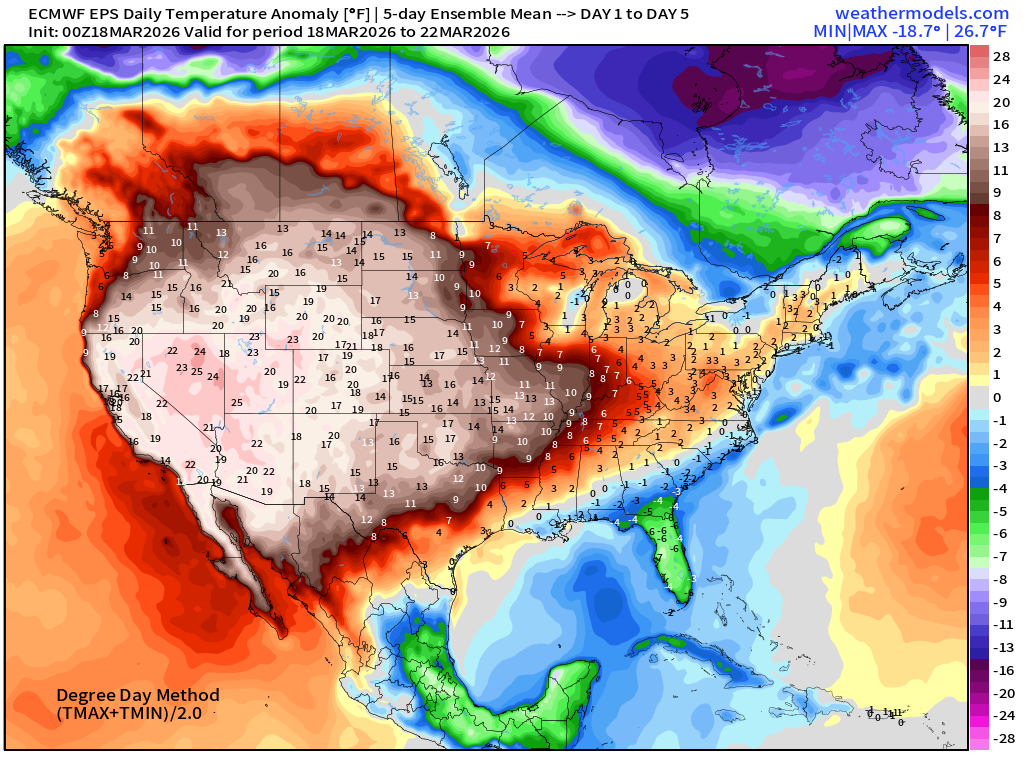
5-Day Chunk #2 | Temperature Anomaly | March 23 - March 27
5-Day Chunk #3 | Temperature Anomaly | March 28 - April 1
Maps sourced from weathermodels.com designed and innovated by yours truly! Please subscribe there for real-time access to the newest maps, charts from all of the weather models including ECMWF and AIFS, and NOAA GFS/GEFS. NOAA WPC and SPC for fronts/convective outlooks.
- Milepost
- 899 · laid 2026-03-18T15:43:51.287000Z
- Source
- https://weather.substack.com/p/march-18-2026-wednesday-weather-update
- Digest
- d1ad9d815bd9b8870ddac86da580064fed6e009254c49c9dab677698c12dbba1
- Machine
- JSON