January 20, 2026 Tuesday Ice Storm Forecast
Collision of brutal Arctic air with subtropical moisture plume will fuel a widespread ice storm
January 2026 was the 25th-warmest January in the 132-year national record (1895–2026), at 33.1°F against a 1991–2020 normal of 32.3°F (+0.8°F).
January 2026 was the 12th-driest January in the 132-year national record (1895–2026), at 1.6in against a 1991–2020 normal of 2.3in (-0.8in).
NOAA/NCEI Climate at a Glance, contiguous United States. This is the observed record for the month, not a score of anything said in this piece — the forecast ledger begins 2026-08-17 and cannot reach earlier posts.

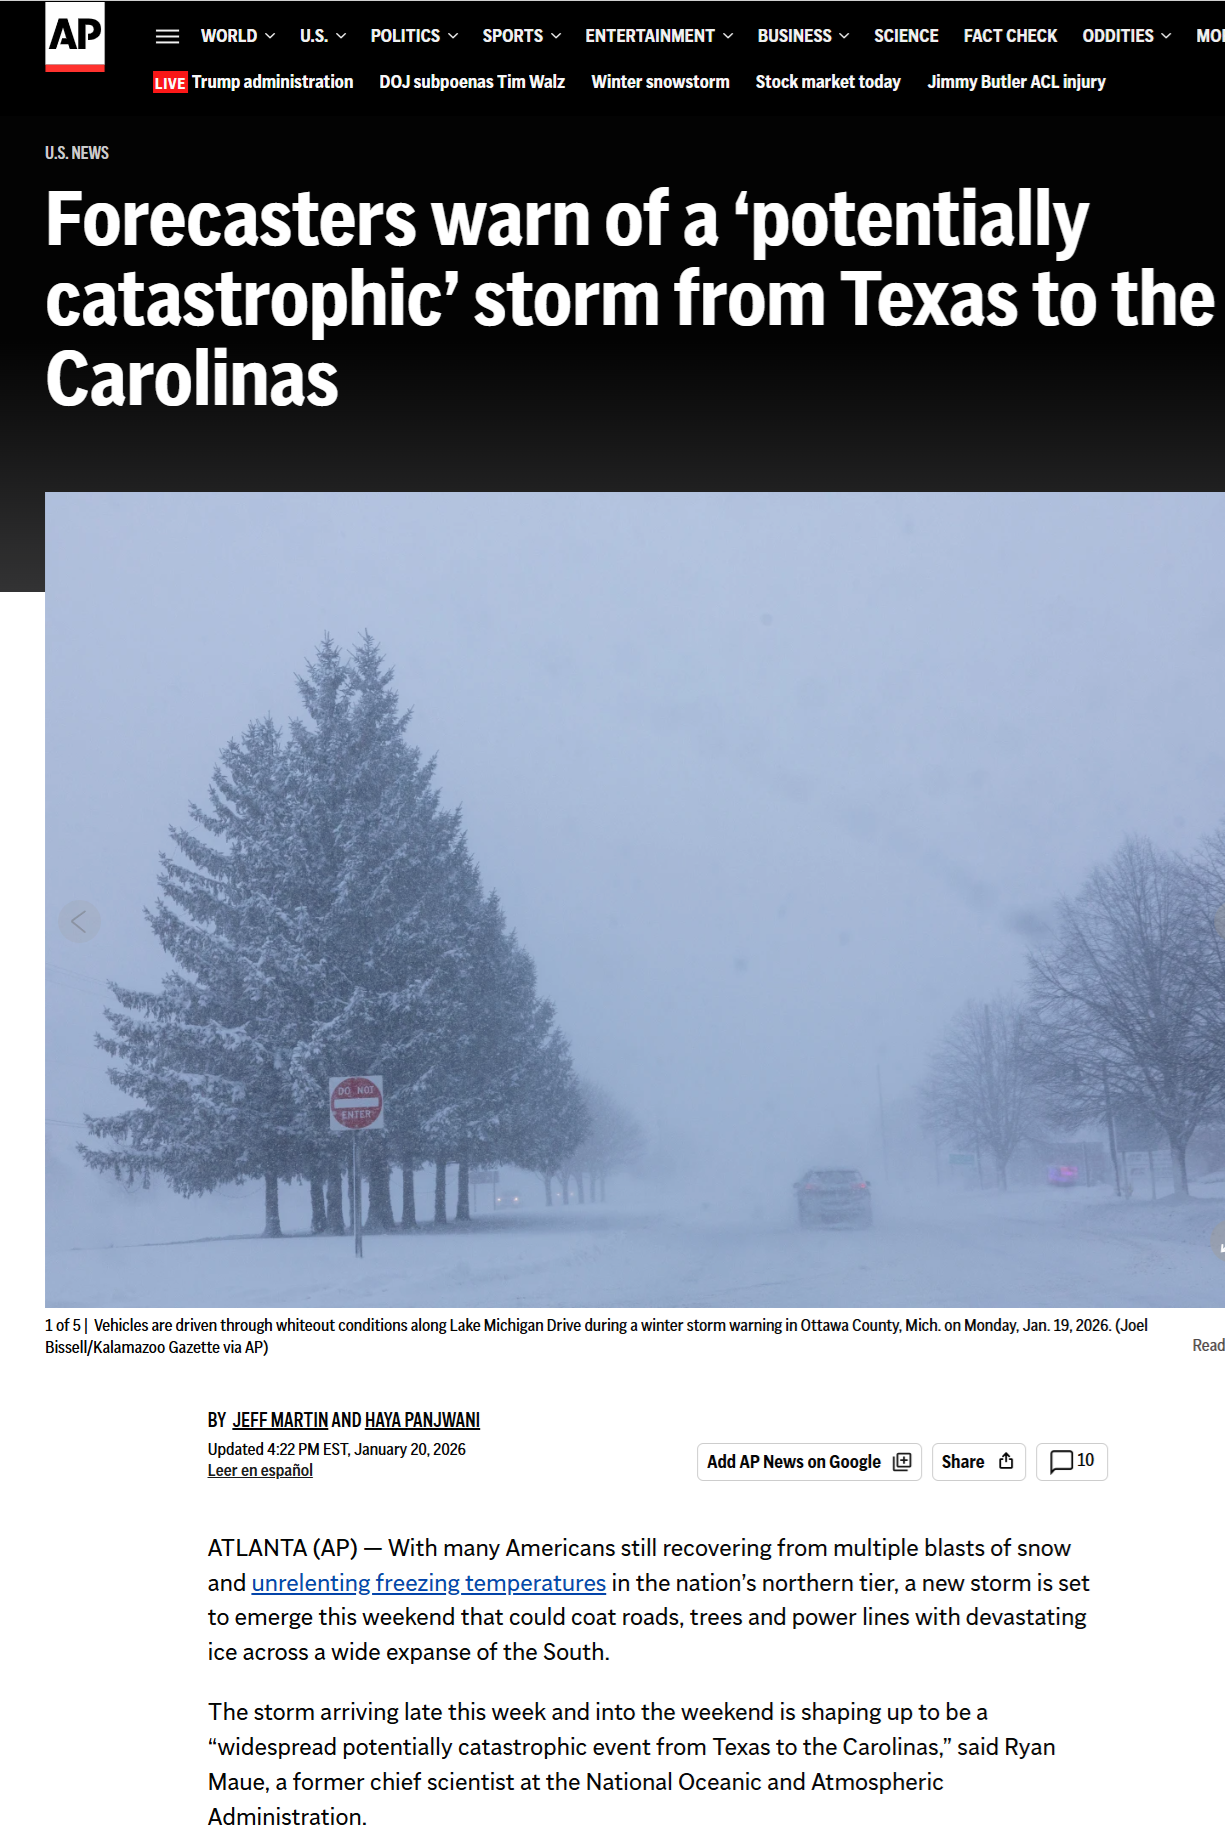
I’m one of the forecasters — here in Atlanta — that does not want to see this catastrophic storm. Some good quotes from earlier chat with AP’s Seth Borenstein from Washington D.C. Bit of a waiting game until more details from the sprawling storm shake out.
Headline Tuesday Evening
Potentially catastrophic winter storm from Texas to the Carolinas with icing and freezing rain + heavy snowfall further north where it will be brutally cold.
The culprit for the “cold plunge” is the tropospheric Polar Vortex
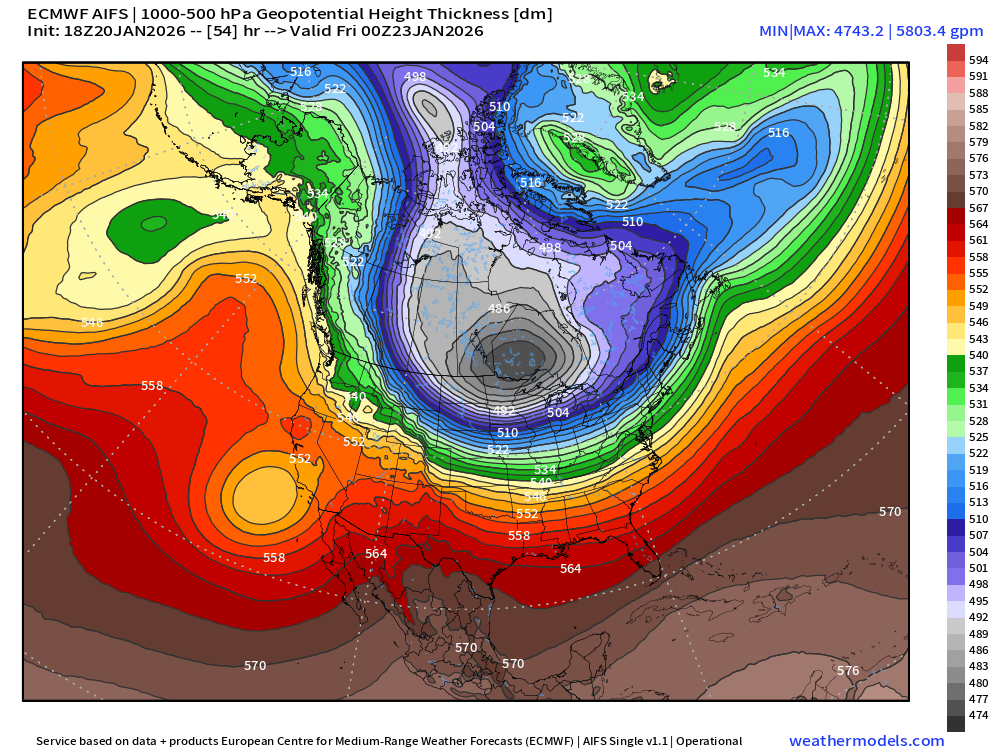
Easy to identify at 500 mb —> right over Ontario north of Lake Superior. The thickness is very low (474 dm) similar to what you’d see in Siberia in the depths of winter.
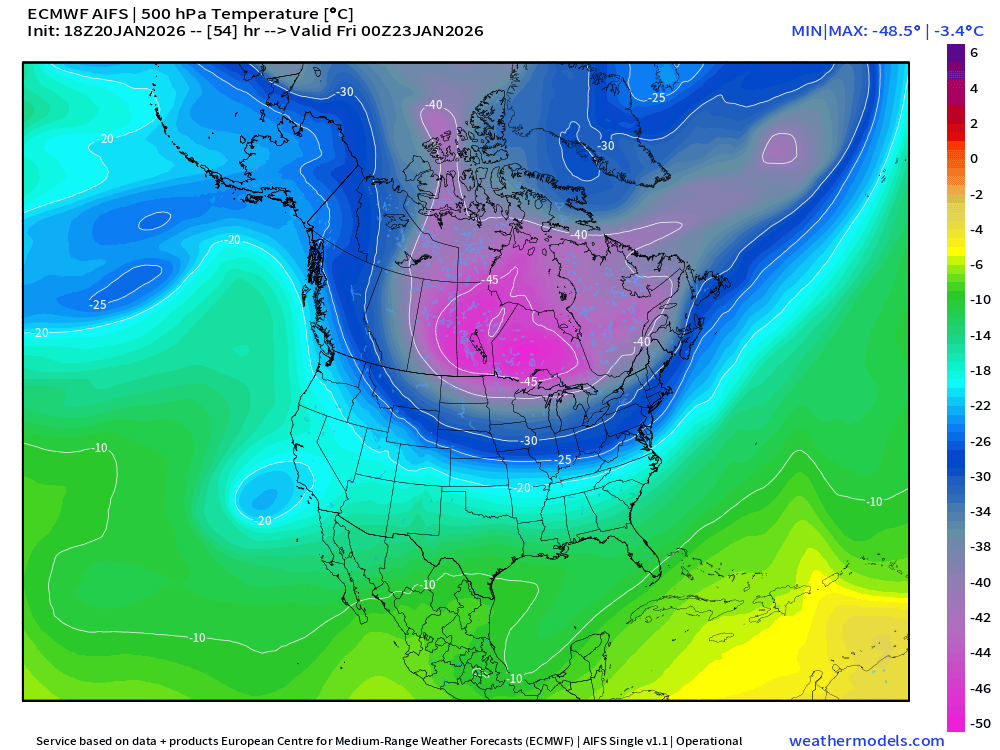
The temperature at 500 mb is -48.5°C (minimum) but a large area of -40°C that shows just how immense this cold pool will become.
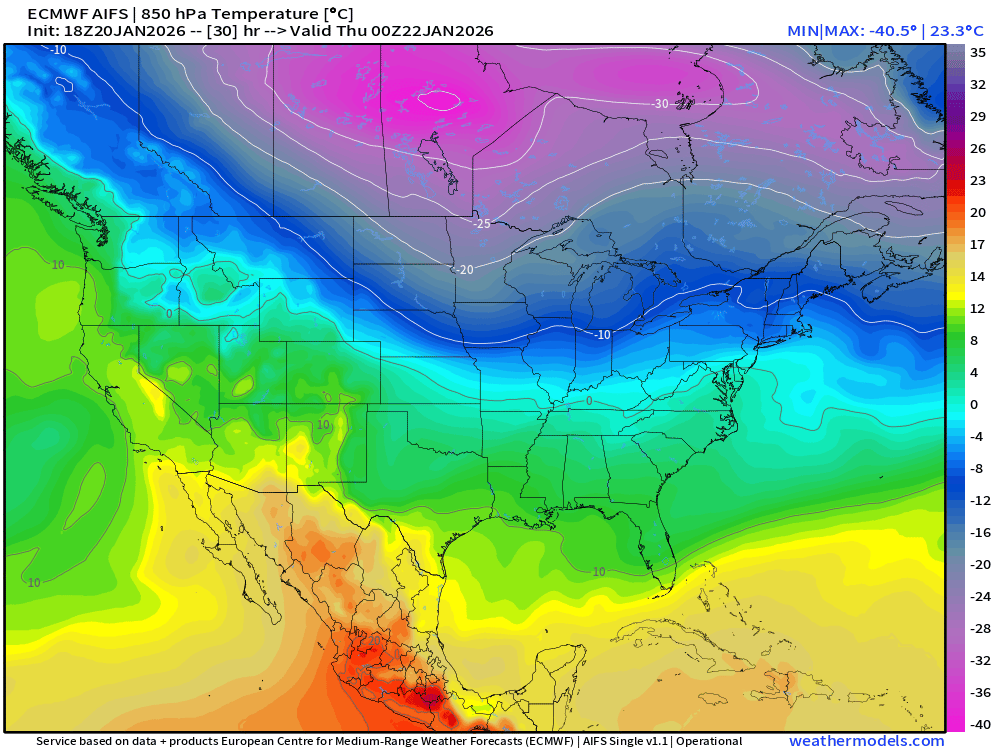
And, at 850 mb —> we have the “old fashioned” -40°C contour over Manitoba.
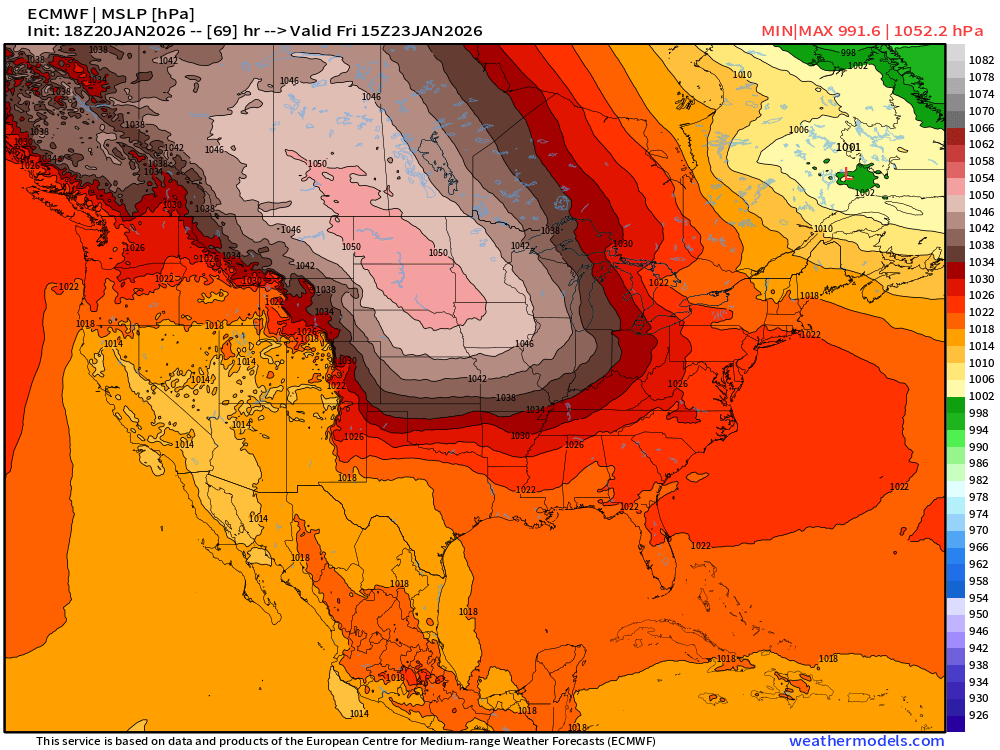
And, on the backside of the mid-level PV anomaly, we have a “honking” surface high at 1052 mb —> actually has gusting winds due to the pressure gradient, and that will add to wind chills.
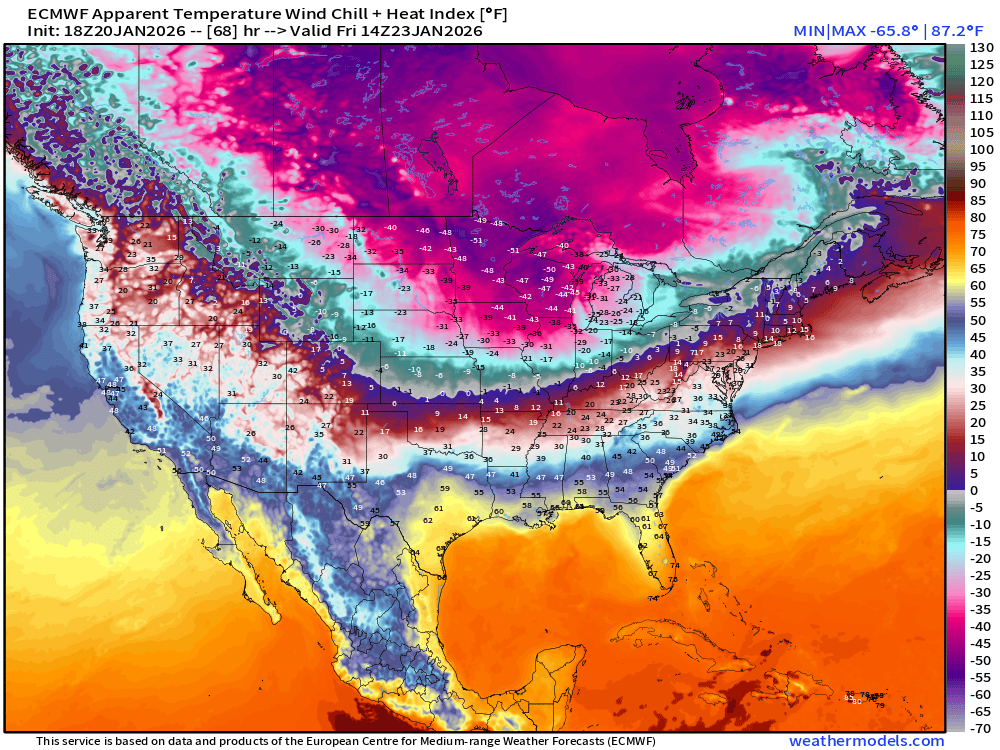
Midwest Wind Chills crash from the -40s to -50s Thursday into Friday
Wind Chills Friday Morning Across the Lower 48
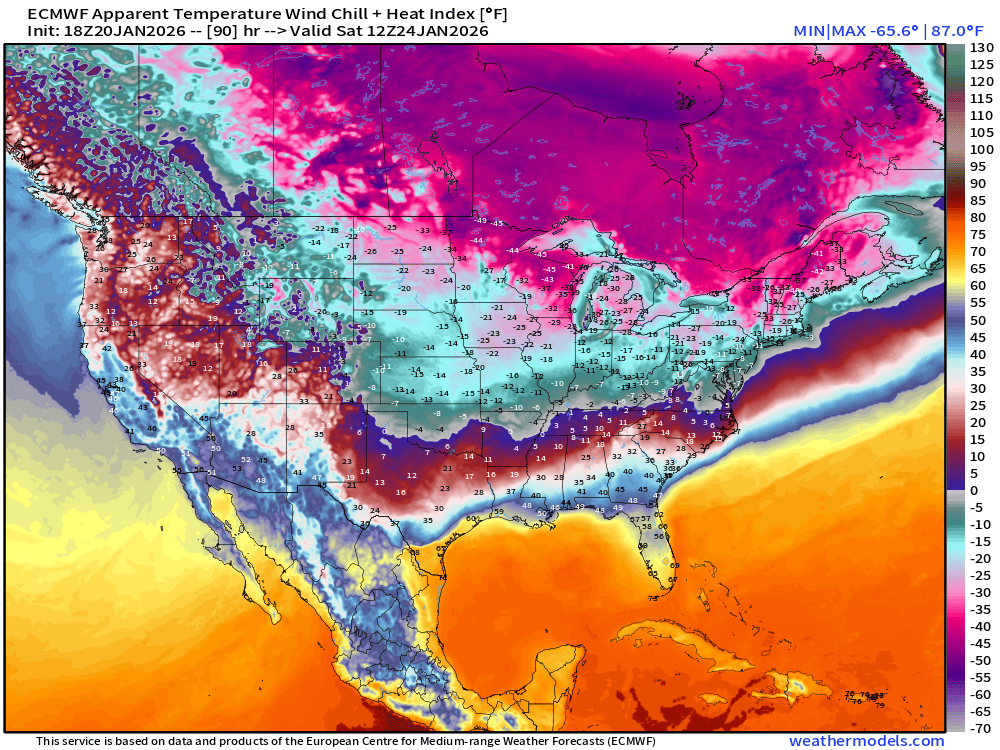
Wind Chills Saturday Morning Across the Lower 48
Integrated Vapor Transport (Atmospheric River) Next 6-days
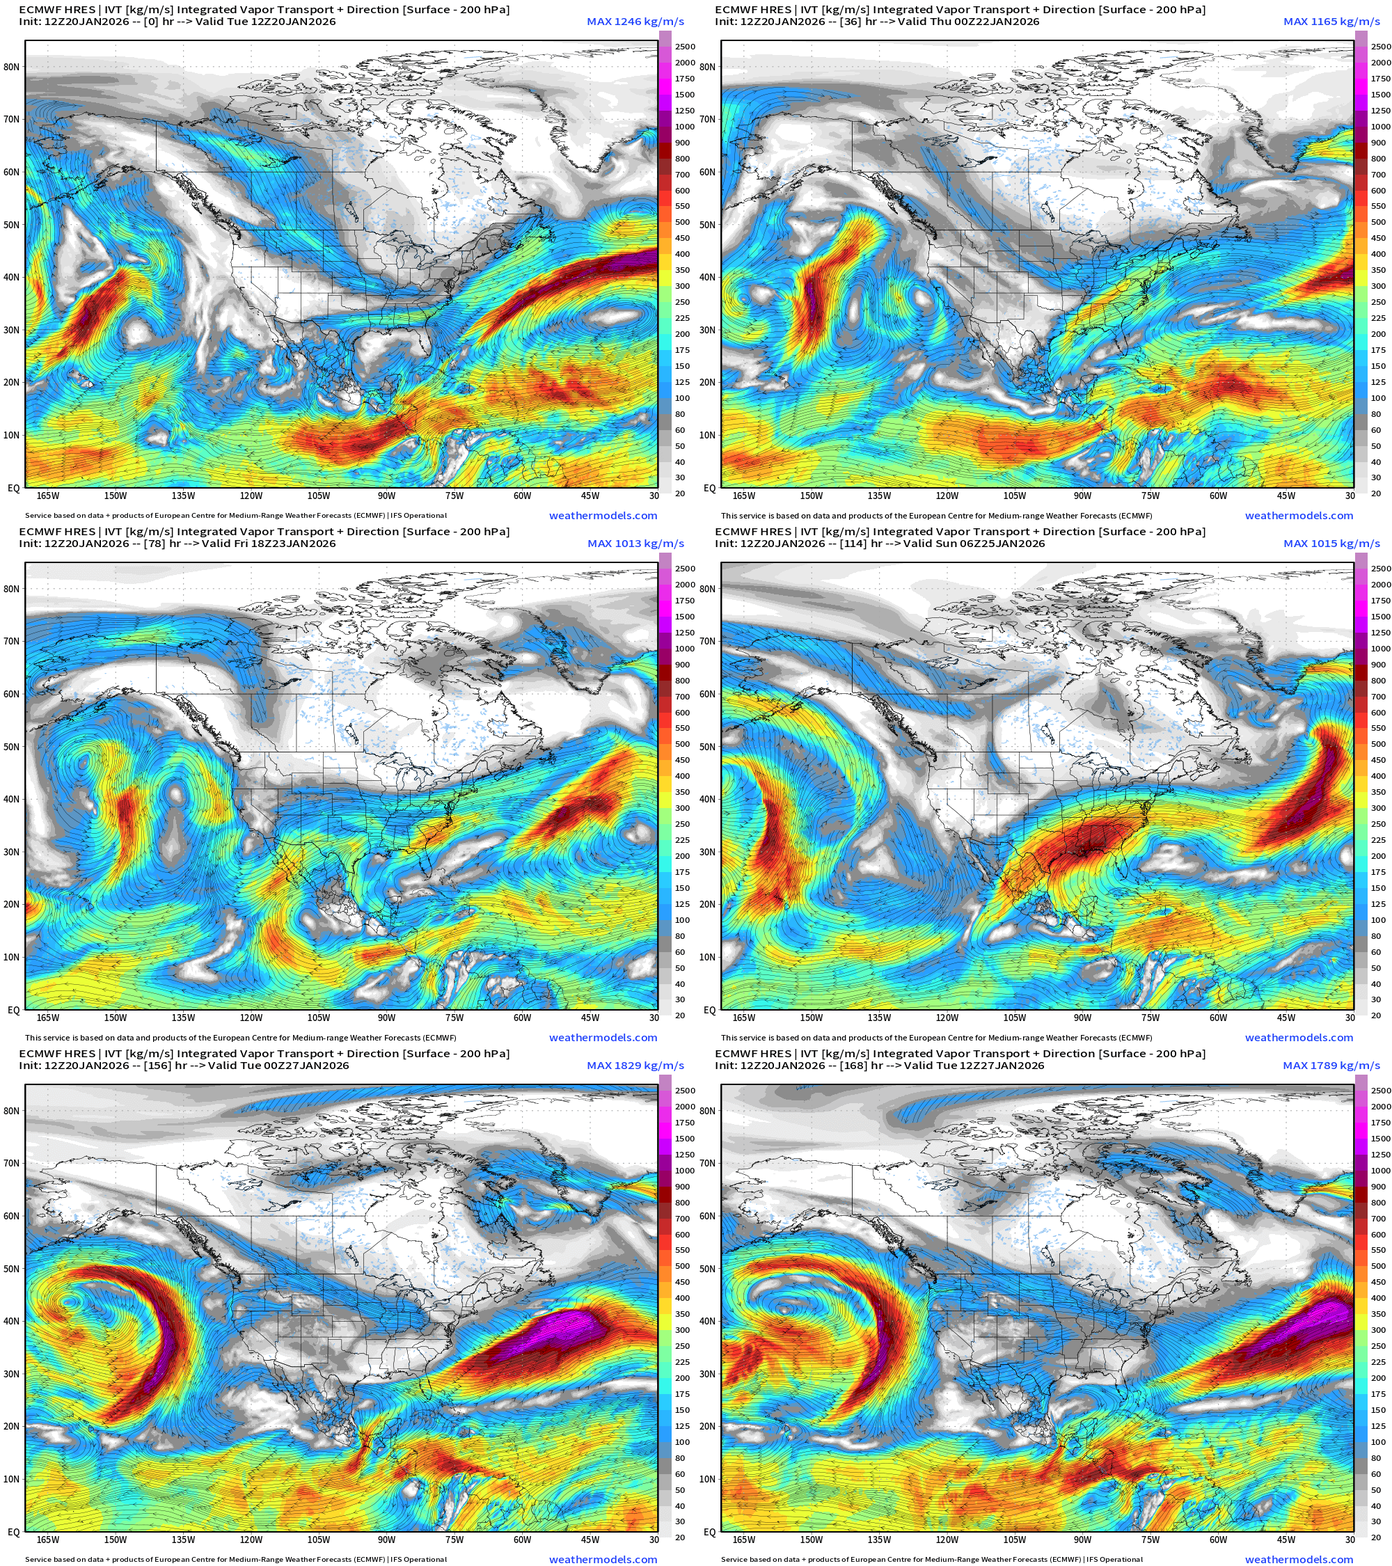
A plume of moisture out of the subtropical Pacific crosses Mexico and combines with a very strong feed (atmospheric river) out of the Gulf of Mexico to fuel the overrunning precipitation into Texas and the South.
Morning Low Temperatures Saturday — median from ECMWF Ensemble at 12z shows a large area of minus 20s and minus 30s across the Midwest and Great Lakes.
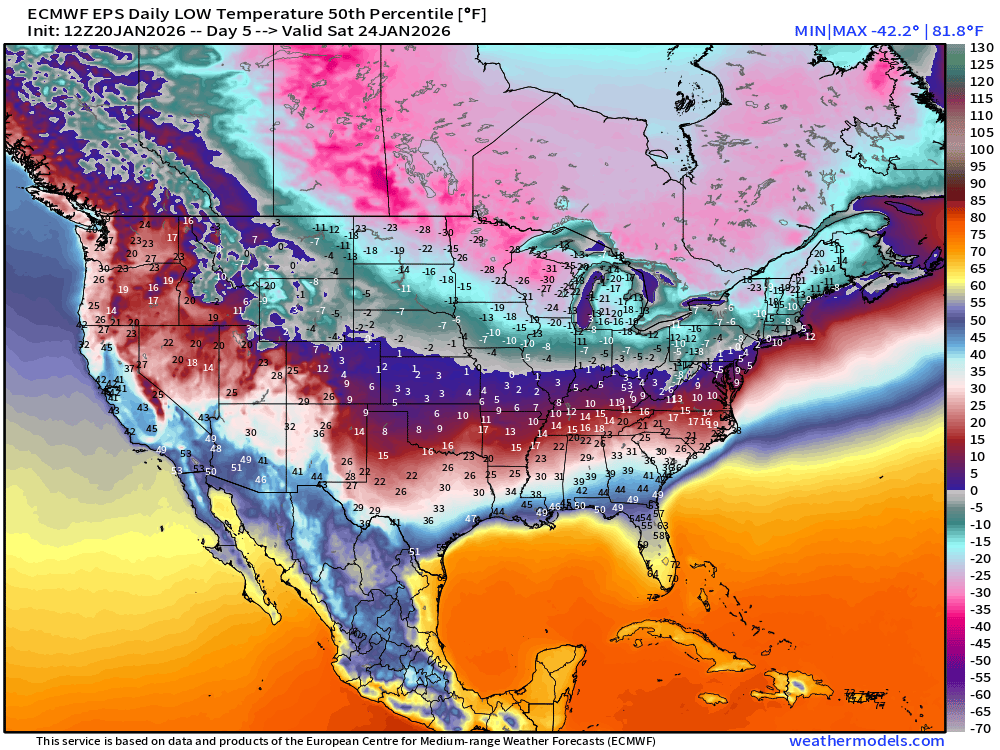
The pink is colder than -20°F and extends across multiple states from the Dakotas to Maine.
We are dealing with the “almost” coldest possible air mass for North America into late January descending out of the Canadian Arctic with assistance from ridge bridge over Siberia.
Flagship ECMWF 12z EPS | Temperature Anomaly | Next 15-days
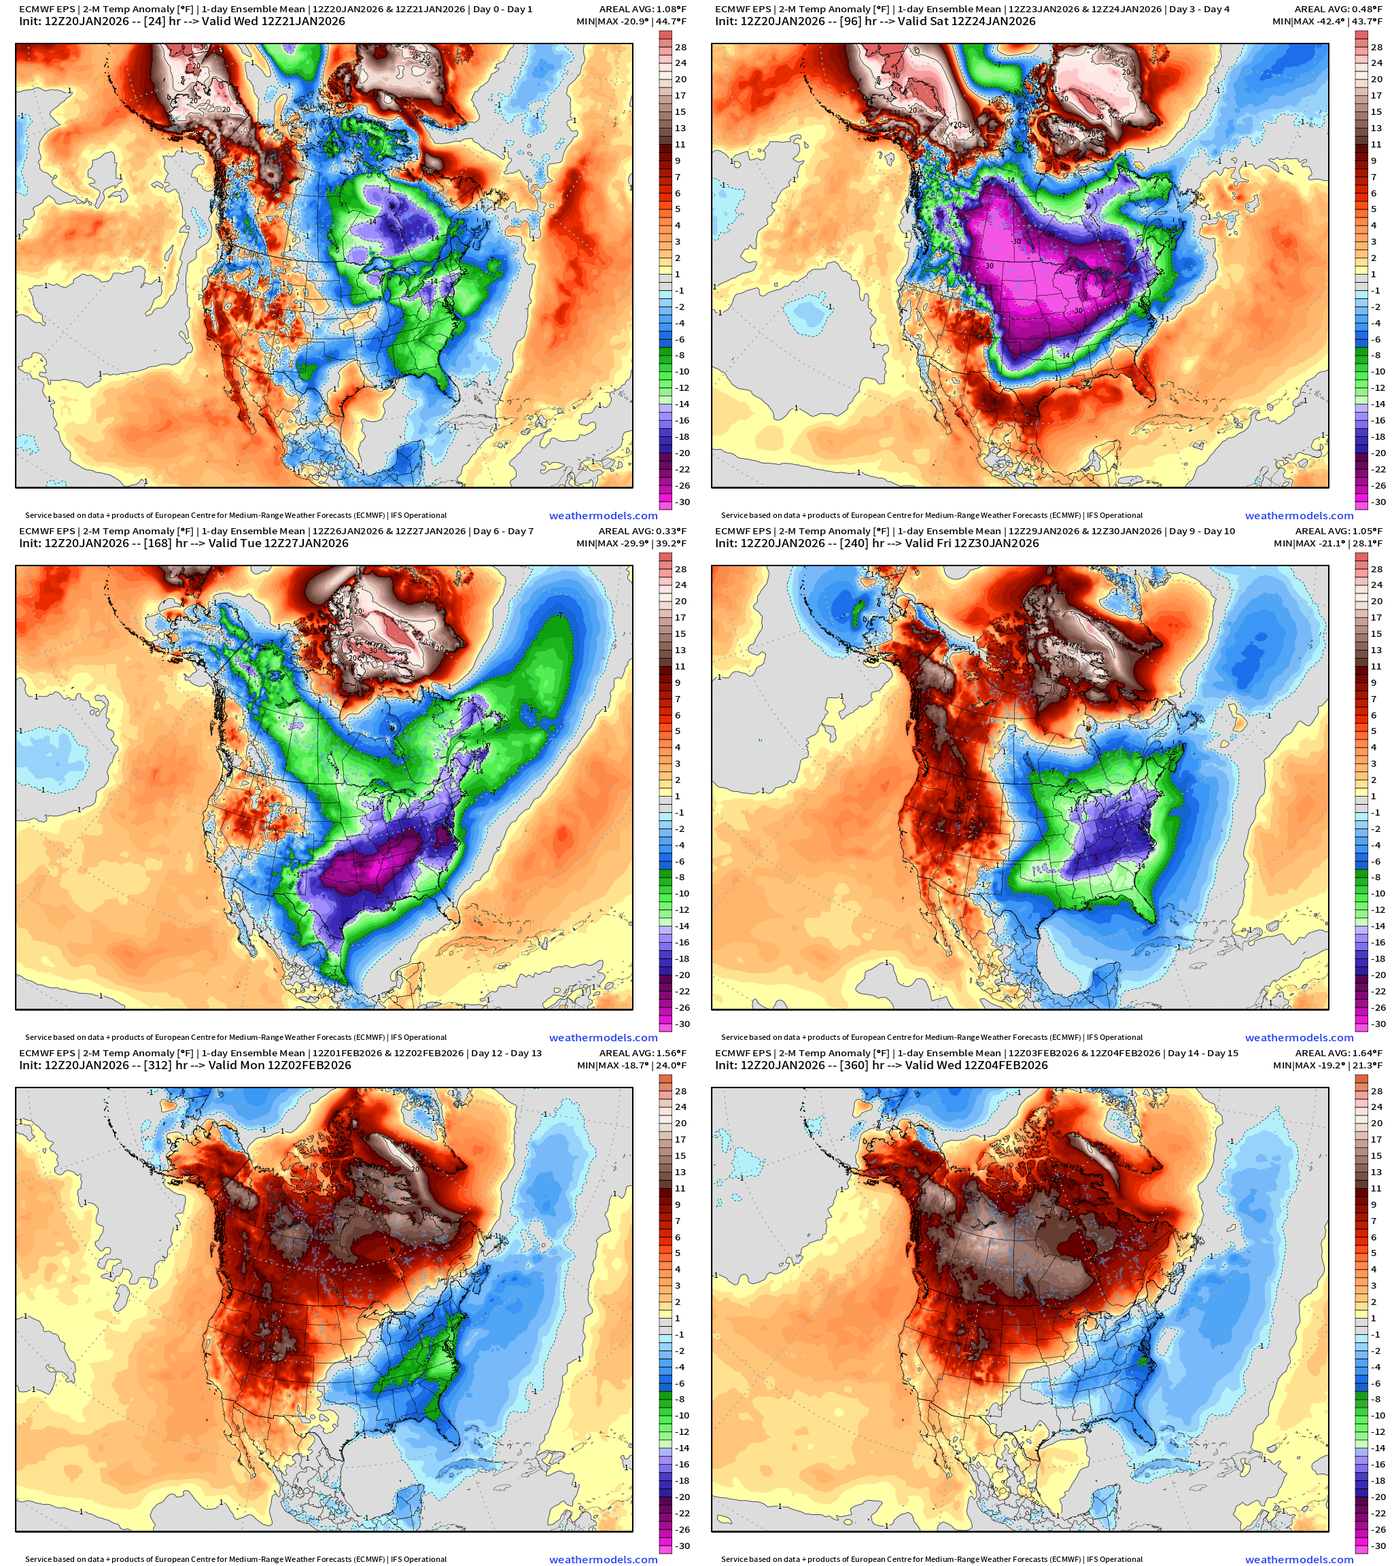
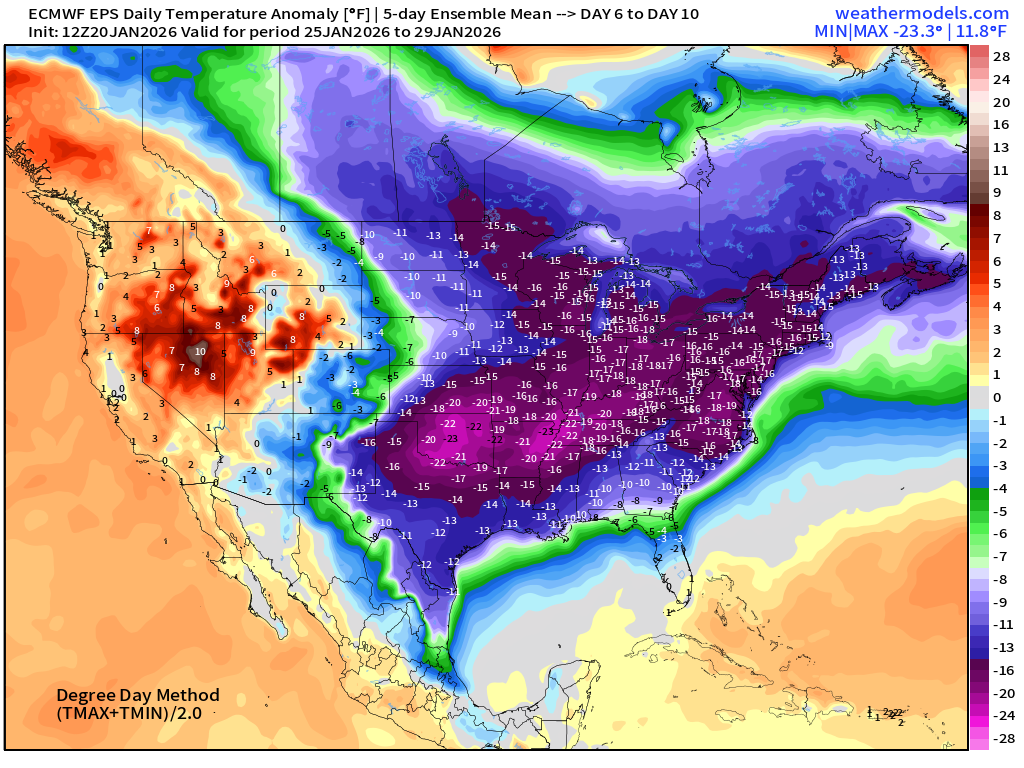
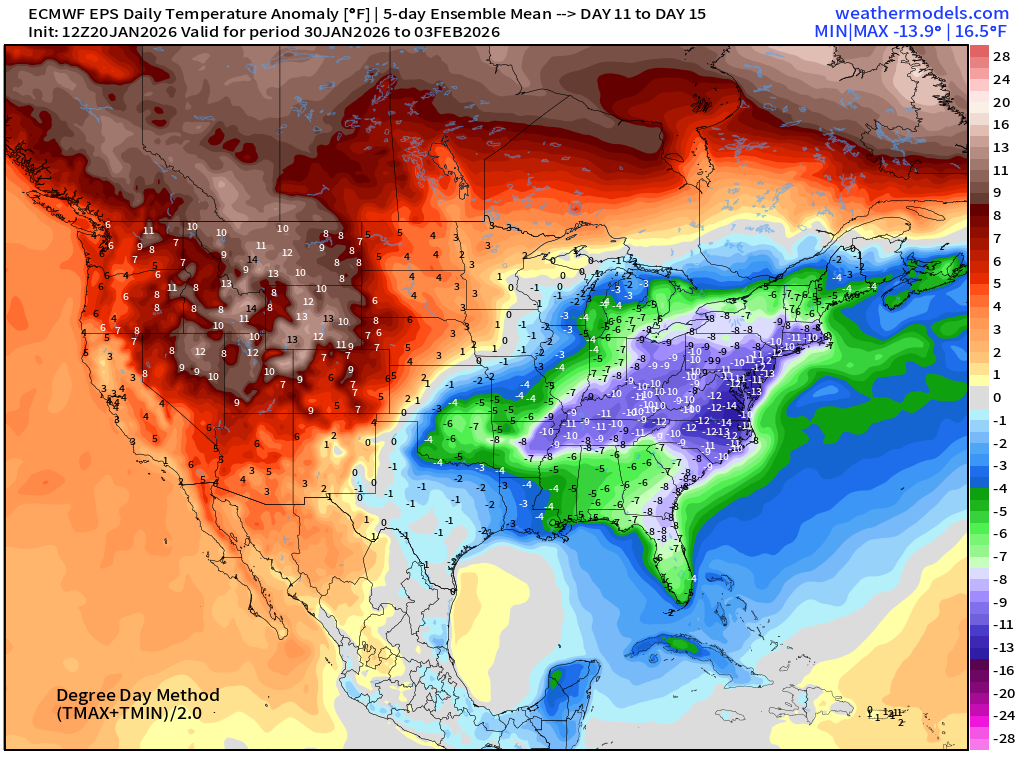
The cold pool gets hung up in Texas before eroding — and then a secondary blast of Arctic air sits in the mid-Atlantic toward days 10-12. The west remains warm — and then widespread warming across Canada as the Siberian Express cold air valve is shut off in the Arctic. Light at the end of the tunnel for early February.
Lower 48 | Low Temperatures through Next Thurs January 29, 2026
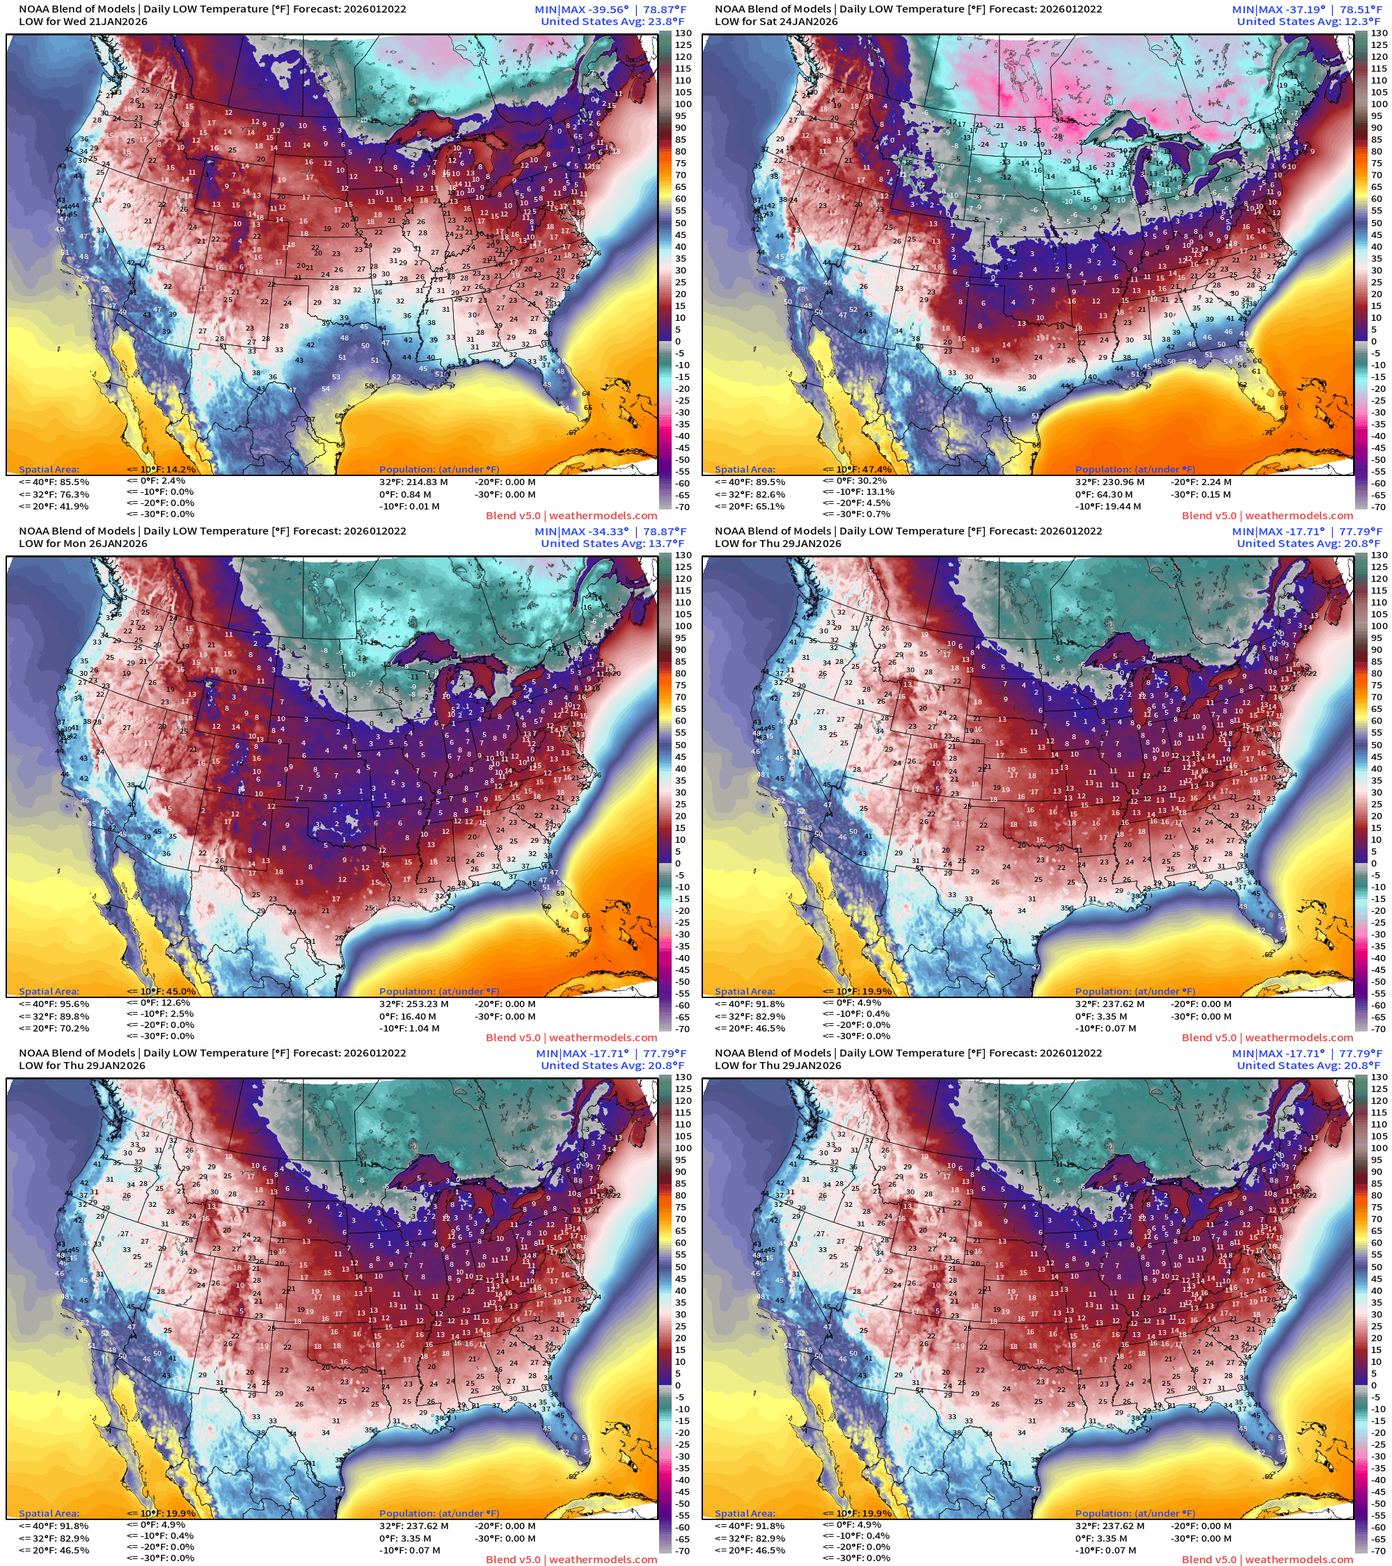
The Blend of Models (v5.0) is rather smooth and is likely underestimating the intensity of the cold next weekend further north — now down to 12.3°F — for a Lower 48 minimum temperature, which is getting us into the range of the most intense polar vortex blasts. We’ll see if that can go down to 10°F tomorrow.
ECMWF 18z | Temperature Anomaly Next 6-days
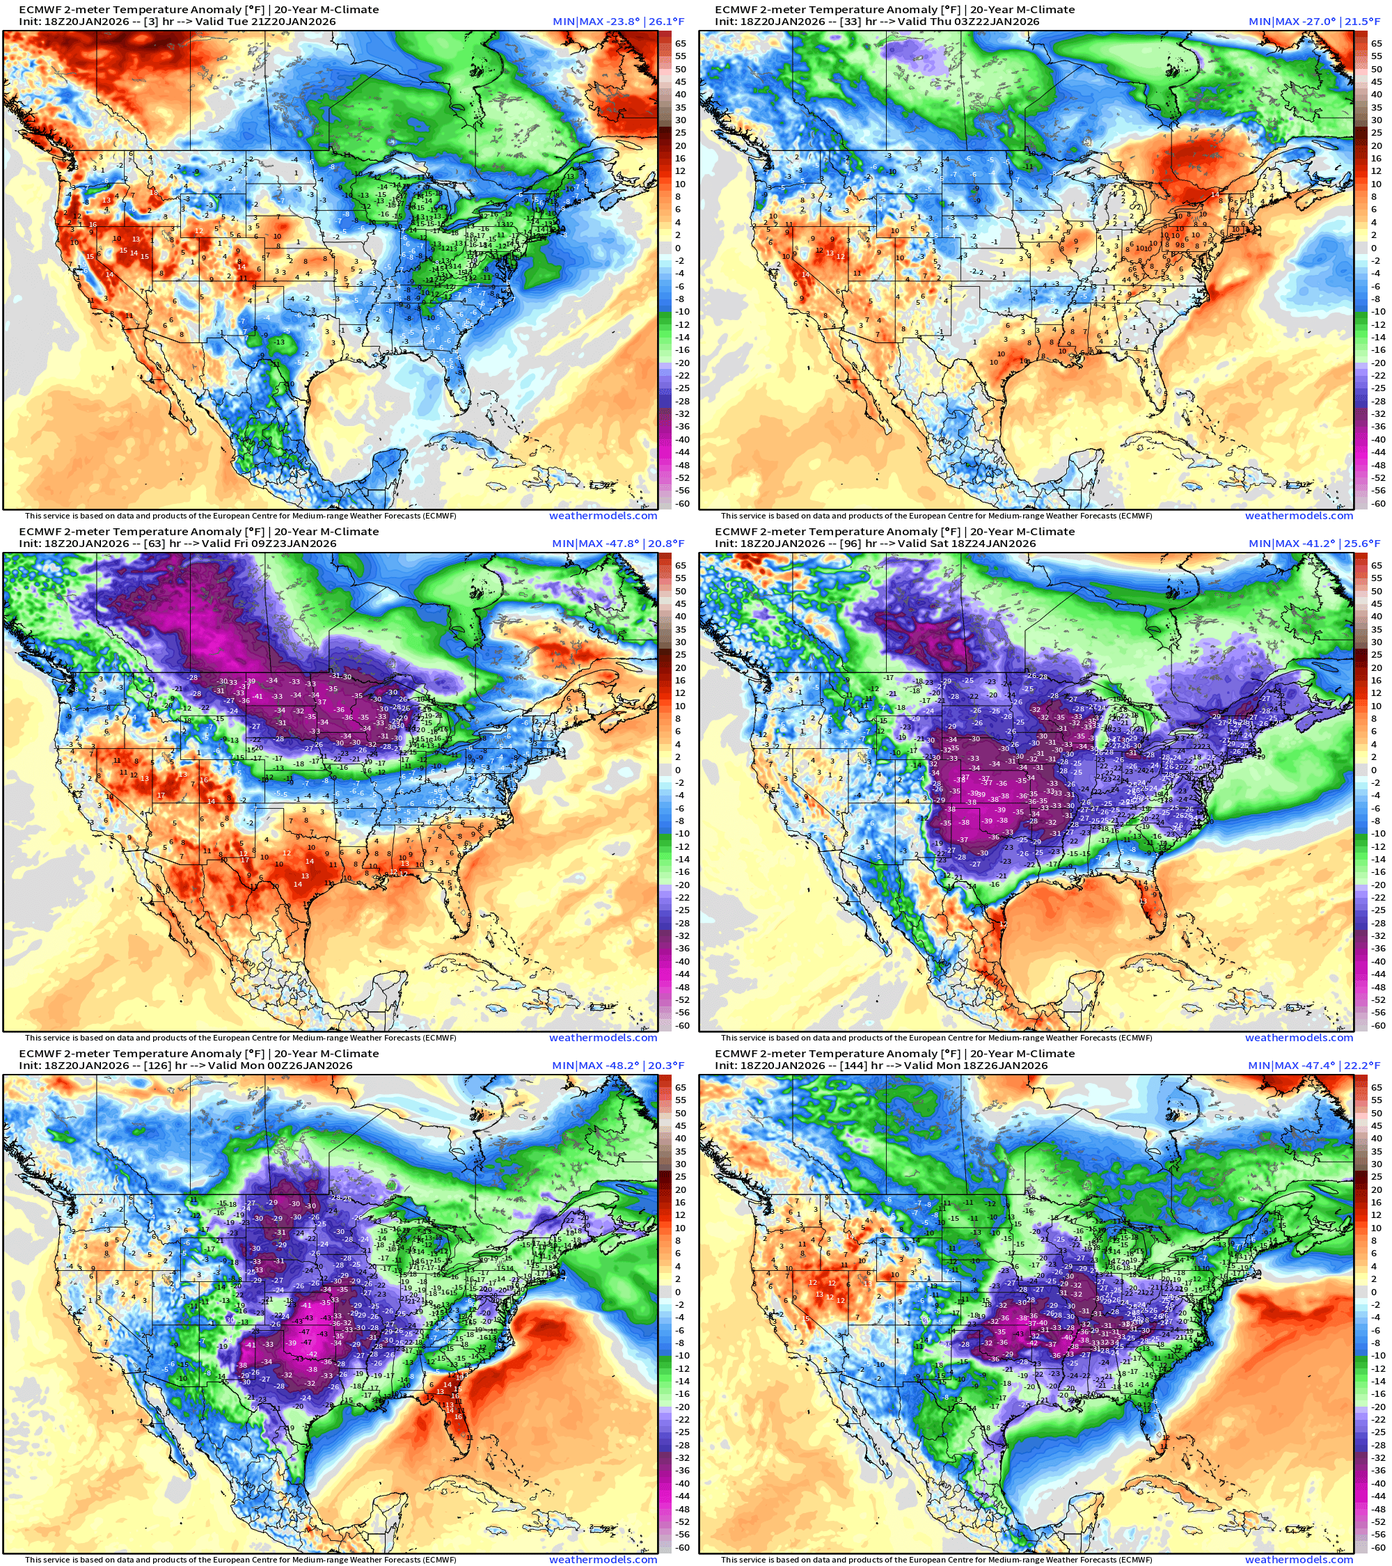
Larger scale view: Extremely cold air intensifies in southern Canada and then floods southward into Lower 48 — dumps into Texas by Saturday and stays there — with potential of a major ice storm as boatloads of subtropical moisture overruns the Arctic air — from Texas through the south into the Carolinas. Complete mess.
ECMWF AIFS-Single 18z | Height Anomaly (500 hPa) Next 10-days
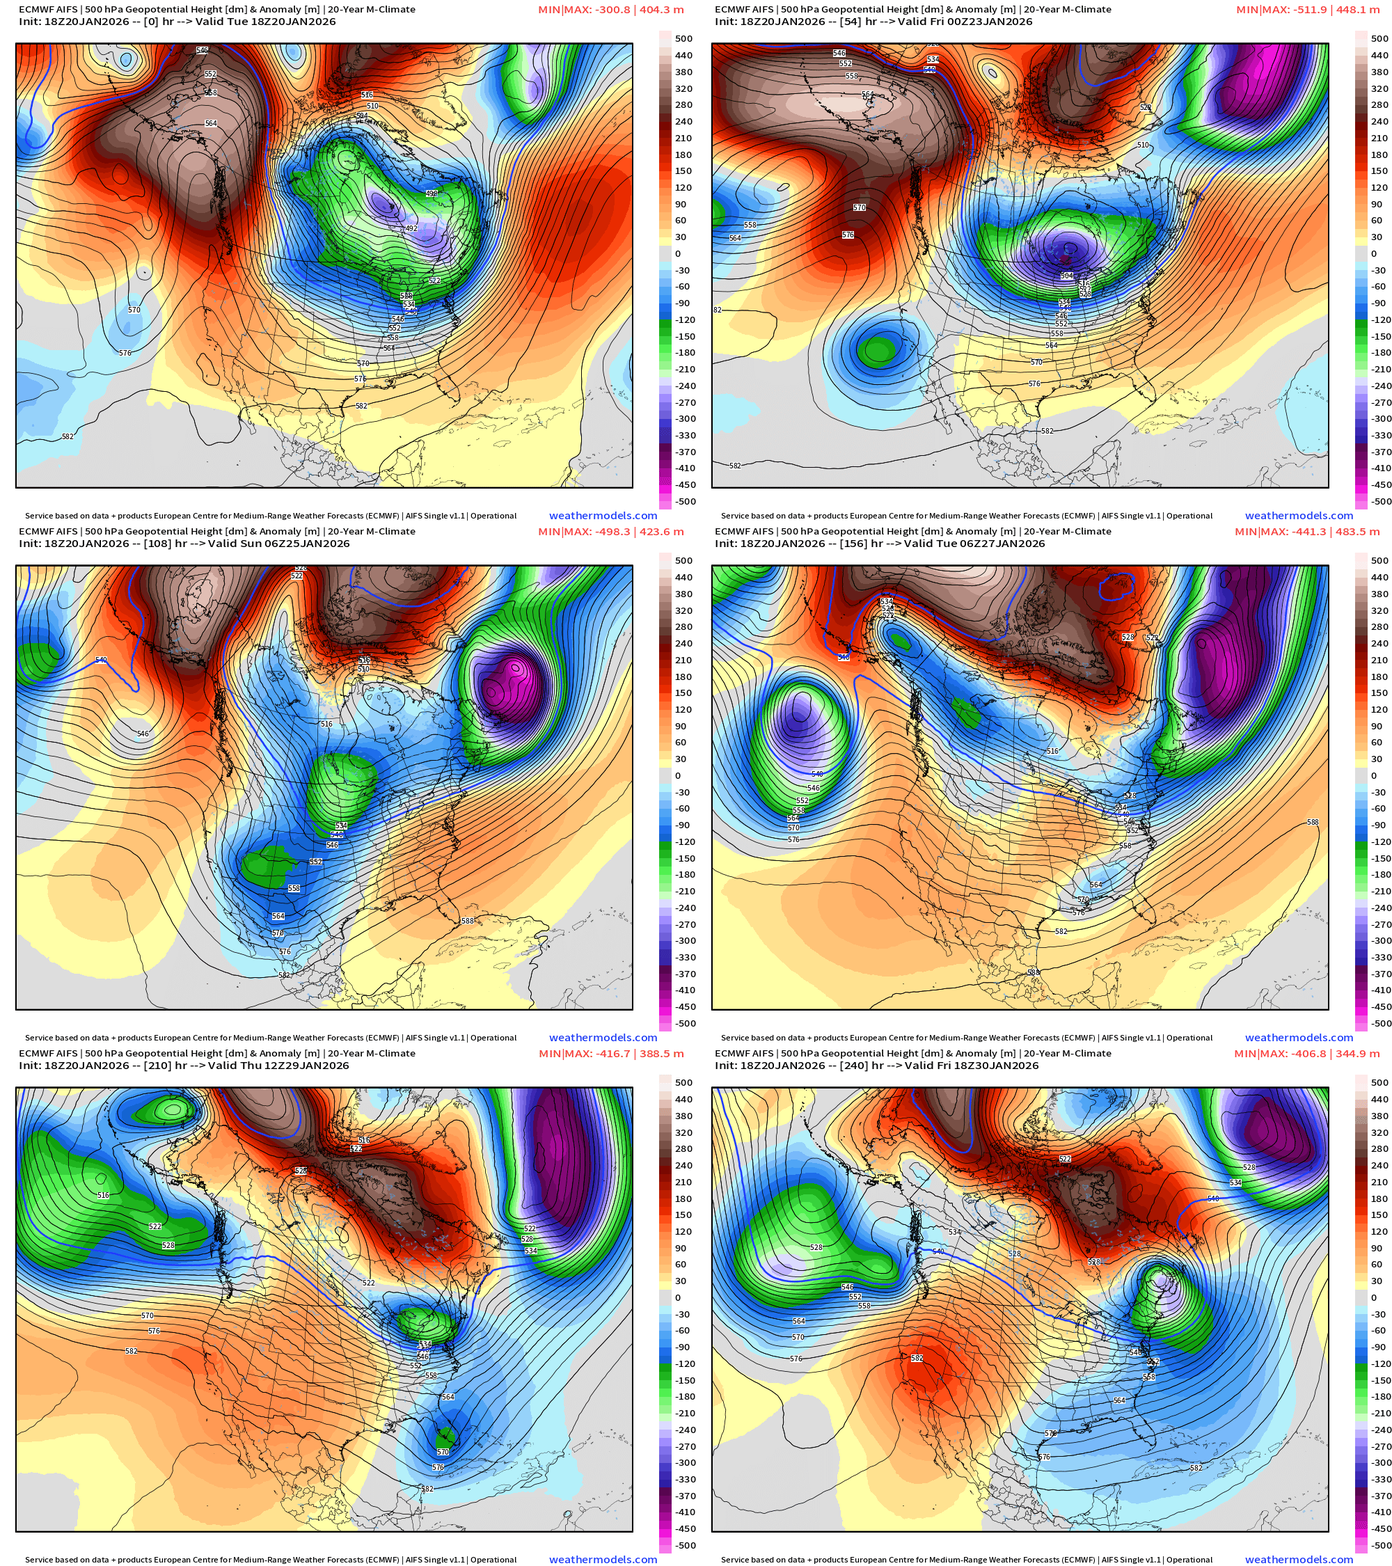
Multiple polar vortex (PV) anomalies drop out of Canada circulating around the main polar front or cold pool centered over southern Canada (Ontario)
ECMWF AIFS-Single 18z | Temperature (500 hPa) Next 10-days
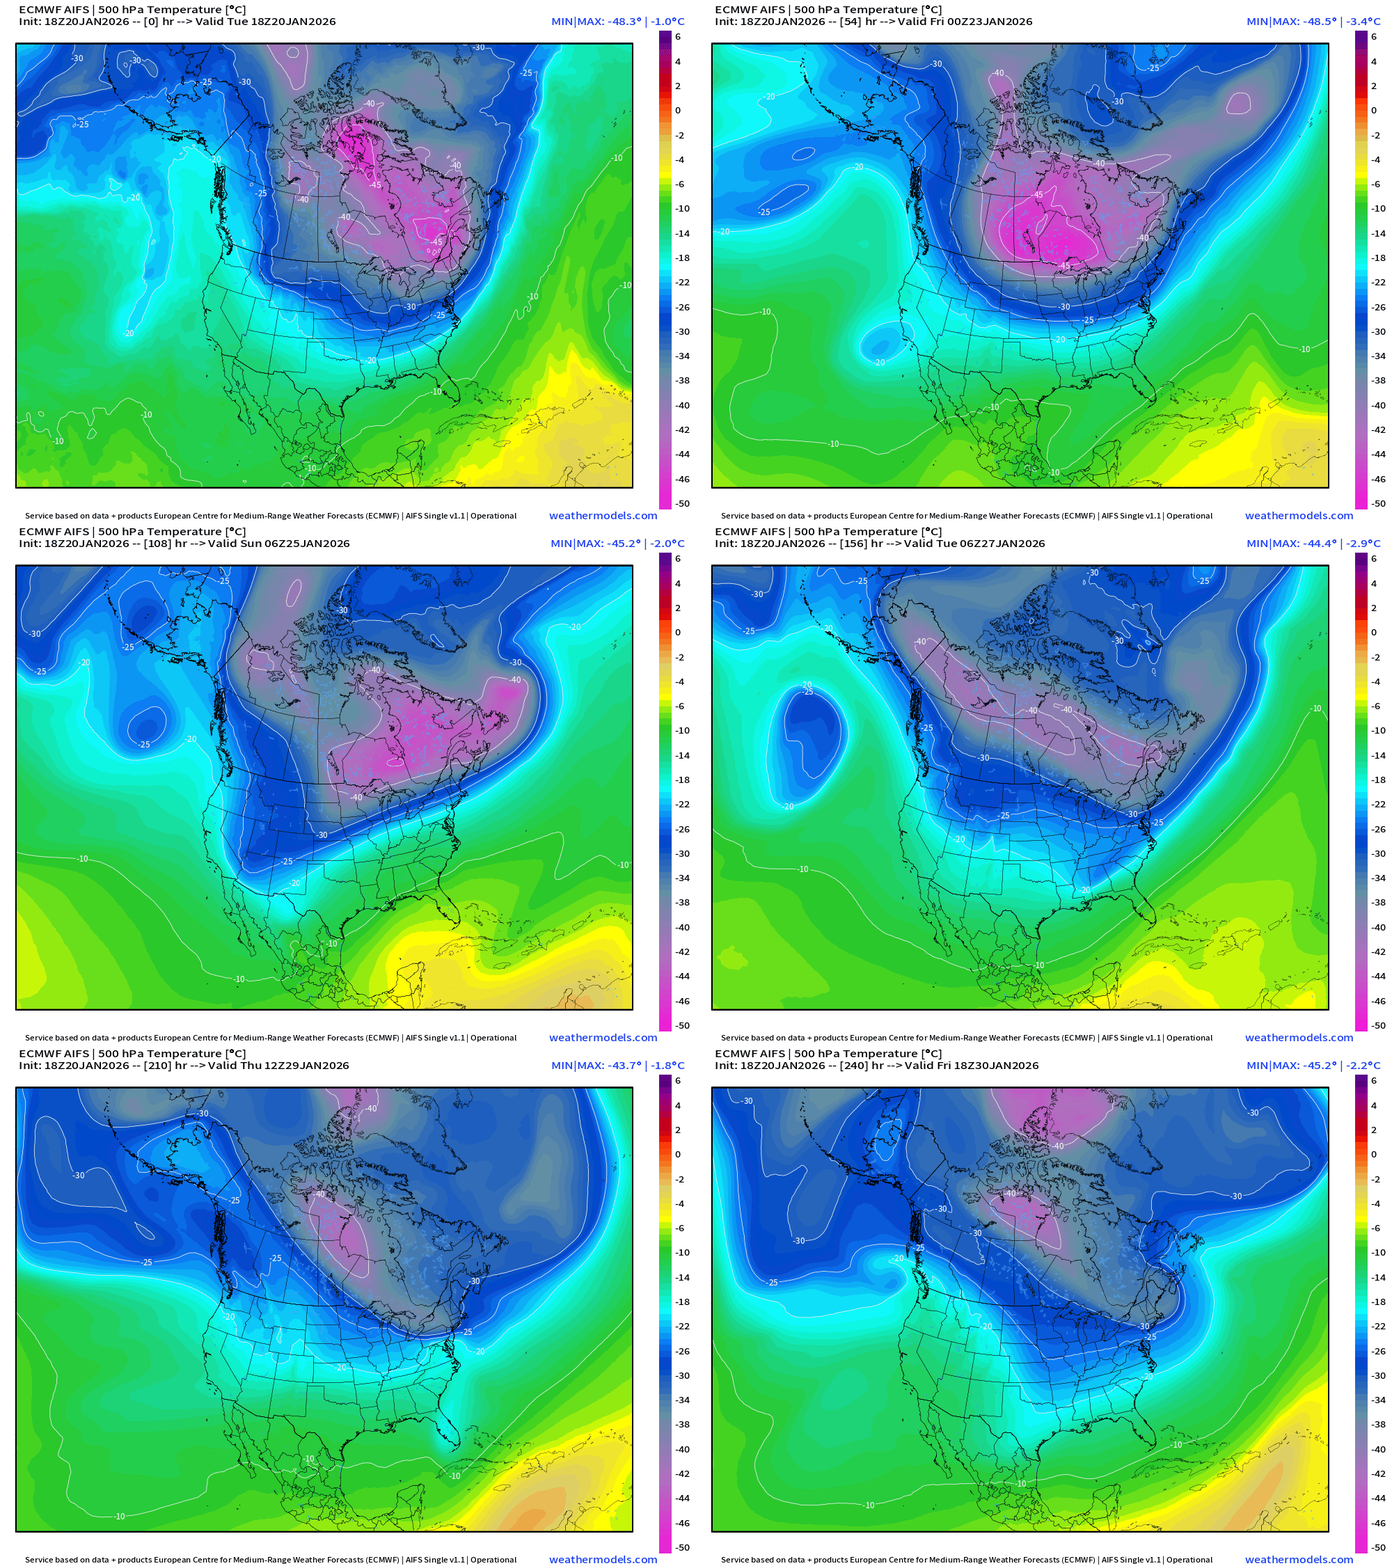
The temperature at 500 mb is the easiest way to highlight the “polar vortex” across North America with the coldest pool at -40°C (pink) with the -25°C contour usually associated with below freezing temperatures at 2-meters (surface).
The Western U.S. and Pacific Northwest ridge is very apparent and firmly entrenched vs. the Hudson Bay / Arctic Canada undulations are dipping southward into the eastern U.S. = cold.
AIFS-Single Snowfall Through 10-days
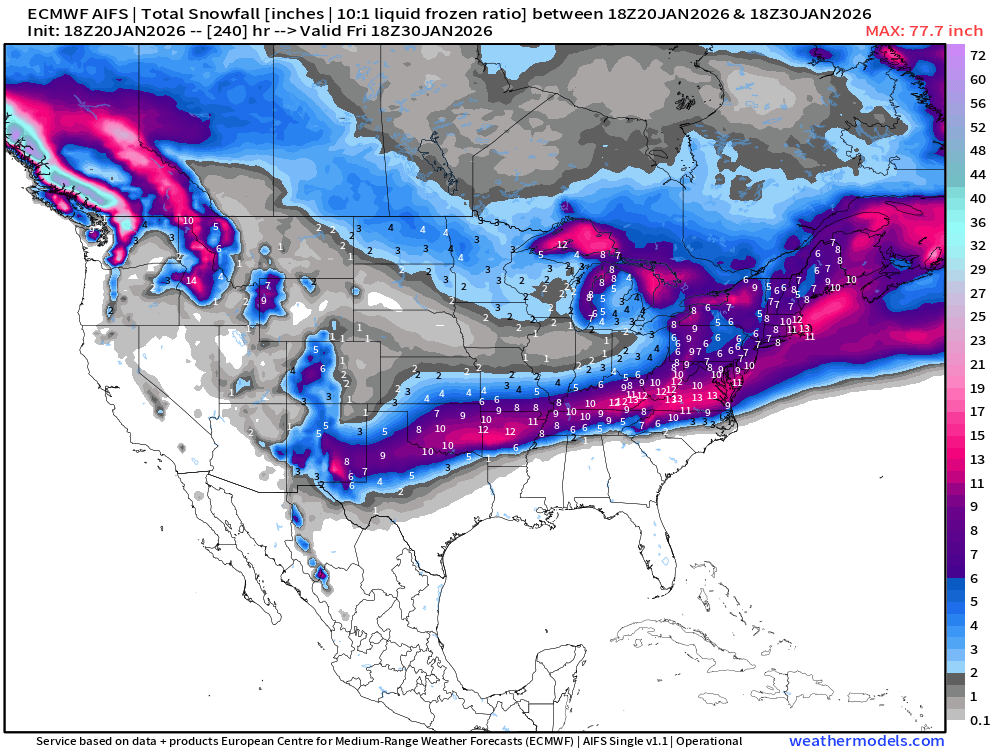
The current forecast cycle has snowfall from West Texas through Dallas (on the edge) into Little Rock and then Nashville to Virginia.
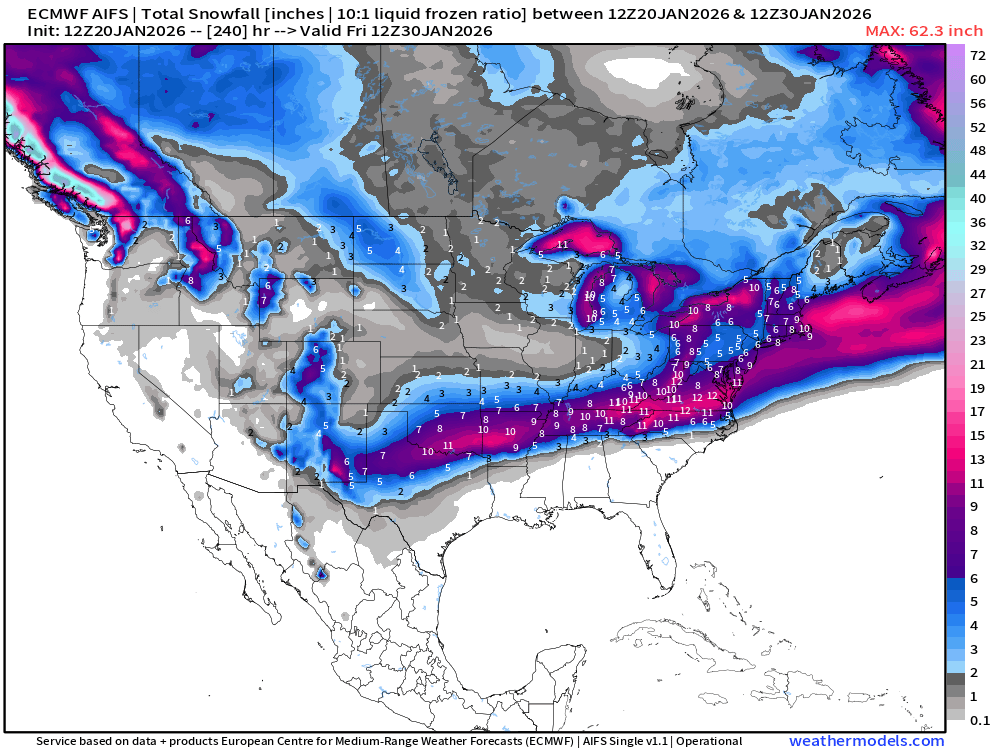
Similar to the previous 12z Cycle
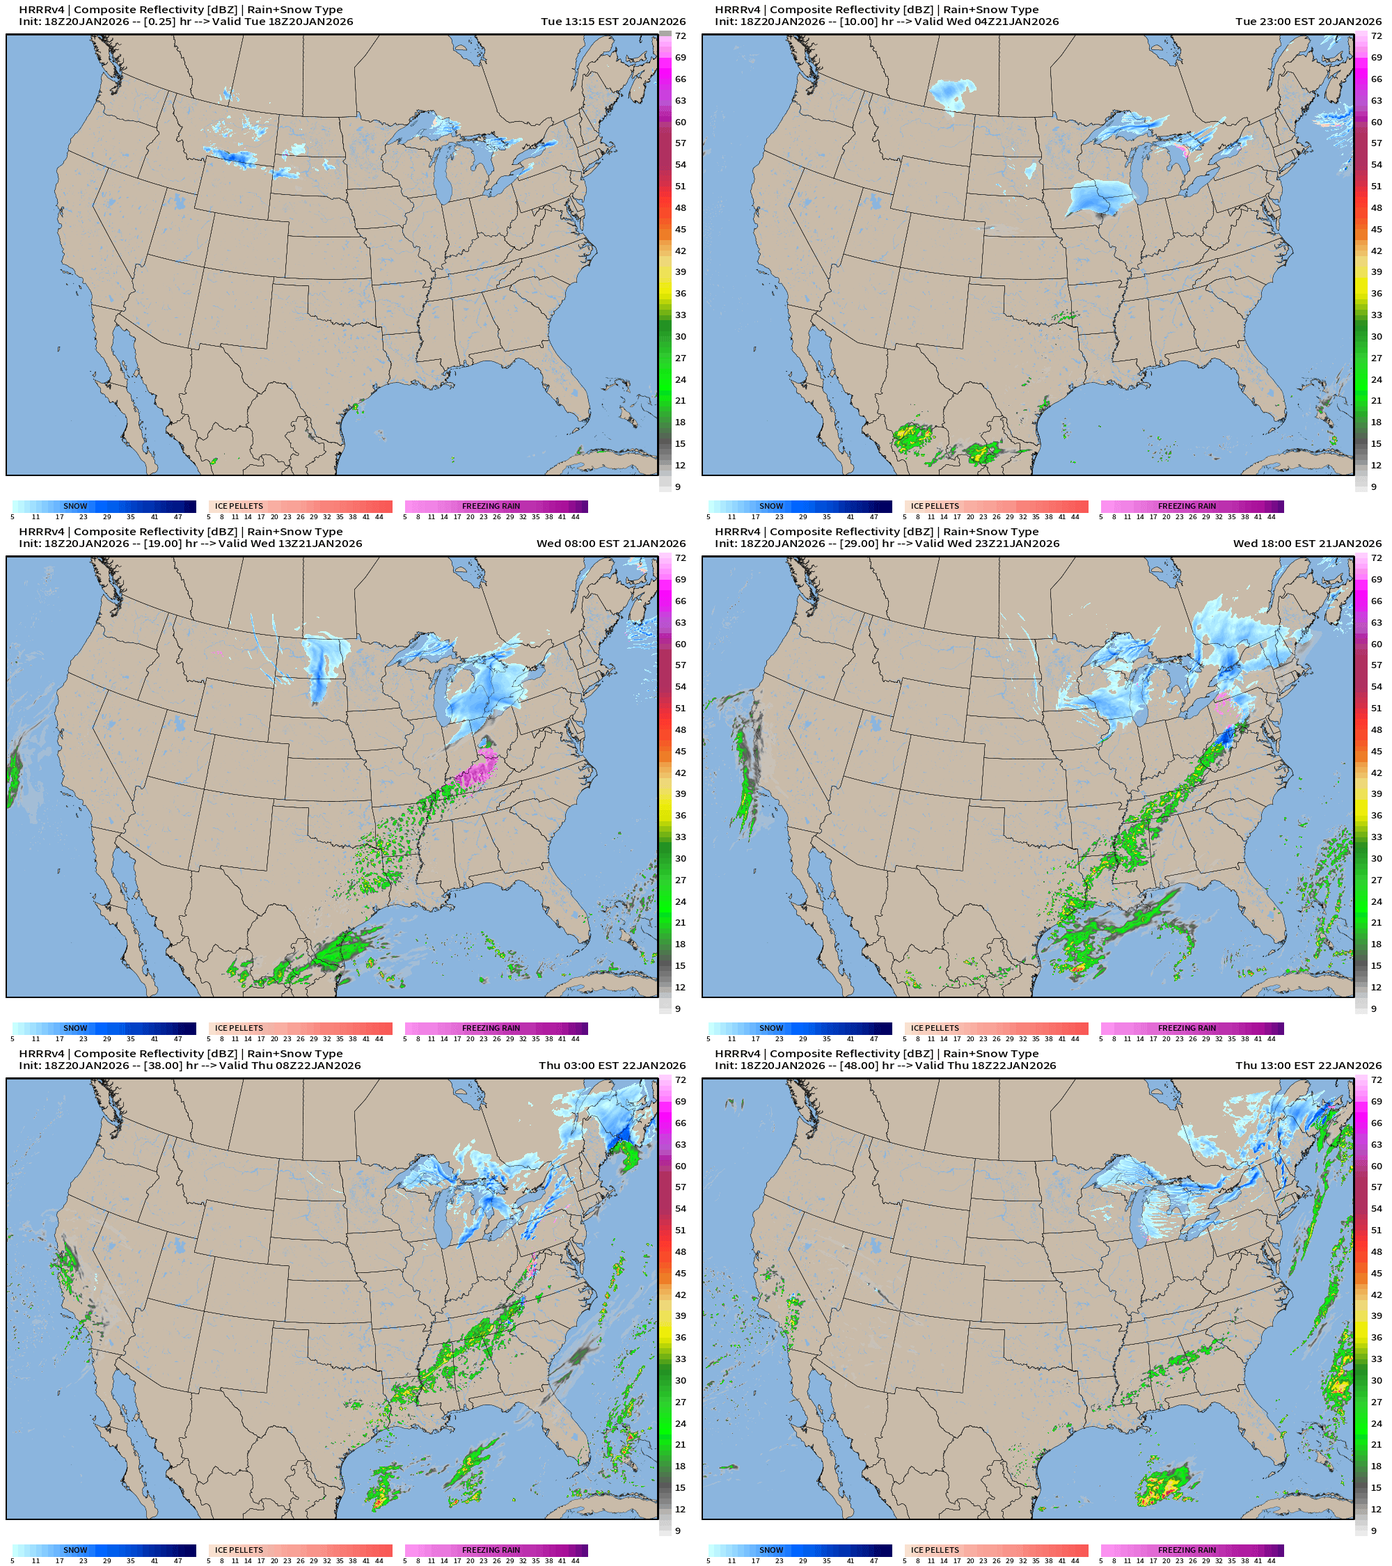
HRRR Next 48-hours Radar | Through Wednesday 1 PM ET
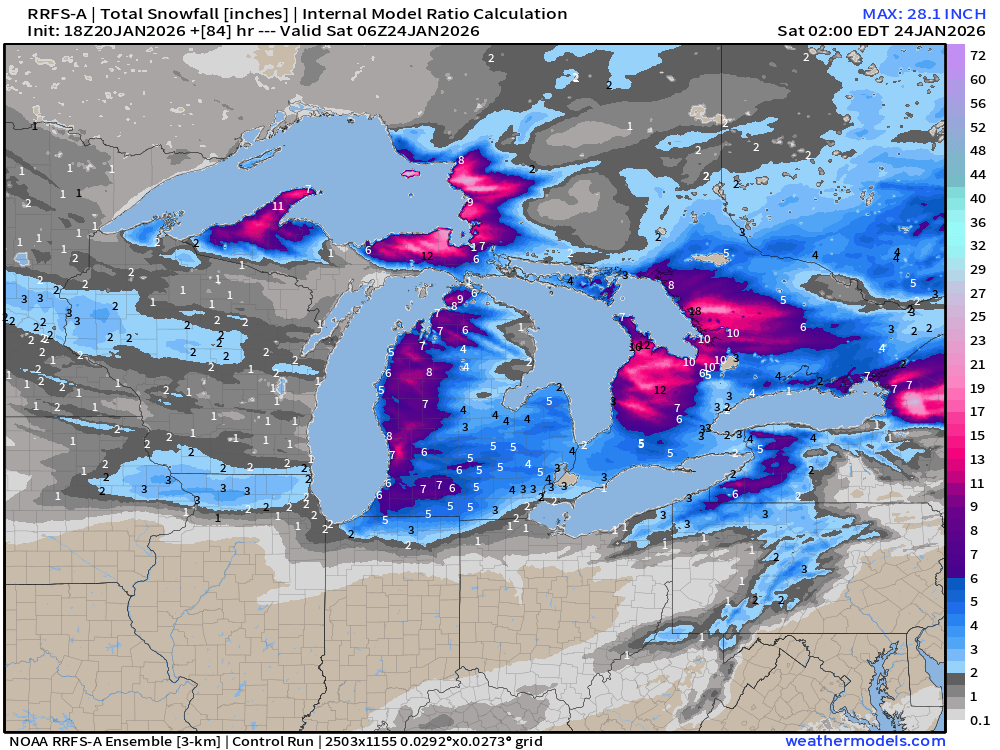
RRFS-A nicely paints the Lake Effect Snow over the next 84-hours
ECMWF 18z | Precipitable Water Next 6-days | My Favorite Parameter
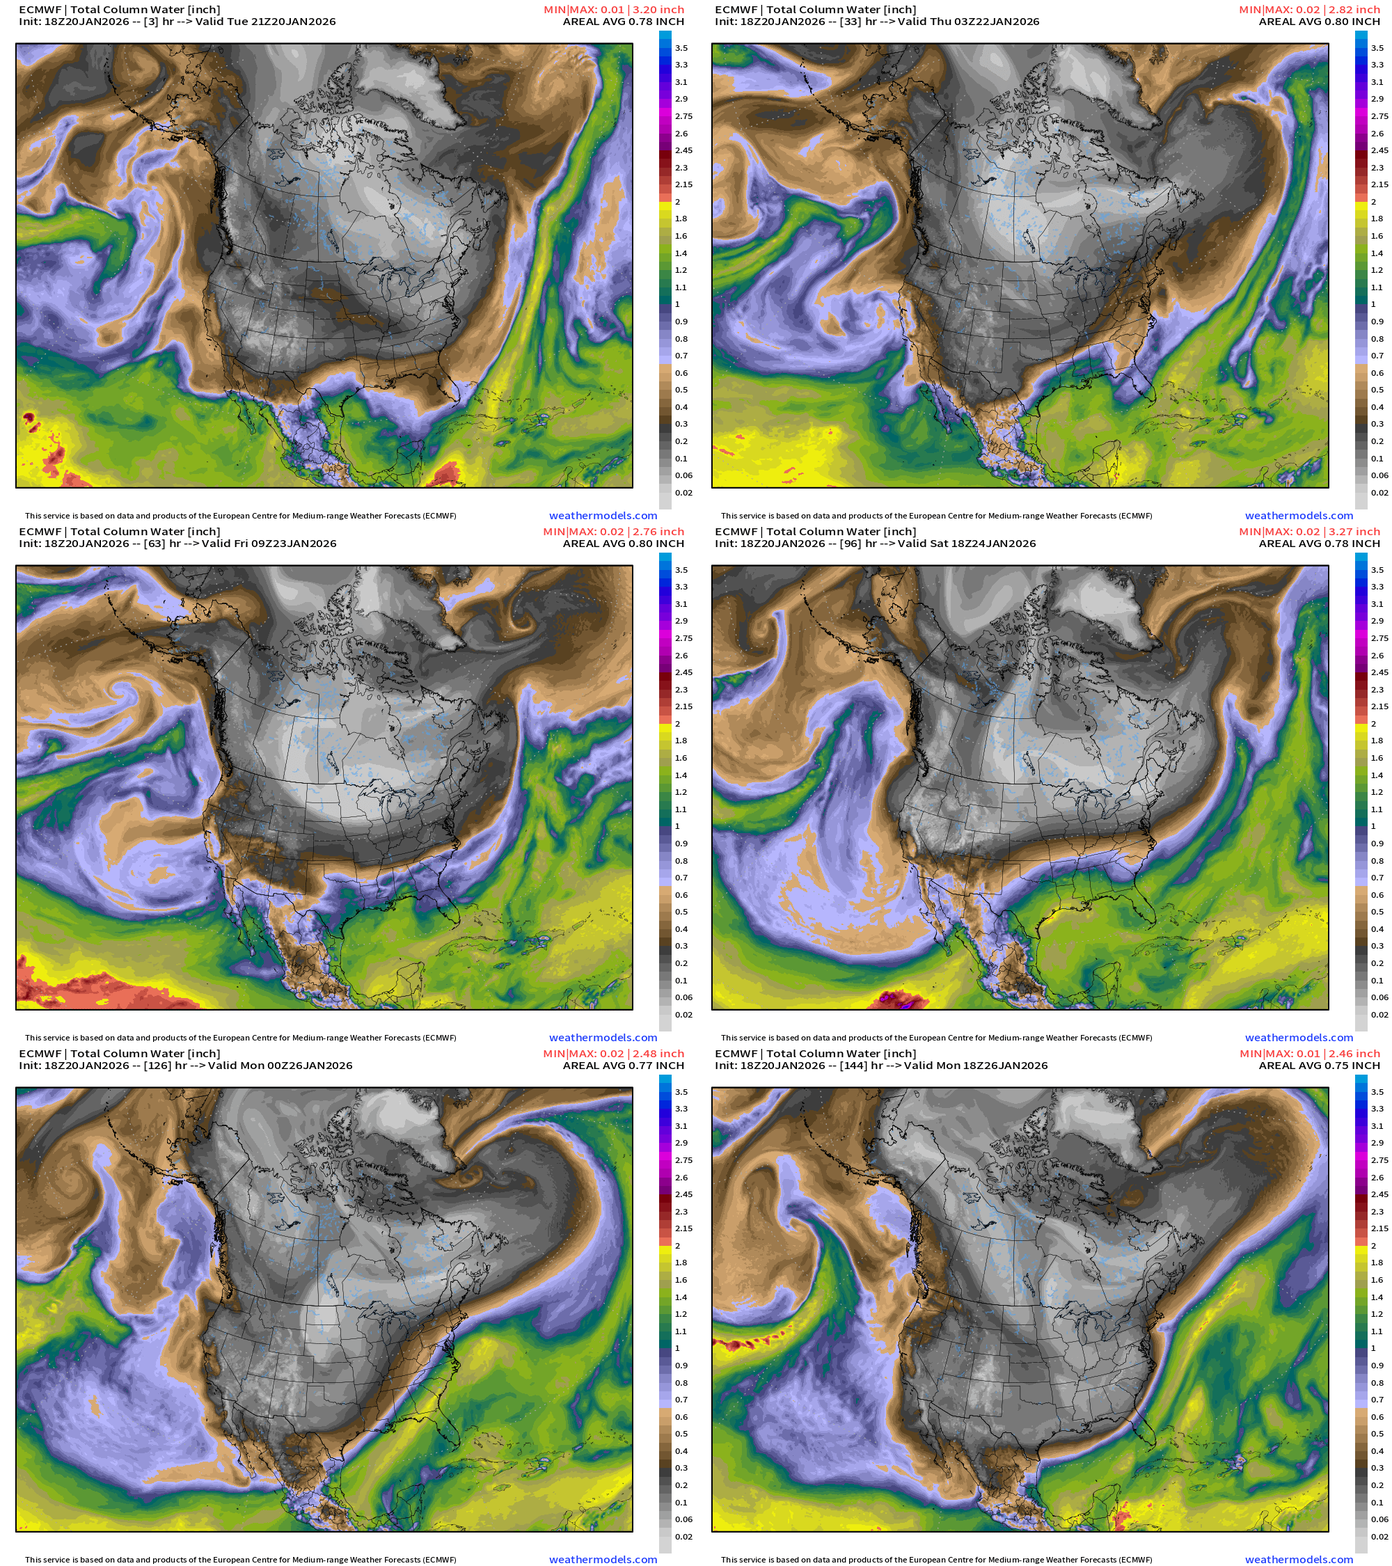
The collision of the extremely cold and dry/dense Arctic air will undercut the very moist and warmer air coming from the Gulf of Mexico and Pacific subtropics. The result is a battleground of frozen precipitation from freezing rain, sleet, ice, and snow to whatever else you can think of —> massive frozen precipitation mess.
ECMWF 18z Precipitation Type and Intensity | Next 6-days
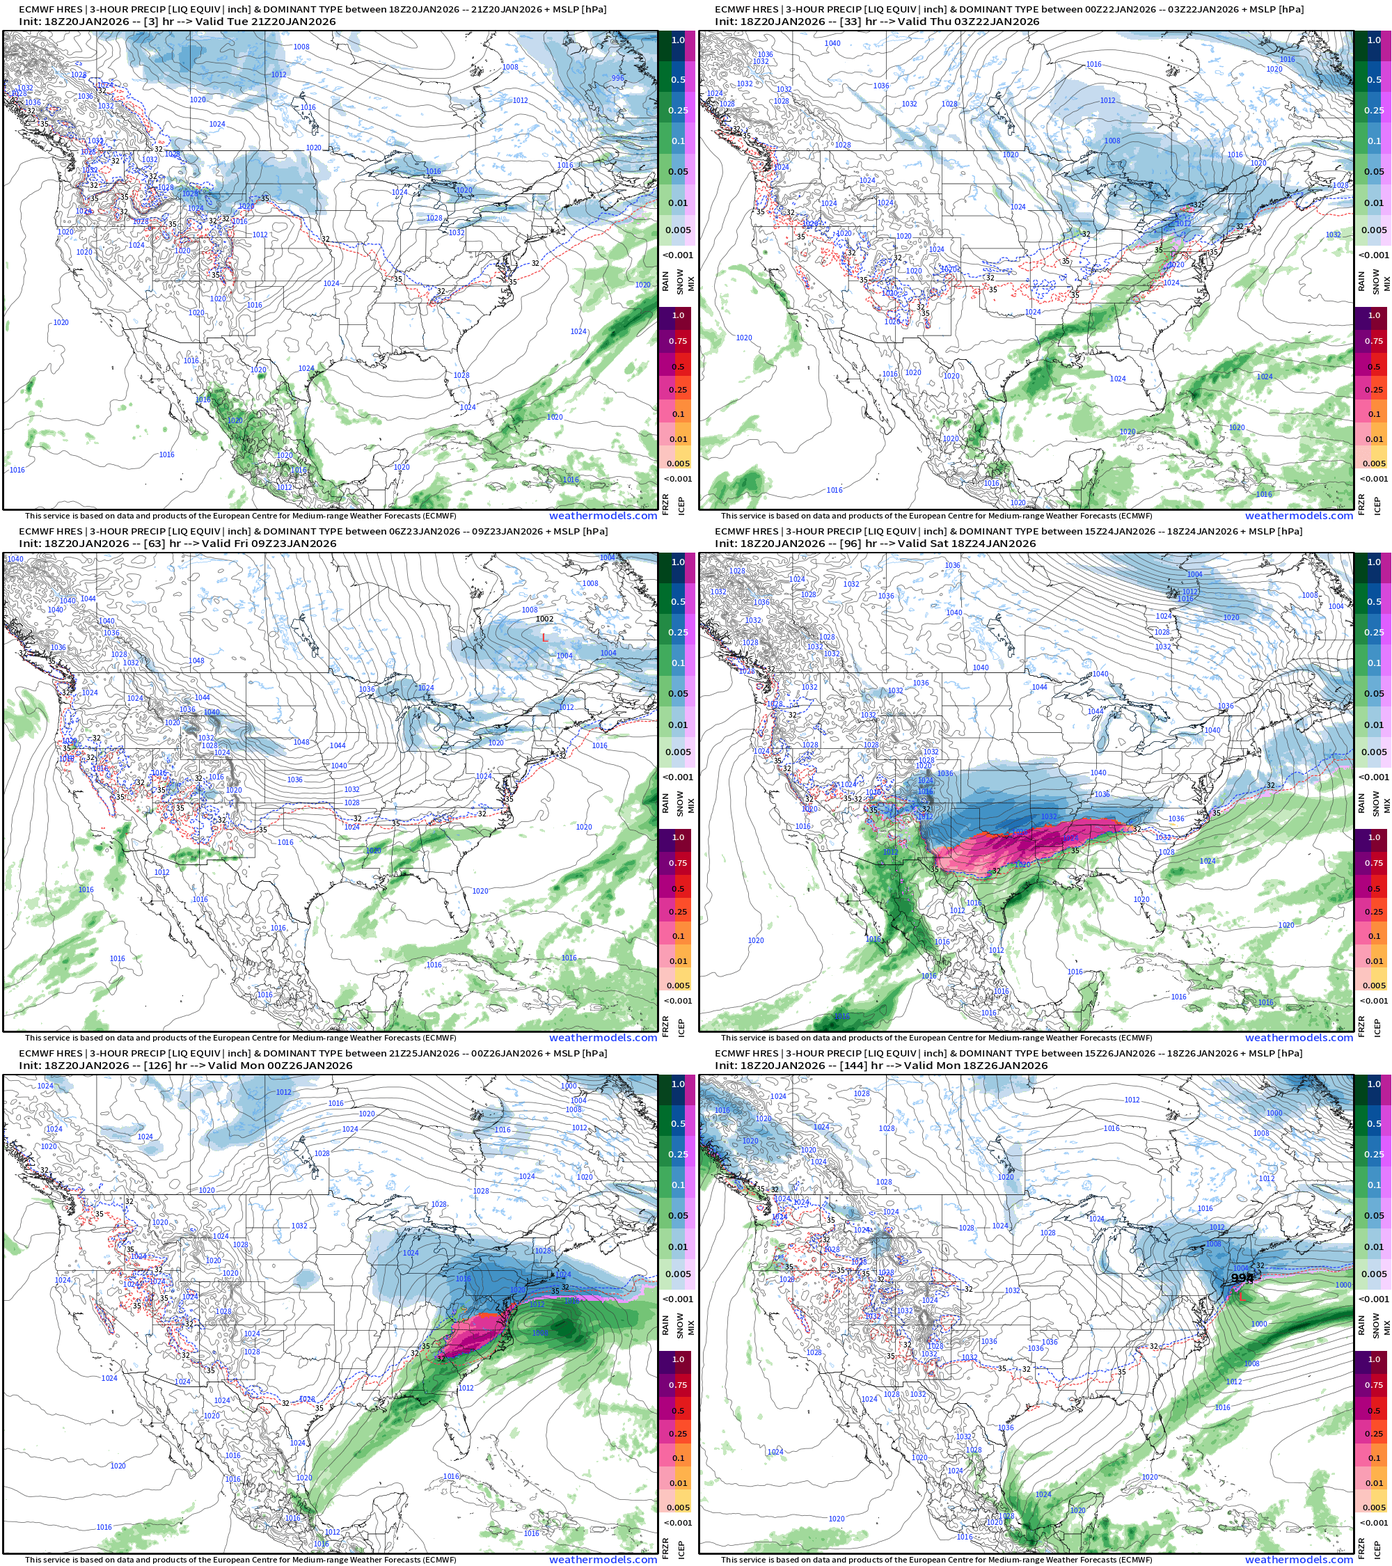
Very Major Ice Storm across the South from Texas into Georgia and the Carolinas with heavy snowfall to the north as moisture from the south overruns the entrenched Arctic high pressure dry air cold pool.
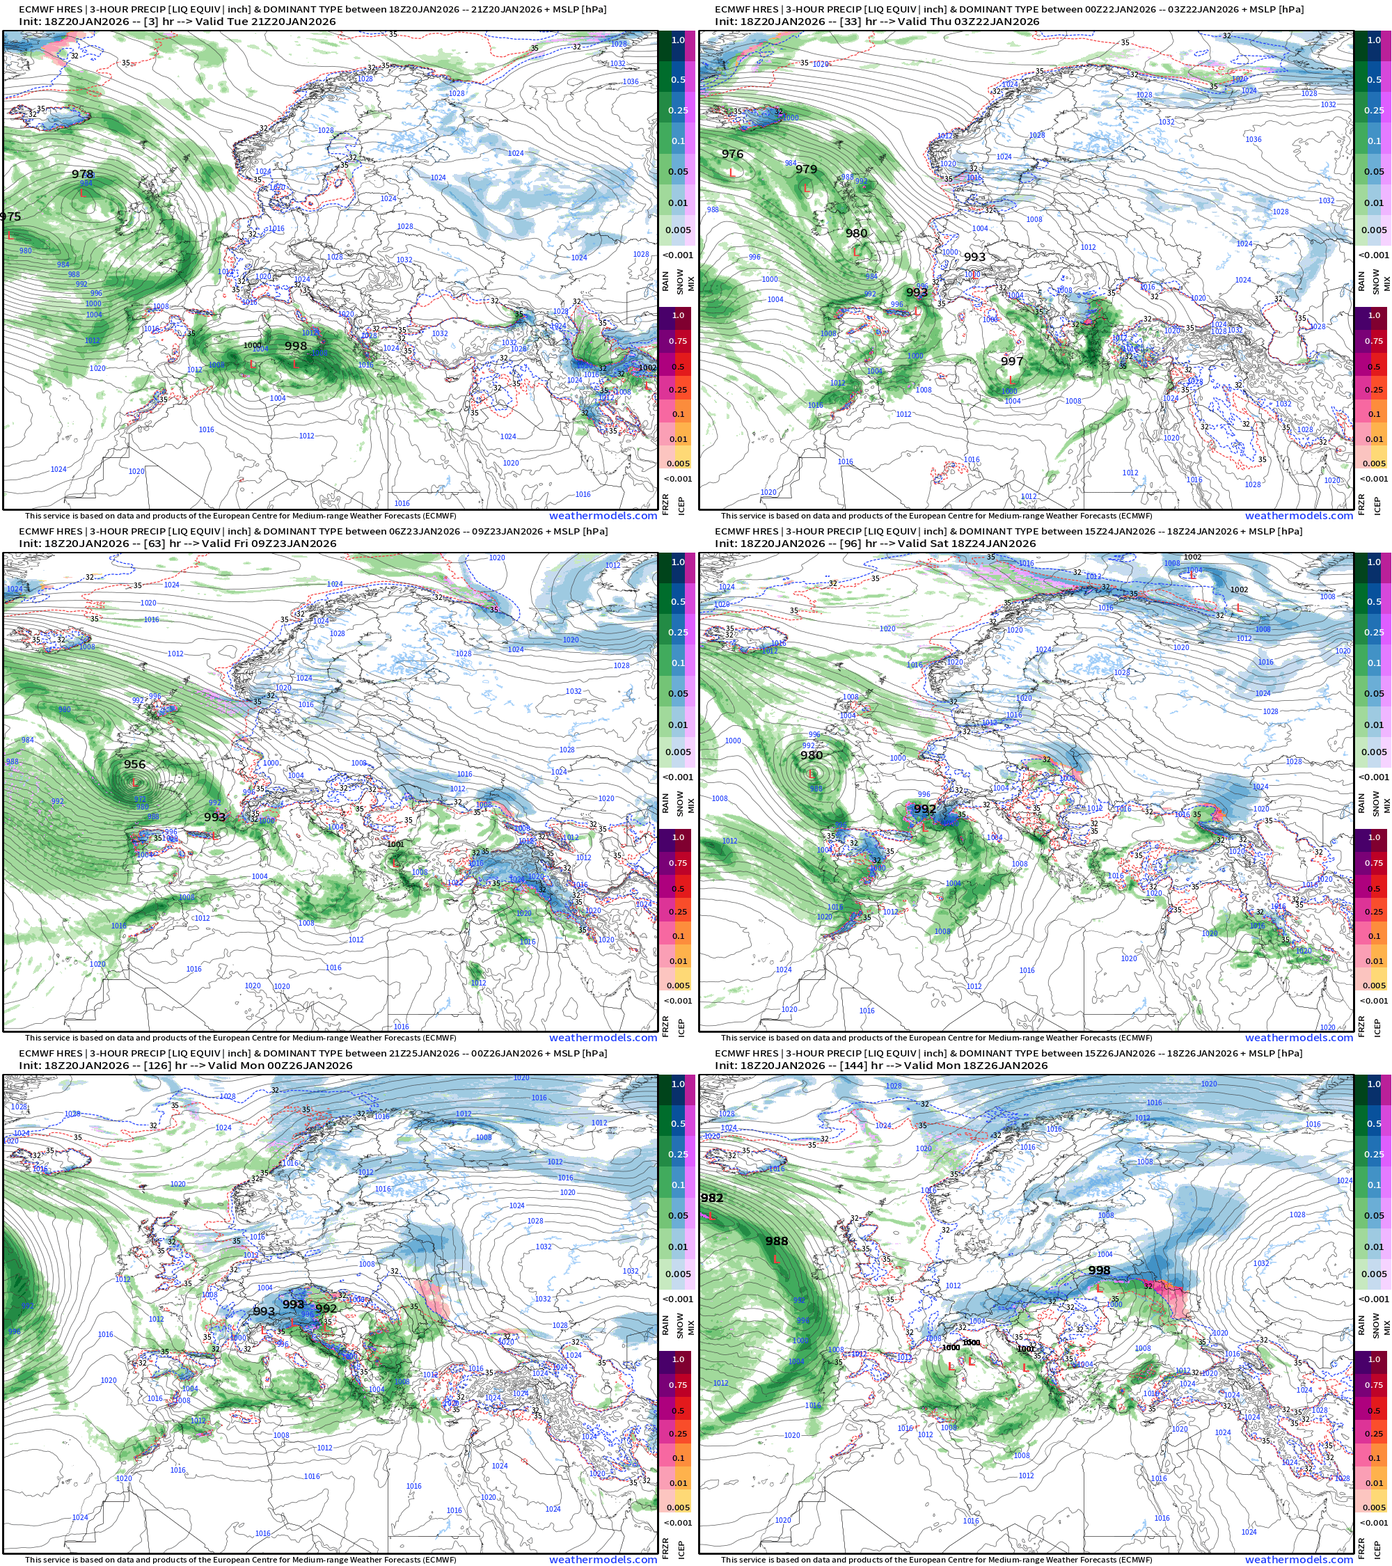
Europe Storm Systems next 6-days
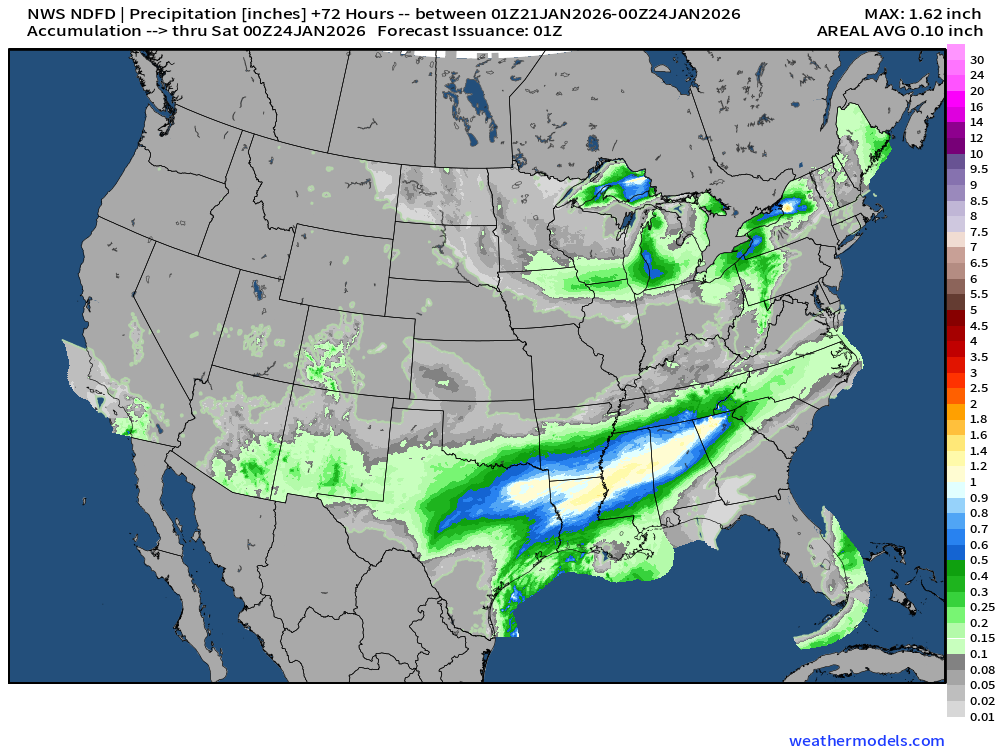
NWS Precipitation Next 72-hours
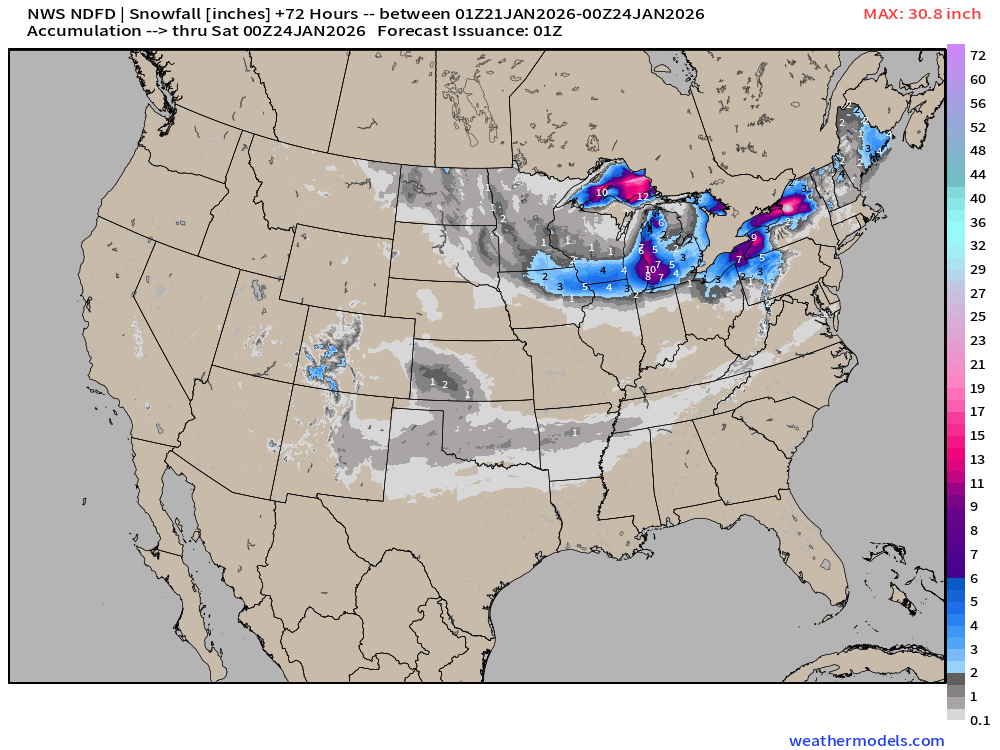
NWS Snowfall Next 72-hours
RTMA | Temperature Analysis | 8:15 PM ET
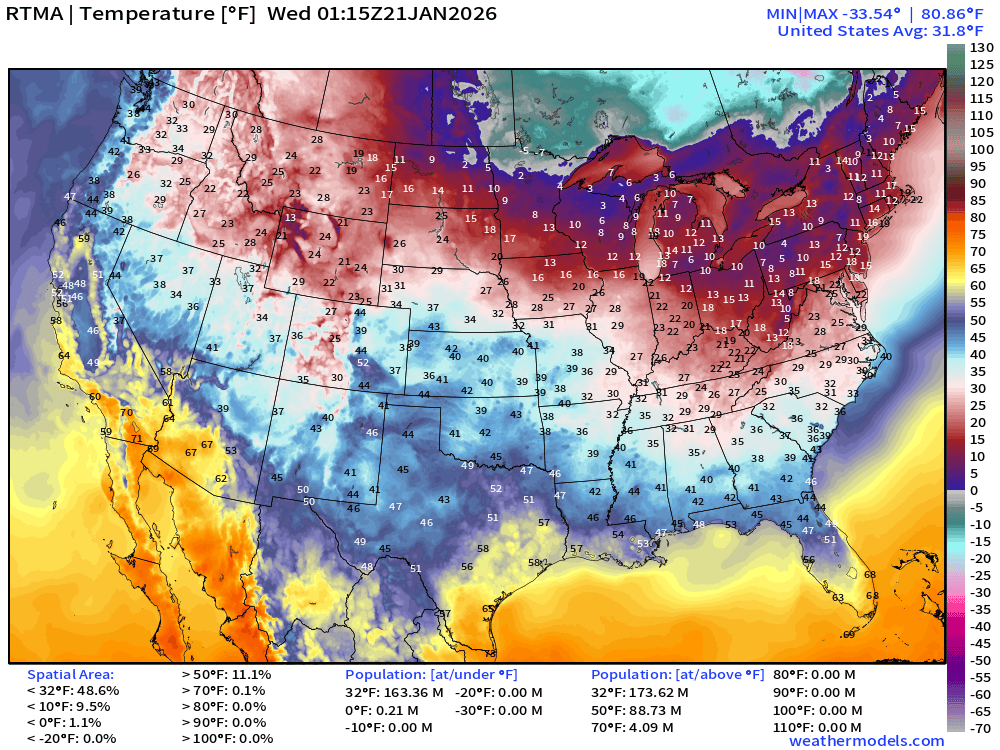
Average Lower 48 temperature was 31.8°F with 174 million below freezing.
Temperature Anomaly | 8:15 PM ET
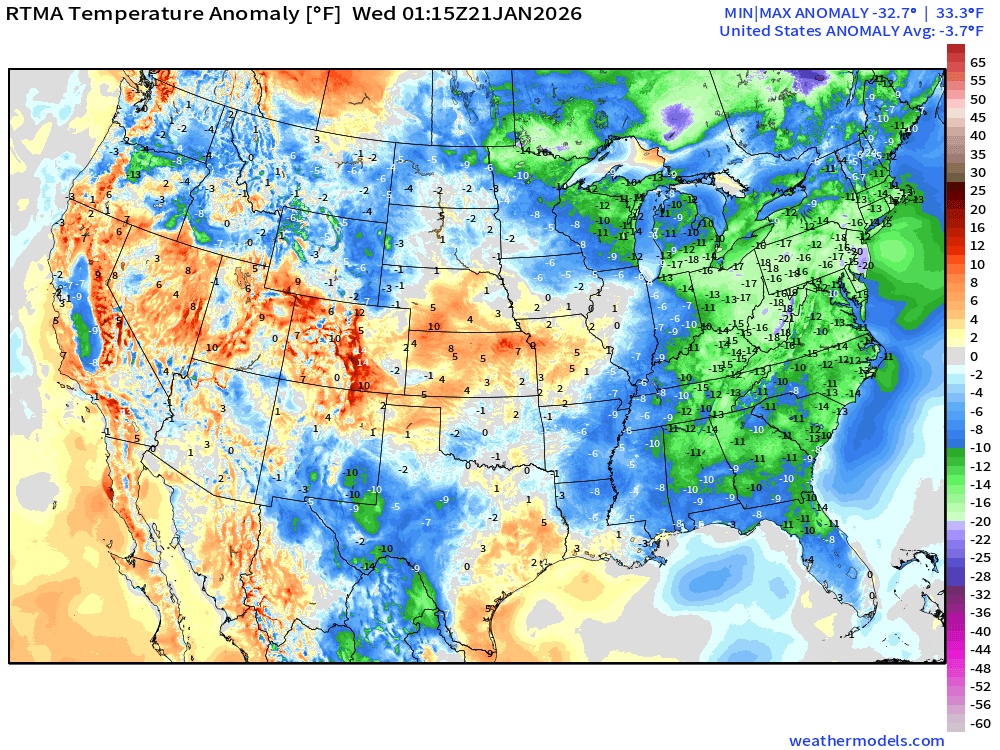
Lower 48 Temperature Anomaly below normal by -3.7°F
Wednesday Morning Low Temperatures
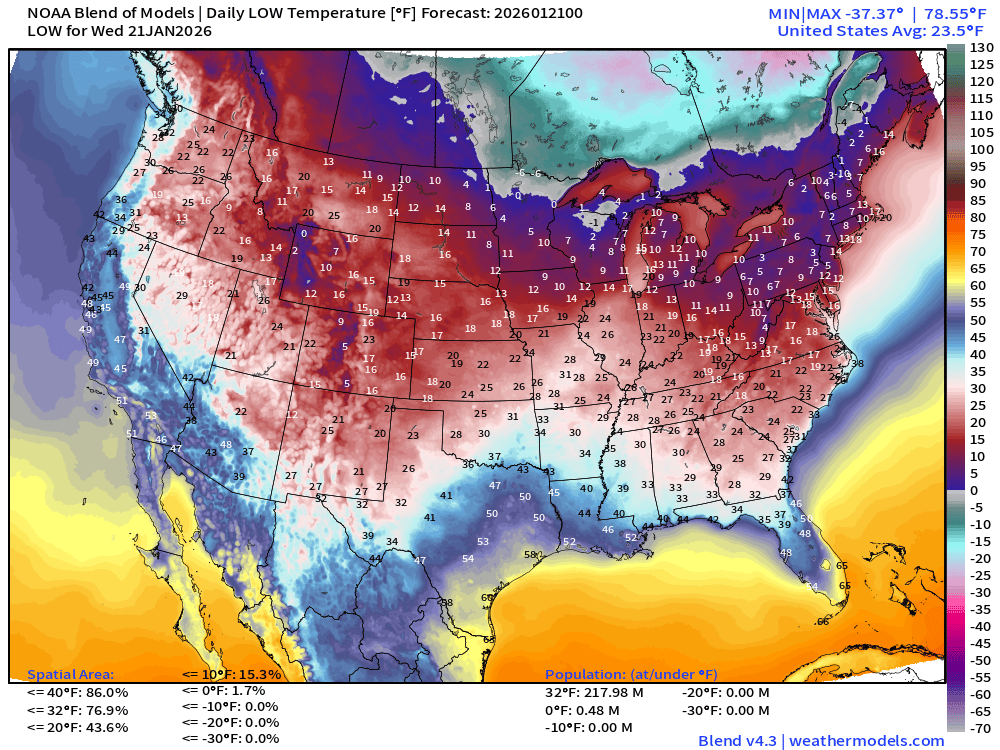
218 million below freezing — nationwide average of only 23.5°F. Half million below zero.
Wednesday High Temperatures
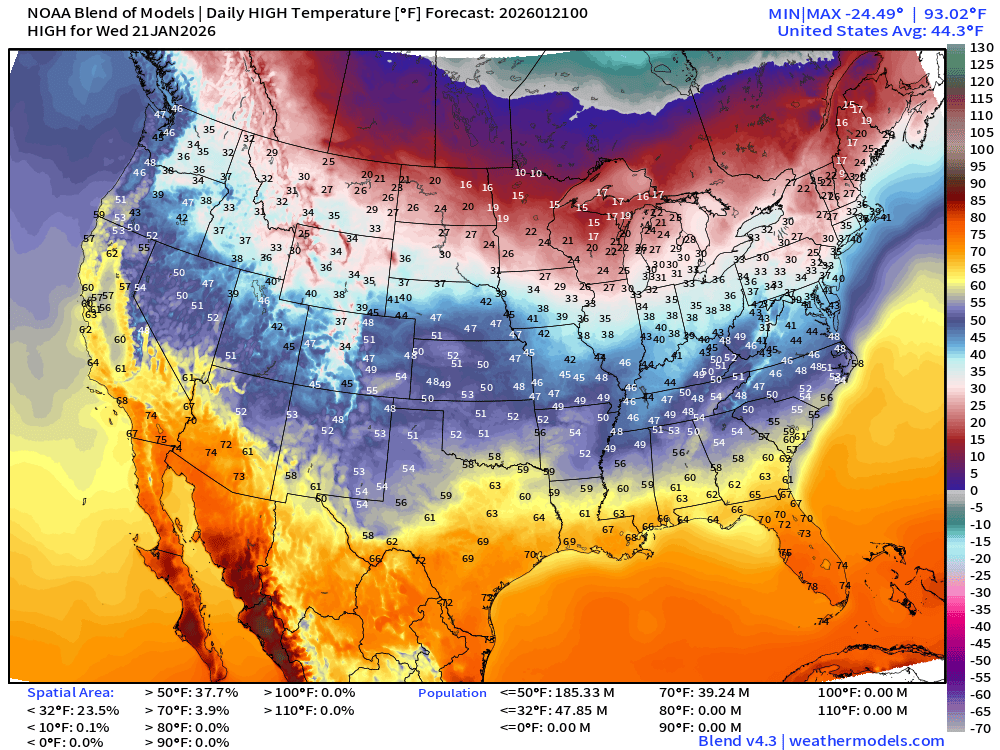
Nationwide average of 44.3°F and about 48 million stay below freezing.
Saturday Morning Low Temperatures | Blend of Models v5.0
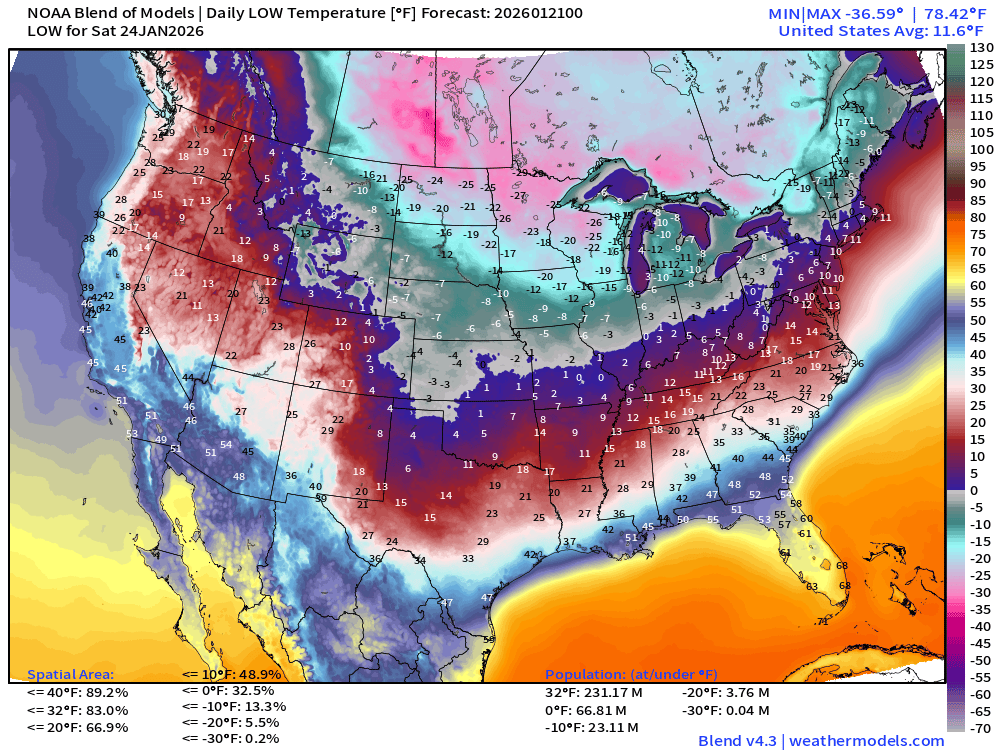
Average low temperature only 11.6°F with 67 million below zero, and 23 million colder than -10°F
Sunday Morning Low Temperatures | Blend of Models v5.0
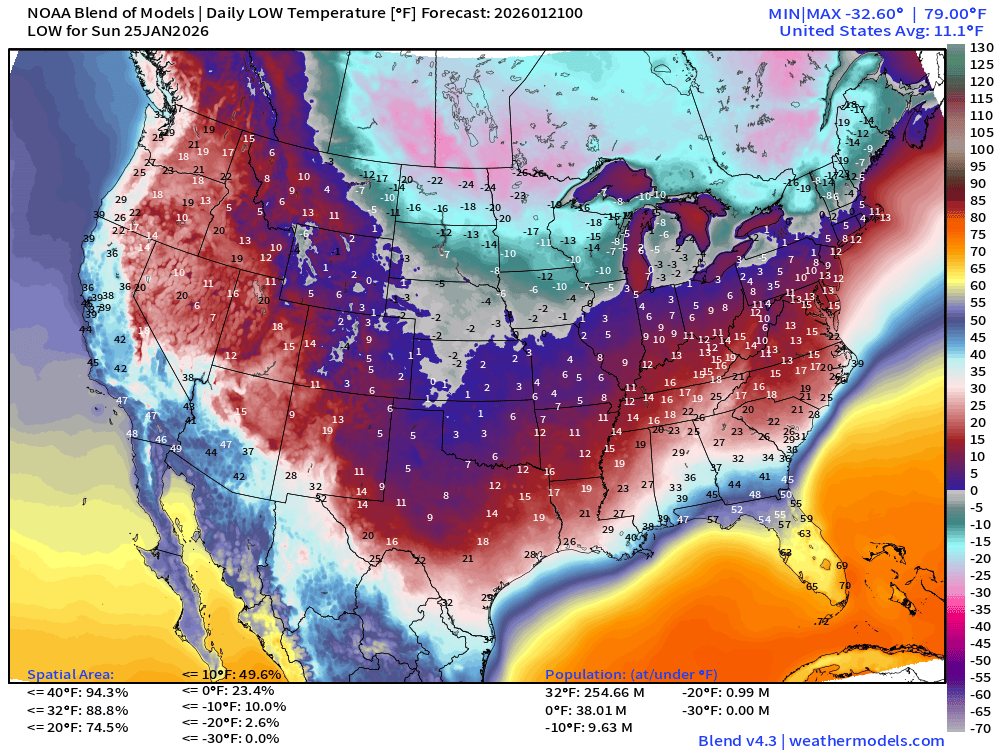
11.1°F — even colder on average. 255 million below freezing, and even 1 million colder than -20°F
Blend of Models | 7 Days Precipitation Total
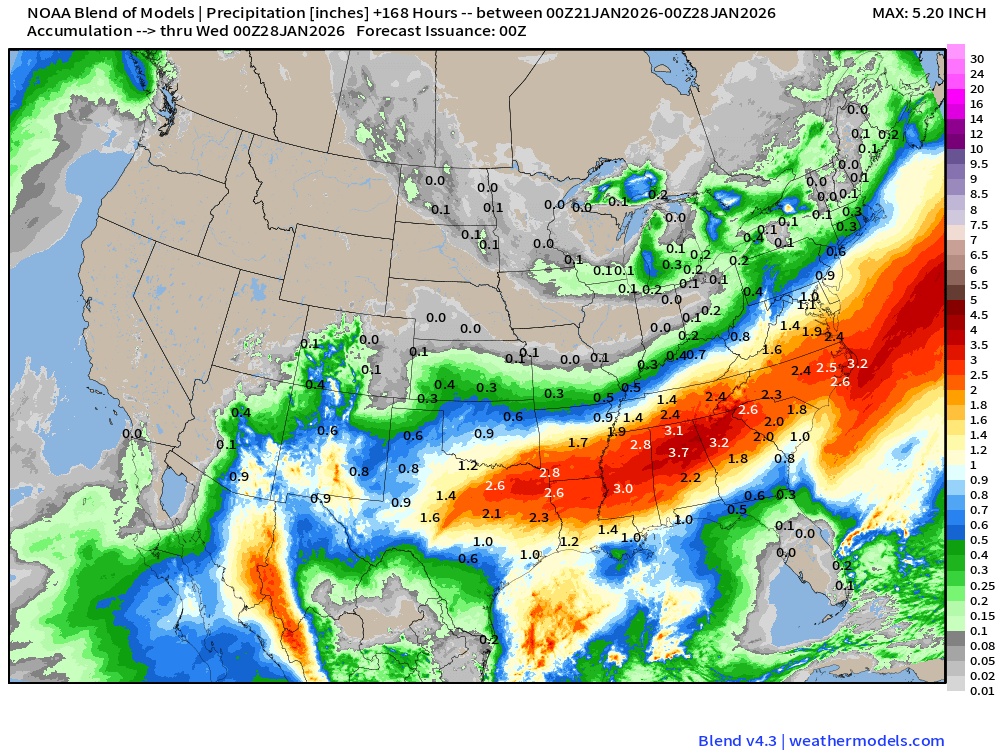
That’s a lot of QPF from this atmospheric river / subtropical moisture plume
Blend of Models v5.0 | Total Snowfall Next 7-Days
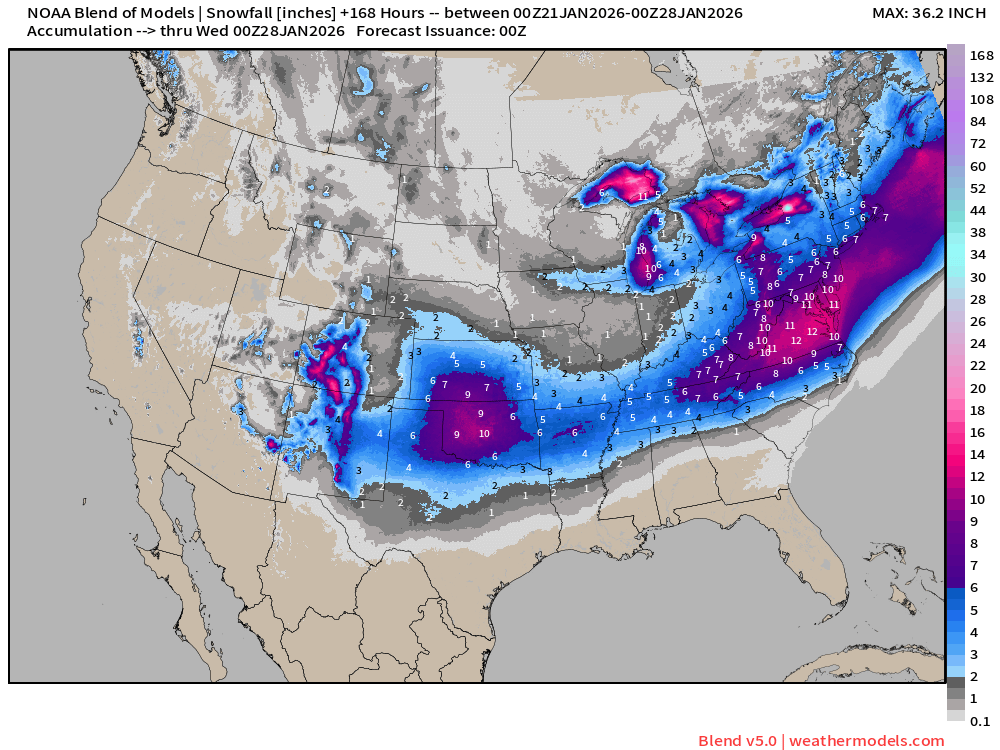
Note this is a very smooth product and likely underestimates the potential since NOAA GFS products are mixed within … and that model is much poorer skill at 7-days.
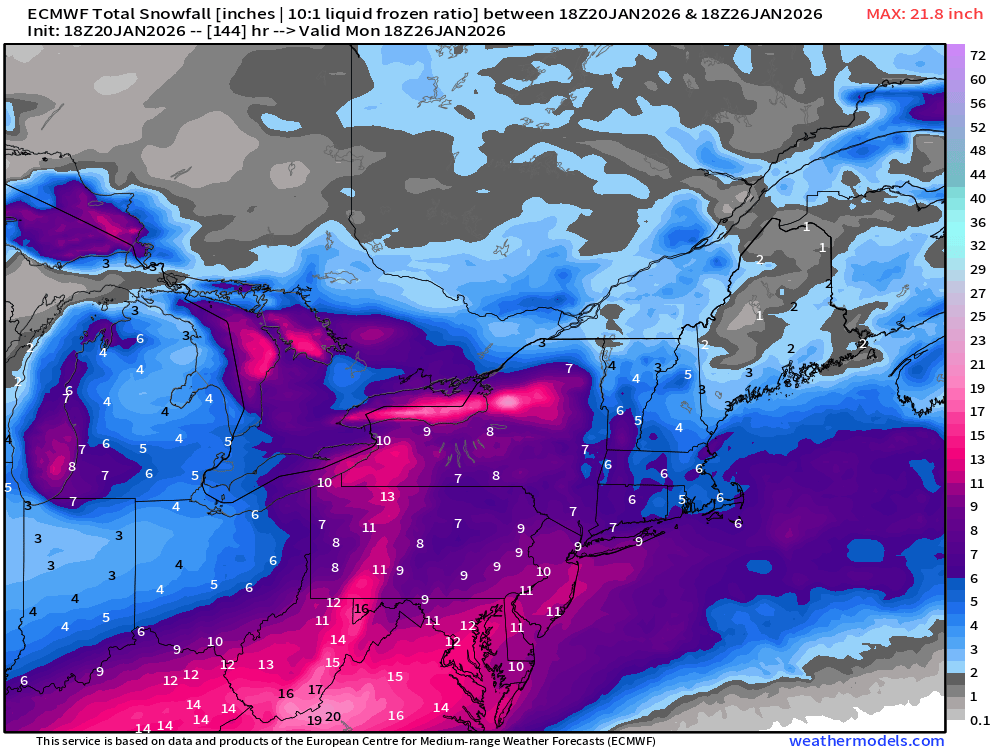
ECMWF 18z | Snowfall and Freezing Rain Next 6-days
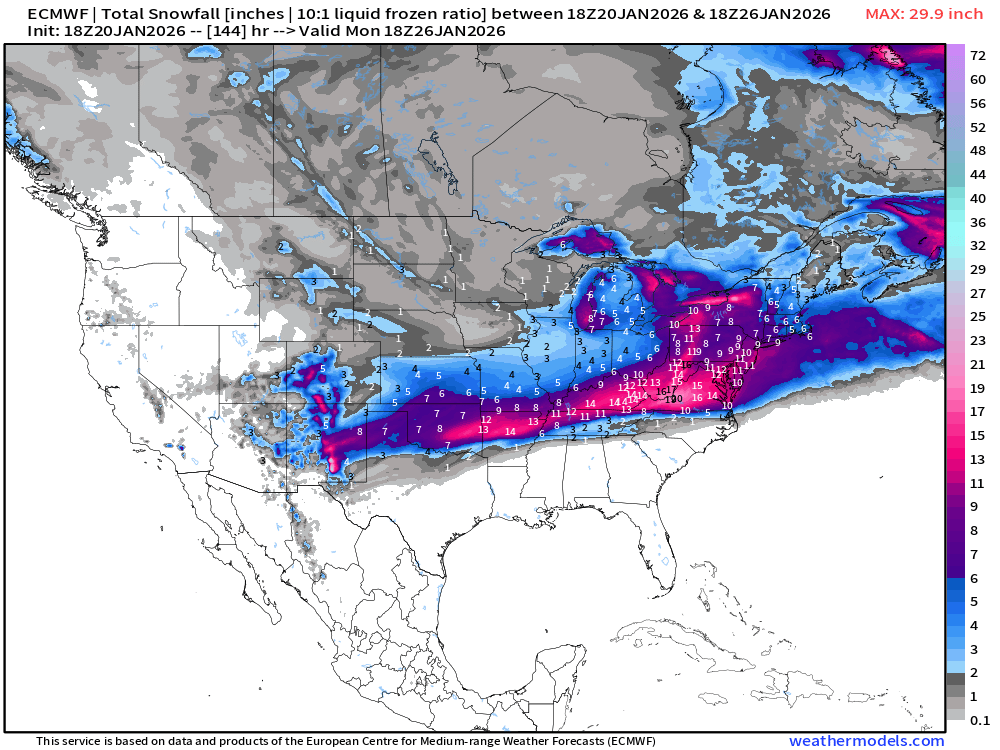
Yikes — this is VERY heavy freezing rain amounts
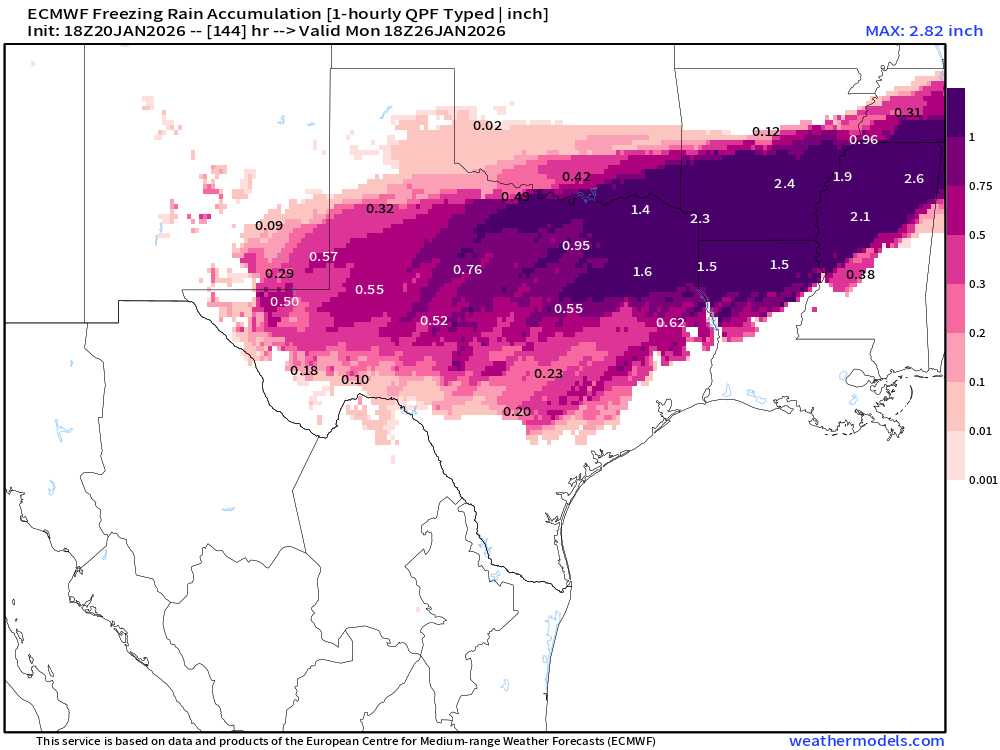
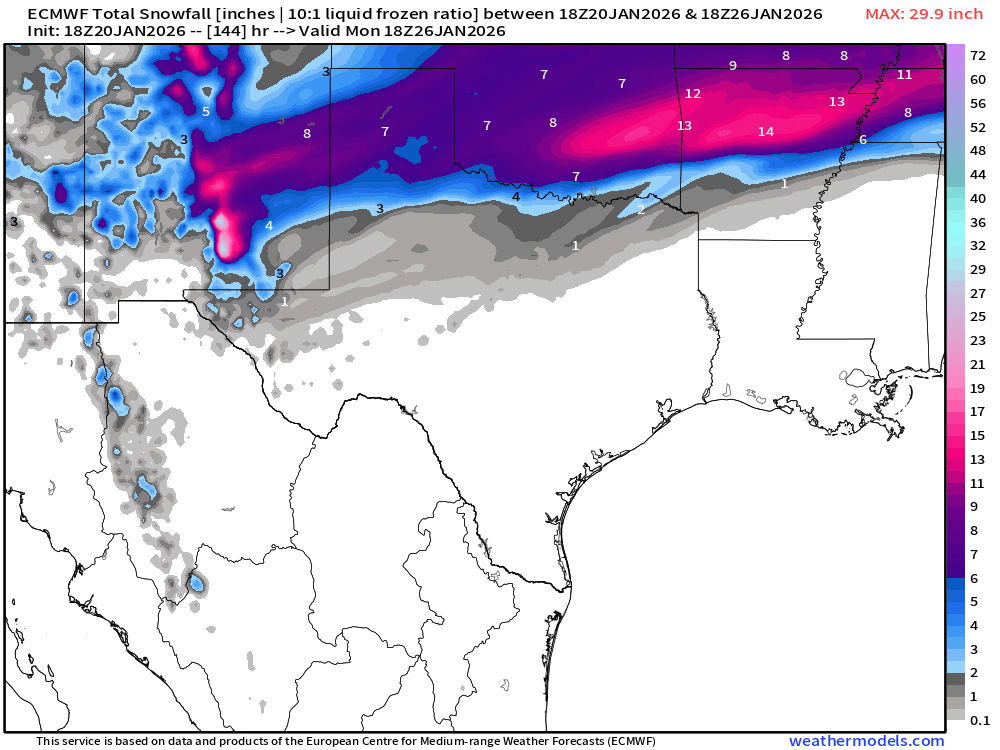
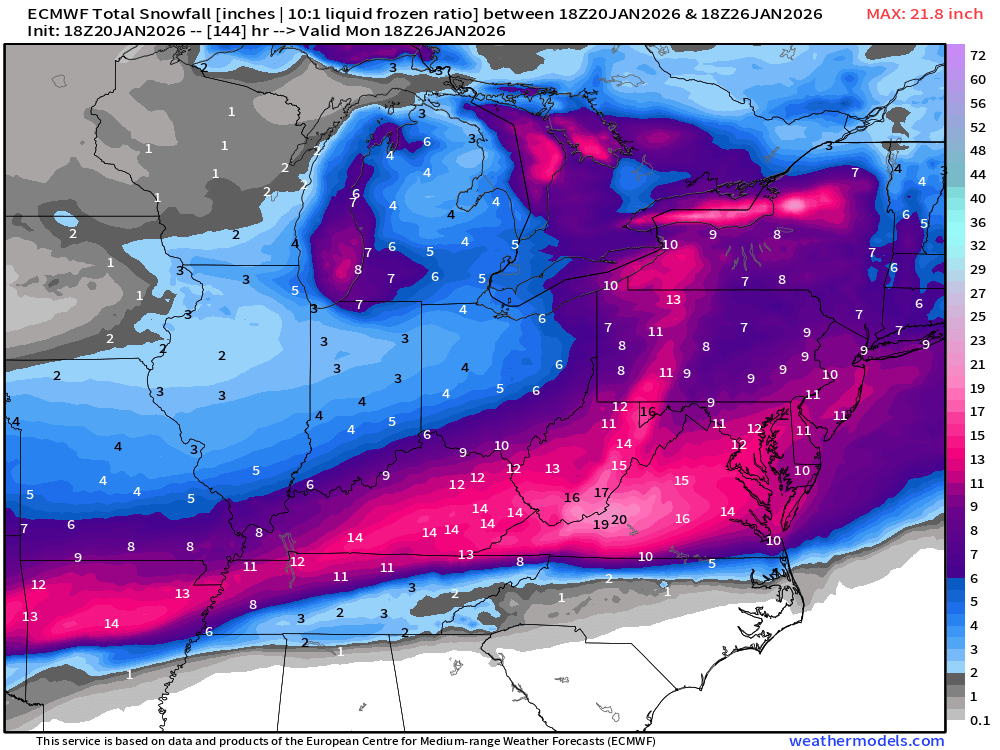
Such totals > 1” to even 3.4” of QPF as freezing rain is unheard of … would be very damaging.
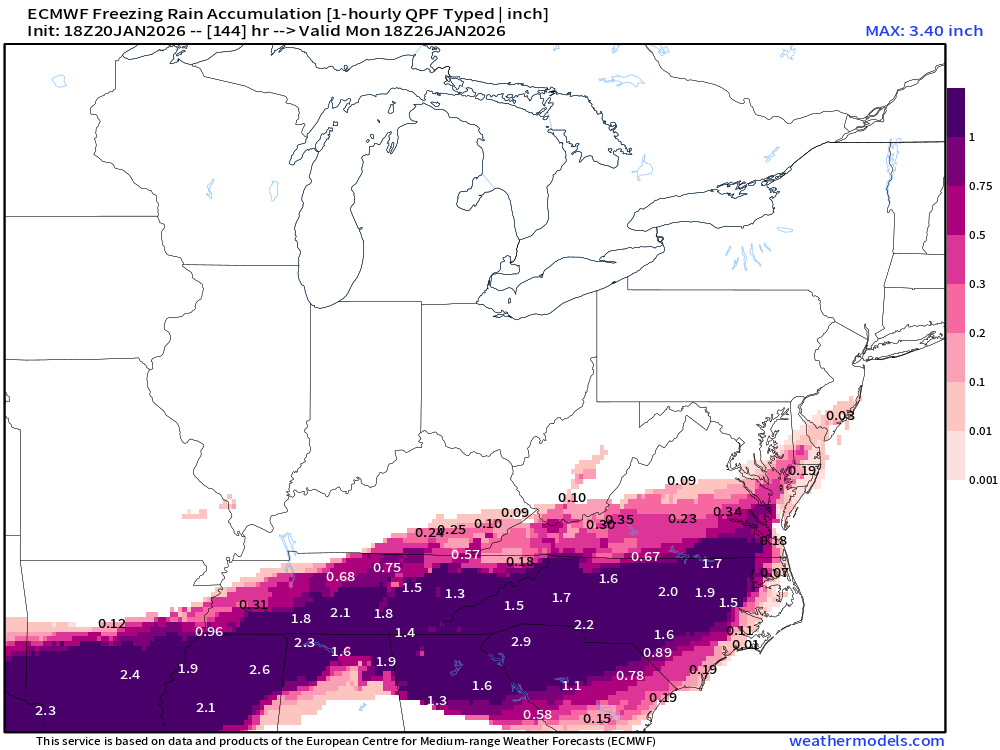
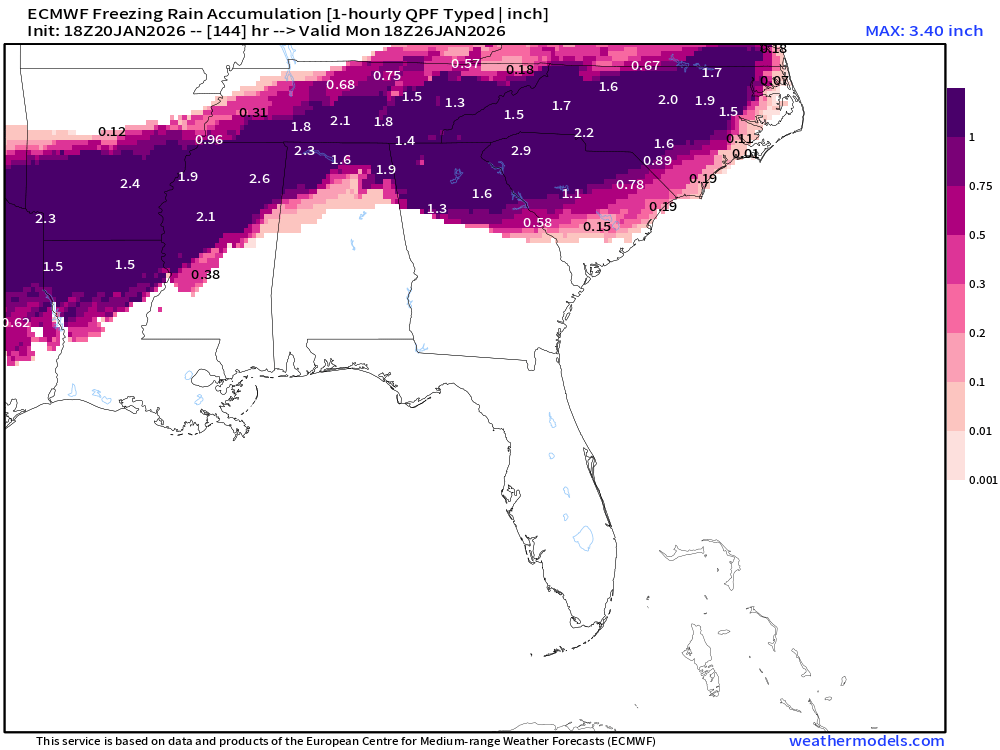
We’ll be monitoring the warm nose of this surface low and frontal boundaries over the Southeast as the mountain wedge (easterly winds) may spare or punish Atlanta — to soon to say if we’ll escape the freezing rain here … more details tomorrow — and hopefully better news.
ECMWF EPS 12z | Ensemble Median Snowfall Next 10-days
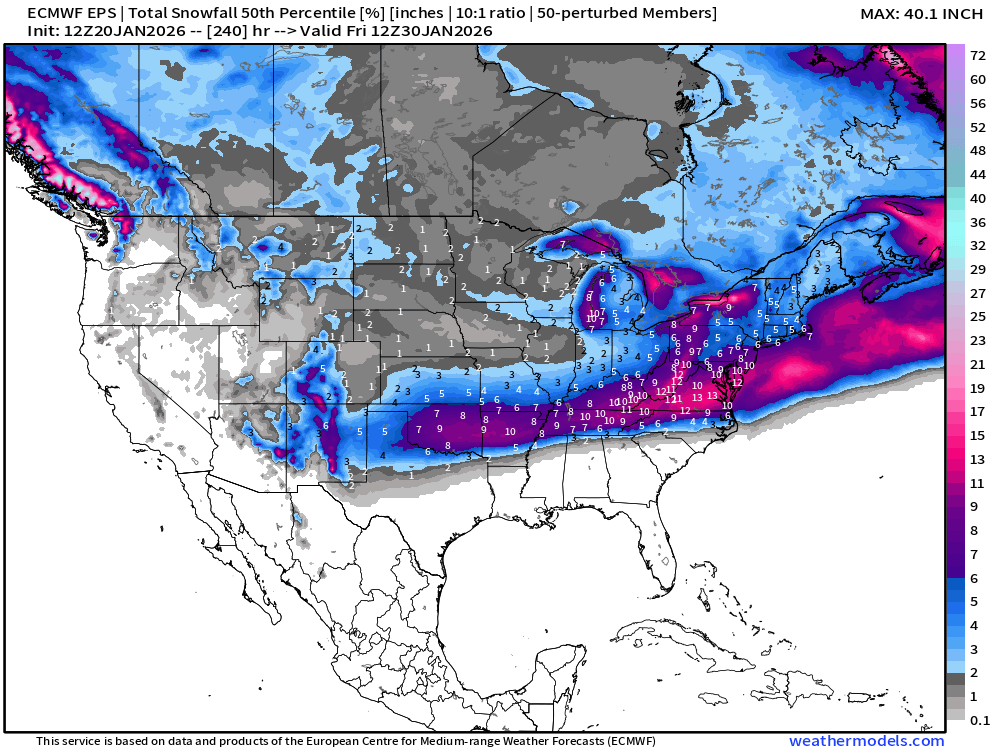
This is a potentially HUGE underestimate: There is a very wide distribution of solutions with the Interquartile range (25% to 75%) the same amount as the median = boom or bust & the snow-to-liquid ratio will be upwards of 15:1 or higher in the cold air, so we could double the median snowfall amounts.
IQ (25-75%) range through 10-days
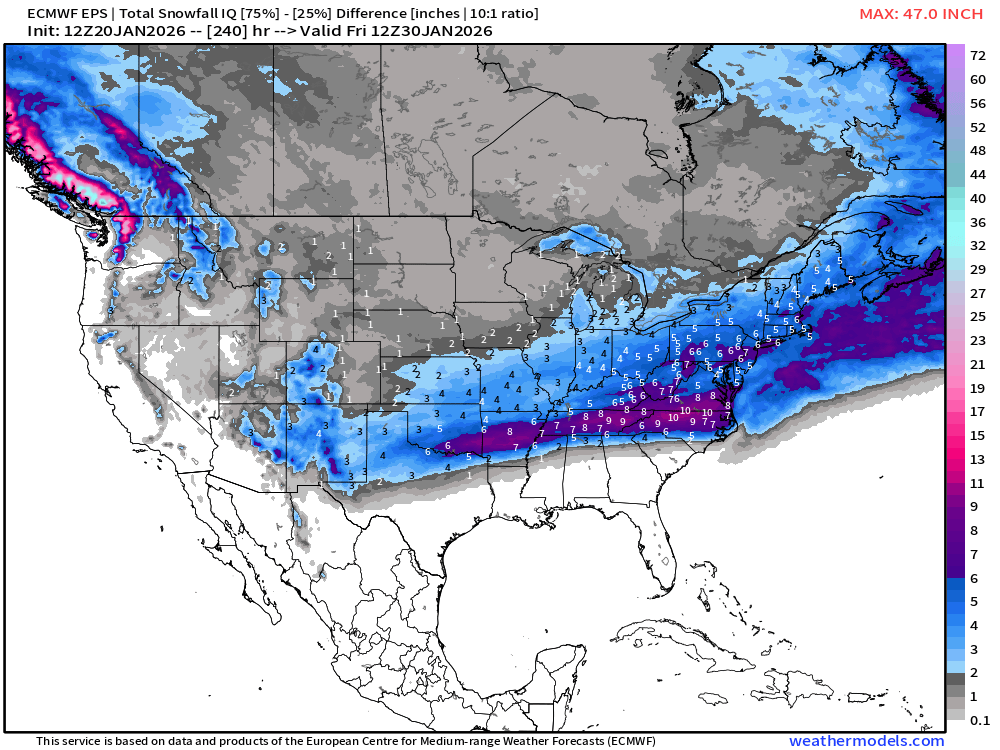
Ensemble Maximum through 10-days: Boom Potential Dialed up to 100%
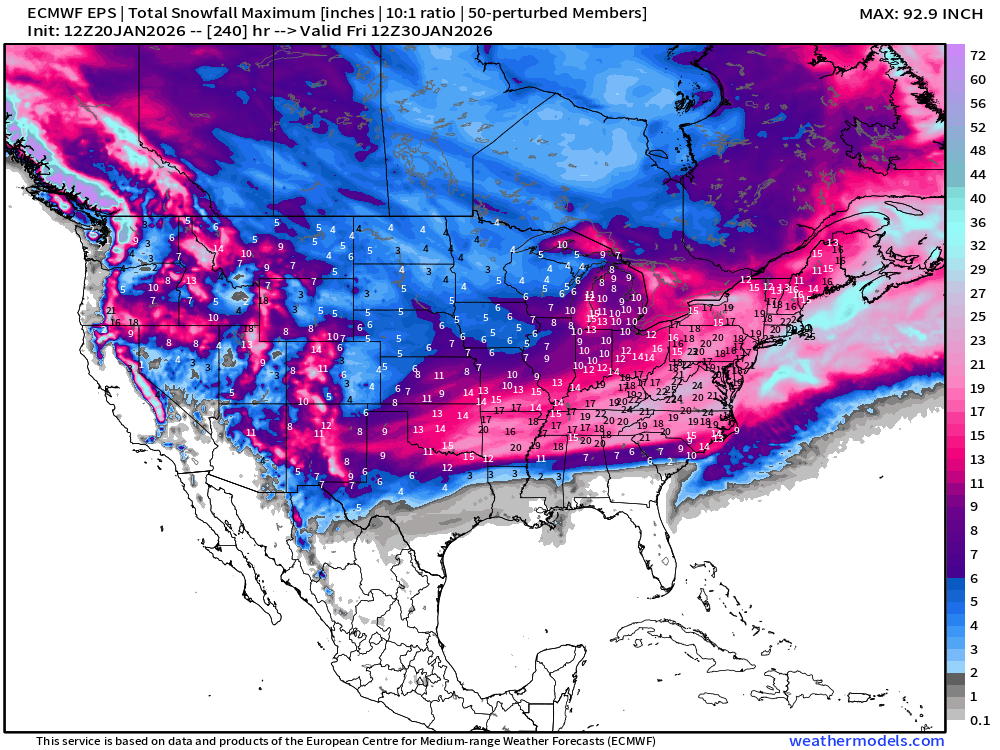
—> this map is a “worst case scenario”
Probability of some Snowfall (0.1”) in next 10-days
Florida is largely safe from the coldest Arctic air — and snowfall this time around.
Probability of 1-inch Snowfall in next 10-days
Probability of 6” and 12” of Snowfall next 10-days
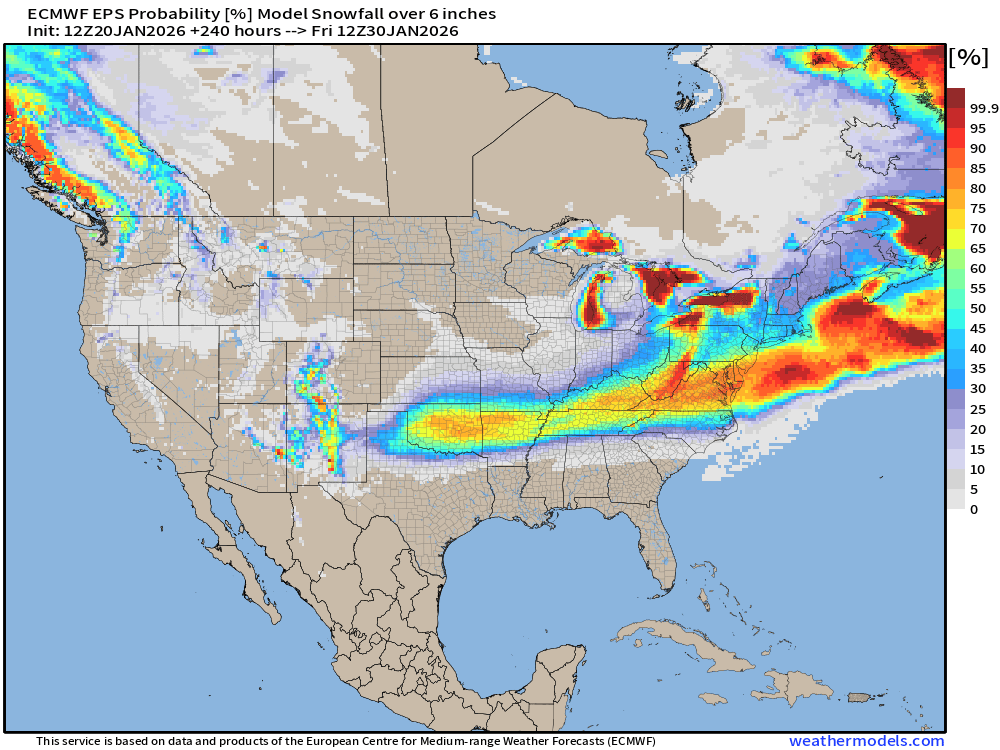
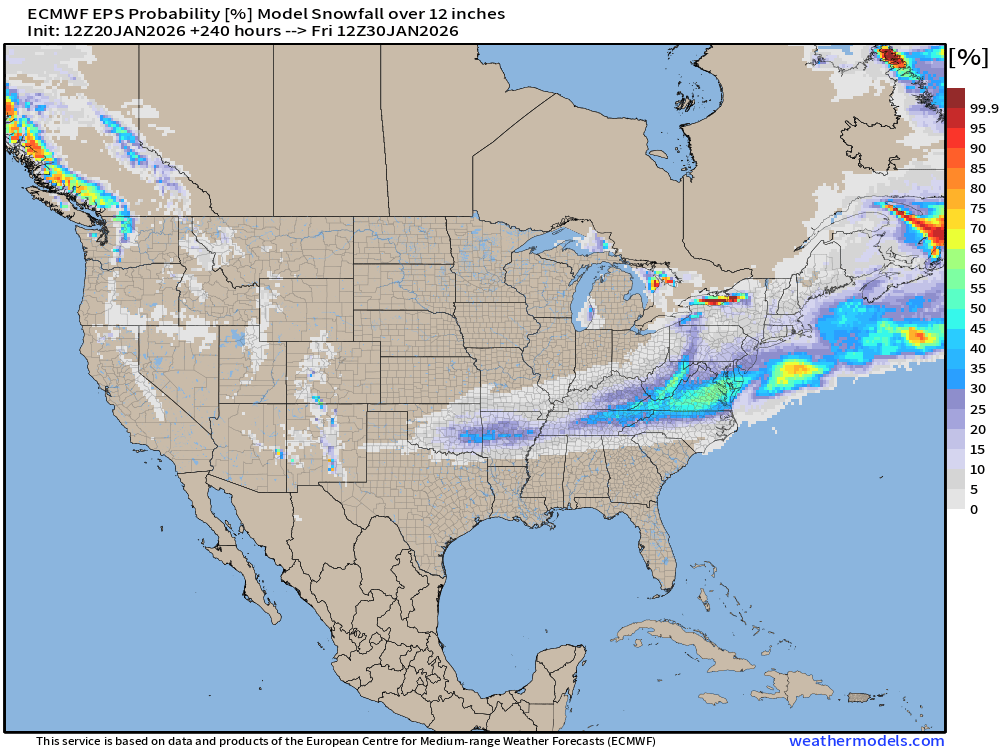
Lower 48 Temperature Anomaly | Next 15-days | ECMWF EPS 12z
5-Day Chunk #1 | Temperature Anomaly | Jan 20 - Jan 24
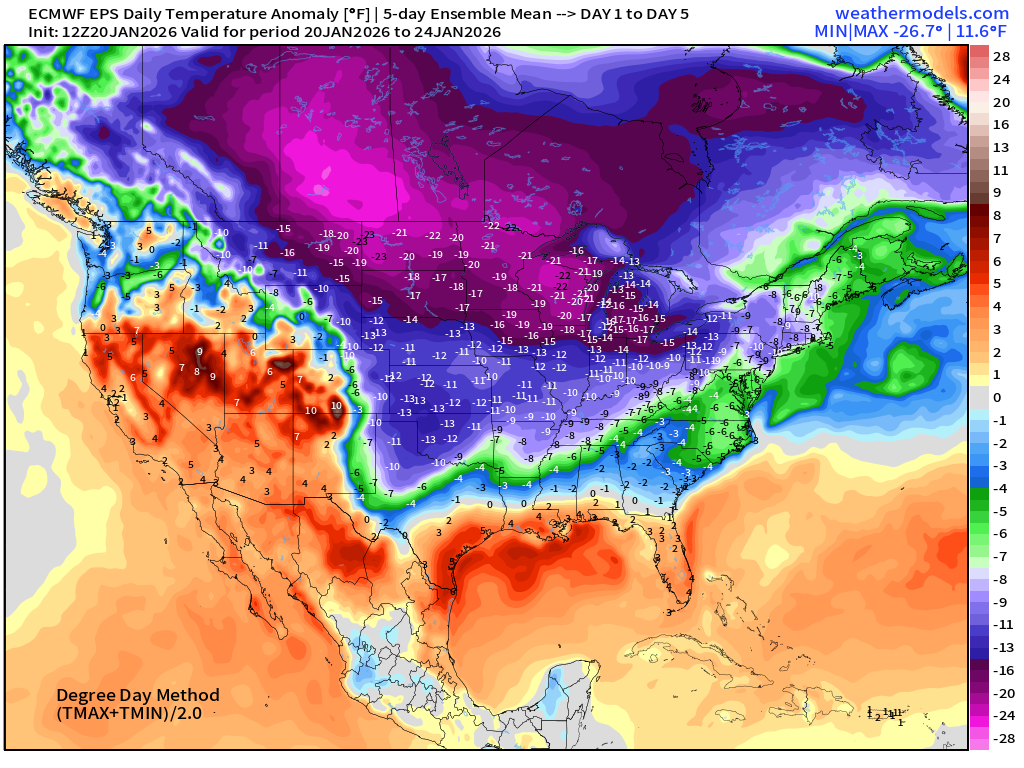
5-Day Chunk #2 | Temperature Anomaly | Jan 25 - Jan 29
5-Day Chunk #3 | Temperature Anomaly | Jan 30 - Feb 3
You made it to the end of the blog — congratulations! A lot more coming in the days ahead. Please sign up / share
Maps sourced from weathermodels.com designed and innovated by yours truly! Please subscribe there for real-time access to the newest maps, charts from all of the weather models including ECMWF and AIFS, NOAA AI-GFS/AI-GEFS
- Milepost
- 845 · laid 2026-01-21T02:22:40.337000Z
- Source
- https://weather.substack.com/p/january-20-2026-tuesday-ice-storm
- Digest
- 655e1a89c65b90062e0d2c59c285b77f3cfe3e3c24dbccb57ec07140f150568b
- Machine
- JSON