January 19, 2026 Extreme Cold and Ice Storm
This weekend will be brutal across Eastern US with hazardous cold and huge snow/ice storm
January 2026 was the 25th-warmest January in the 132-year national record (1895–2026), at 33.1°F against a 1991–2020 normal of 32.3°F (+0.8°F).
January 2026 was the 12th-driest January in the 132-year national record (1895–2026), at 1.6in against a 1991–2020 normal of 2.3in (-0.8in).
NOAA/NCEI Climate at a Glance, contiguous United States. This is the observed record for the month, not a score of anything said in this piece — the forecast ledger begins 2026-08-17 and cannot reach earlier posts.

Headline Monday Evening: into this weekend, potentially catastrophic winter weather will affect east of the Rockies
I am alerting you well in advance of the potential AND then the likelihood of extreme winter weather. It’s disconcerting, but on social media (X), there’s a loud contingency that reflexively downplays or discounts extreme weather forecasts as hyped or somehow defective. You’d have to be an idiot to ignore the blaring sirens flashing right now.
Morning Low Temperatures Saturday — median from ECMWF Ensemble at 12z shows a large area of minus 20s and minus 30s across the Midwest and Great Lakes.
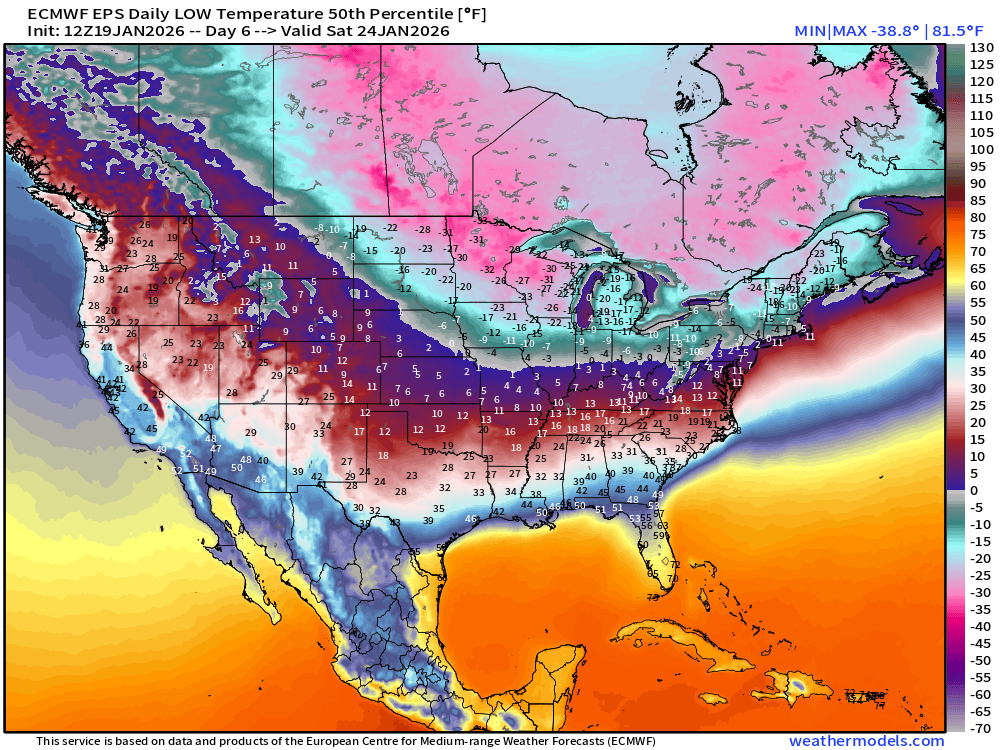
The pink is colder than -20°F and extends across multiple states from the Dakotas to Maine.
As I said yesterday, we are dealing with the “almost” coldest possible air mass for North America into late January descending out of the Canadian Arctic with assistance from Siberia. This will be a long duration period of extreme cold largely in 2 major waves this coming weekend, and then the next. However, even before we get to the major blasts — the upcoming week will feature very cold temperatures in the Midwest and Great Lakes, which means the Lake Effect Snow machine continues unloading.
How do we know it’s the “coldest possible” air mass? At 500 mb we can gauge the intensity of the mid-tropospheric cold pool and anything usually in the -40°C or colder range is indicative of Siberian or Canadian Arctic origin air.
We’ve got -50°C right on our doorstep with a more “Antarctic” style thickness late Thursday into the weekend.
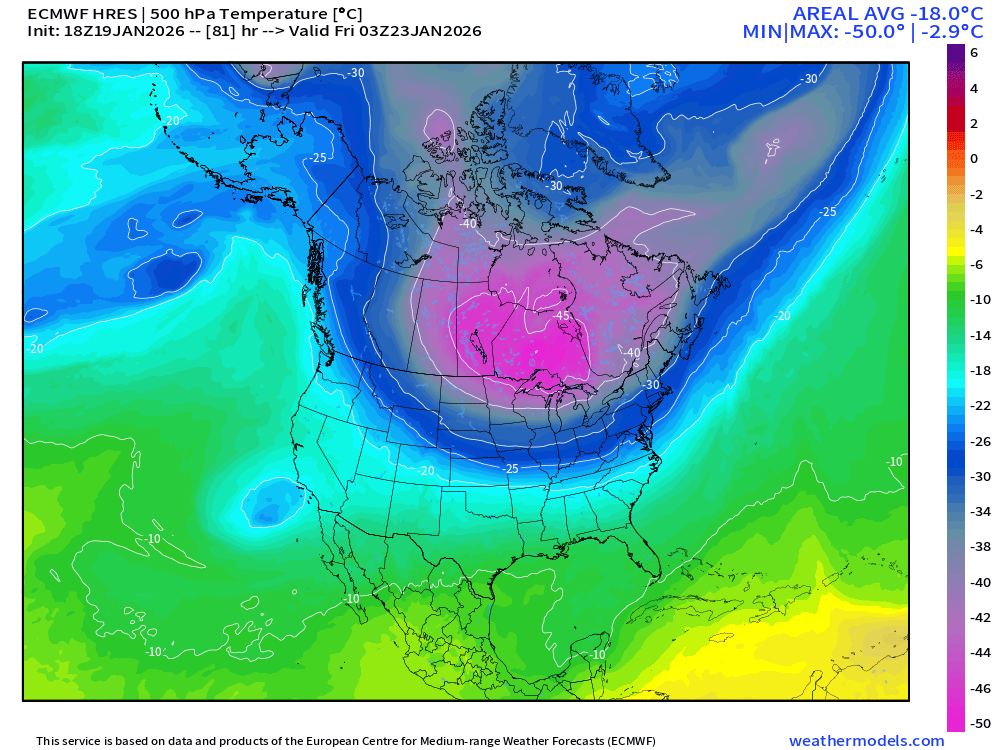
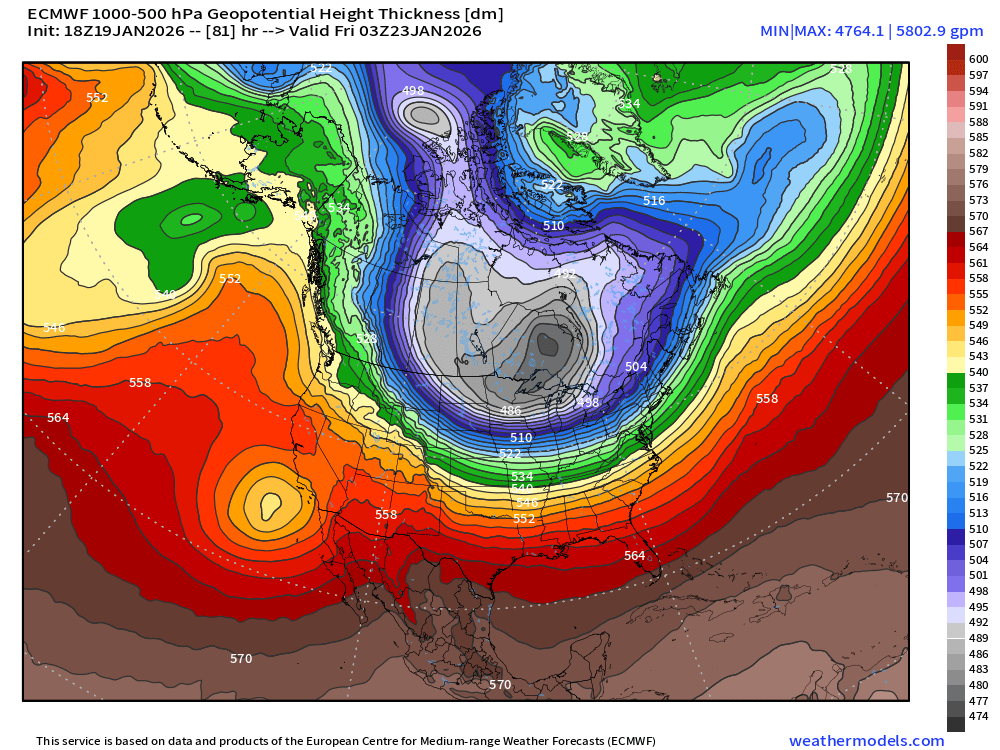
This cold pool slowly wobbles eastward as if on a pendulum attached to the Hudson Bay main polar vortex fulcrum. And, somehow it gets even colder to -51°F with intensification over Southern Canada into the Northeast.
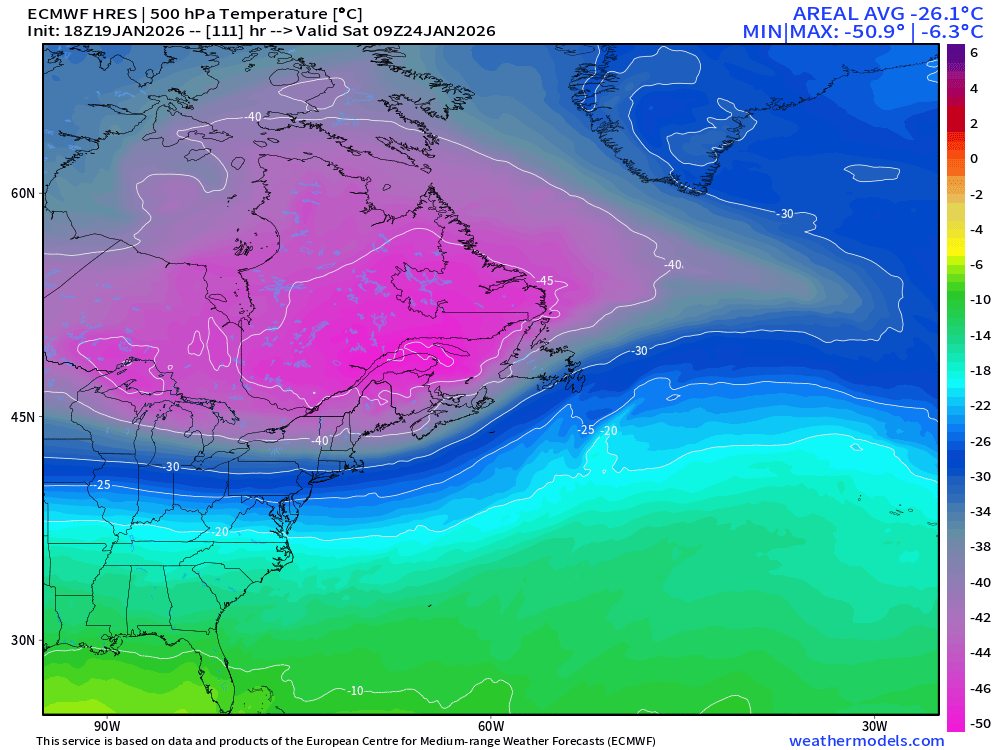
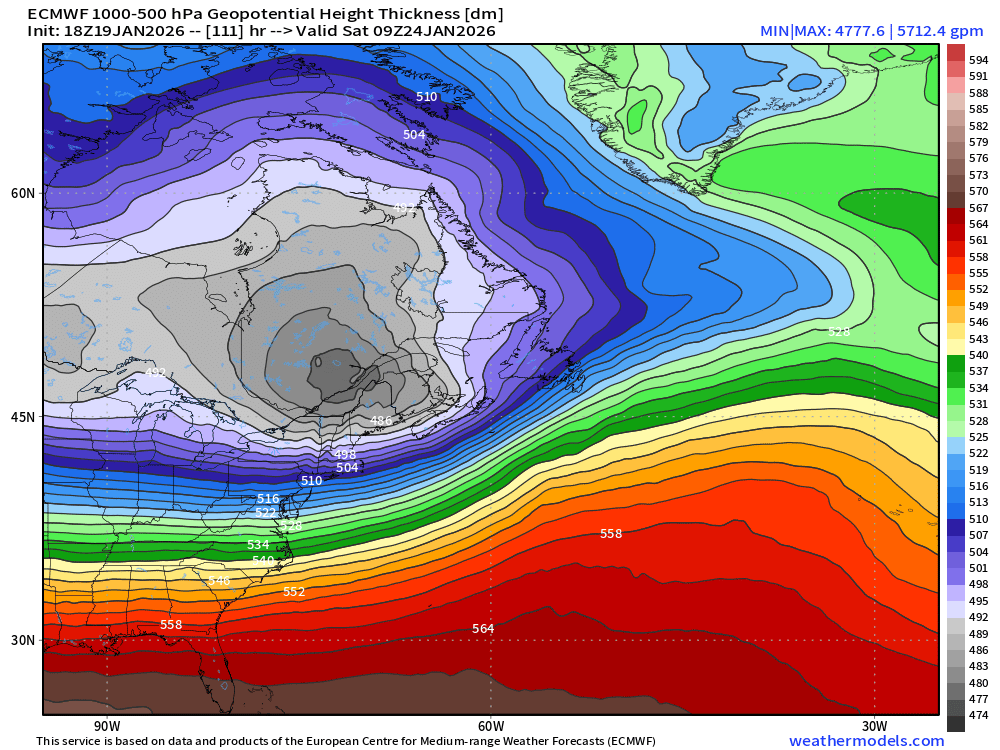
Summary — it’s going to be VERY cold this weekend
Flagship ECMWF 12z EPS | Temperature Anomaly | Next 15-days
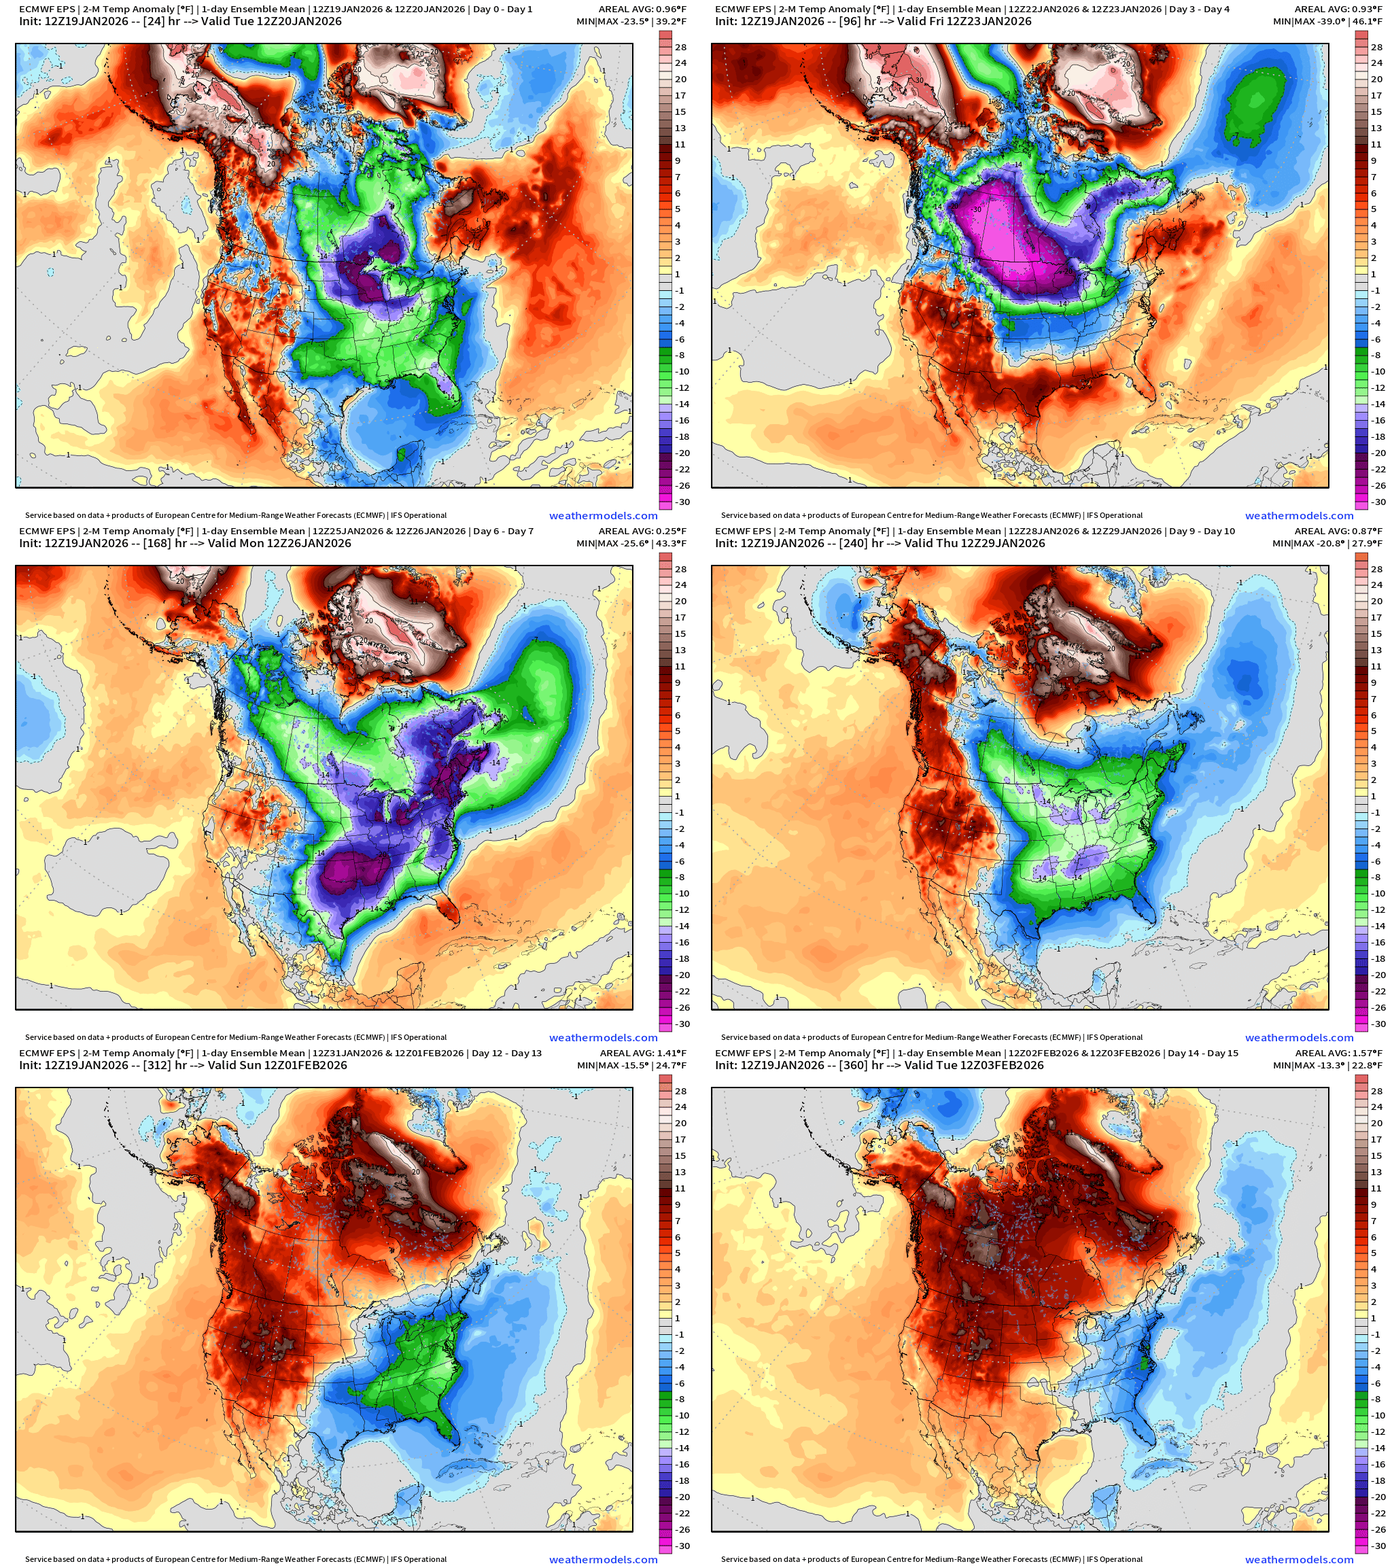
Amazing — world class eruption of cold from the polar vortex anomaly in southern Canada. The massive cold blast washes out into the following week, but you see another round from Canada sweep through the Eastern U.S. including Texas.
Lower 48 | Low Temperatures through Next Wed January 28, 2026
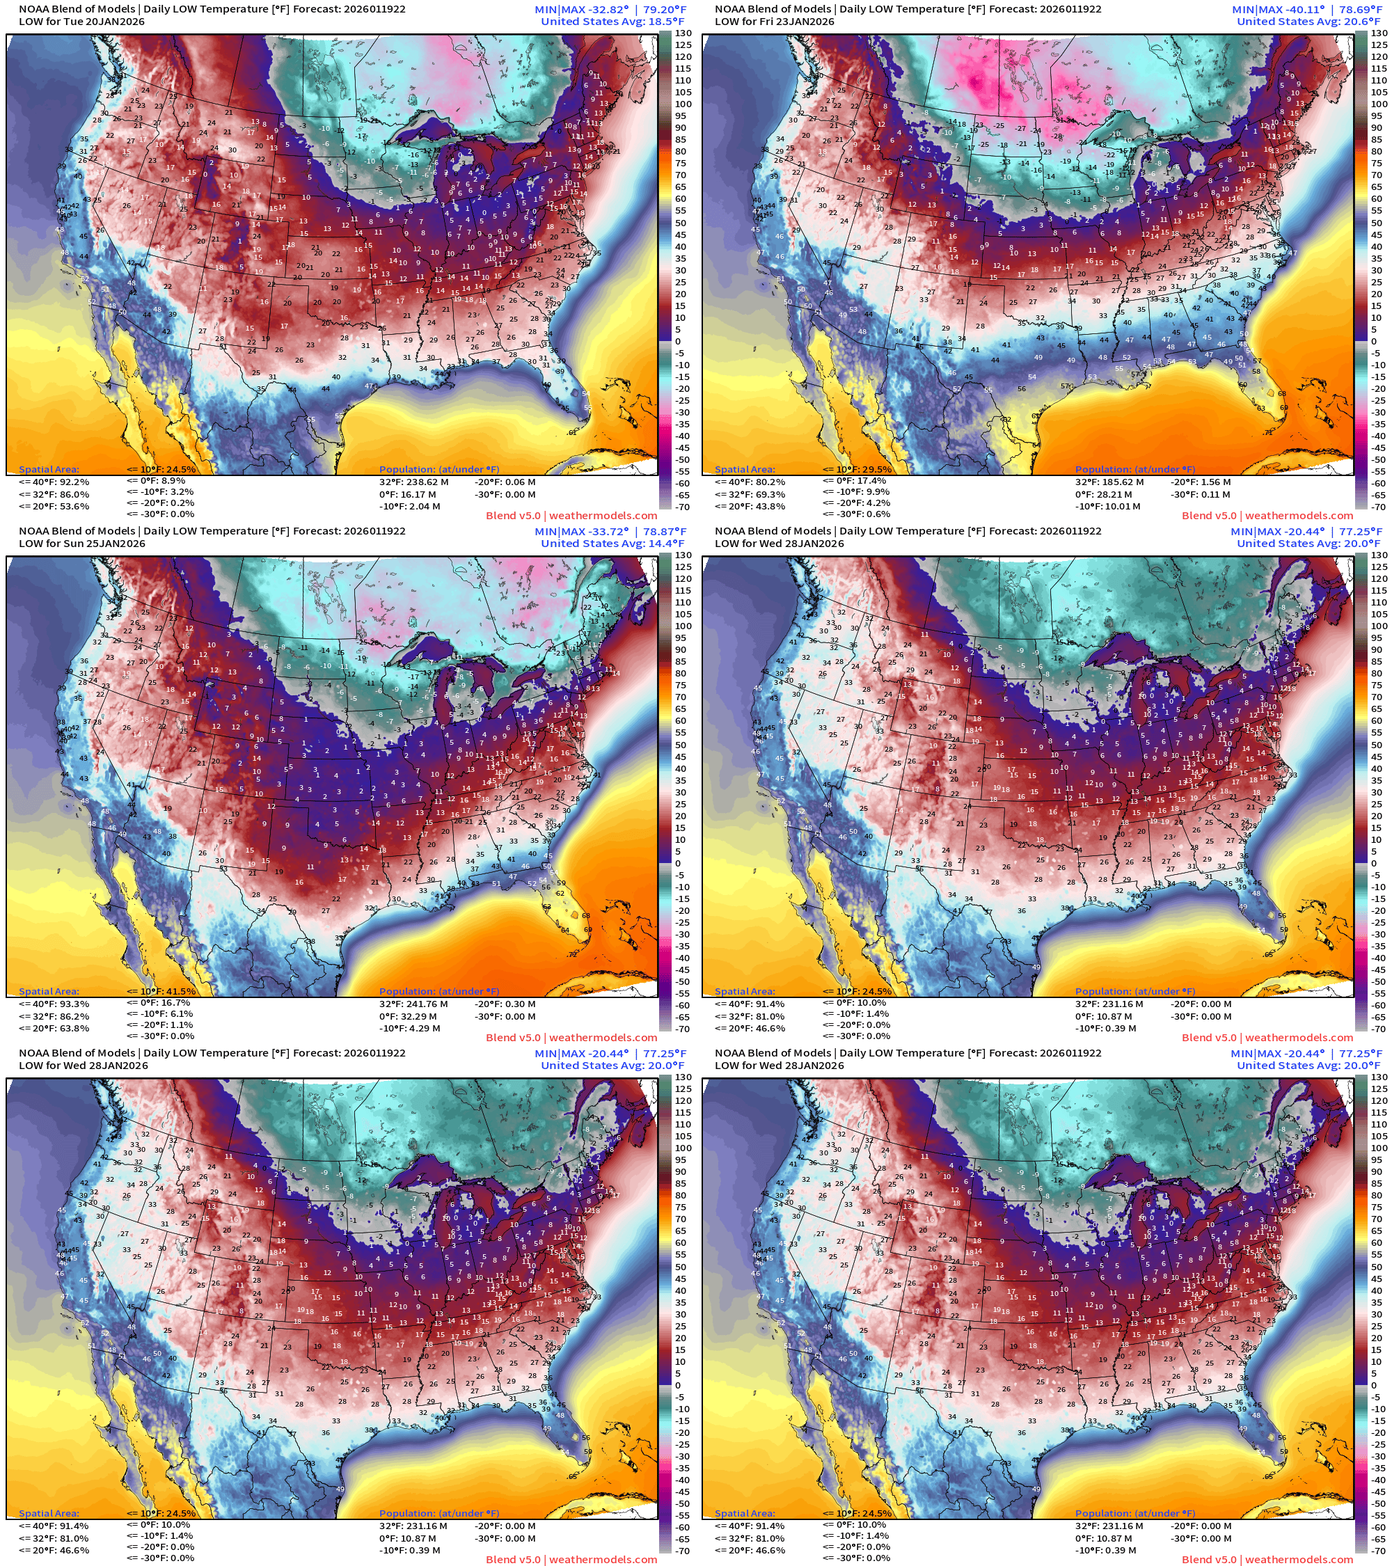
The Blend of Models (v5.0) is rather smooth and is likely underestimating the intensity of the cold next weekend further north but we’re already down to 14.4°F for a Lower 48 minimum temperature, which is getting us into the range of the most intense polar vortex blasts. We’ll see if that can go down to 9°F.
ECMWF 18z | Temperature Anomaly Next 6-days
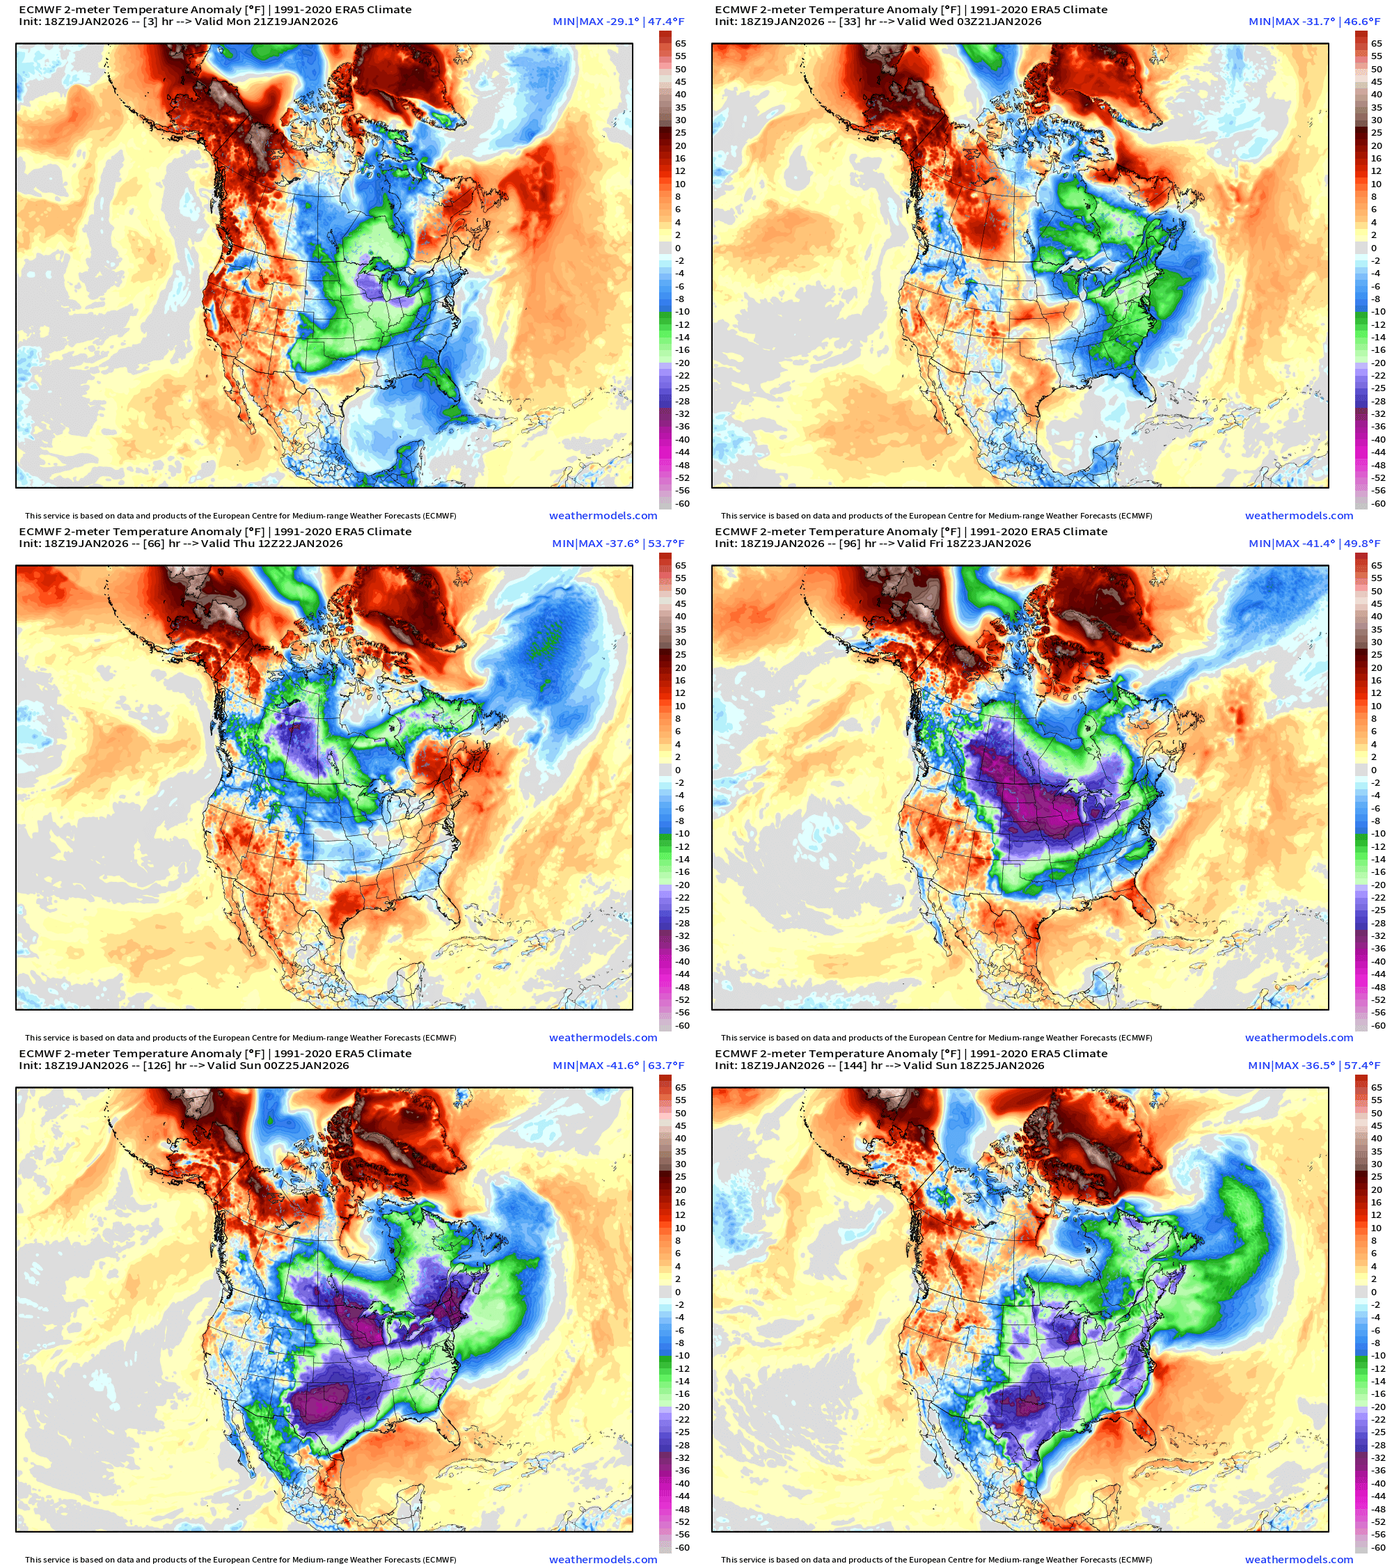
Larger scale view: Extremely cold air intensifies in southern Canada and then floods southward into Lower 48 — dumps into Texas by Saturday and stays there — with potential of a major ice storm as boatloads of subtropical moisture overruns the Arctic air — from Texas through the south into the Carolinas. Complete mess.
ECMWF AIFS-Single 18z | Height Anomaly (500 hPa) Next 10-days
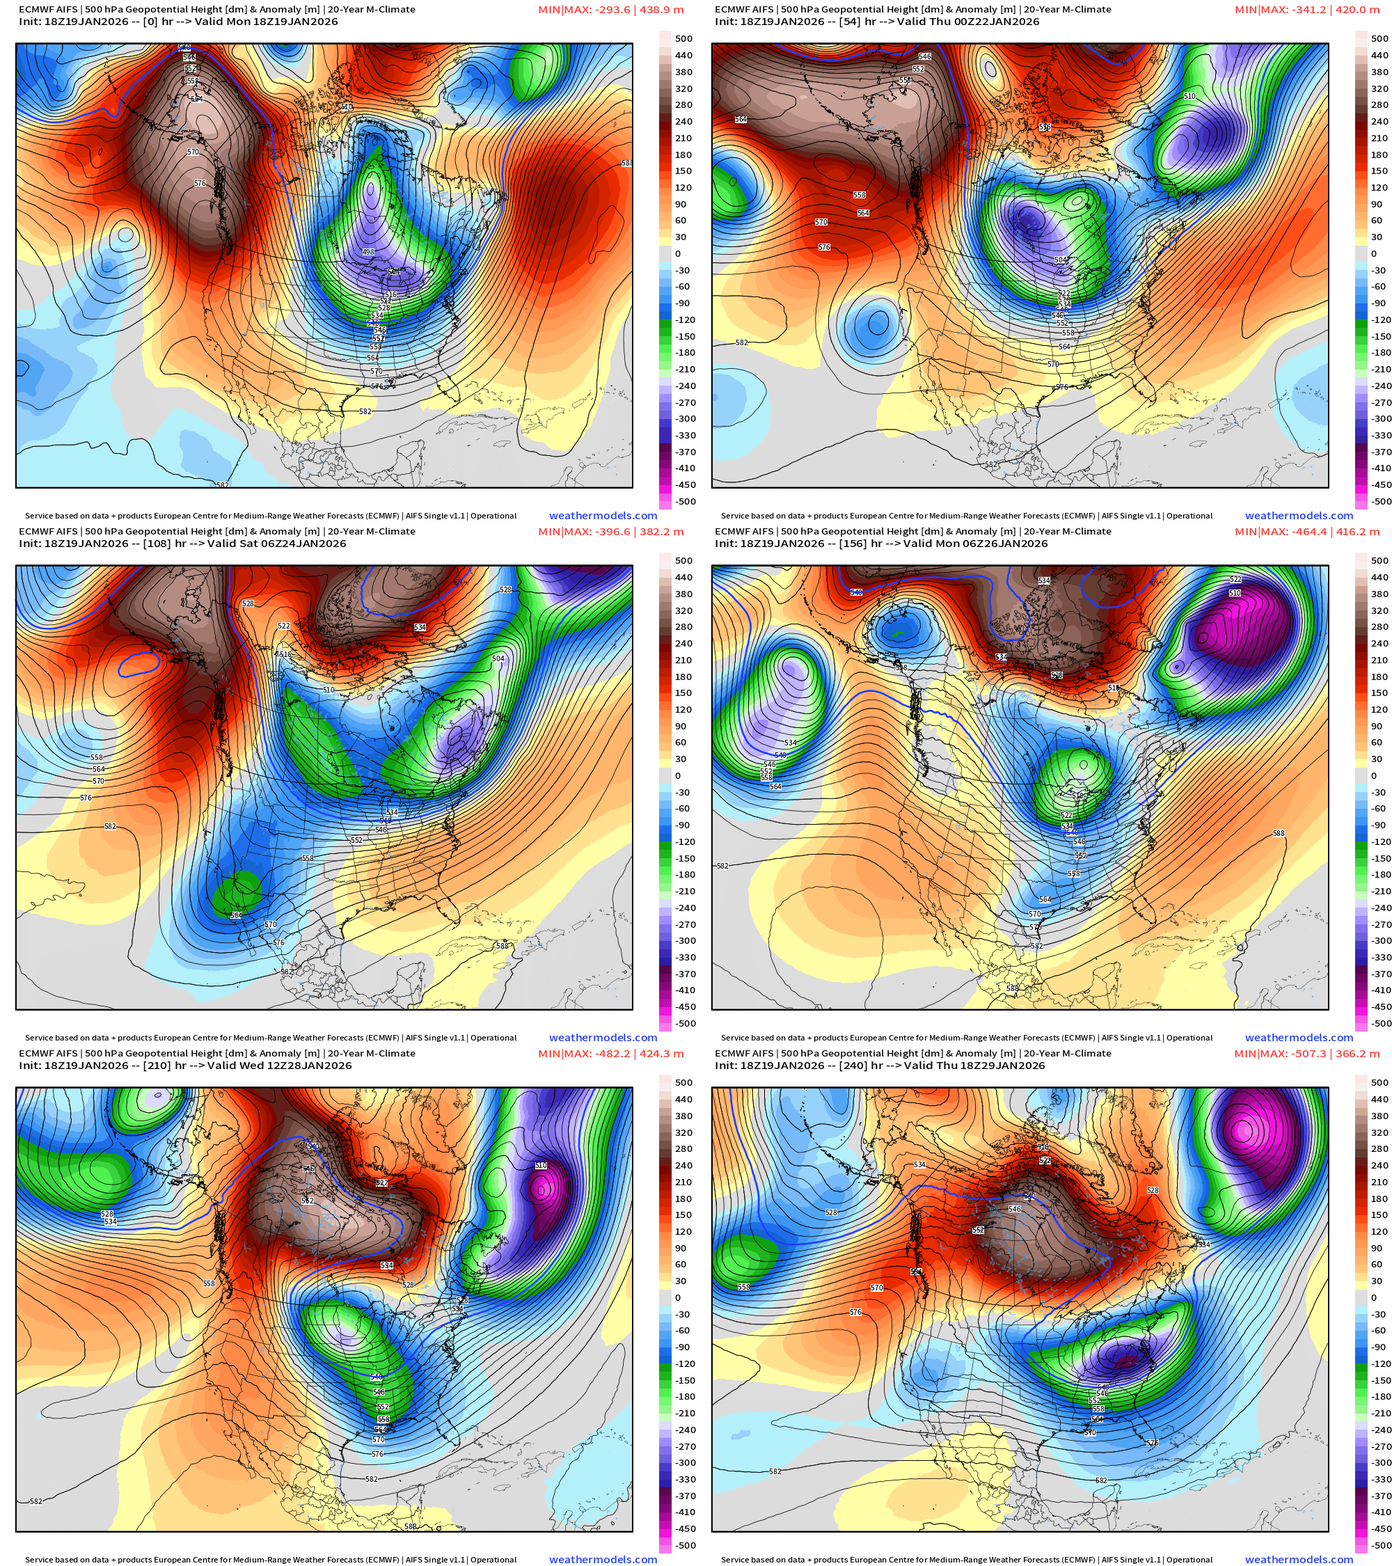
Multiple polar vortex (PV) anomalies drop out of Canada circulating around the main polar front or cold pool centered over southern Canada (Ontario)
ECMWF AIFS-Single 18z | Temperature (500 hPa) Next 10-days
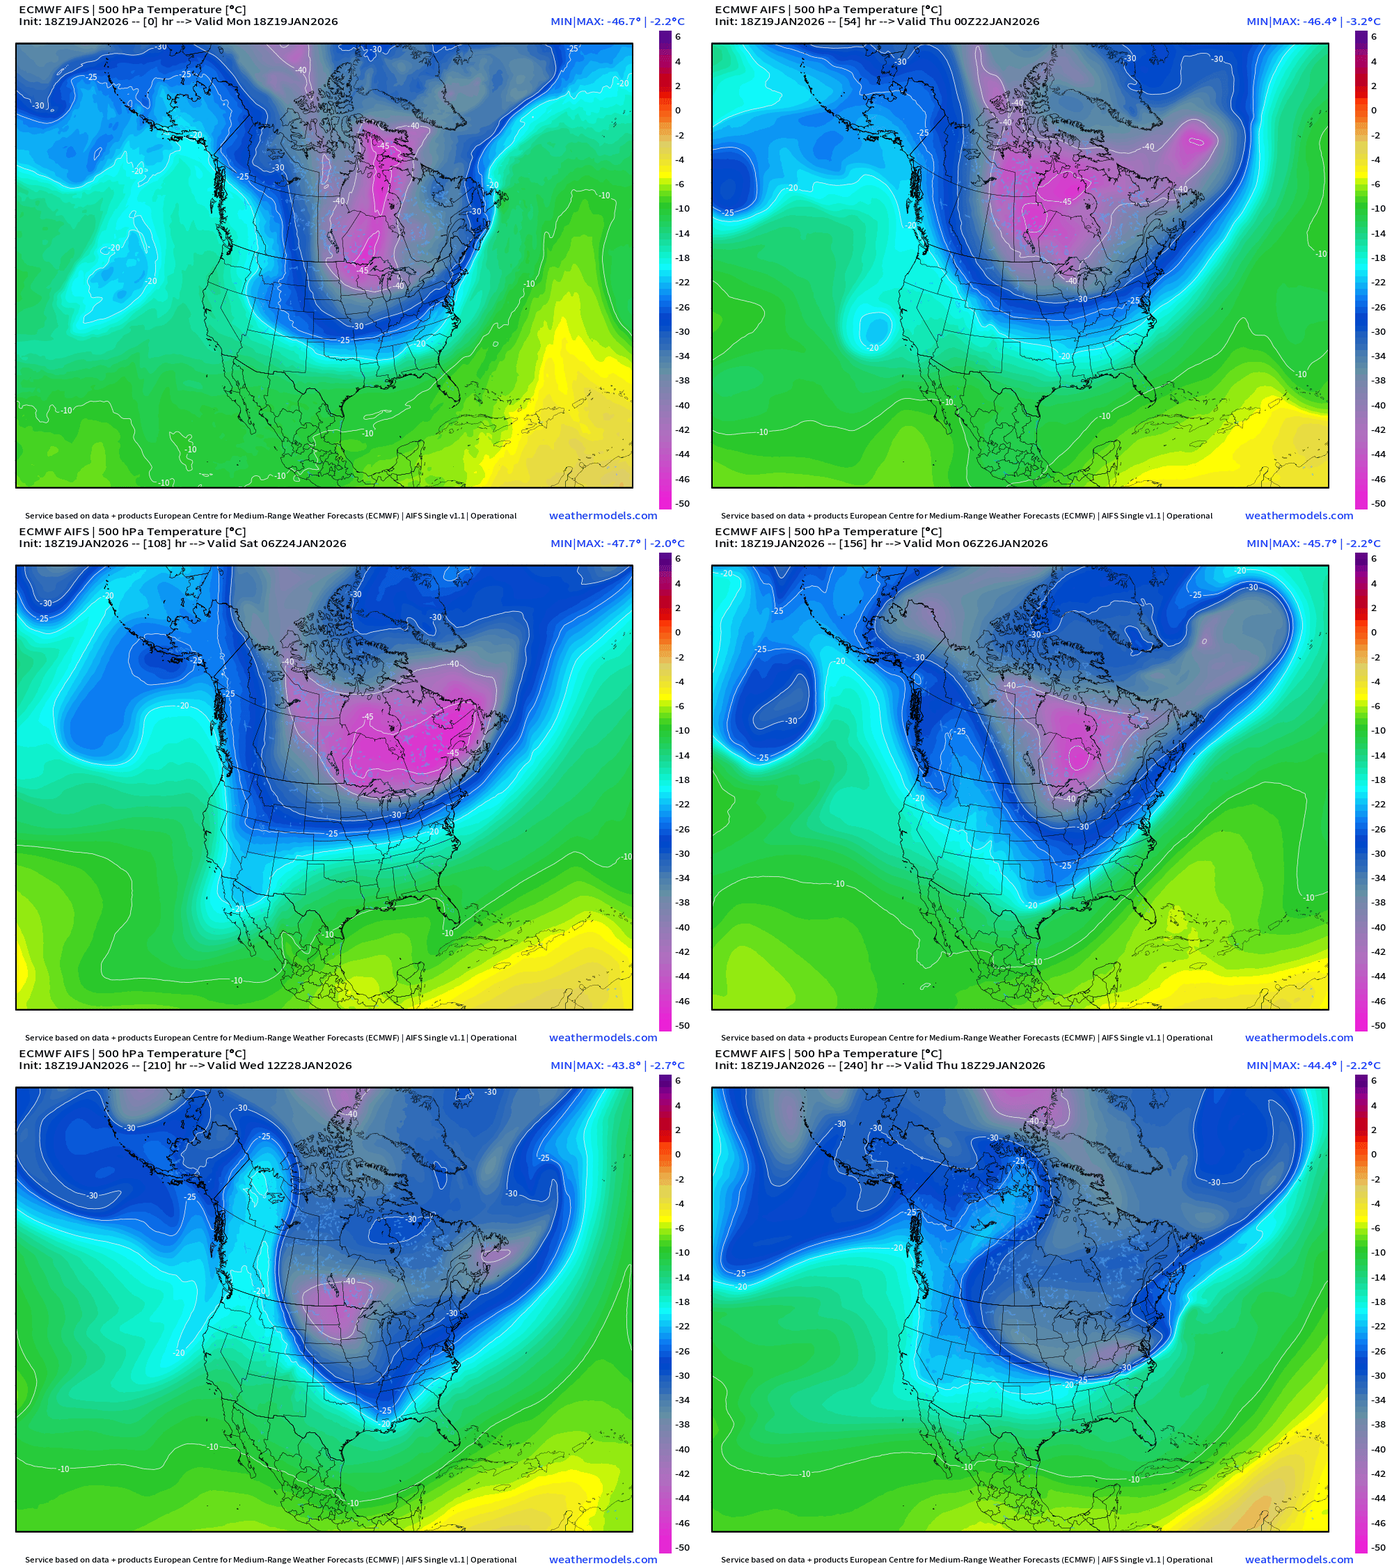
The temperature at 500 mb is the easiest way to highlight the “polar vortex” across North America with the coldest pool at -40°C (pink) with the -25°C contour usually associated with below freezing temperatures at 2-meters (surface).
The Western U.S. and Pacific Northwest ridge is very apparent and firmly entrenched vs. the Hudson Bay / Arctic Canada undulations are dipping southward into the eastern U.S. = cold.
Now we are seeing -45°C to -50°C contours dipping into the Great Lakes and Northeast —> risk for the most extreme cold.
AIFS-Single Snowfall Through 15-days has been unbelievable
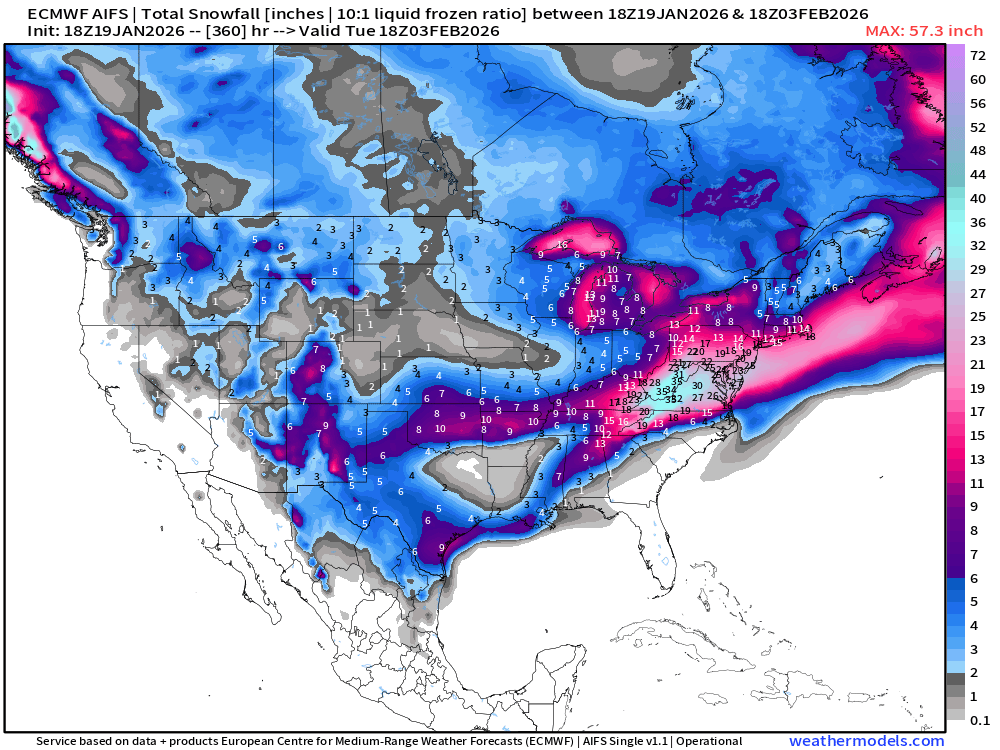
The current forecast cycle has snowfall in Texas along the Gulf Coast from Houston to Brownsville, and upwards of 2-3 feet centered on West Virginia. That’s nothing compared to what the 12z cycle showed.
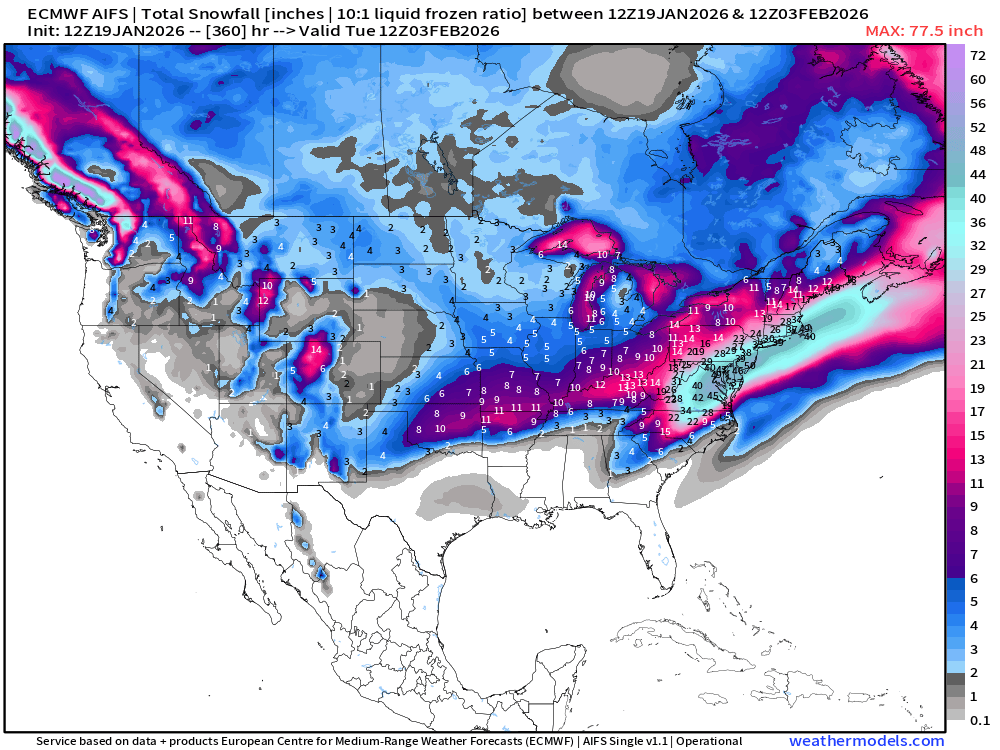
This was an “all time” multiple blizzard forecast cycle that we can hang up the in Weather Model Museum
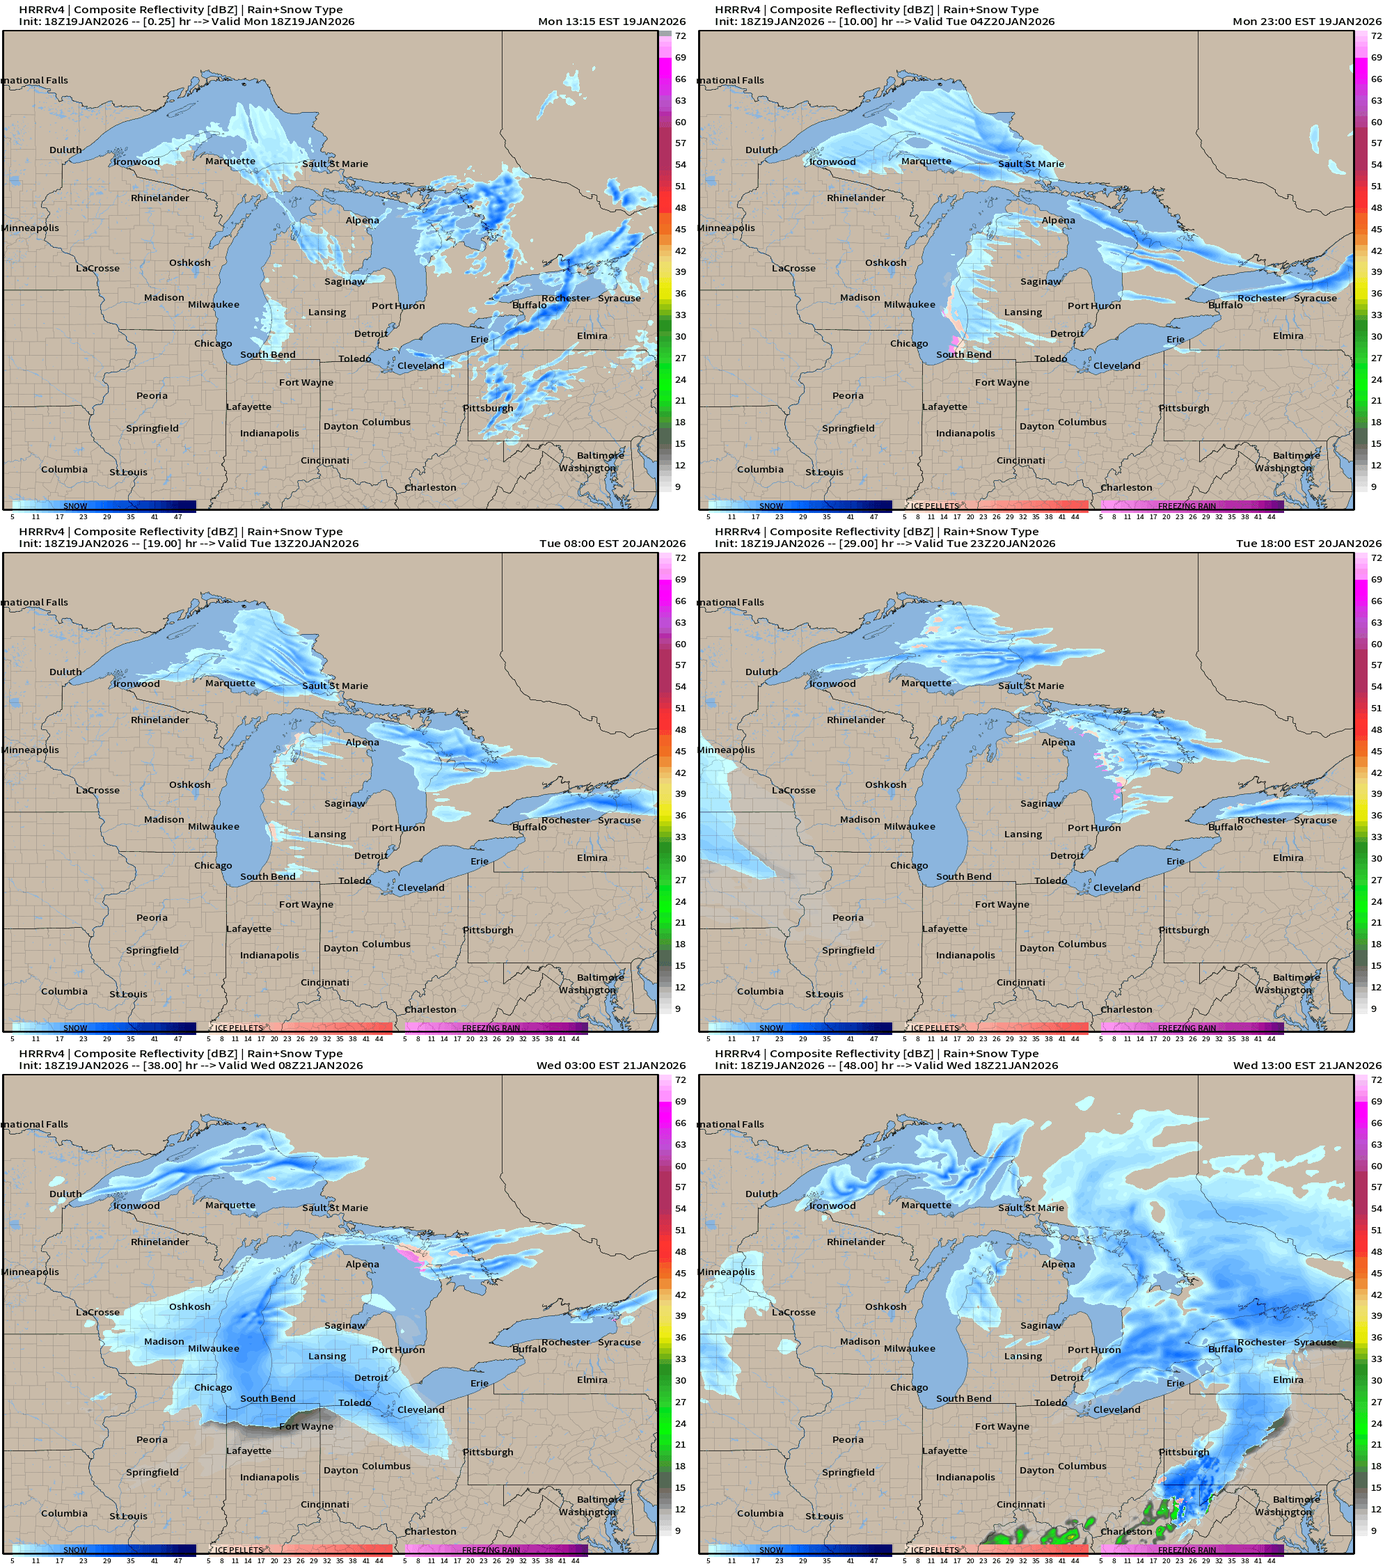
HRRR Next 48-hours Radar | Through Wednesday 1 PM ET
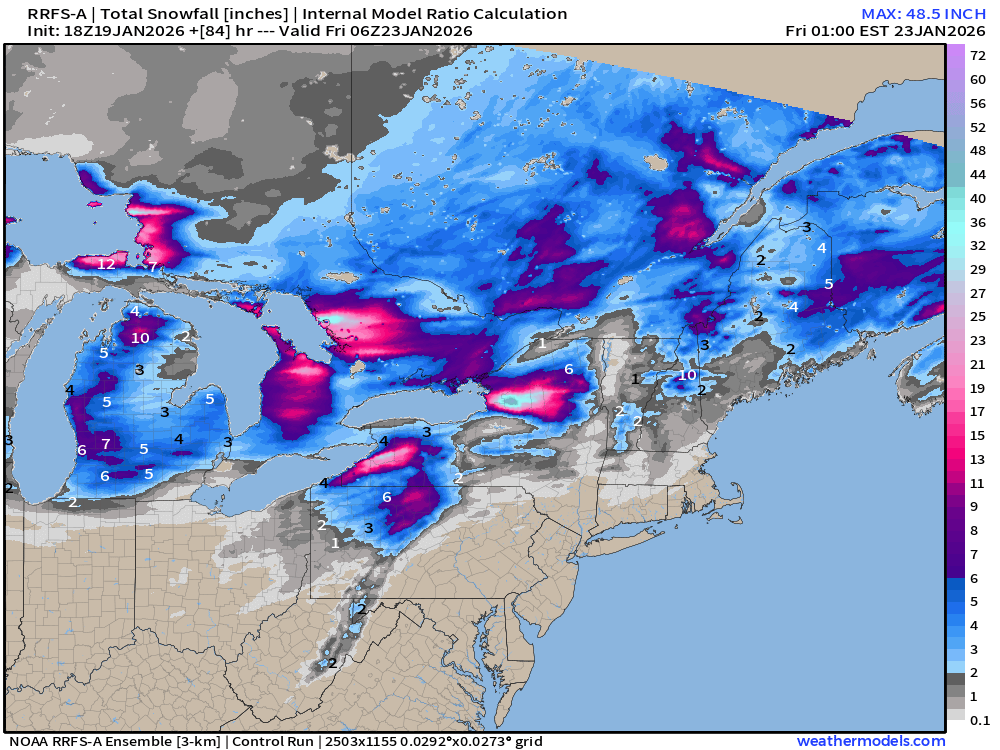
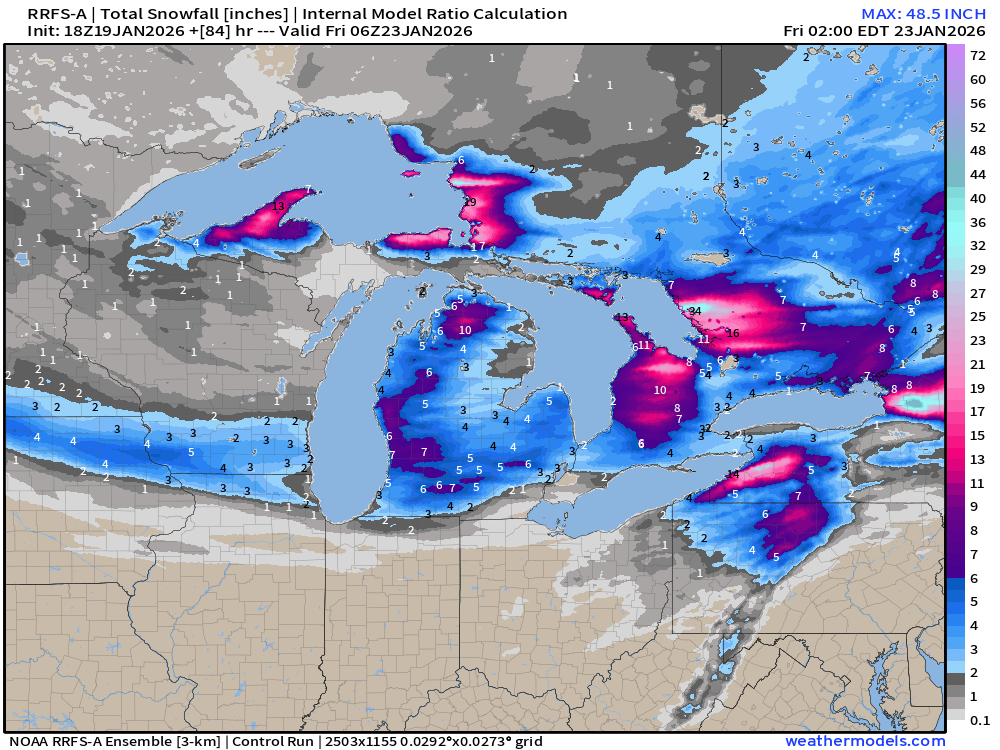
RRFS-A nicely paints the Lake Effect Snow over the next 84-hours
ECMWF 18z | Precipitable Water Next 6-days | My Favorite Parameter
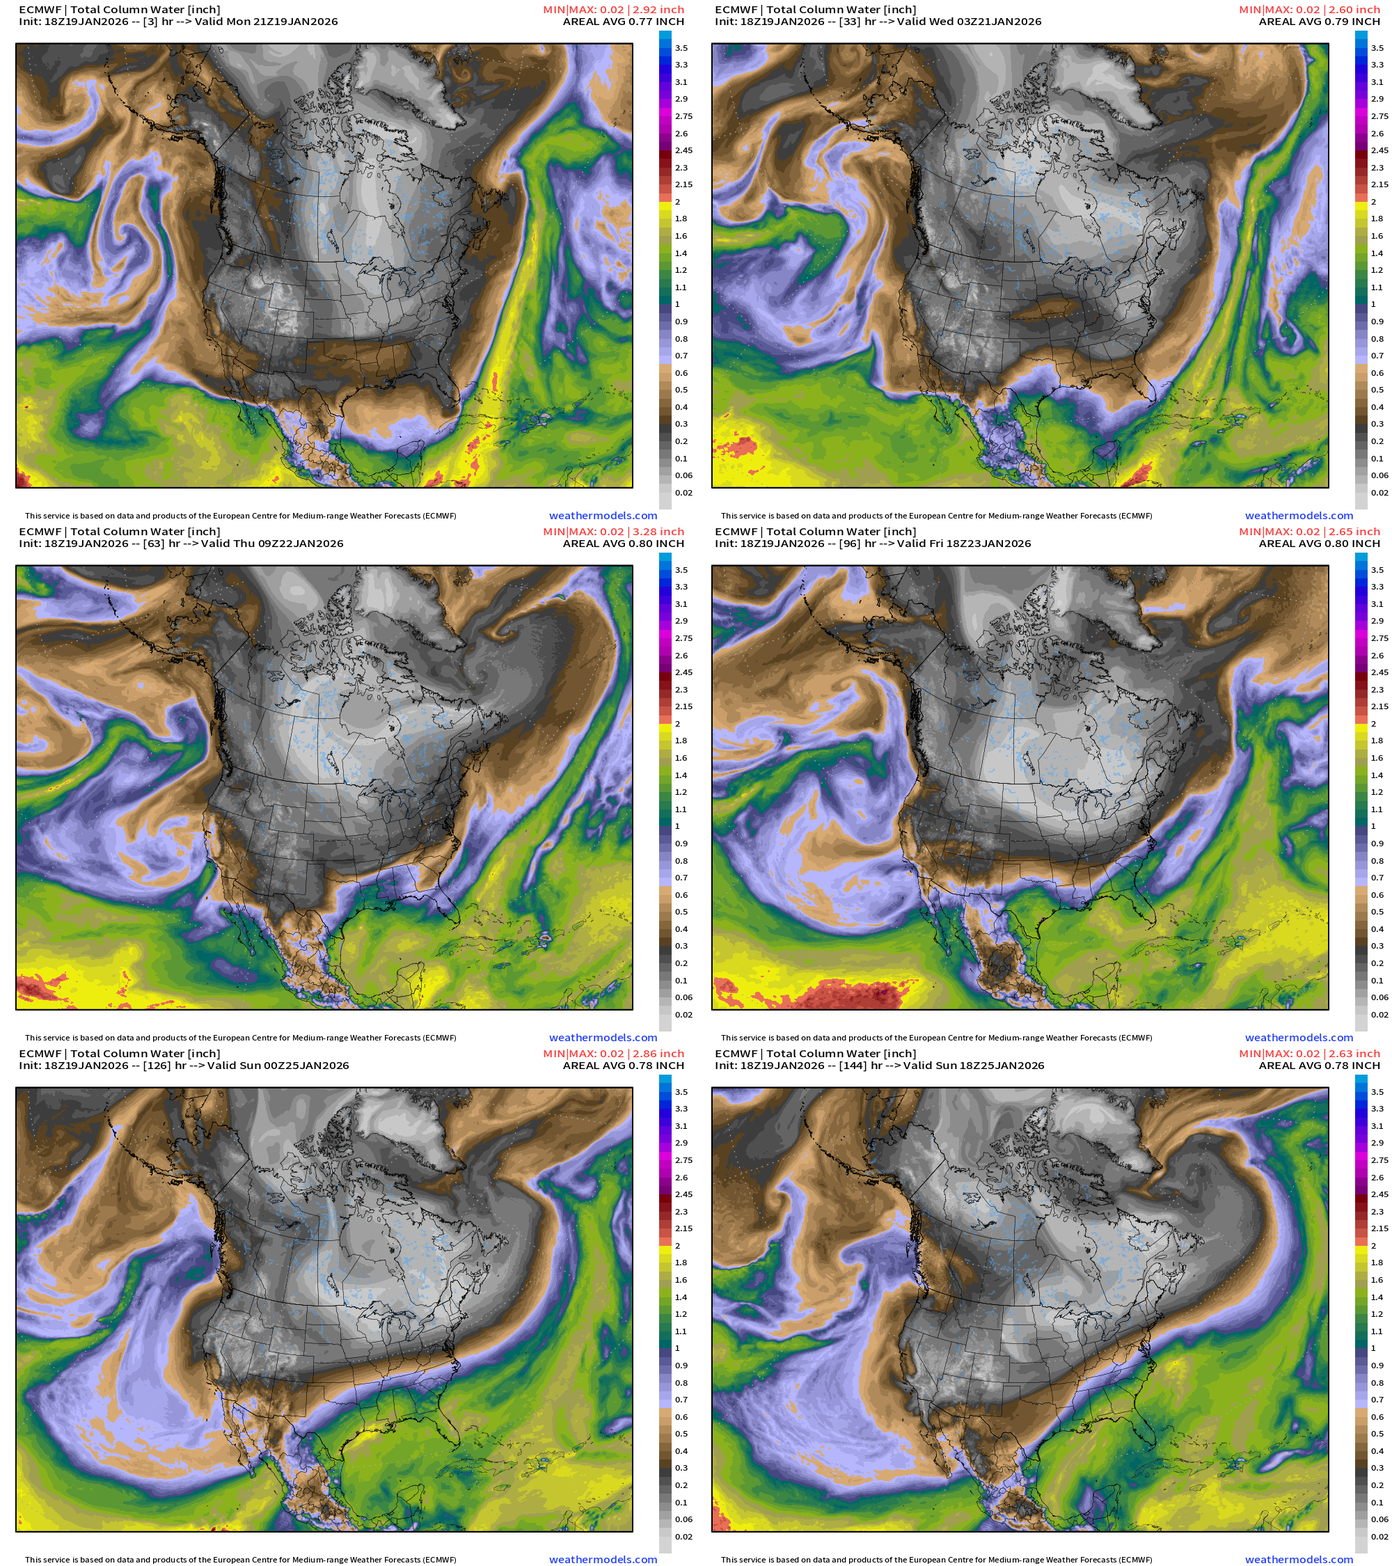
The collision of the extremely cold and dry/dense Arctic air will undercut the very moist and warmer air coming from the Gulf of Mexico and Pacific subtropics. The result is a battleground of frozen precipitation from freezing rain, sleet, ice, and snow to whatever else you can think of —> massive frozen precipitation mess.
ECMWF 18z Precipitation Type and Intensity | Next 6-days
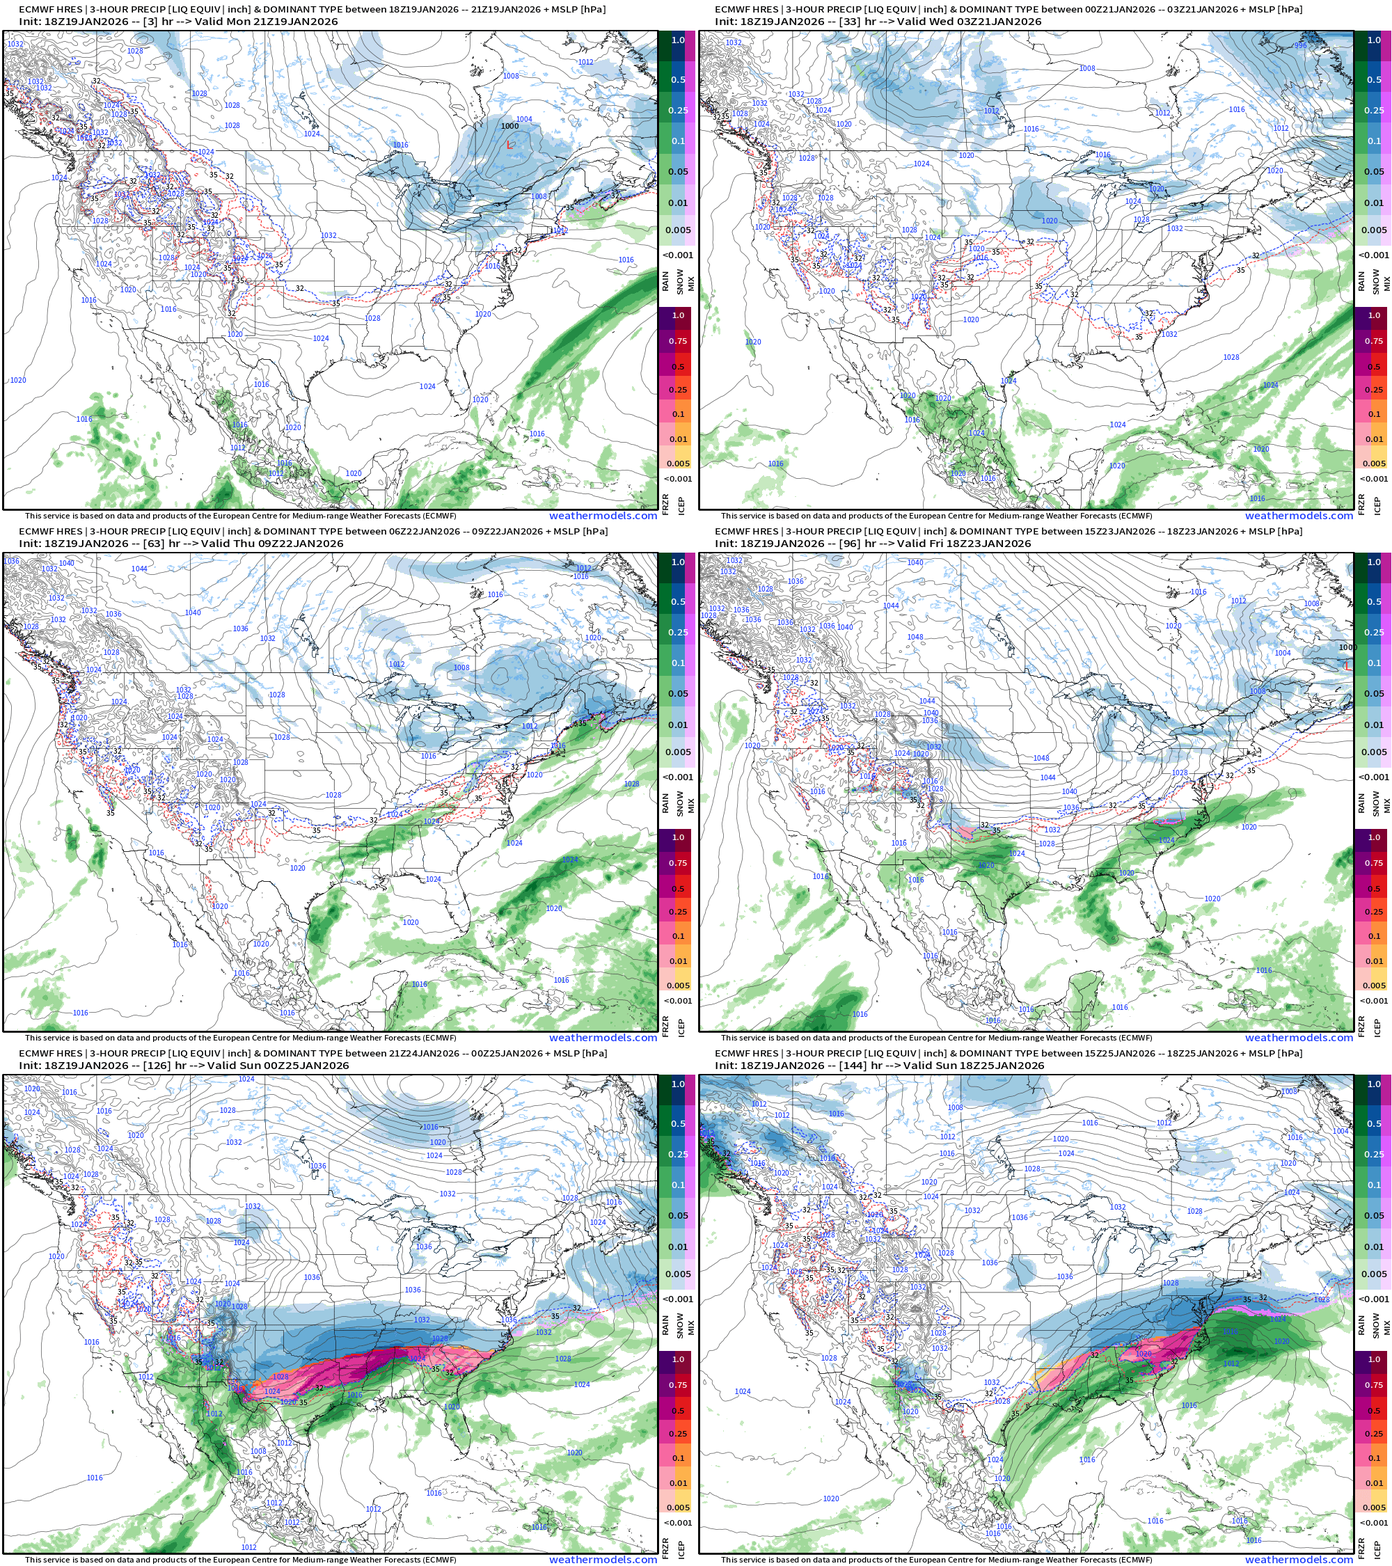
Likely Very Major Ice Storm across the South from Texas into Georgia and the Carolinas with heavy snowfall to the north as moisture from the south overruns the entrenched Arctic high pressure dry air cold pool.
Faster Zoom on Friday into Sunday —> Yikes!
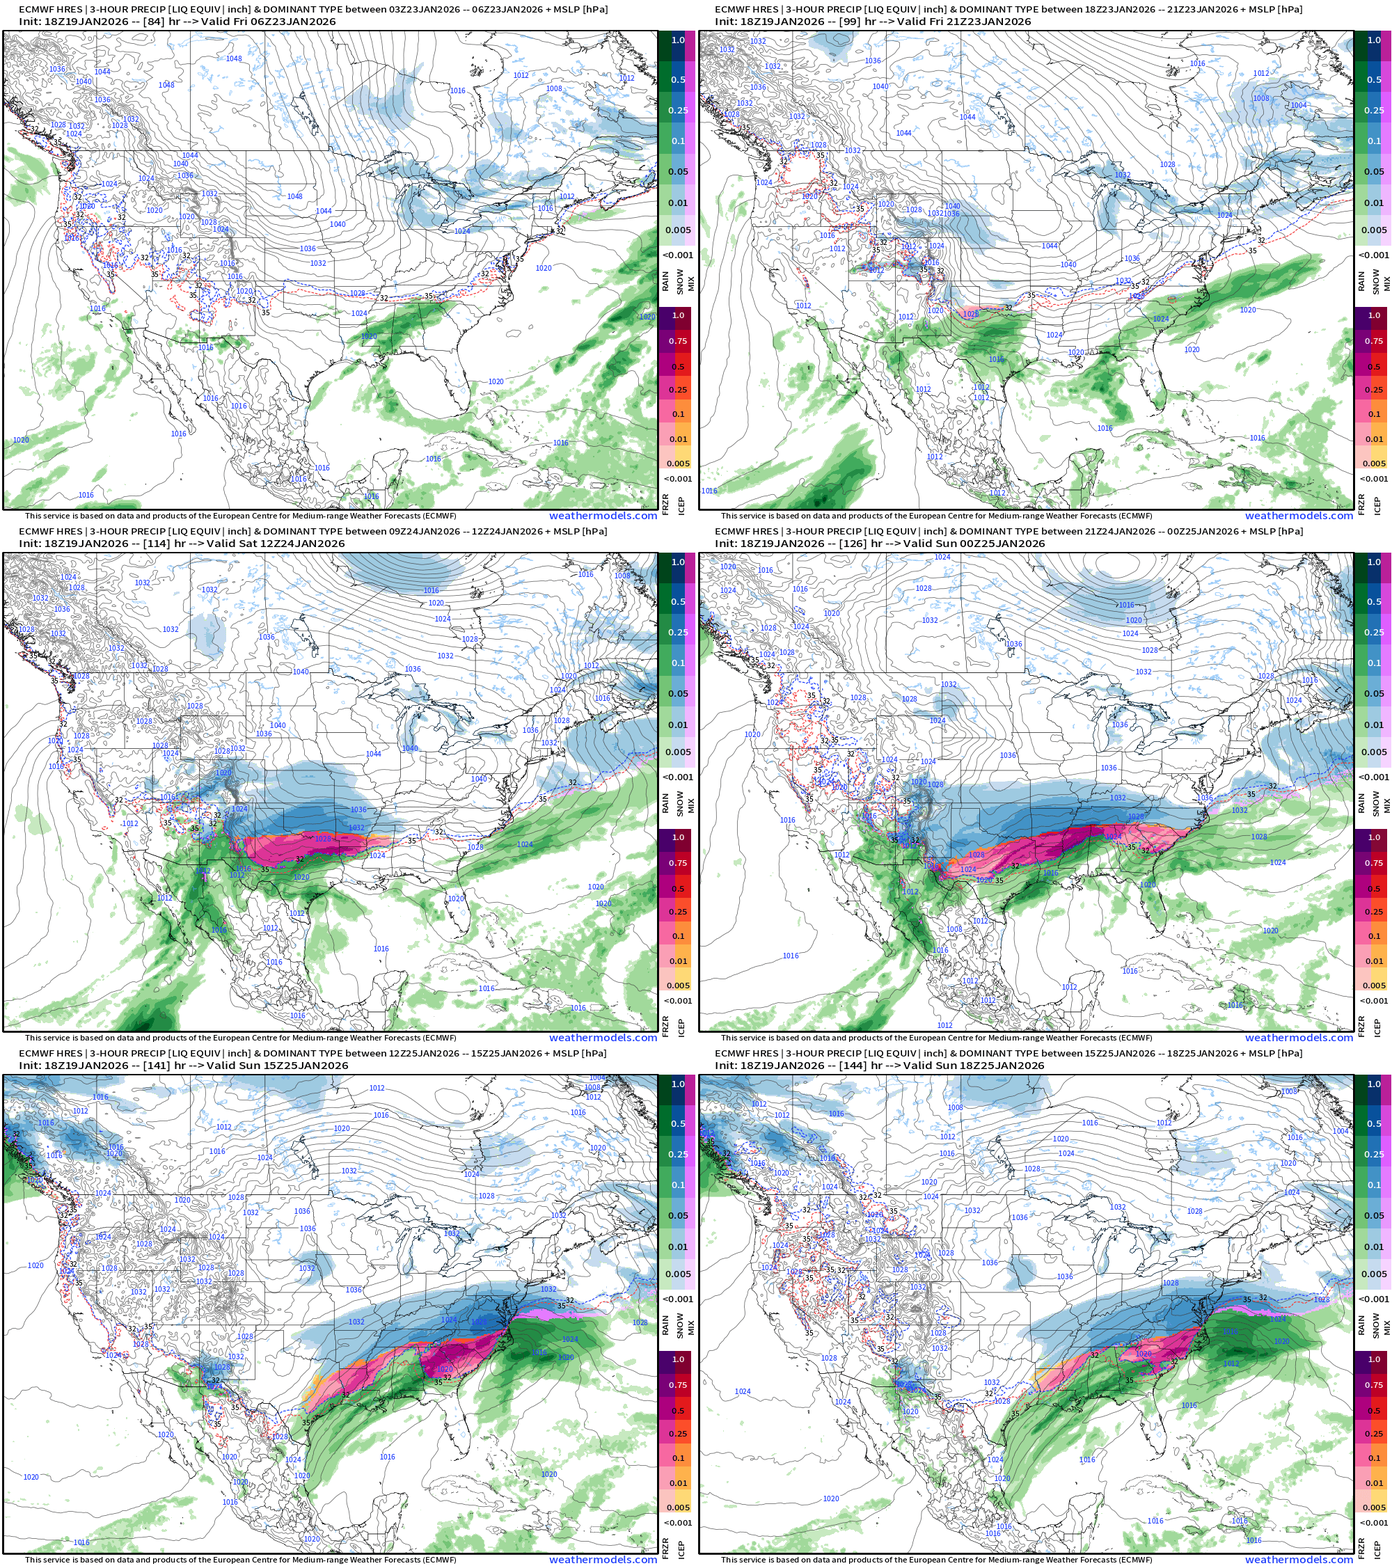
More details on Tuesday — and the rest of the week to pinpoint snowfall and ice / freezing rain accumulation. This doesn’t look good!
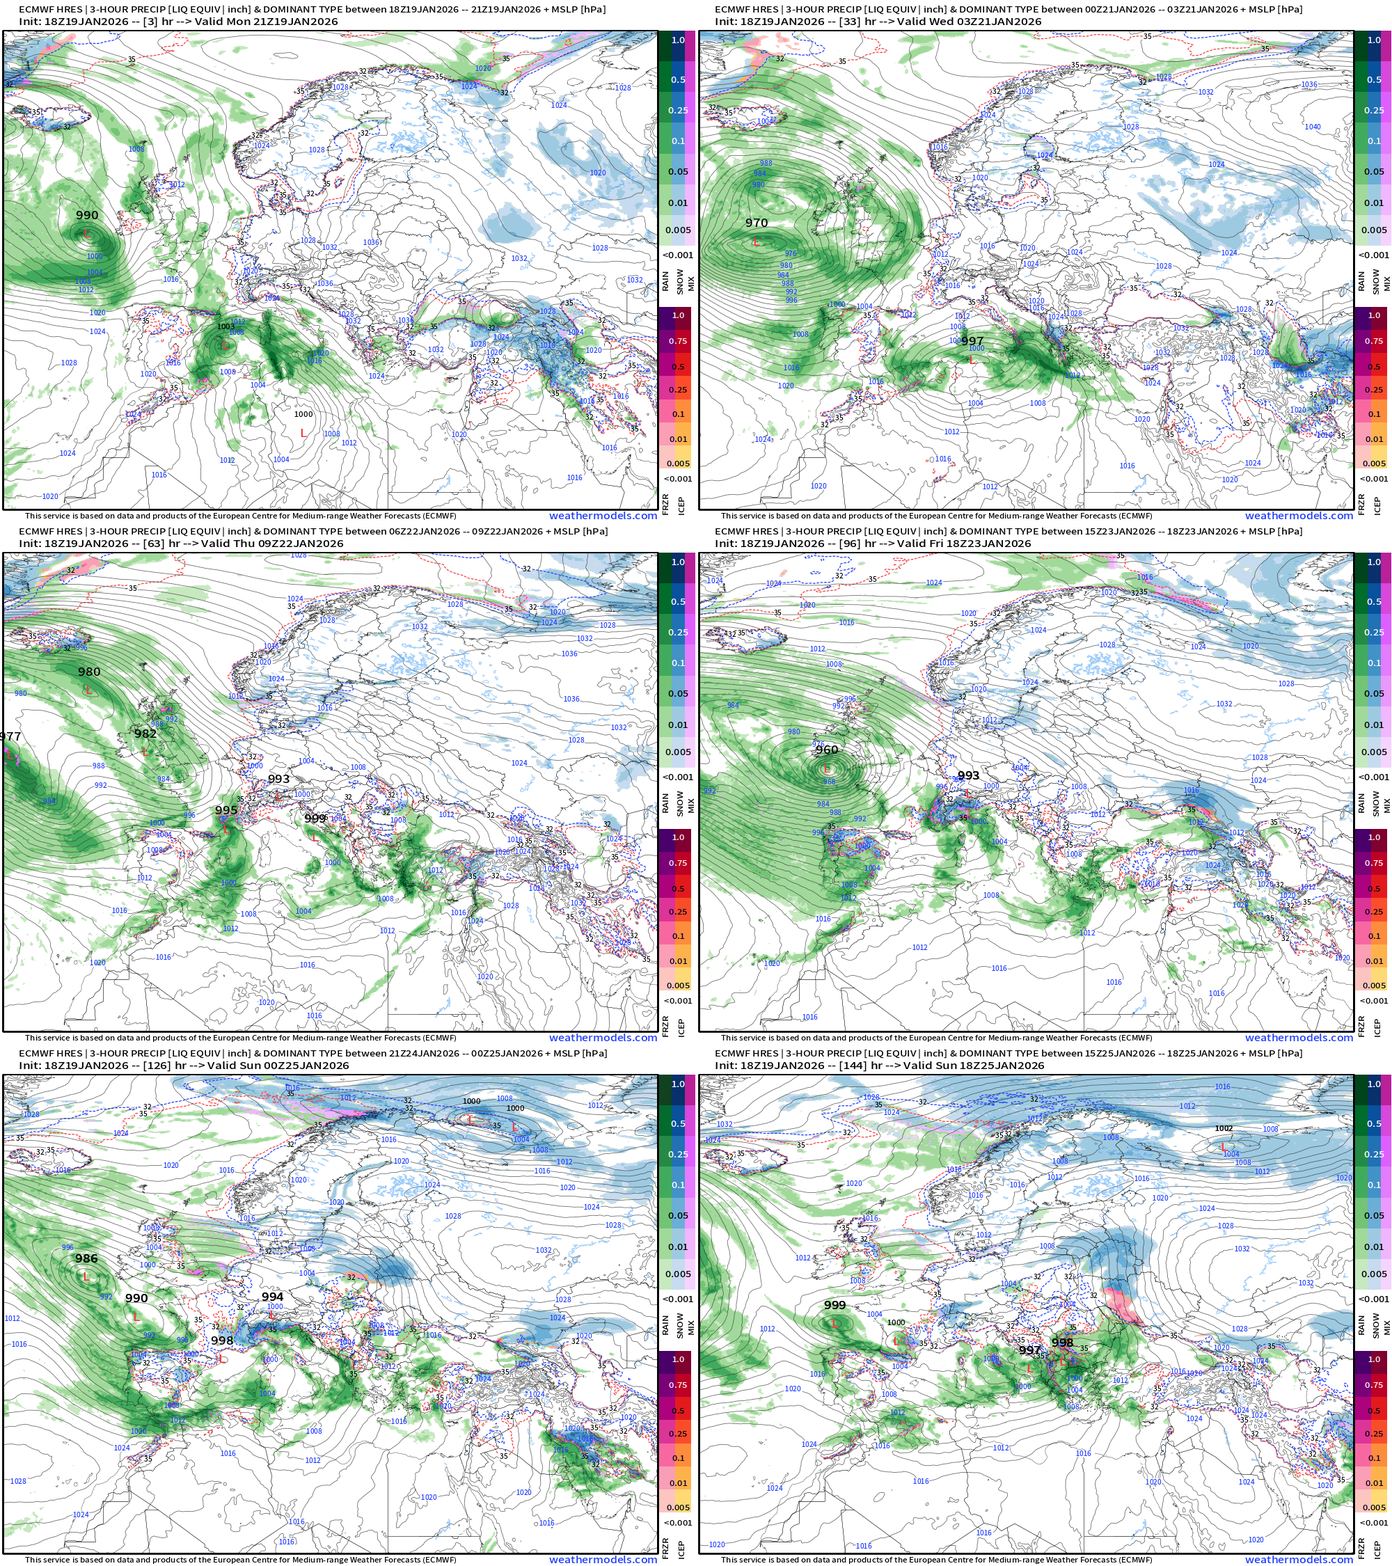
Europe Storm Systems next 6-days
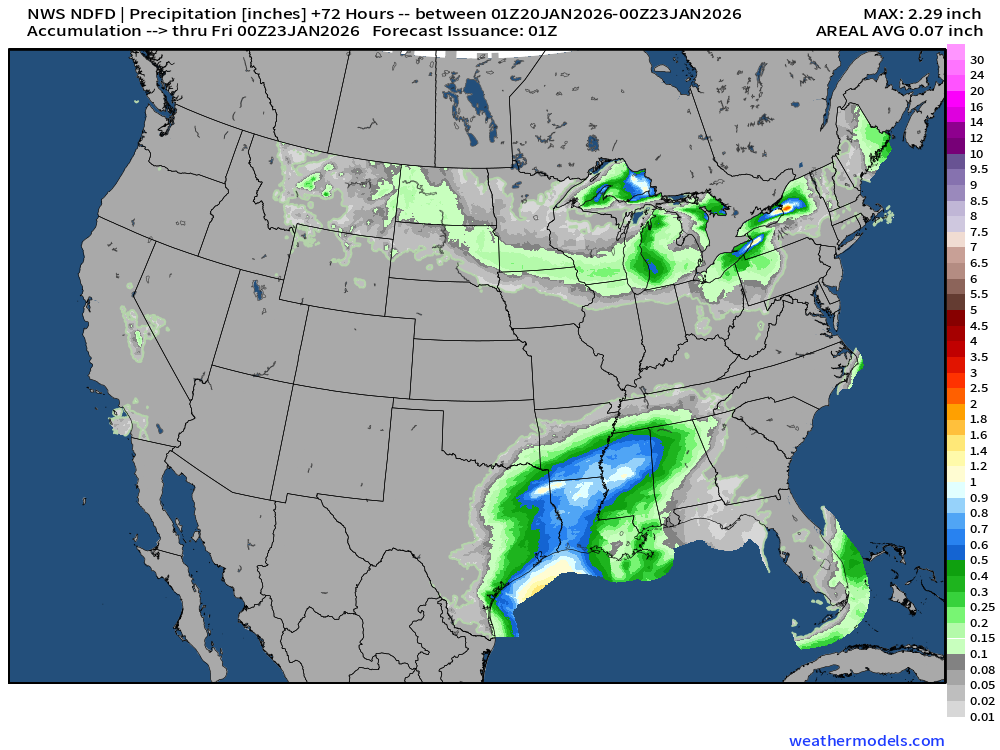
NWS Precipitation Next 72-hours
NWS Snowfall Next 72-hours
RTMA | Temperature Analysis | 7:45 PM ET
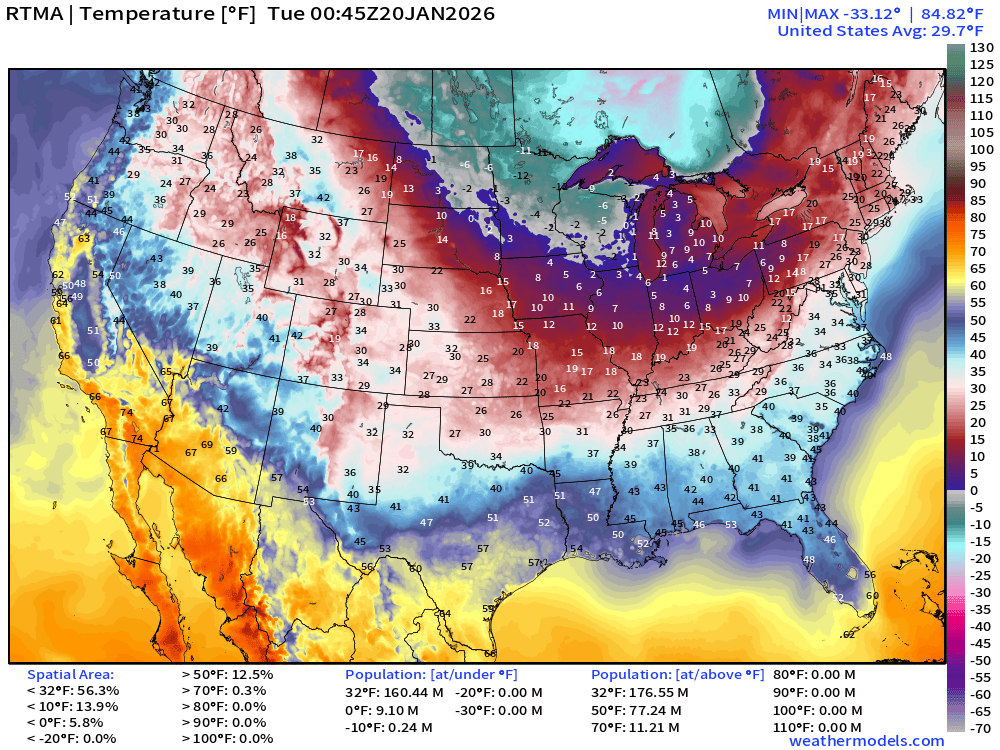
Average Lower 48 temperature was 29.7°F with 160 million below freezing.
More than 9 million below zero — and that number will be increasing.
Temperature Anomaly | 7:45 PM ET
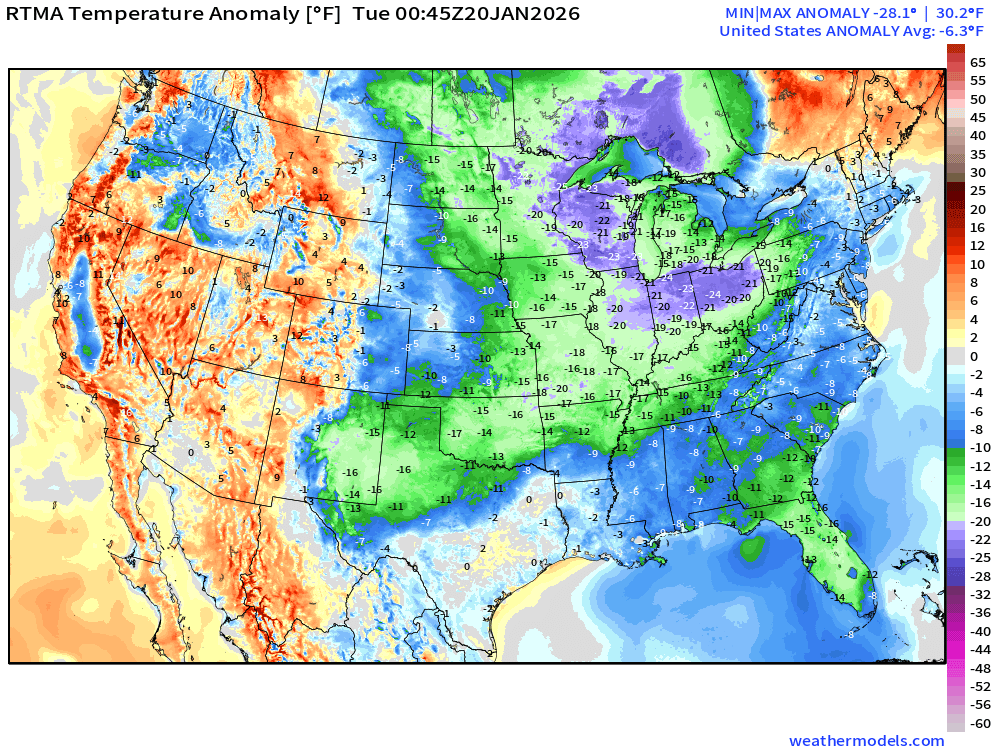
Lower 48 Temperature Anomaly below normal by -6.3°F
Tuesday Morning Low Temperatures
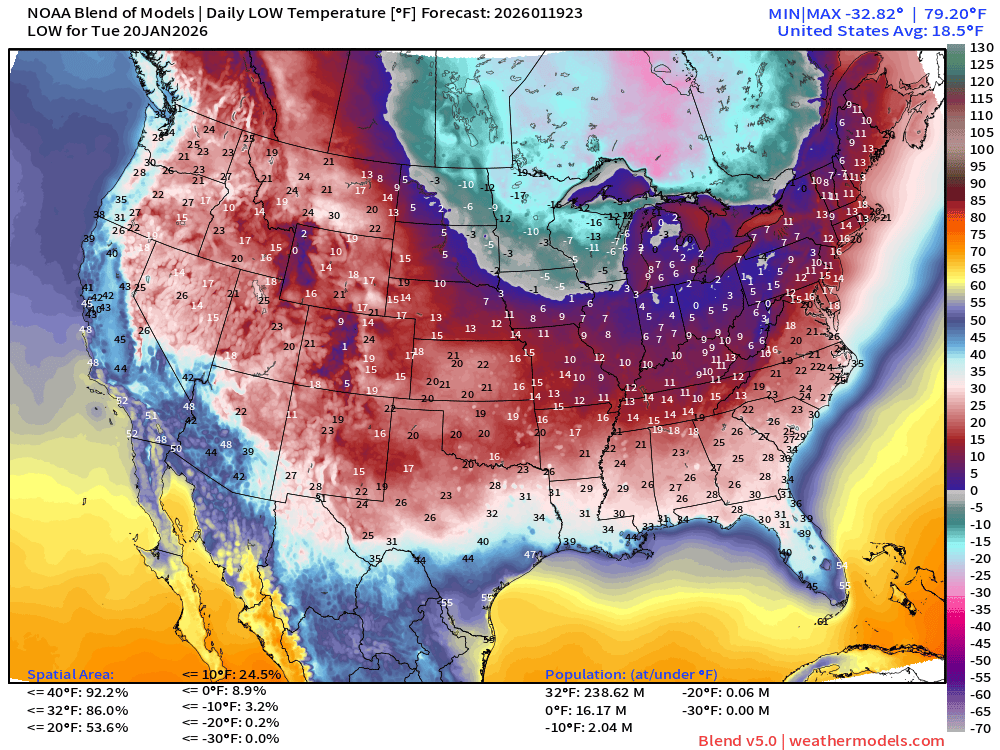
239 million below freezing — nationwide average of only 18.5°F. 16 million below zero.
Tuesday High Temperatures
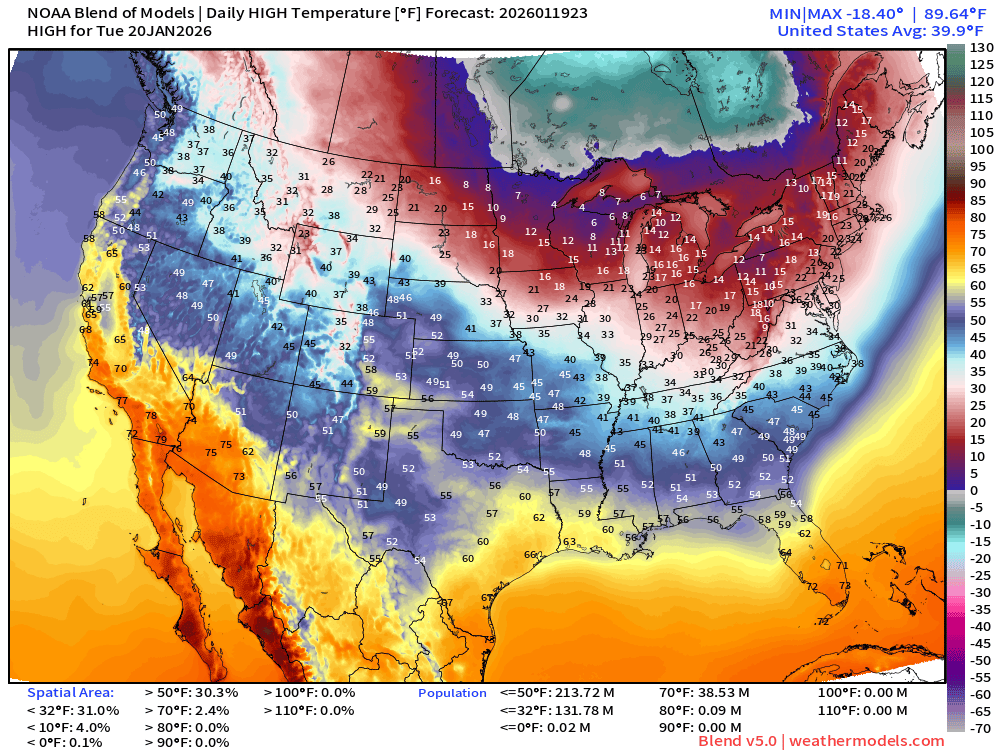
Nationwide average of 39.9°F and 132 million stay below freezing.
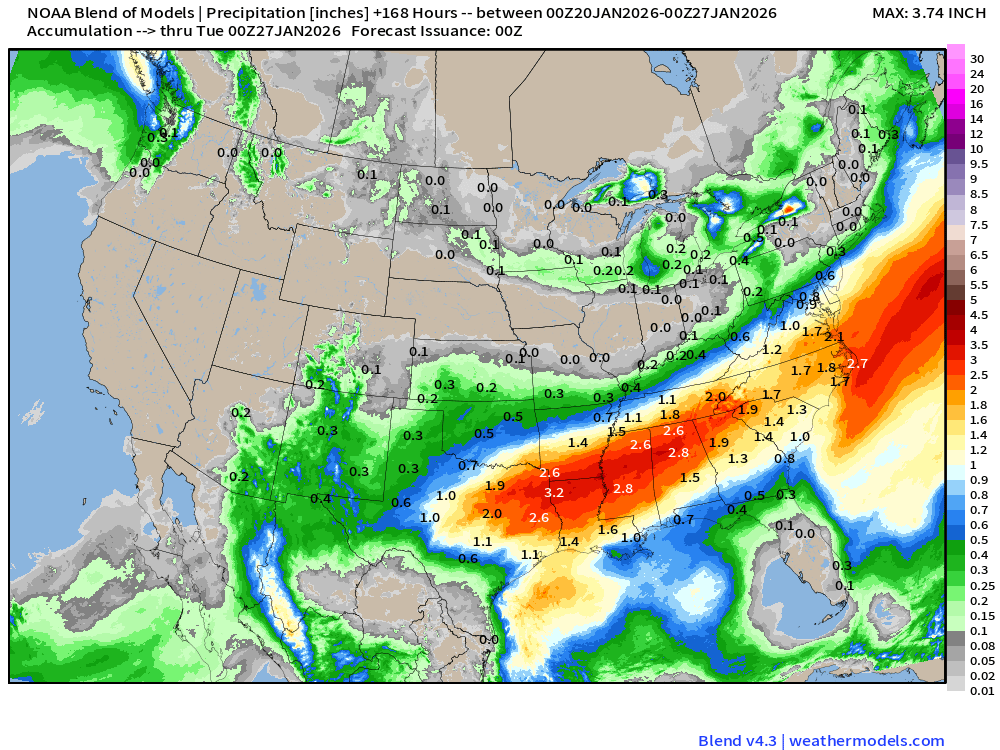
Blend of Models | 7 Days Precipitation Total
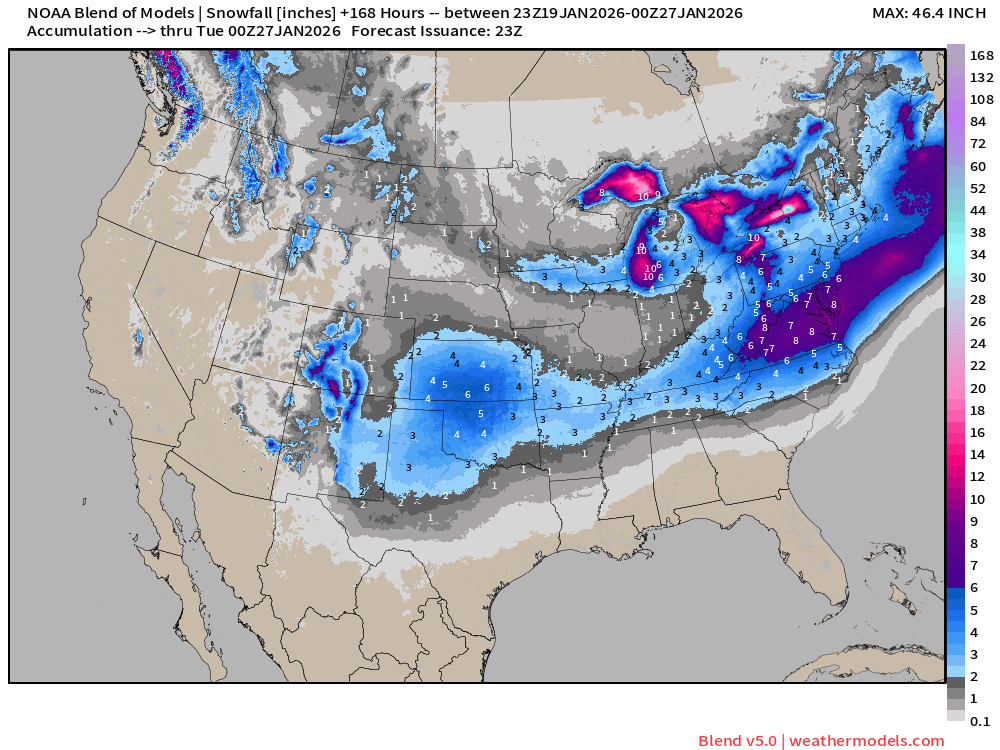
Blend of Models v5.0 | Total Snowfall Next 7-Days
Note this is a very smooth product and likely underestimates the potential since NOAA GFS products are mixed within … and that model is much poorer skill at 7-days.
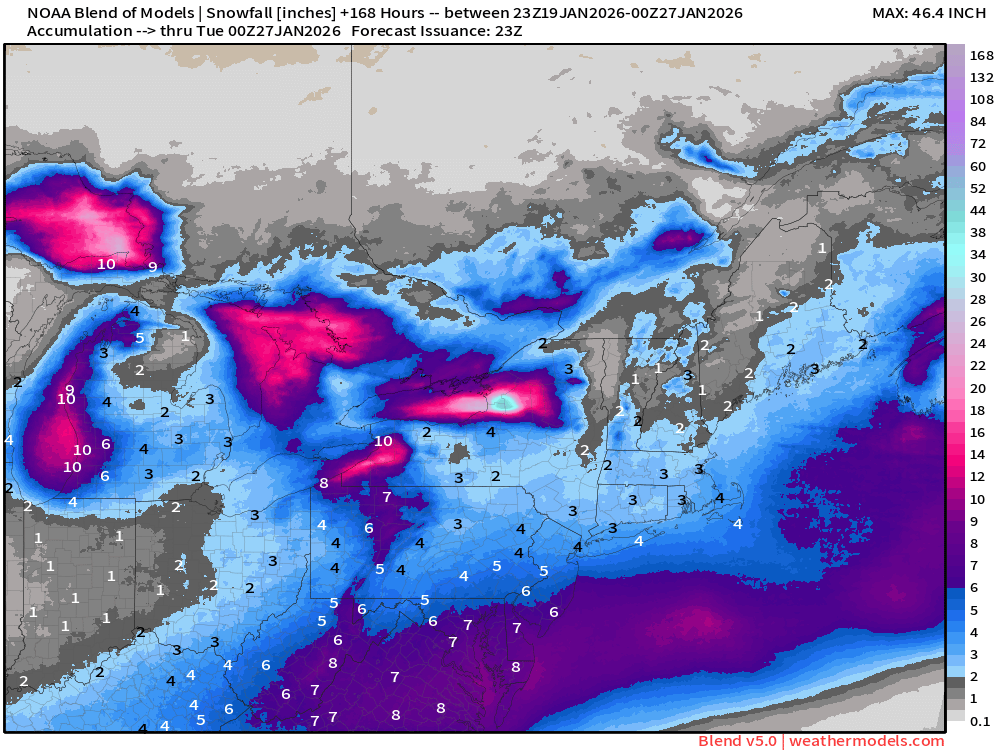
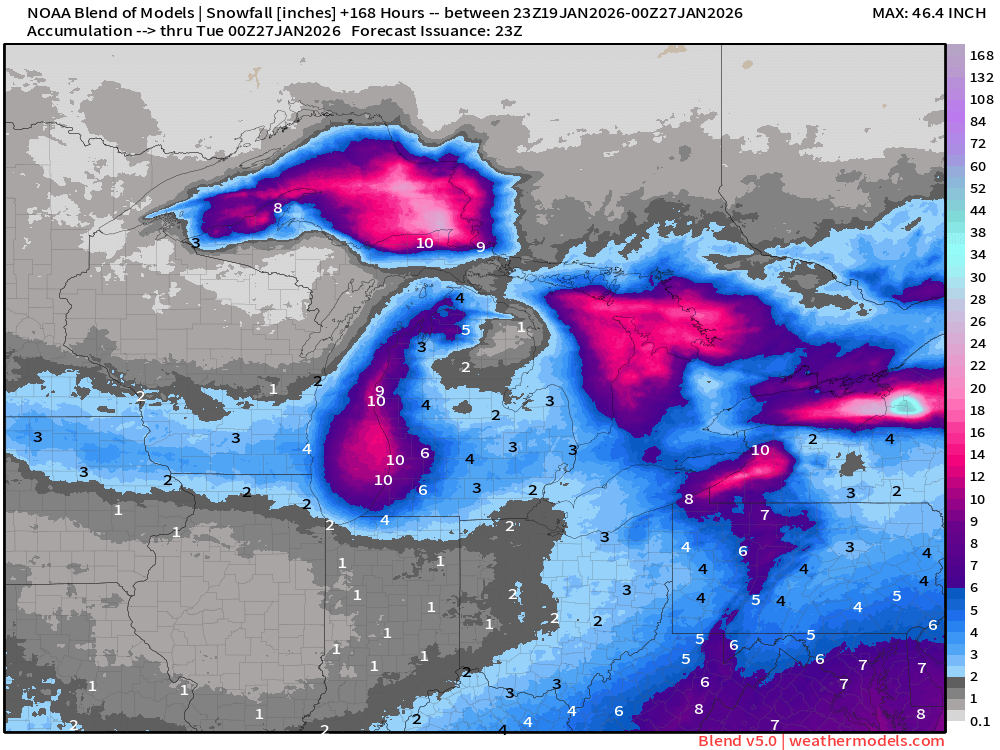
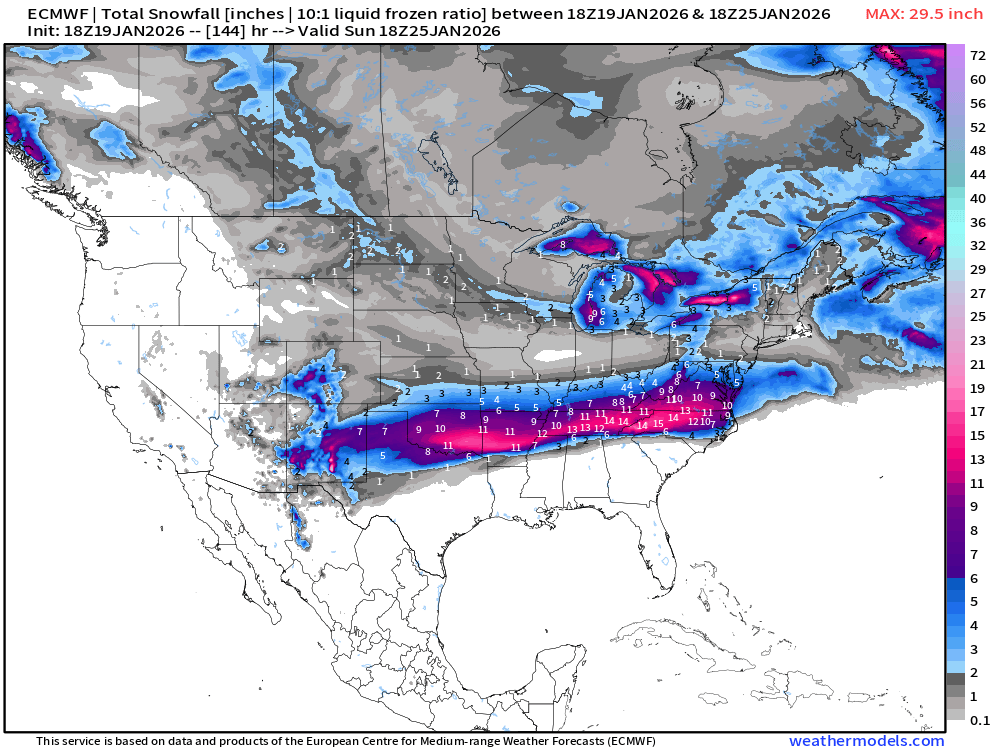
ECMWF 18z | Snowfall Next 6-days
(Use this model and its AI trained companion)
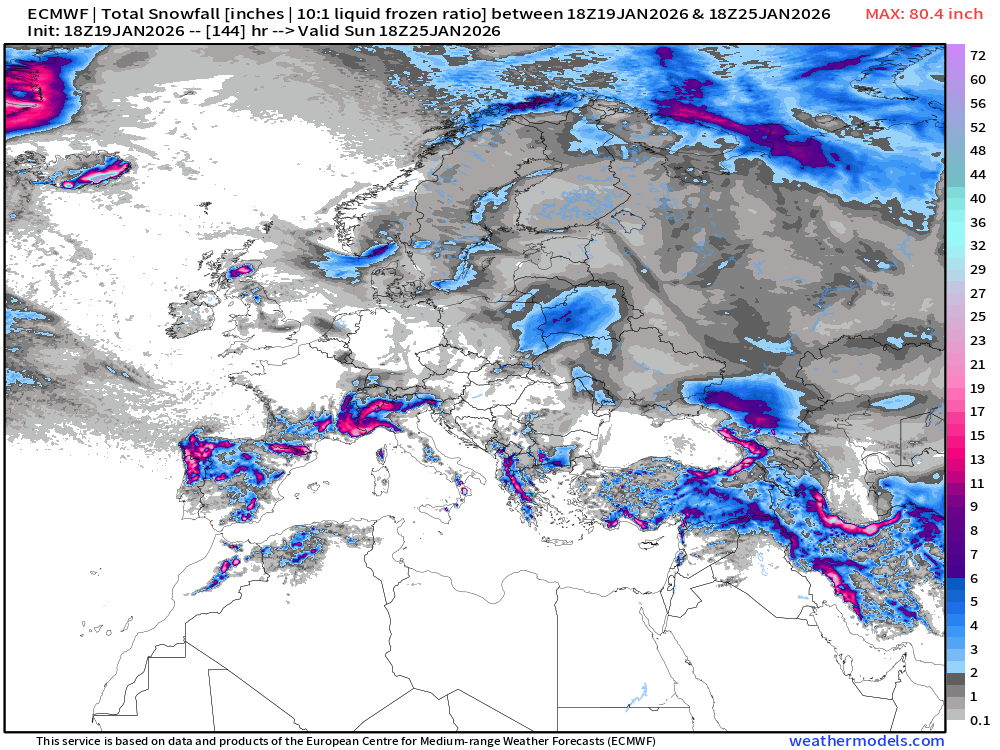
European Winter | Snowfall Next 6-days
ECMWF EPS 12z | Ensemble Median Snowfall Next 15-days
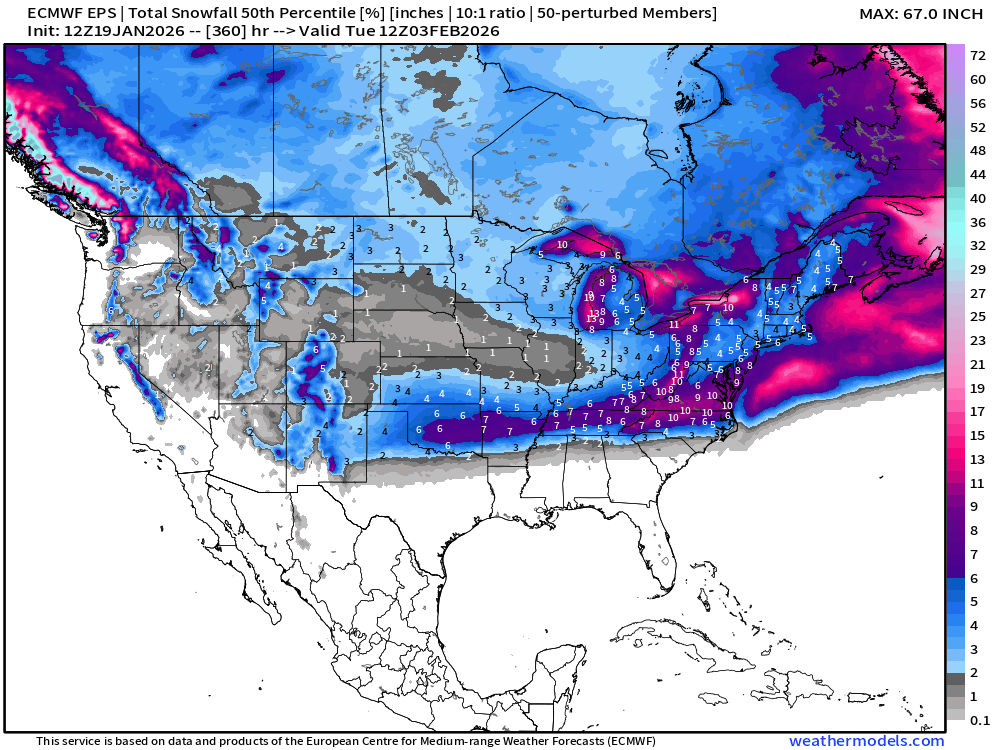
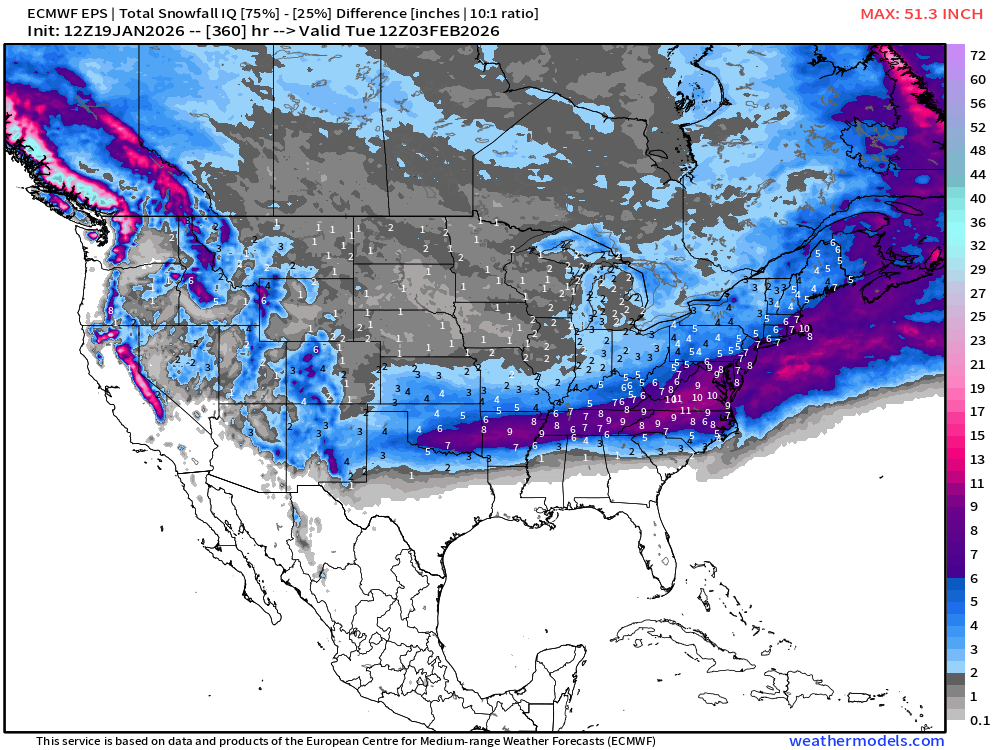
This is a potentially HUGE underestimate: There is a very wide distribution of solutions with the Interquartile range (25% to 75%) the same amount as the median = boom or bust
IQ (25-75%) range through 15-days
Ensemble Maximum through 15-days: Boom Potential Dialed up to 100%
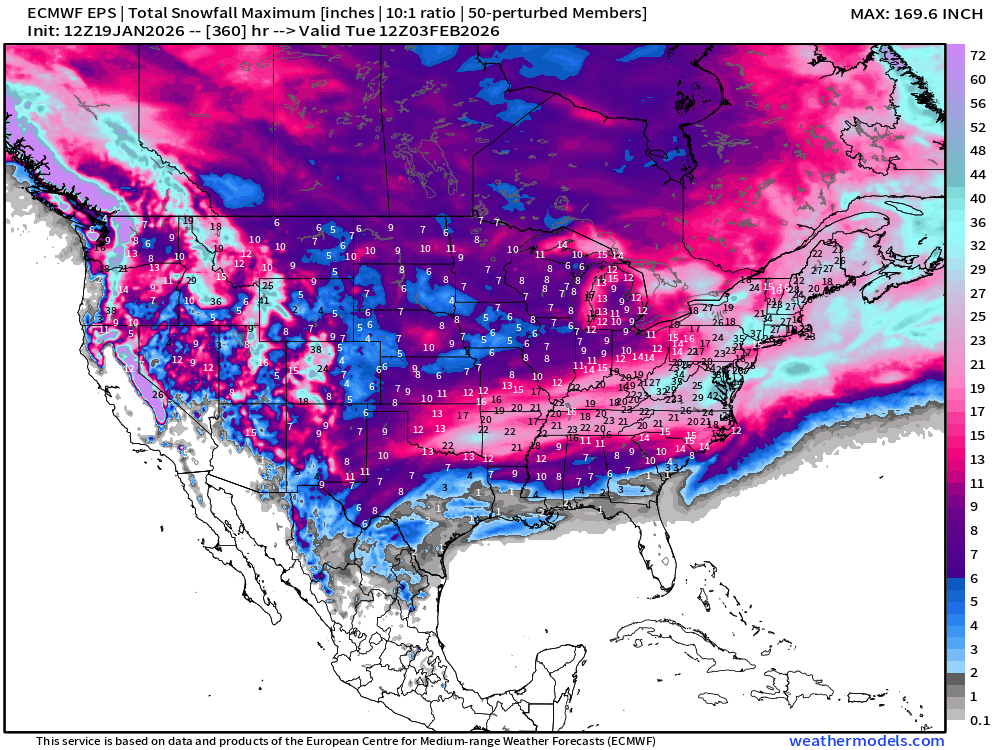
—> this map is a “worst case scenario” but still may not encapsulate the maximum over 15-days as multiple storms could be misaligned in one ensemble.
Probability of some Snowfall (0.1”) in next 15-days
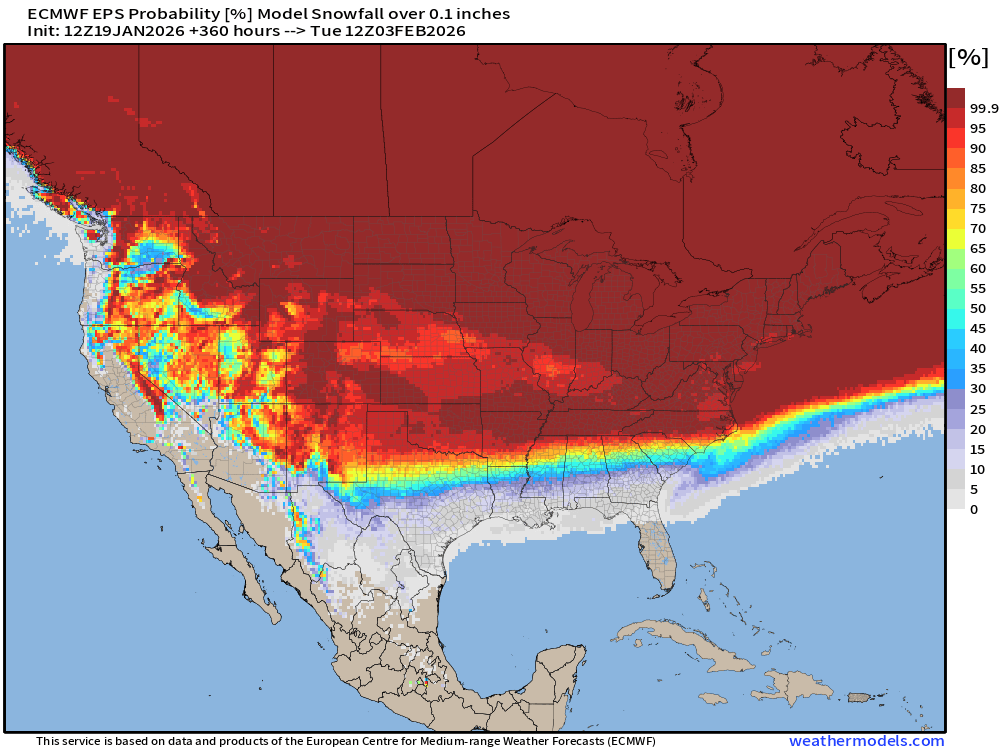
I think Florida is largely safe from the coldest Arctic air — and snowfall this time around.
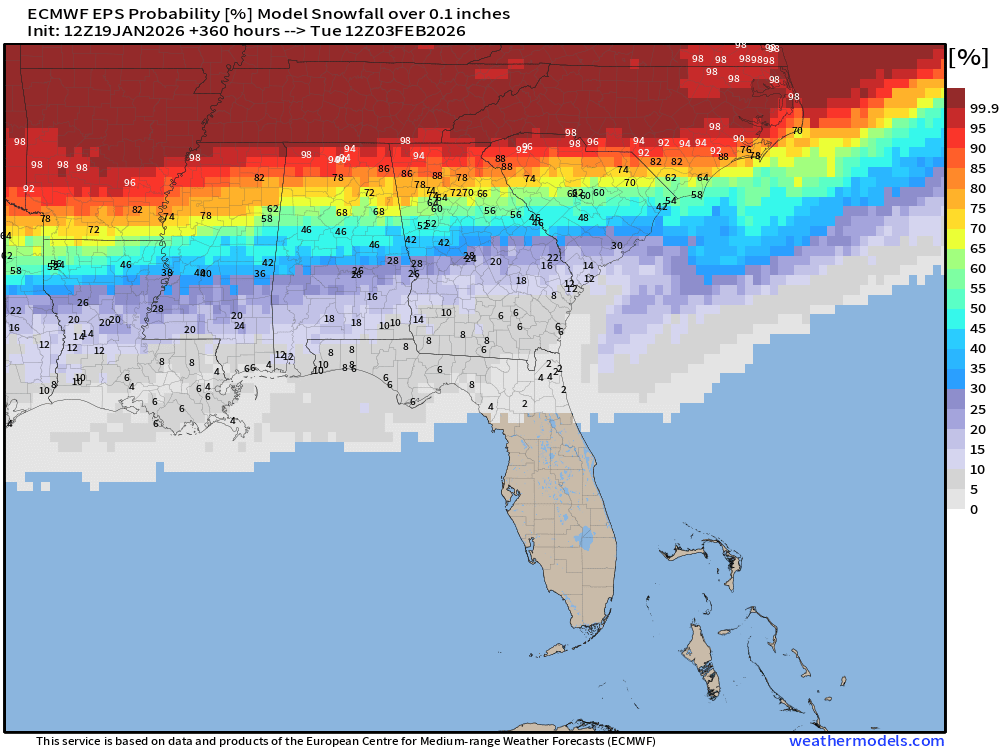
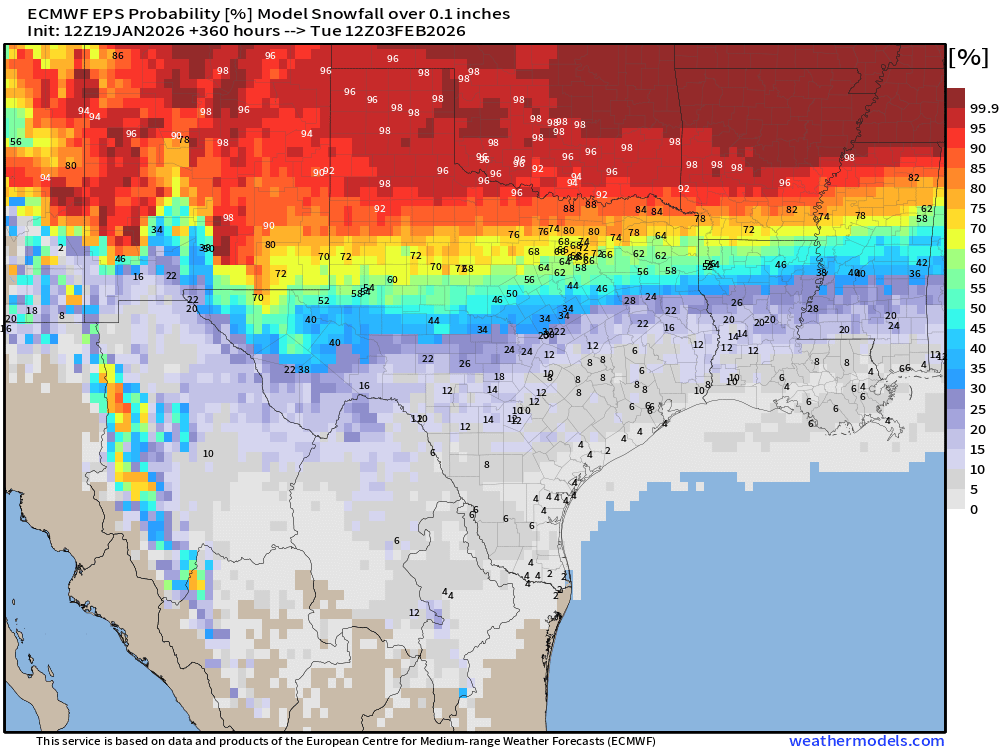
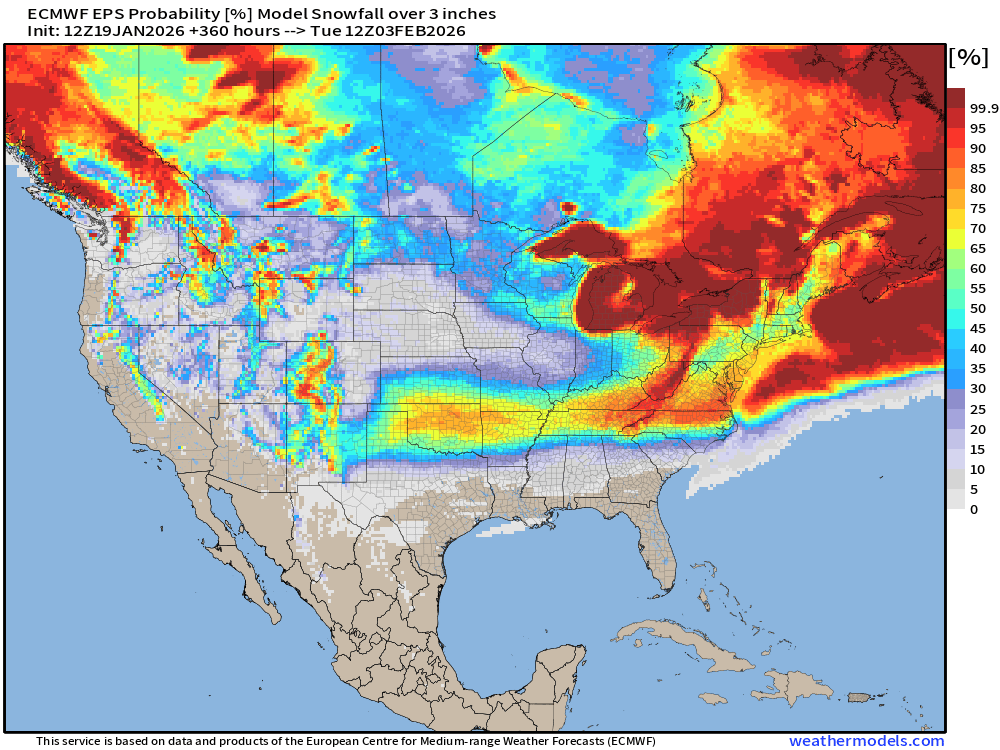
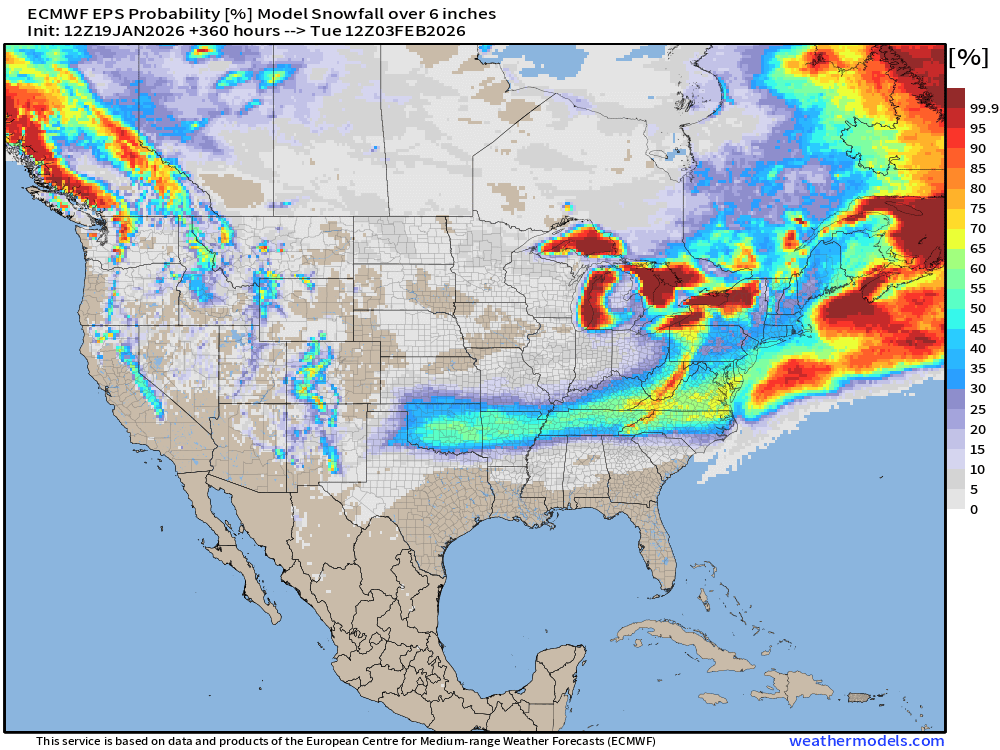
Probability of 3” and 6” of Snowfall next 15-days
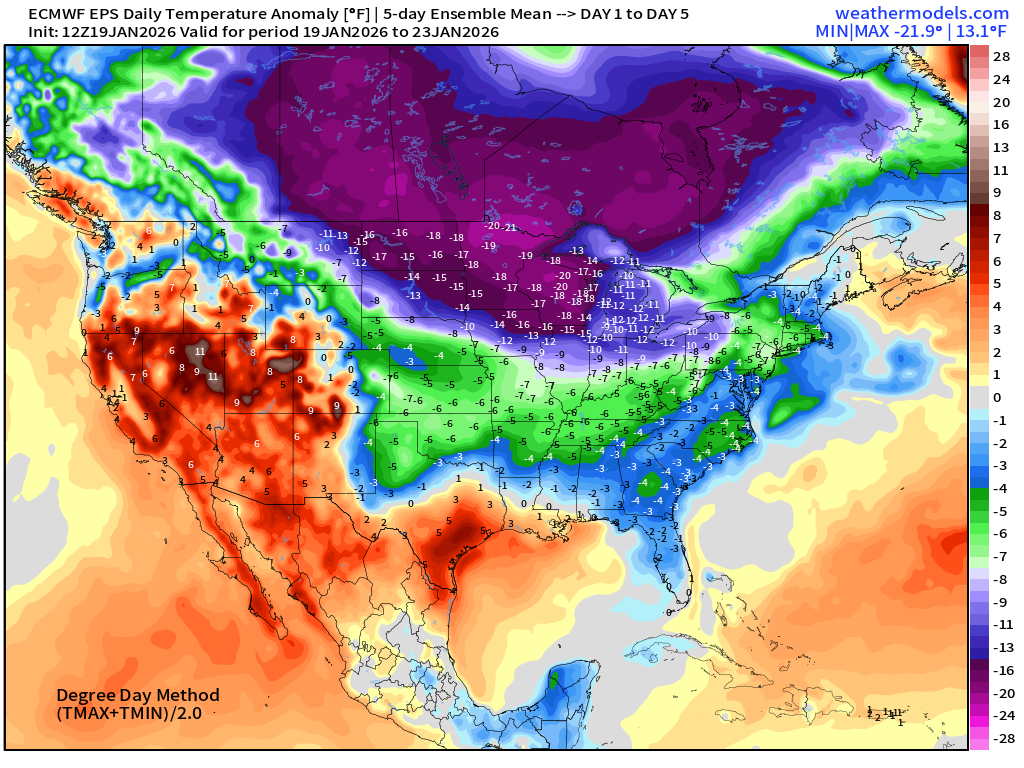
Lower 48 Temperature Anomaly | Next 15-days | ECMWF EPS 12z
5-Day Chunk #1 | Temperature Anomaly | Jan 19 - Jan 23
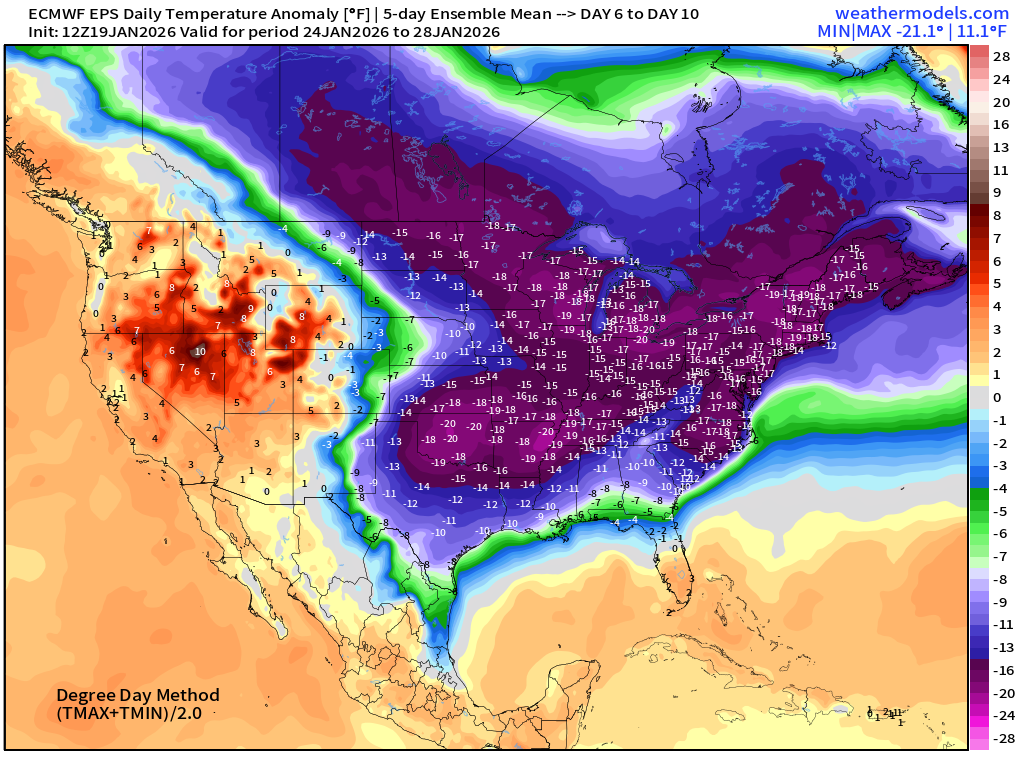
5-Day Chunk #2 | Temperature Anomaly | Jan 24 - Jan 28
5-Day Chunk #3 | Temperature Anomaly | Jan 29 - Feb 2
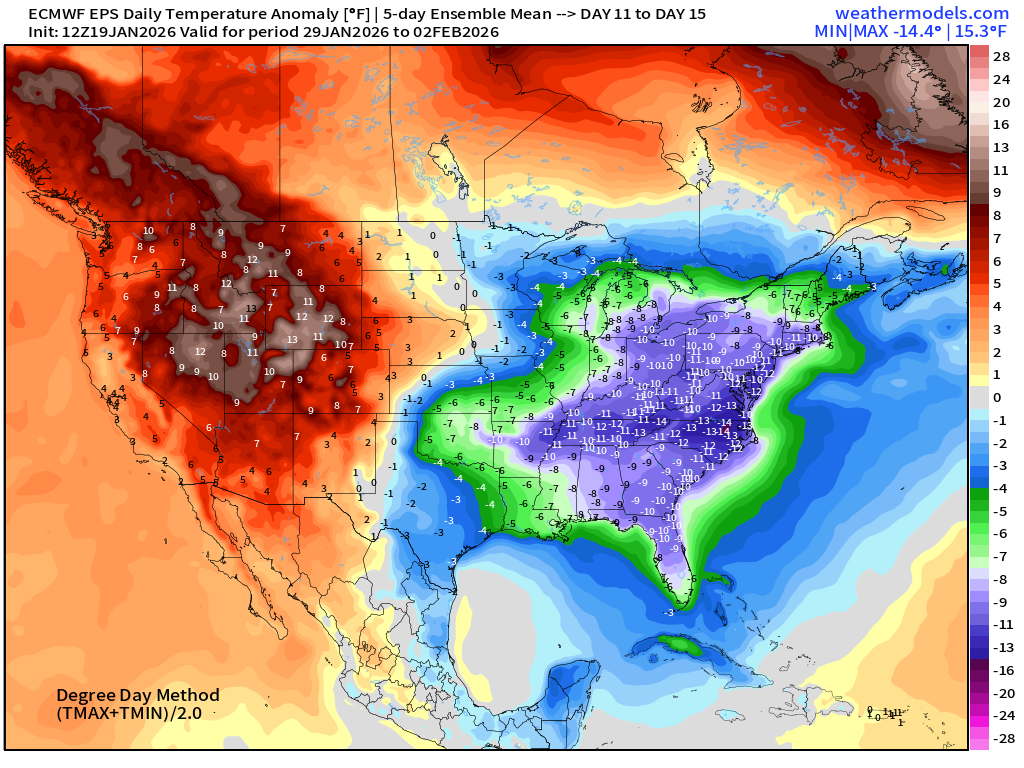
And, the band played on — still going into February? Yes.
Maps sourced from weathermodels.com designed and innovated by yours truly! Please subscribe there for real-time access to the newest maps, charts from all of the weather models including ECMWF and AIFS, NOAA AI-GFS/AI-GEFS
- Milepost
- 844 · laid 2026-01-20T02:21:27.832000Z
- Source
- https://weather.substack.com/p/january-19-2026-extreme-cold-and
- Digest
- 8709d766d3bd393a0098ee4dacba7d448cb6bc2758215510b46121526a72b817
- Machine
- JSON