December 1, 2025 Monday Winter Weather
Meteorological winter starts quite cold across the eastern U.S. with an Arctic blast
December 2025 was the 5th-warmest December in the 131-year national record (1895–2025), at 37.8°F against a 1991–2020 normal of 34.3°F (+3.5°F).
December 2025 was the 37th-driest December in the 131-year national record (1895–2025), at 2.0in against a 1991–2020 normal of 2.5in (-0.5in).
NOAA/NCEI Climate at a Glance, contiguous United States. This is the observed record for the month, not a score of anything said in this piece — the forecast ledger begins 2026-08-17 and cannot reach earlier posts.

Yet another Sudden Warming event in the stratosphere (SSW #2)
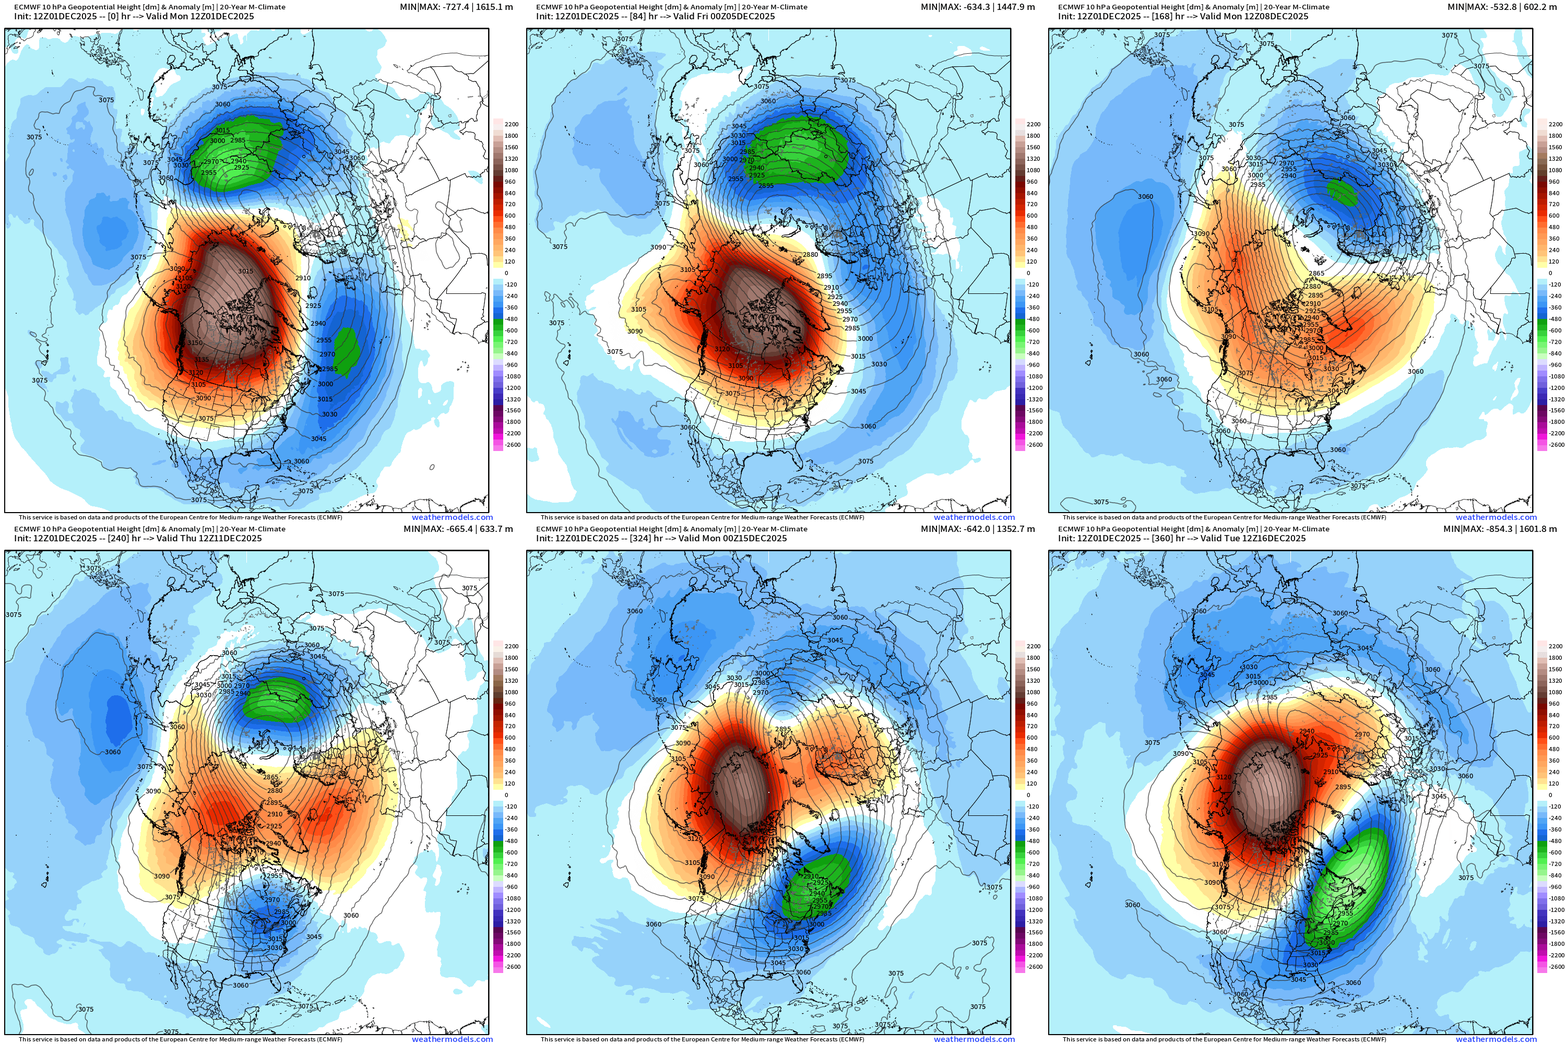
This will be a major story in the coming days as the magnitude of the second SSW event comes closer into view.
Why Do SSWs Happen? (with help from Grok)
The polar vortex in winter is normally a strong, cold, cyclonic circulation isolated from the troposphere. Currently distorted / split:
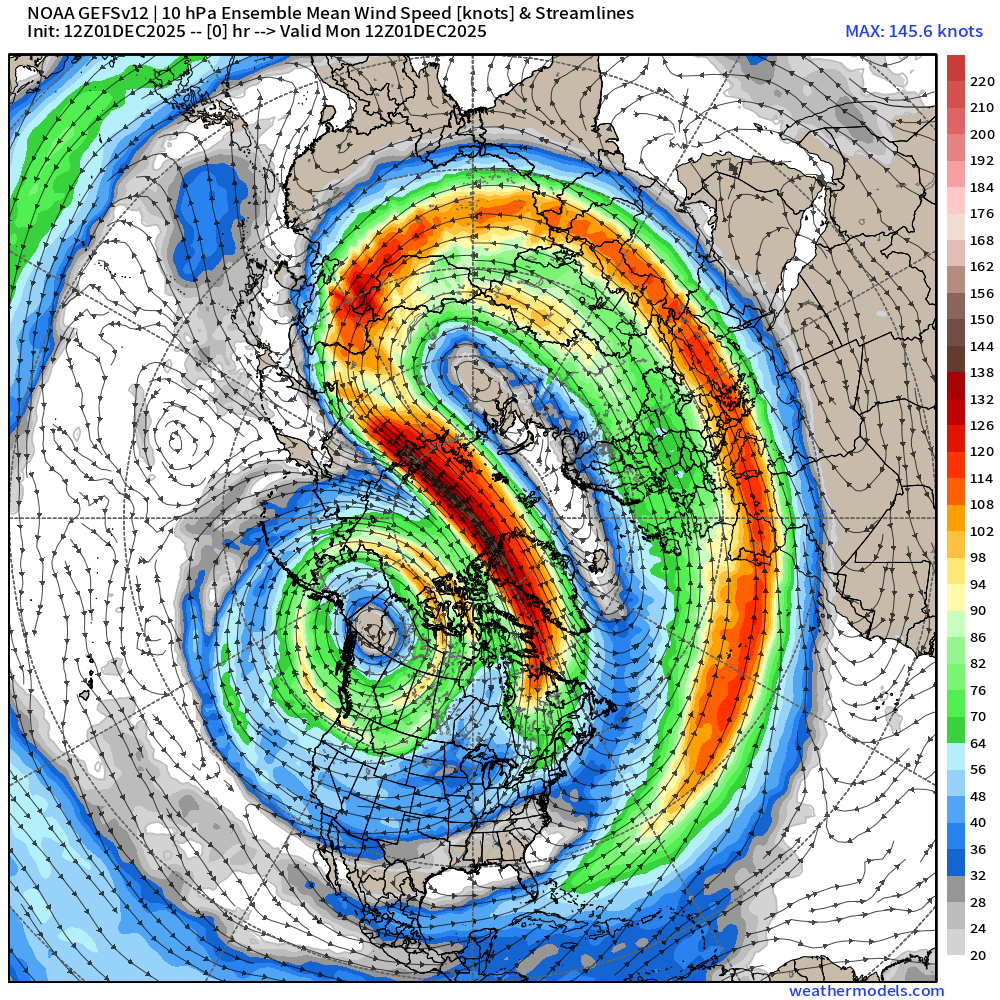
SSW events are triggered from from below
SSWs are triggered when huge planetary-scale Rossby waves (wavenumber 1 or 2) generated in the troposphere (from mountains, land–sea contrasts, and strong jet streams) propagate upward into the stratosphere and break there, just like ocean waves breaking on a beach. When these waves break:
They deposit huge amounts of westward momentum → decelerate or reverse the stratospheric jet.
Convergence of the Eliassen–Palm flux → strong adiabatic warming over the pole (the temperature jump). —> EP Flux convergence
Think of it as the troposphere “punching” the stratosphere so hard that the entire polar vortex collapses or splits.
The signal can lag for weeks … we don’t see too many major SSW events —and now we’ll have two in a month!
The stratosphere and troposphere are normally only weakly coupled in winter, but a major SSW creates a strong downward-propagating signal that reaches the surface in ≈1–3 weeks and can persist for 4–8 weeks (sometimes longer).
Days 0–7 after central date: Polar vortex weakens/splits/displaces in the stratosphere.
Days 7–20: The negative Northern Annular Mode (NAM) or Arctic Oscillation (AO) signal propagates downward through the stratosphere.
Lag ≈ 2–6 weeks: At the surface → negative AO/NAO pattern dominates:
Weak, meandering polar jet stream
High-latitude blocking (Greenland, Scandinavia, Alaska)
Cold-air outbreaks into the mid-latitudes, especially eastern North America and northern Eurasia
Okay, now we have two of these SSW events — perhaps different flavors or magnitude of stretch/split — but the end result could be compounding with stronger negative AO and NAO patterns = cold air “dumps” out of the Arctic into the middle latitudes with a weaker jet stream.
Hard to bet against continued colder than normal across Lower 48 for the rest of December —> into January with effects of both SSW events lingering into the New Year.
Next 15-days Temperature Anomaly | Ensemble Mean
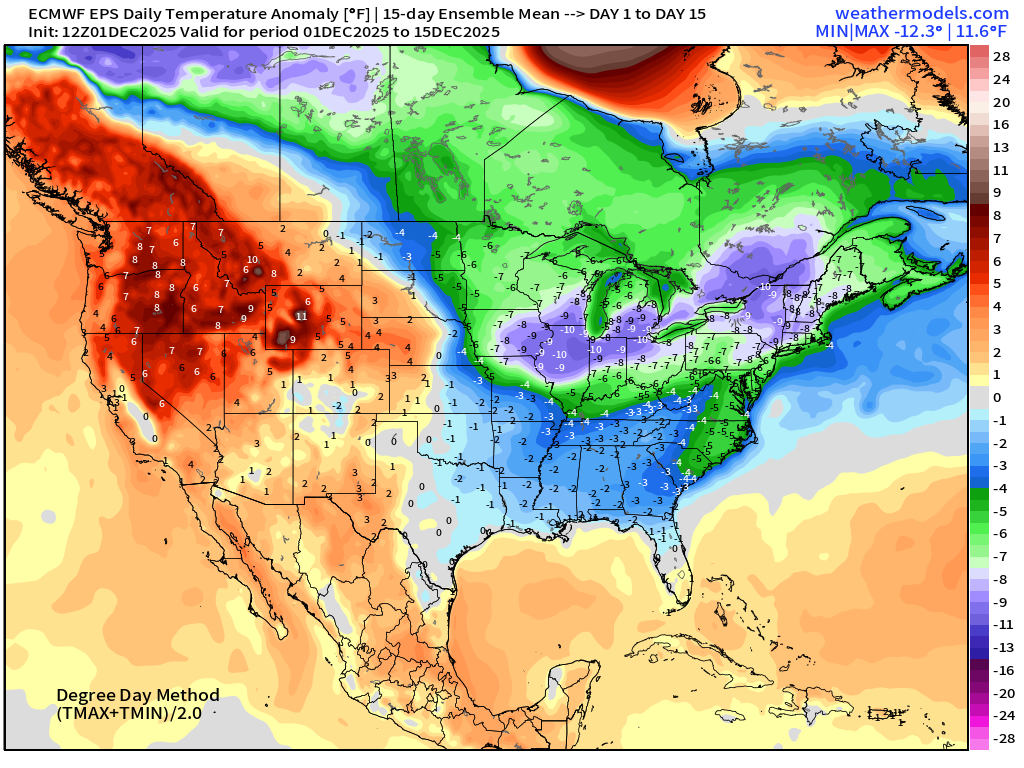
The coldest air in the 15-day mean is centered over the Great Lakes including Chicago, Detroit, and into New England — enhanced with snow cover/depth remaining for the next 1-2 weeks.
Headlines Monday Evening
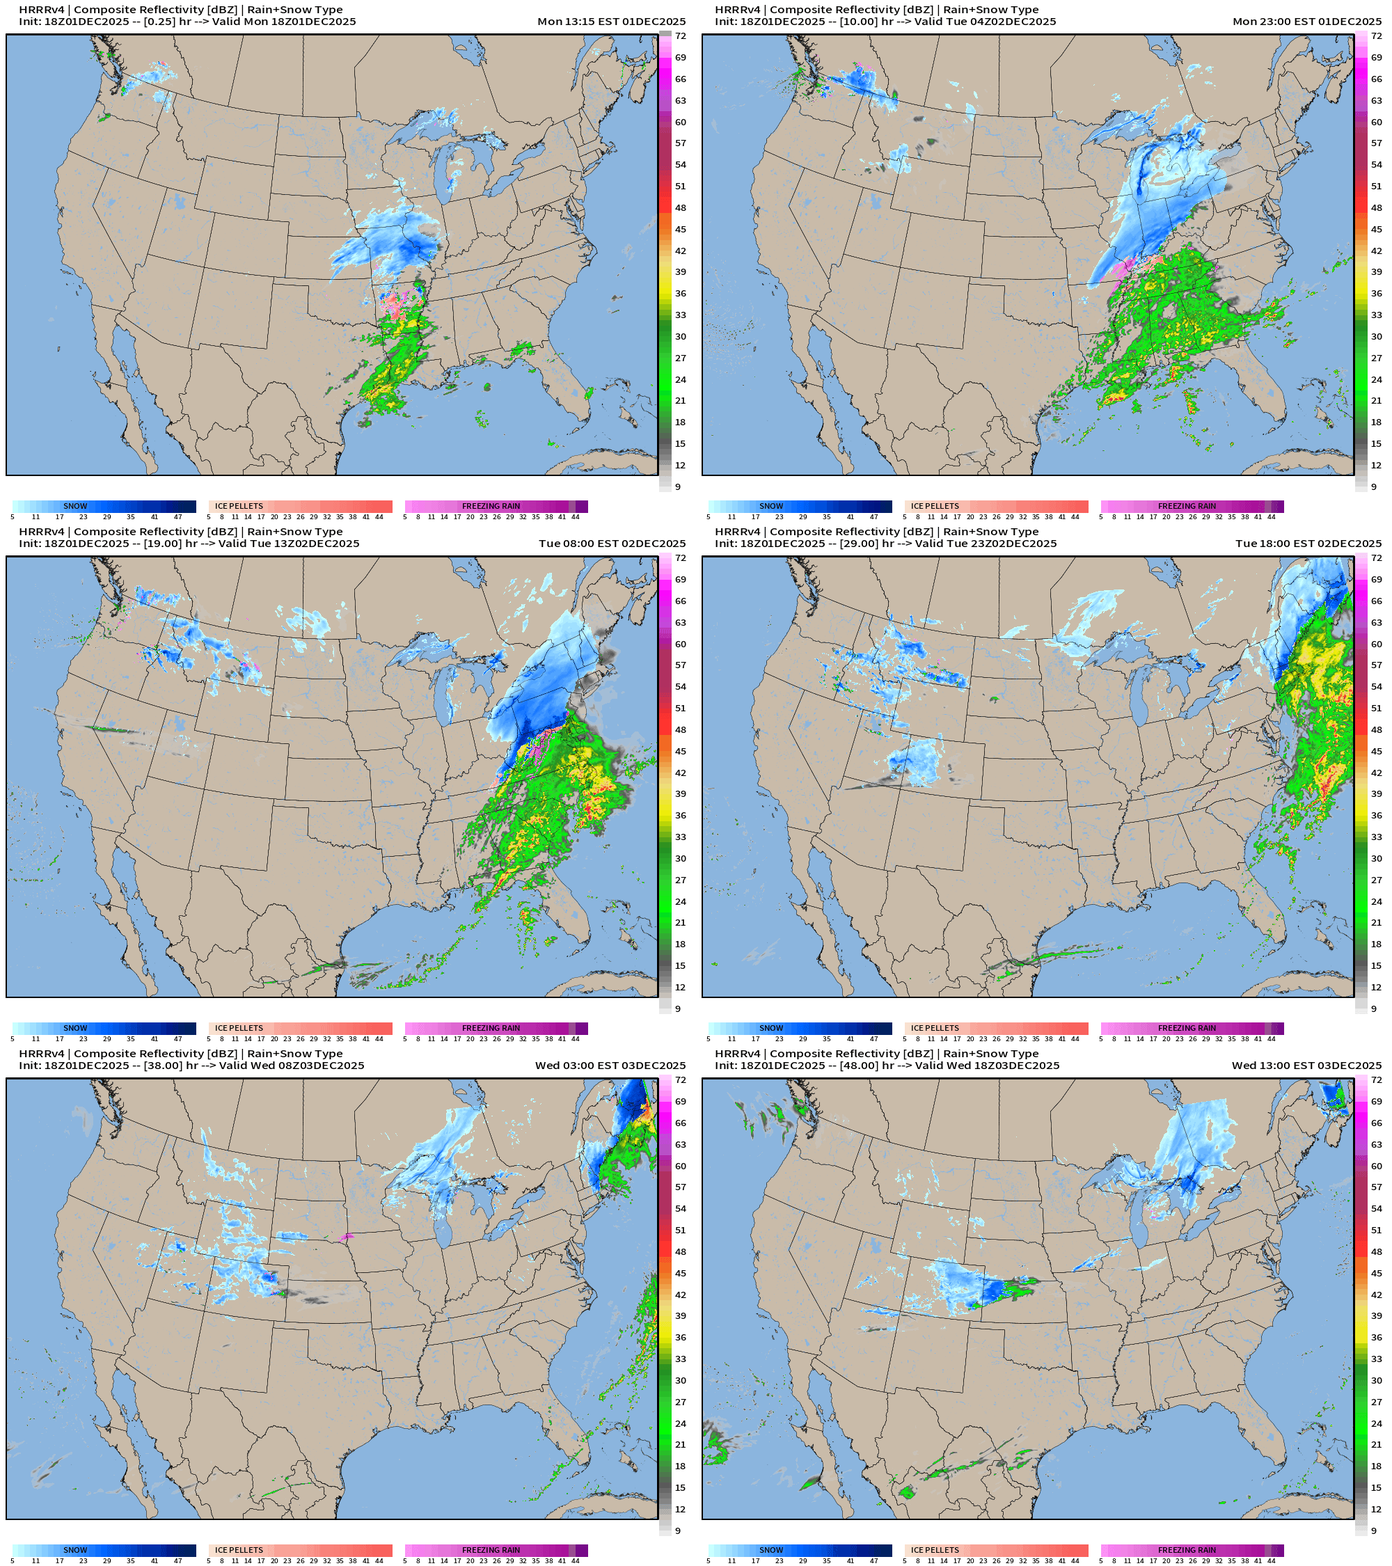
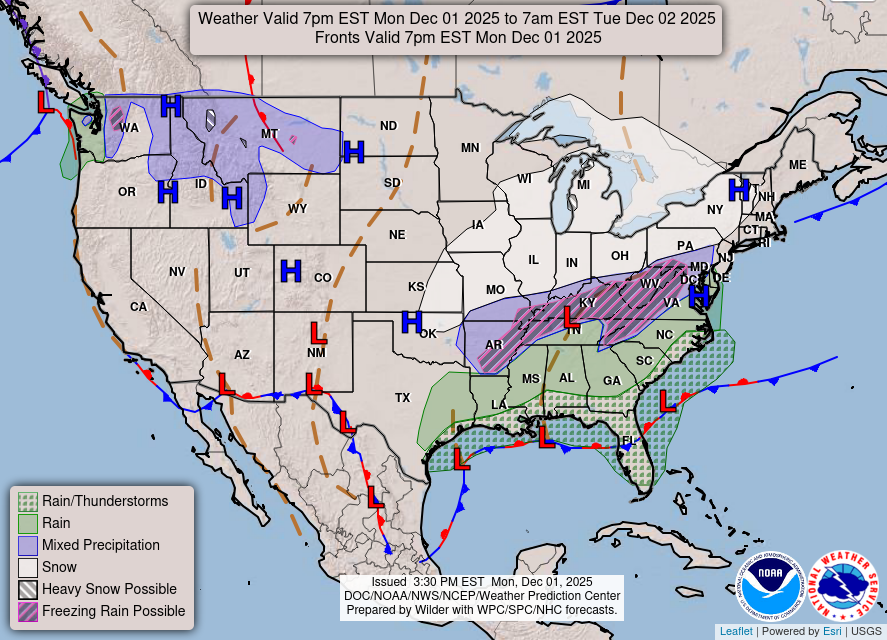
Nor’easter does develop but far enough inland with warm air to spare the immediate I-95 corridor from obliteration (instead rain and some mixture)
Evergreen analysis: Next 2-weeks remain stuck with well-below normal temperatures across the Eastern U.S. as the mega-load of “Polar Vortex” cold pool wobbles around Hudson/James Bay waiting for any shortwave out of the Pacific to capture a lobe.
Sudden Stratospheric Warming event #2
Temperature Analysis | 5:15 PM ET
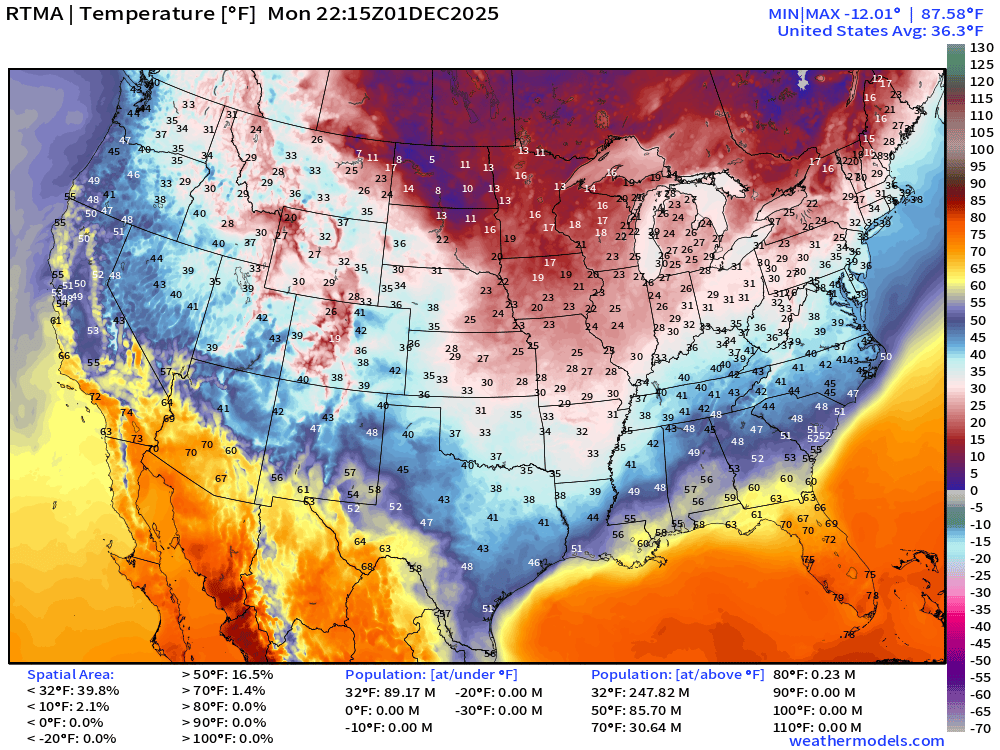
Subzero air in Montana with teens and lower 20s into Minneapolis. Near freezing in Chicago and Detroit
Temperature Anomaly | 5:15 PM ET
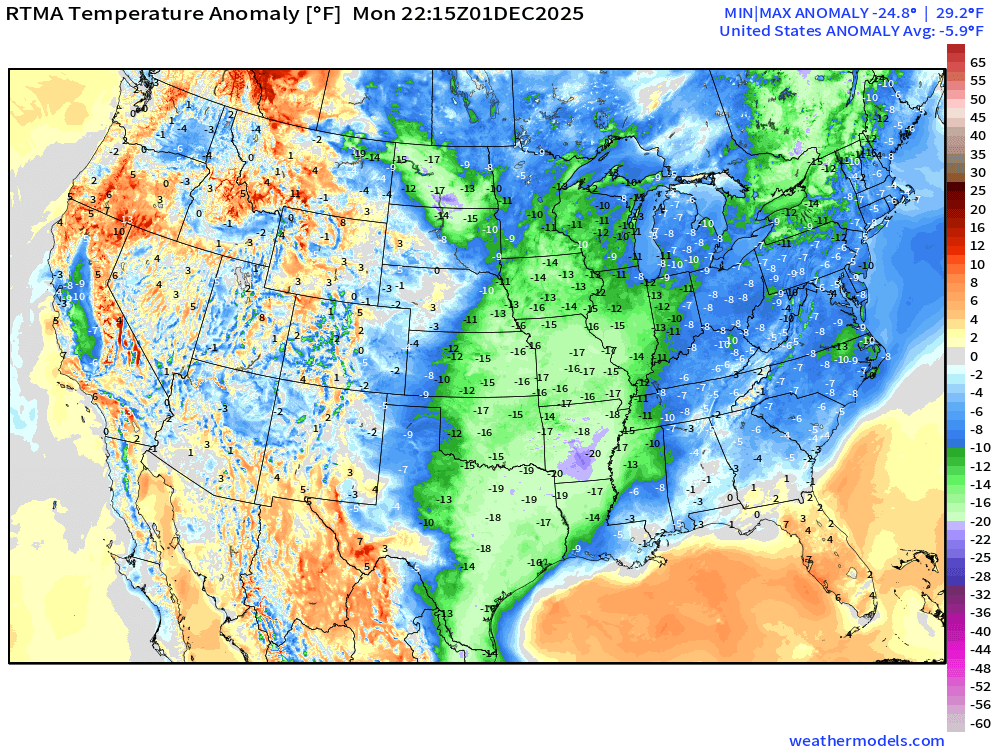
Lower 48 Temperature Anomaly was -5.9°F below normal
HRRR 18z | Simulated Radar Next 48-hours into Wednesday Afternoon
Total Snowfall From HRRR Next 48-hours | 18z —> Wed 1 PM ET
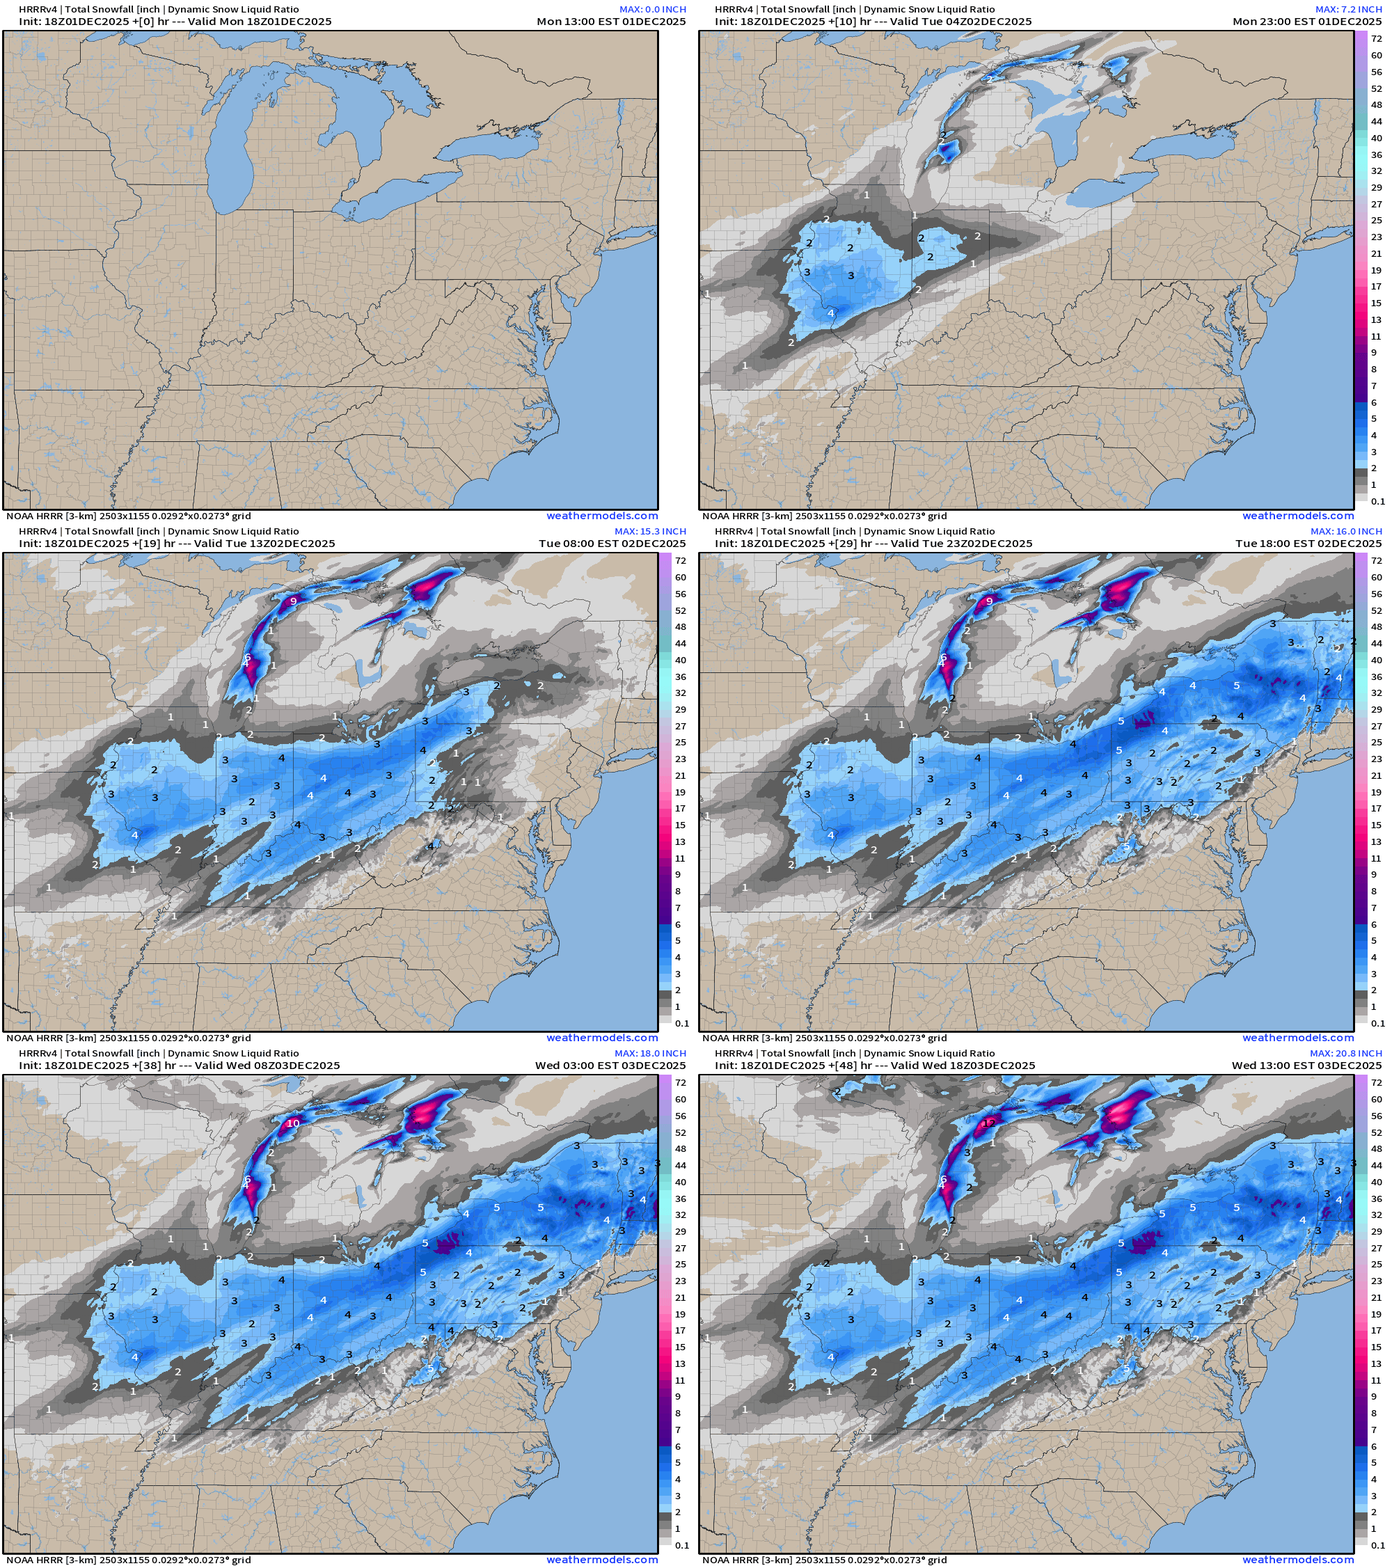
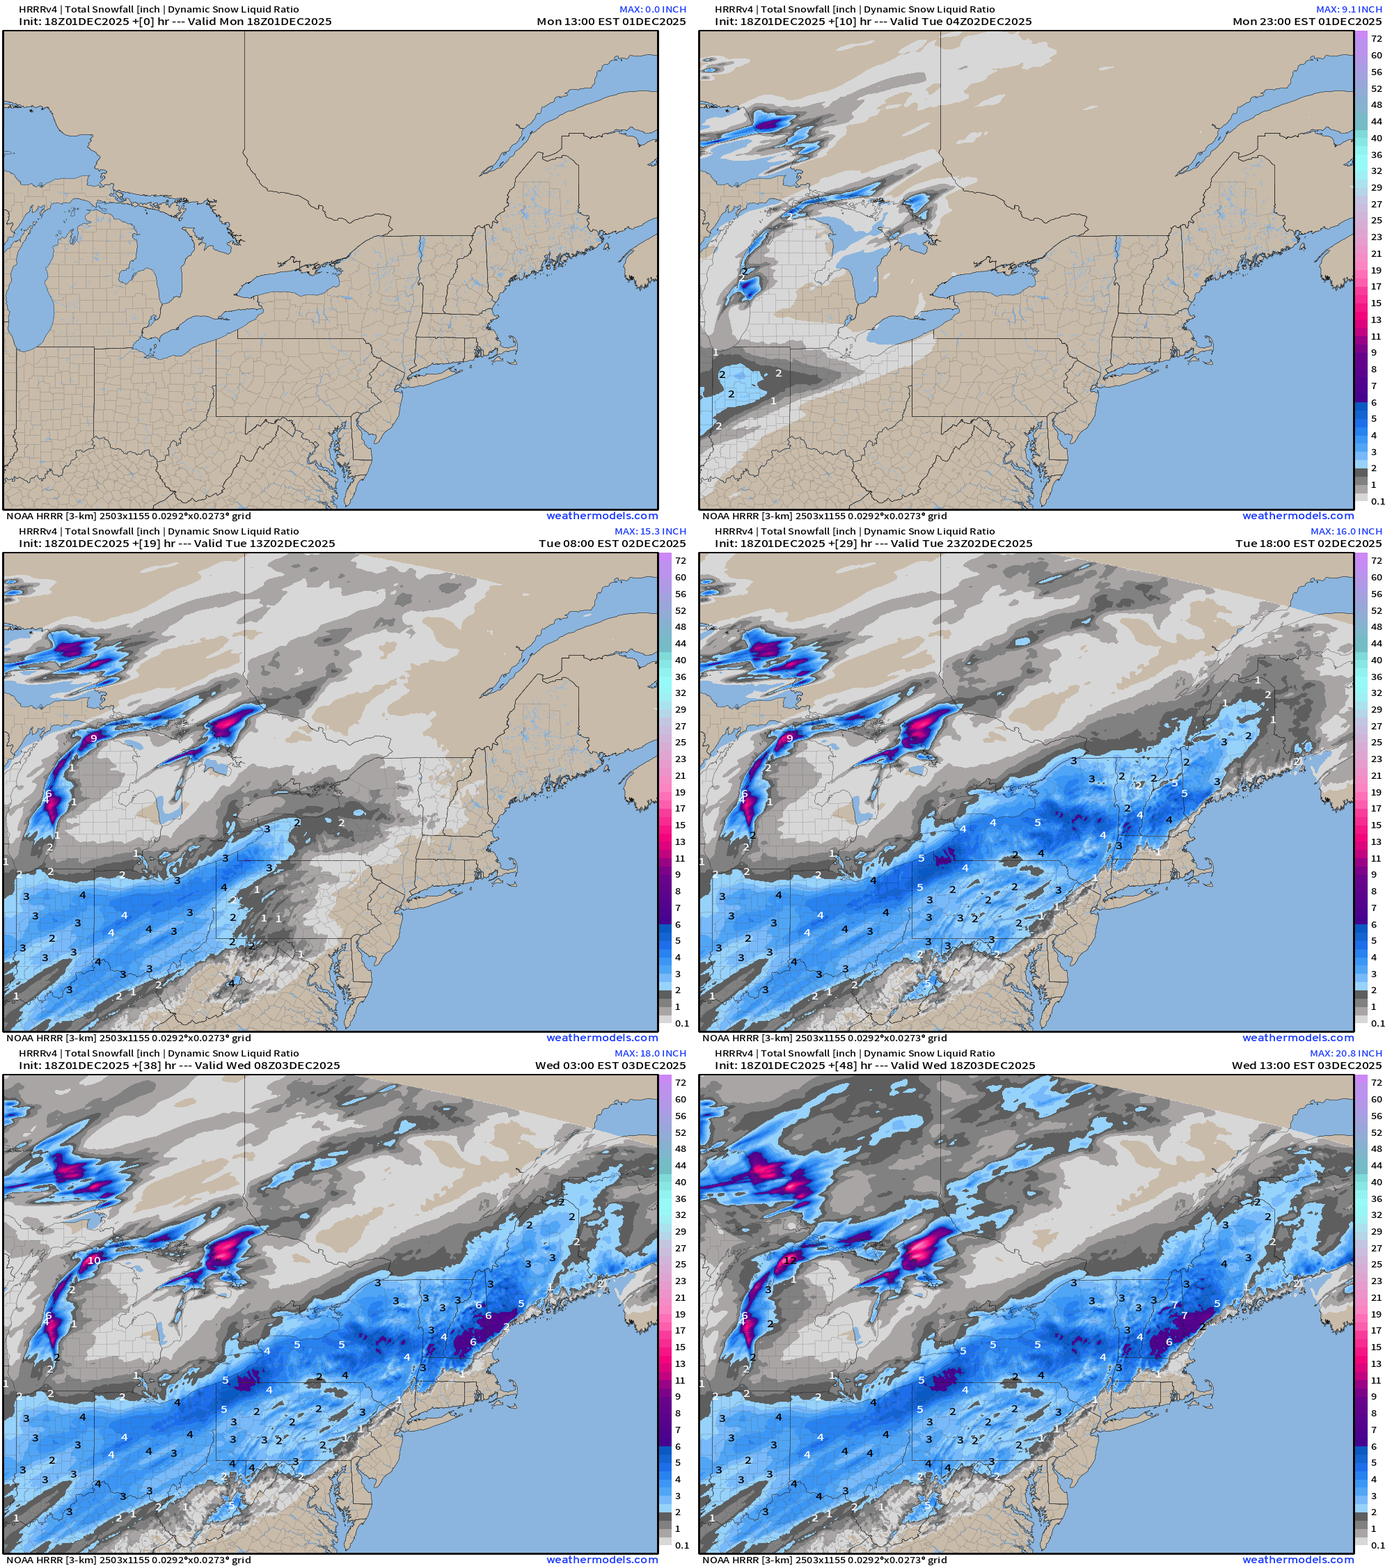
Like taking a paint brush and coloring the canvas with beautiful hues of blue and pink, my favorite maps (aside from precipitable water)
Lower 48 | Weather into Tuesday Morning
NWS Precipitation Next 72-hours
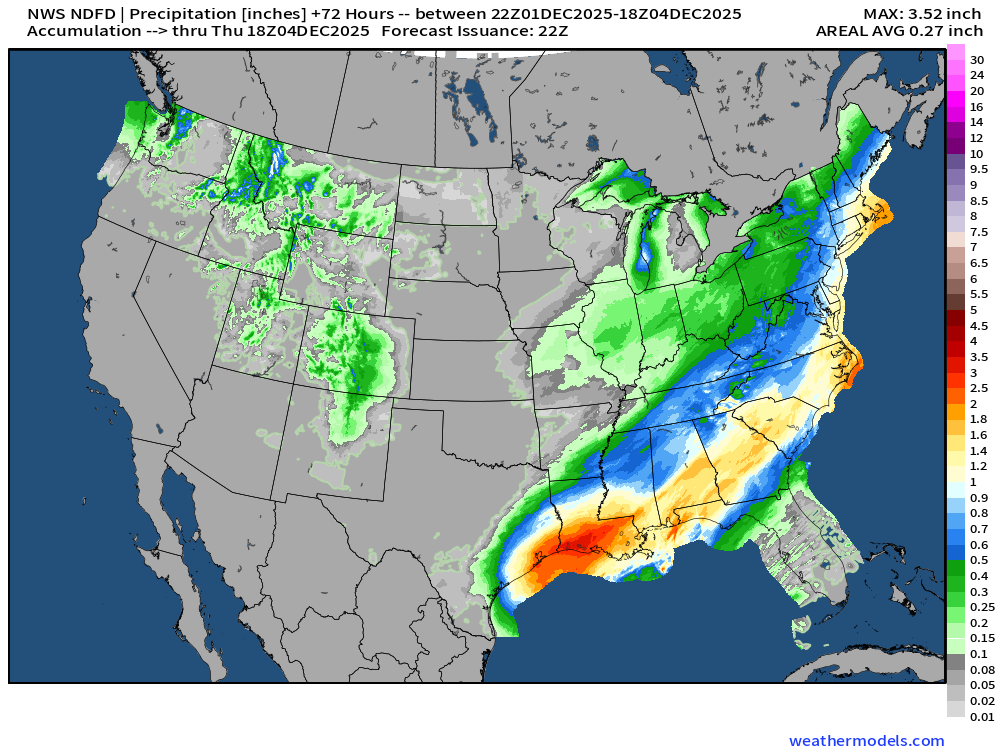
Heavy rainfall along the Gulf coast from Houston to New Orleans … maybe 1-2” into Atlanta, as well, then up the Eastern Seaboard. Lots of moisture with this system.
NWS Snowfall Next 72-hours
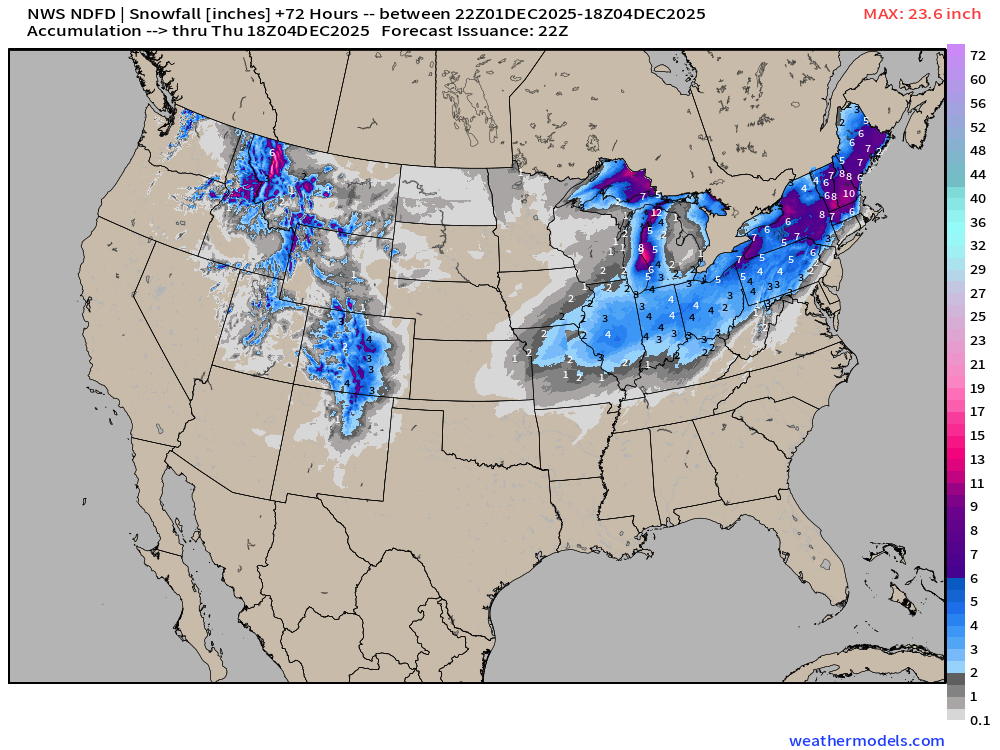
Boston escapes the major snow storm —> right on the edge of major accumulations.
RRFS-A through 84-hours (Friday 1 AM ET) | Snowfall totals
These maps are beautiful … RRFS-A is a 3-km resolution model and my color table is dazzling, but it would be even better as part of a “black” mapping scheme with more transparency and “heads up display” features.
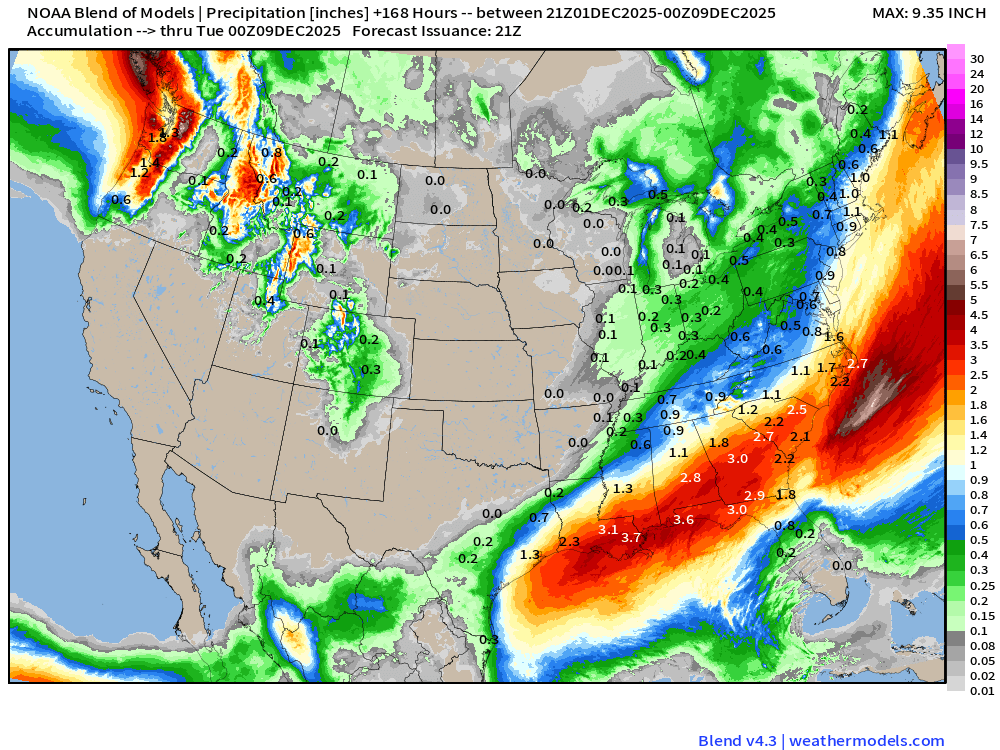
Blend of Models | 7 Days Precipitation Total (includes liquid from snow)
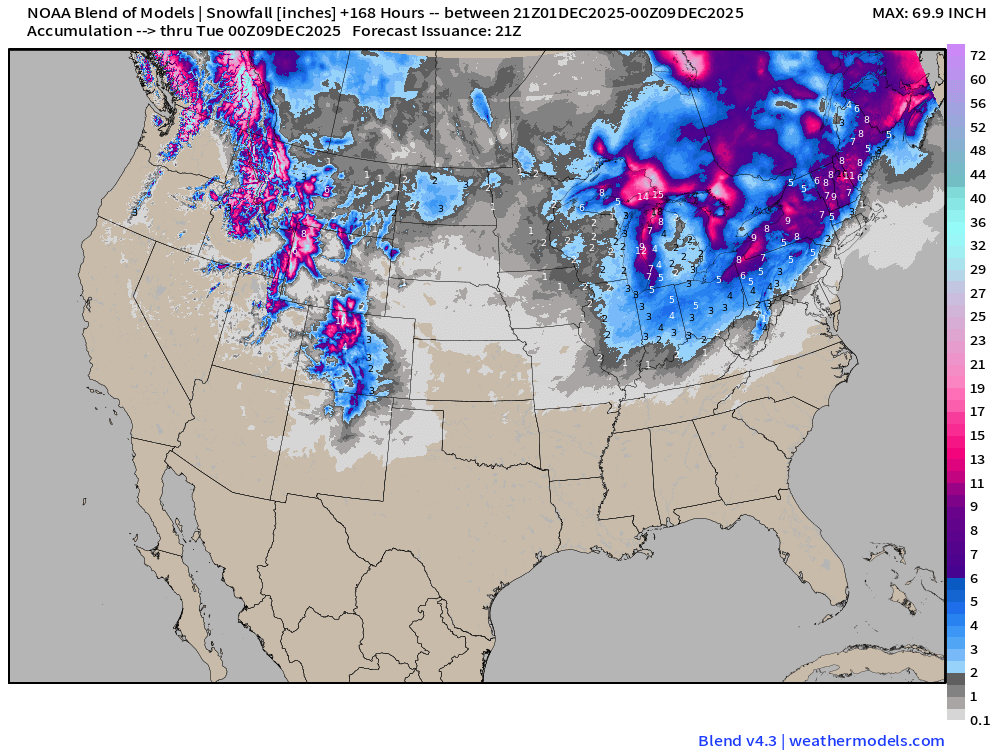
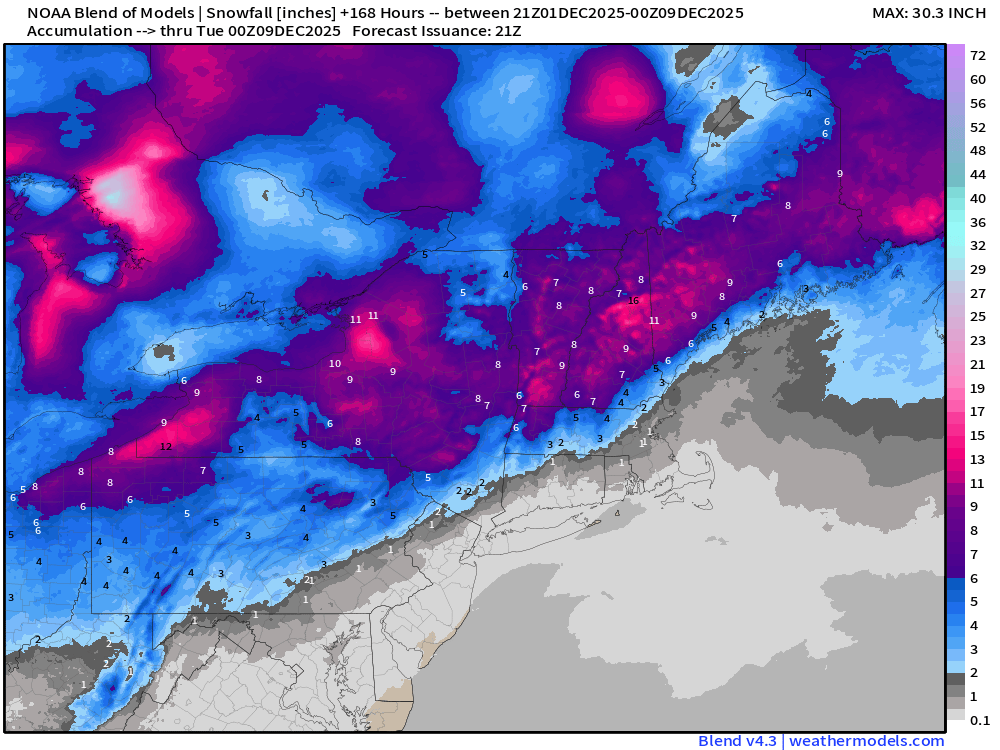
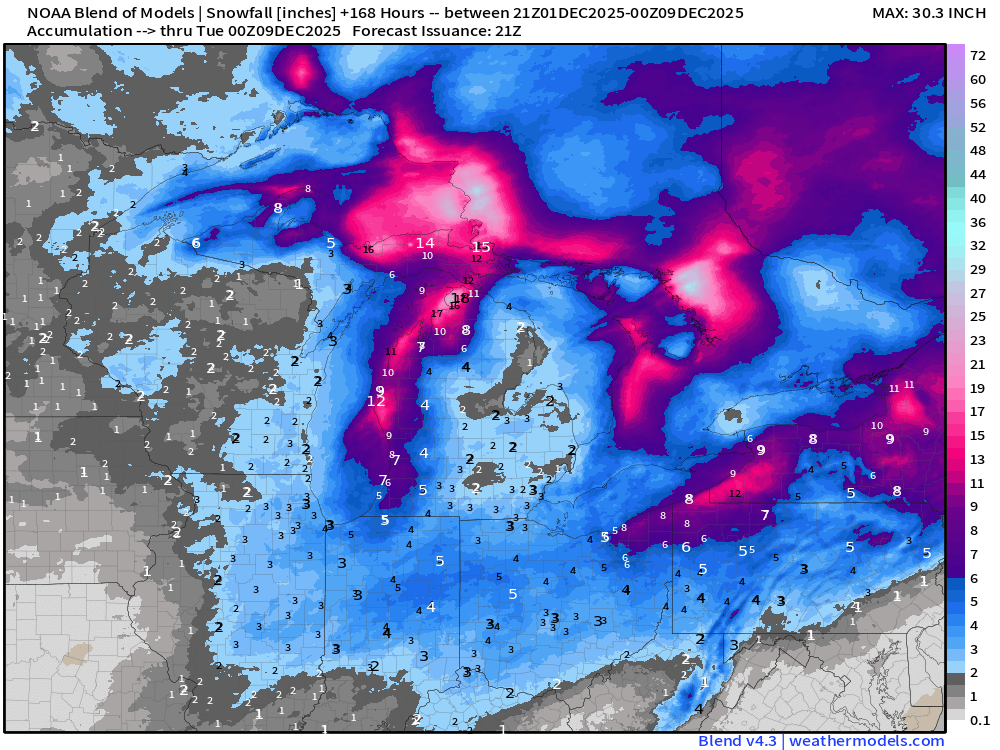
Total Snowfall Next 7-Days
Tuesday Morning Low Temperatures
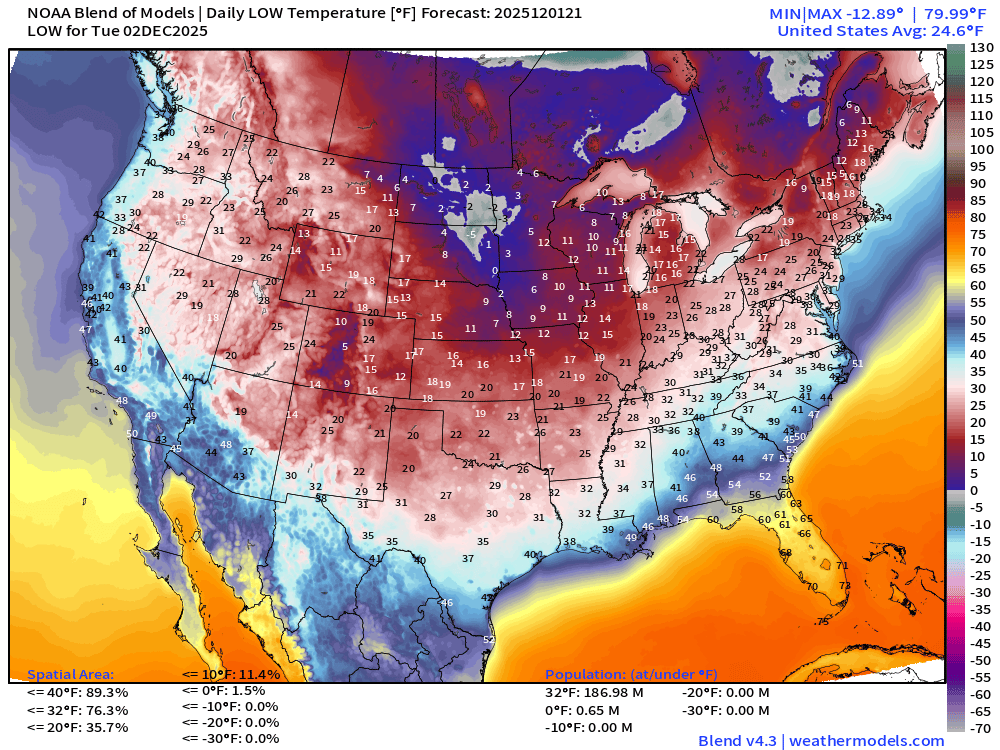
187 million below freezing (Lower 48 average low is 24.6°F)
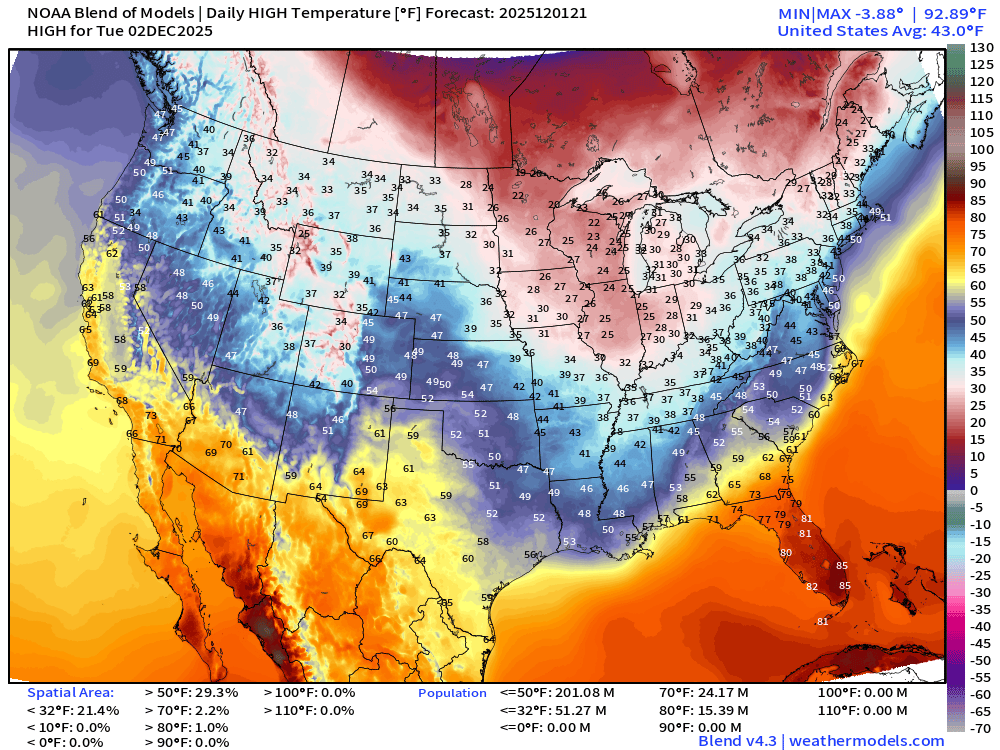
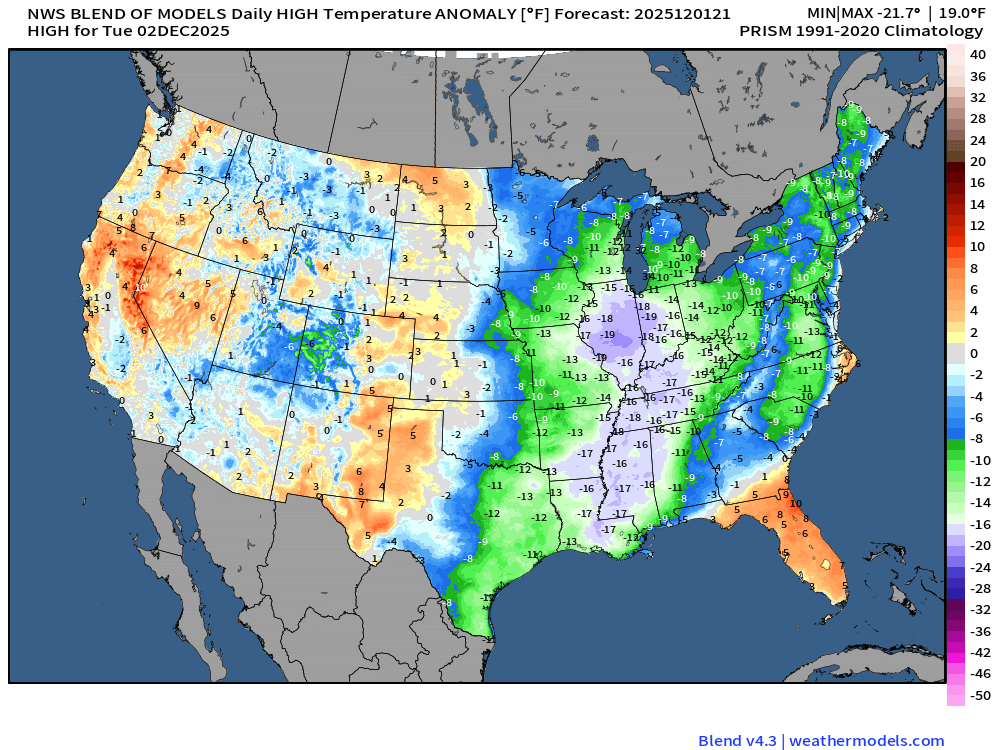
Tuesday High Temperatures + Anomaly from Climatology
Wednesday Low Temperatures
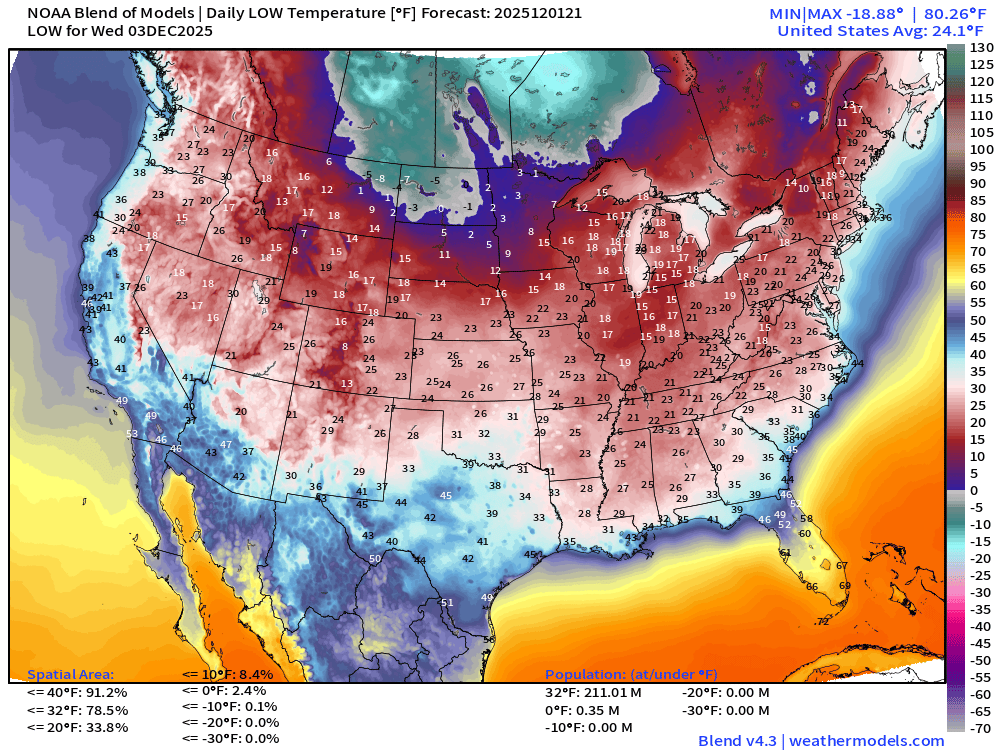
211 million below freezing (Lower 48 average low is 24.1°F)
Thursday Low Temperatures
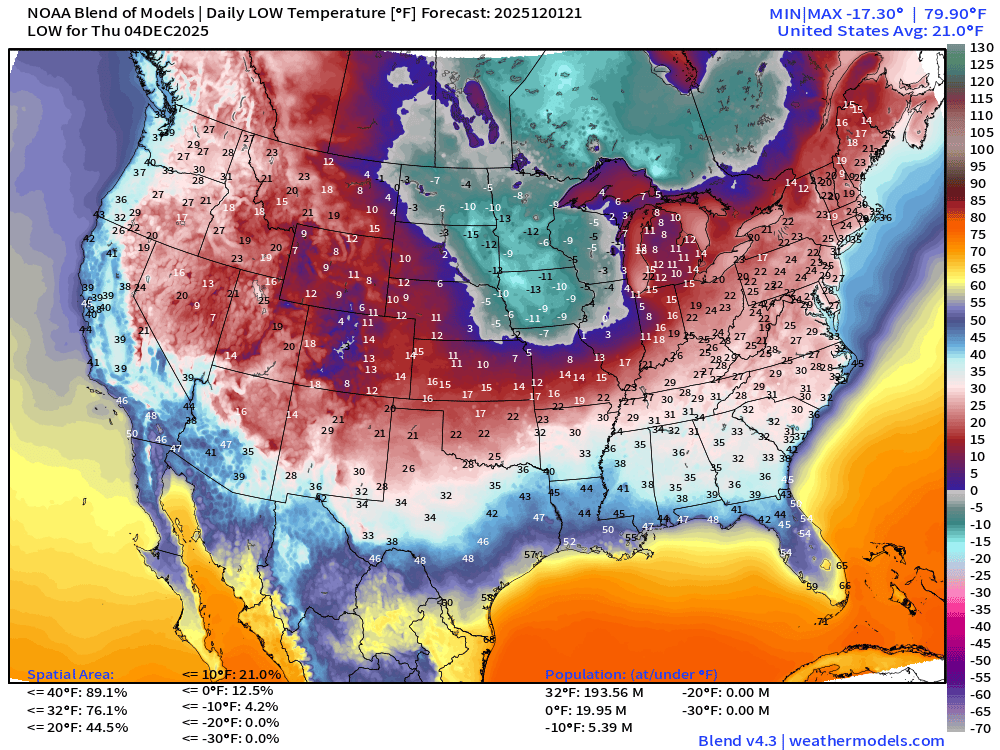
194 million below freezing (Lower 48 average low is 21.0°F)
Friday Low Temperatures
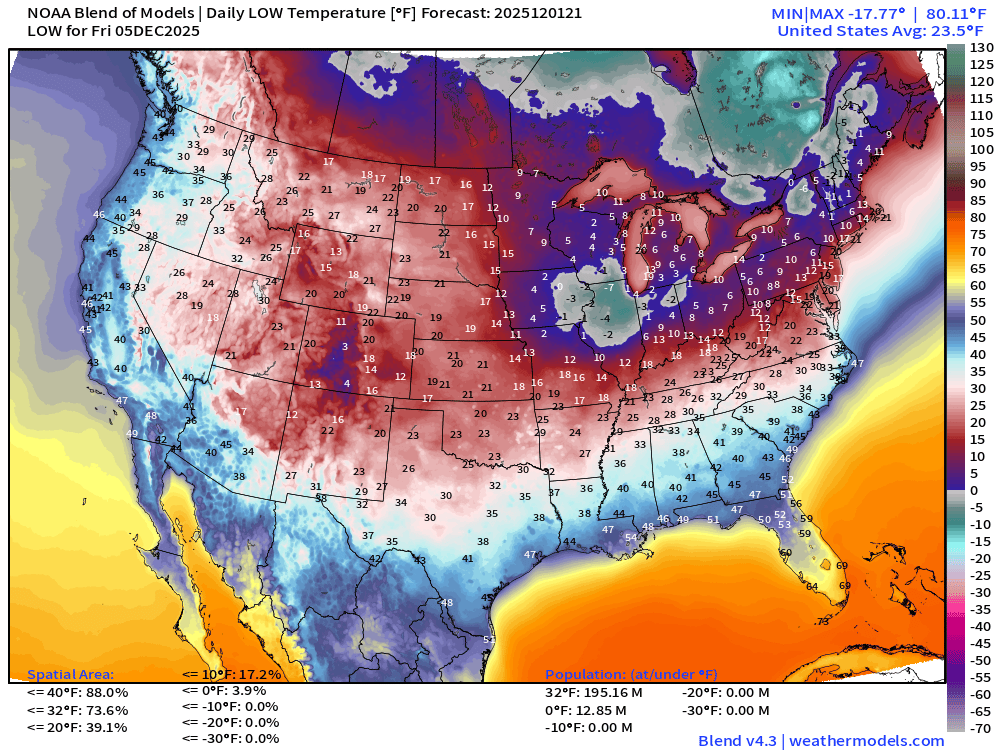
195 million below freezing (Lower 48 average low is 23.5°F)
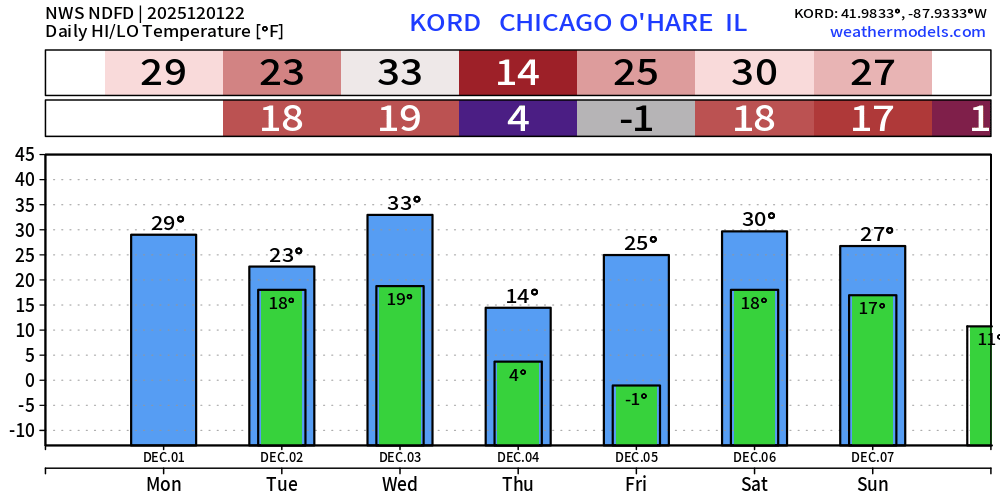
NWS NDFD | Chicago just dipped to -1°F for Friday morning (Dec 5)
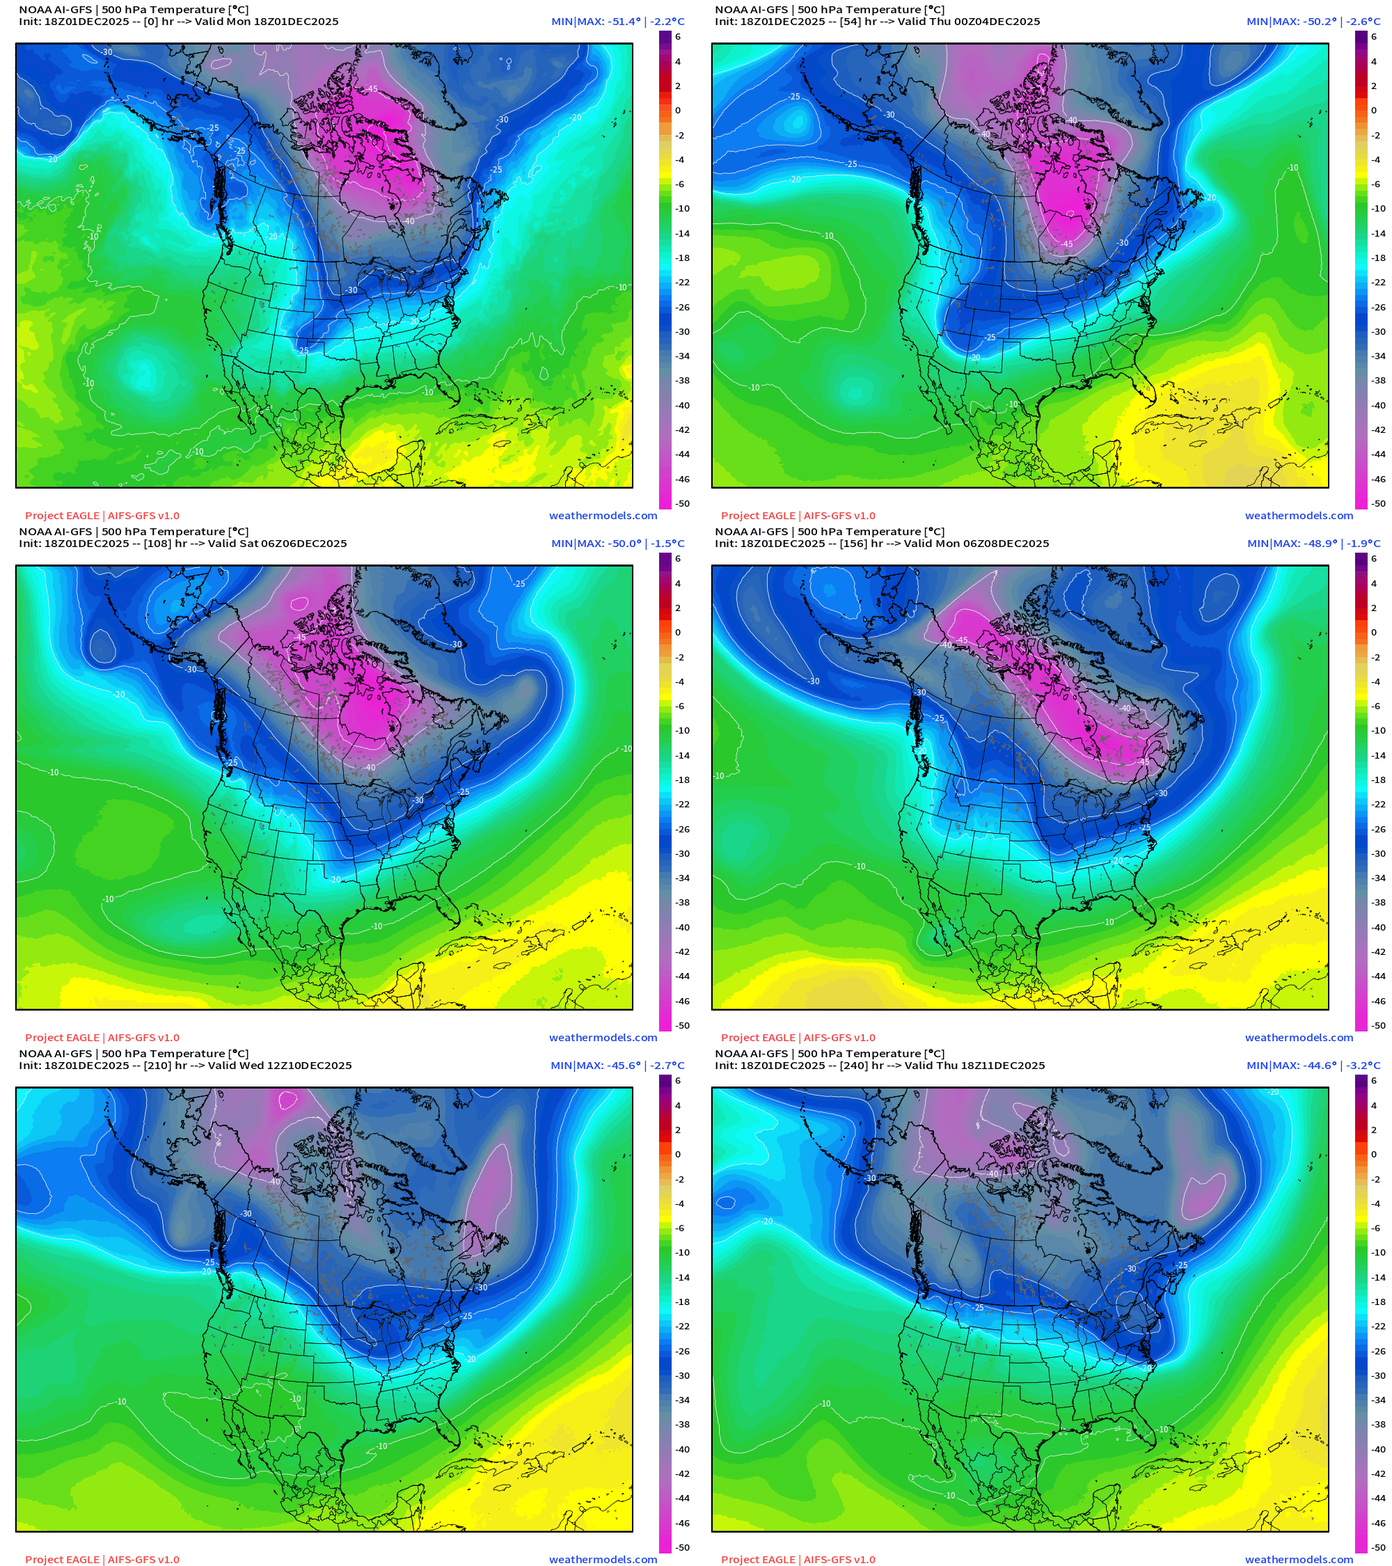
New AI-GFS | 500 mb Temperatures | Polar Vortex Watch Next 10-days
ECMWF EPS 12z | 15-day Ensemble Mean Temperature Anomaly
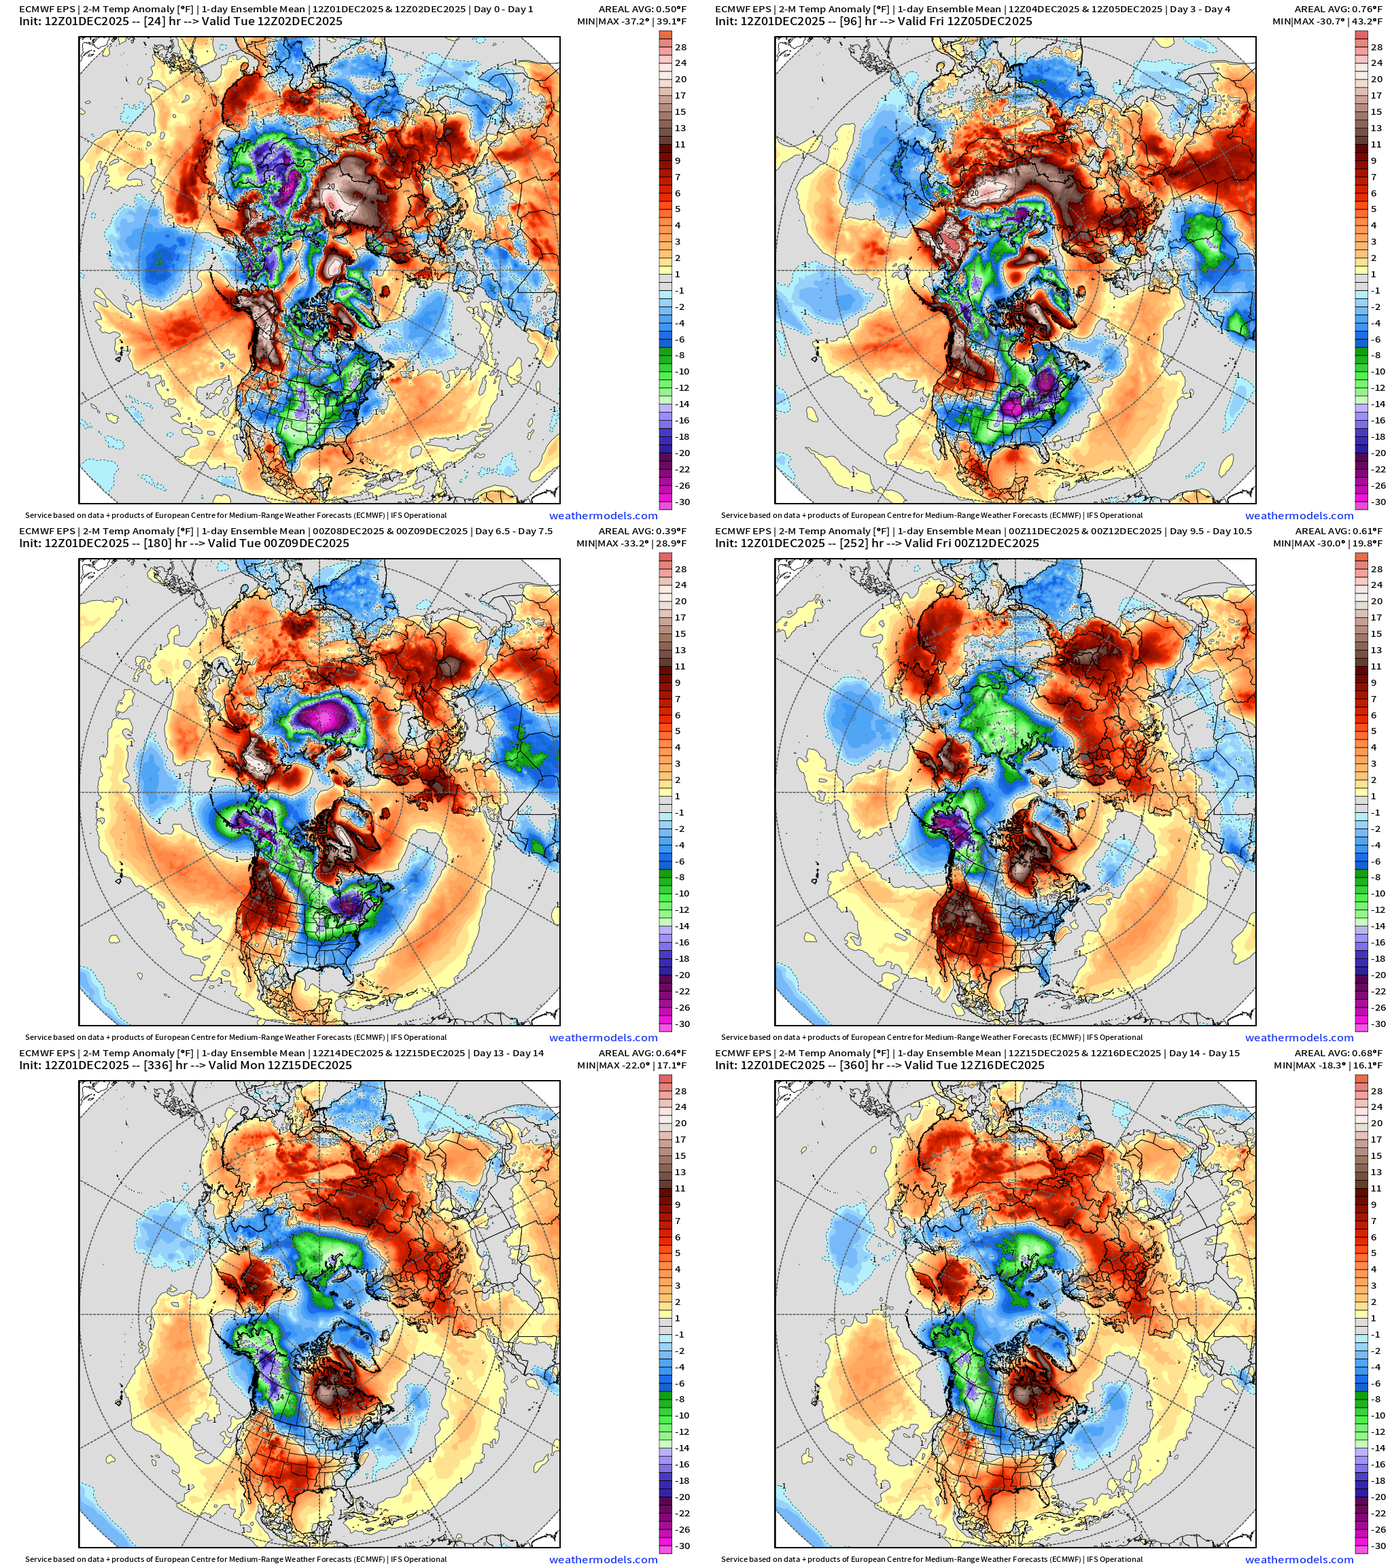
Alaska goes into the deep freeze — but also the Great Lakes, too
ECMWF AIFS 12z | Height Anomaly (500 hPa) Next 10-days
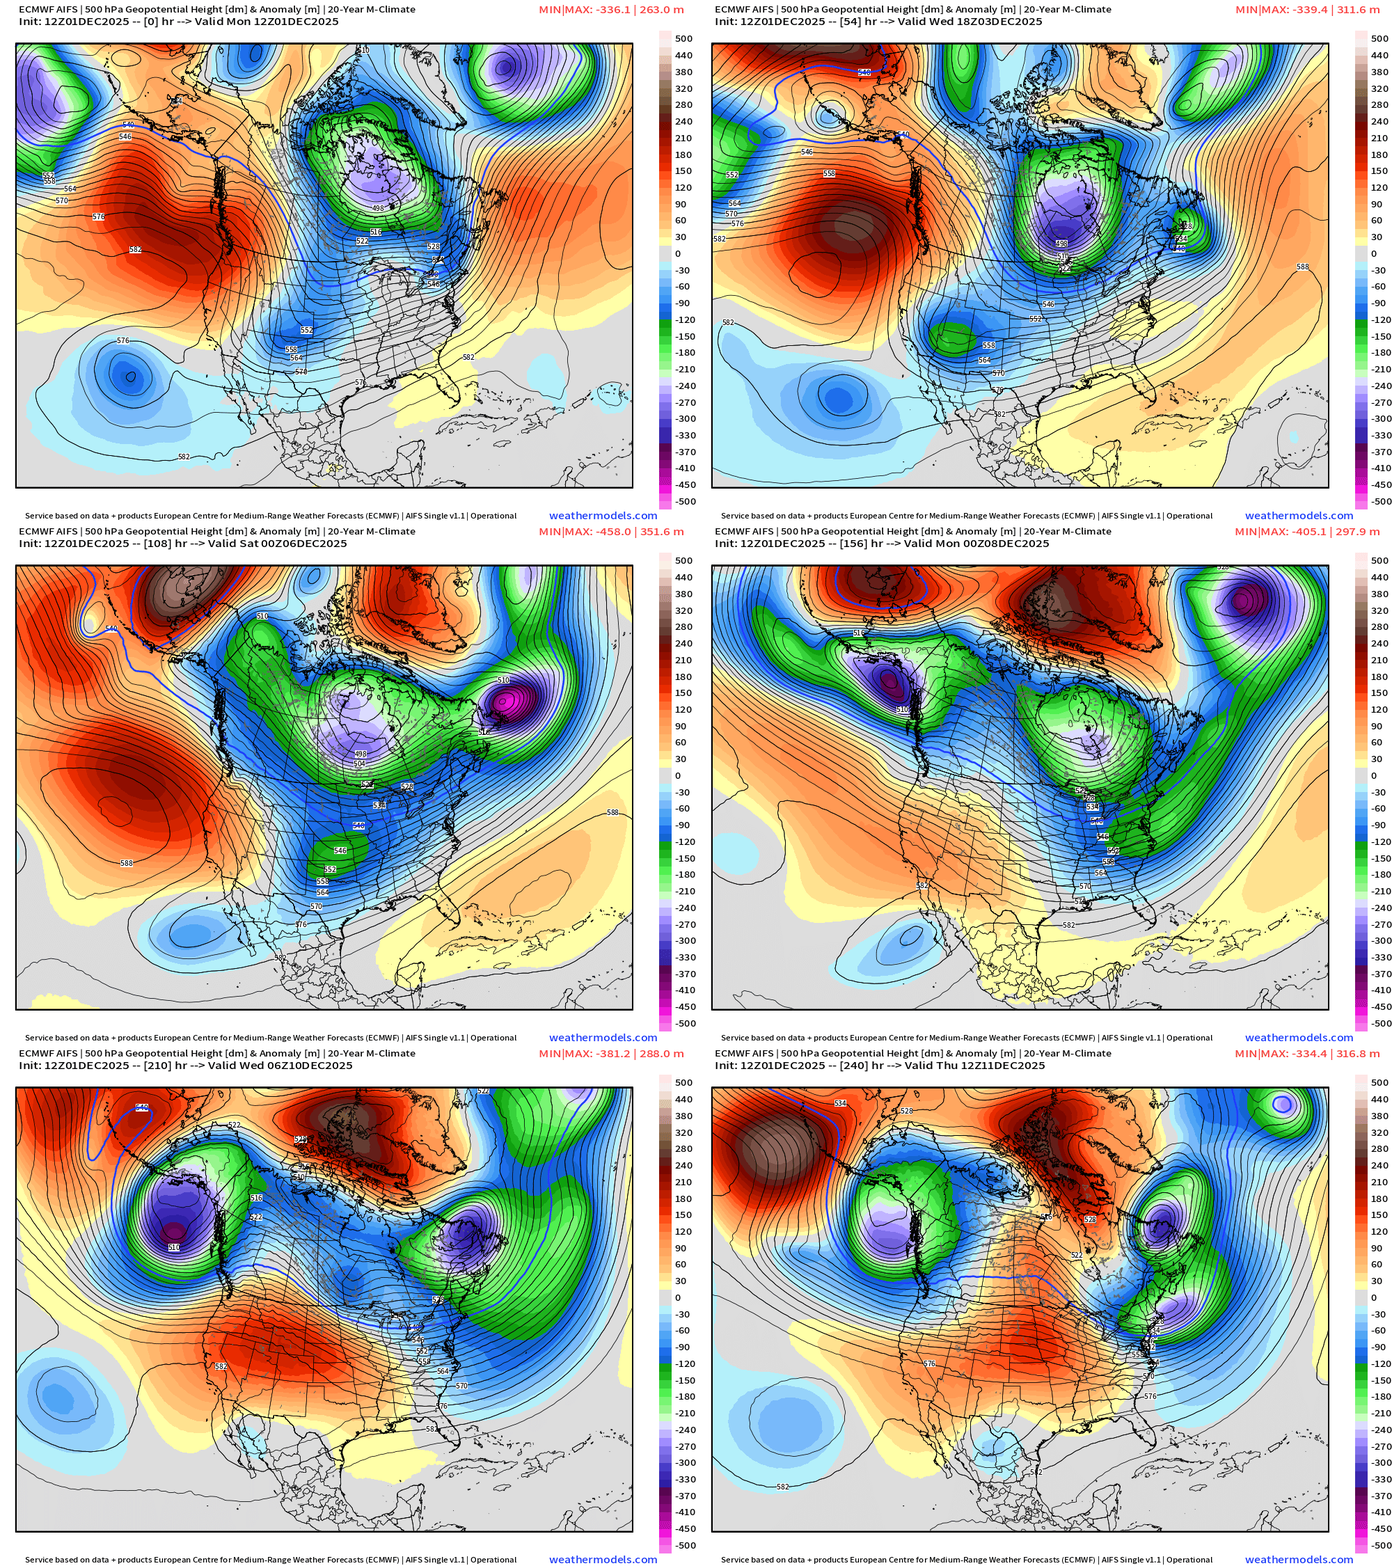
More central U.S. ridging from AIFS (12z) but that seems like an outlier with too much Pacific influence compared to other models (full physics ensembles)
Integrated Vapor Transport Next 10-days
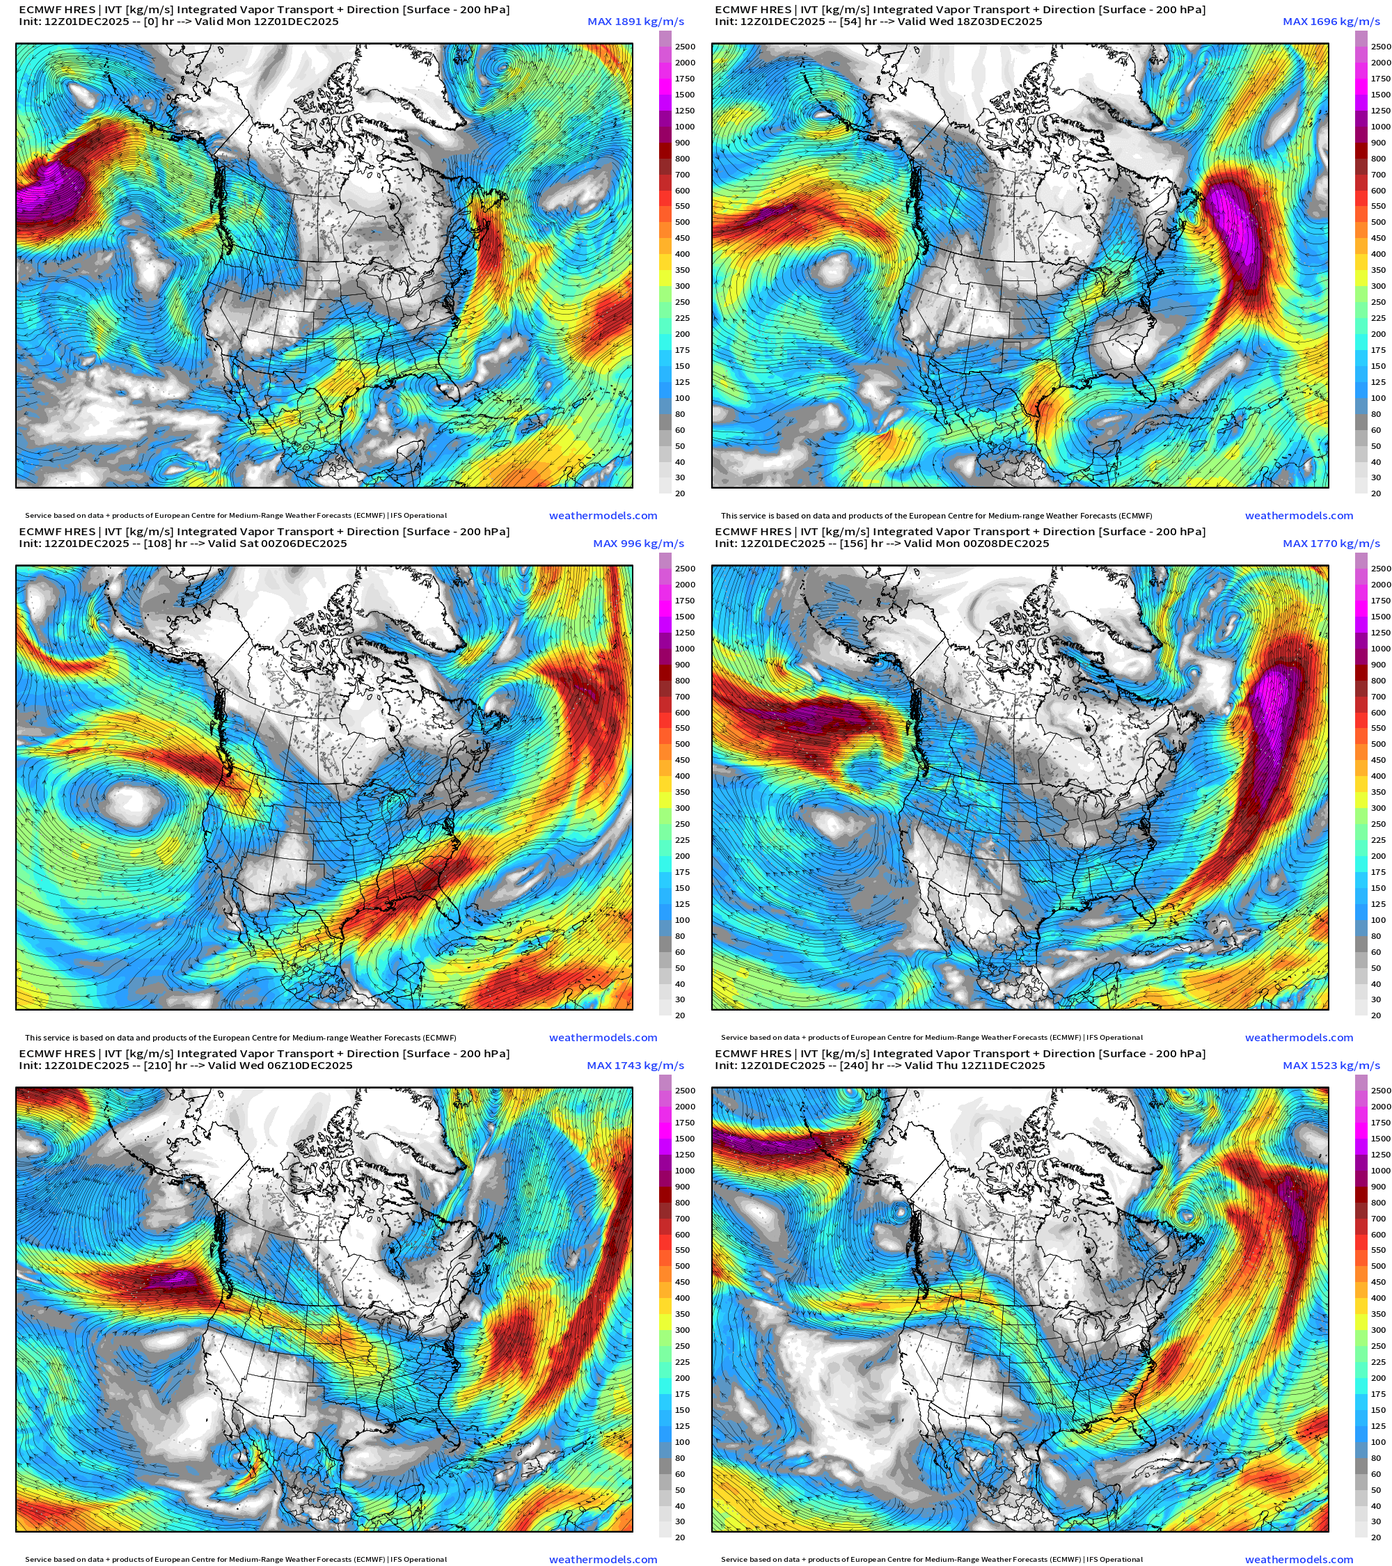
Parameter used for monitoring “atmospheric rivers” usually along the U.S. west coast, but the idea works well for many other areas — highlighting midlatitude storm systems with warm conveyor belts (moisture plumes)
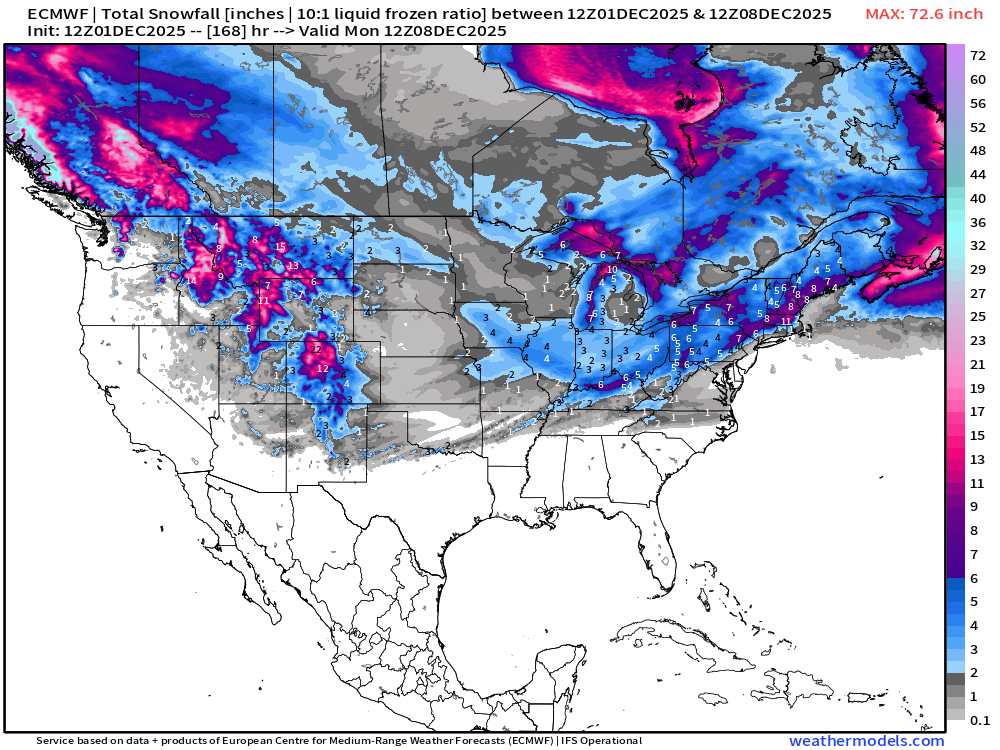
ECMWF 12z | Snowfall | Next 7-days
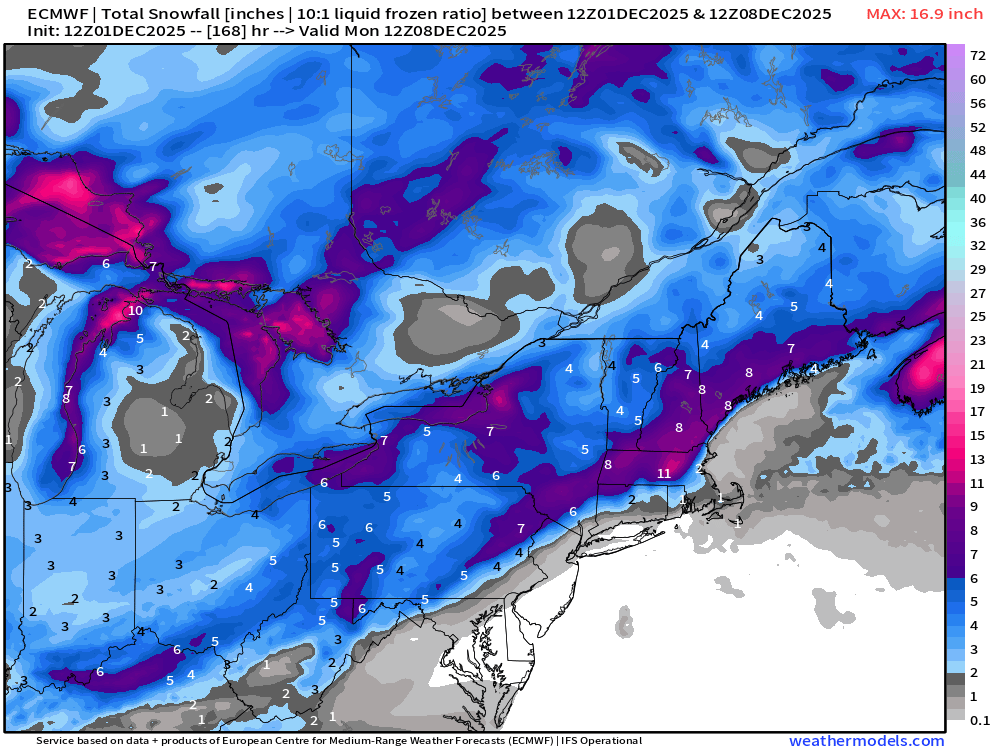
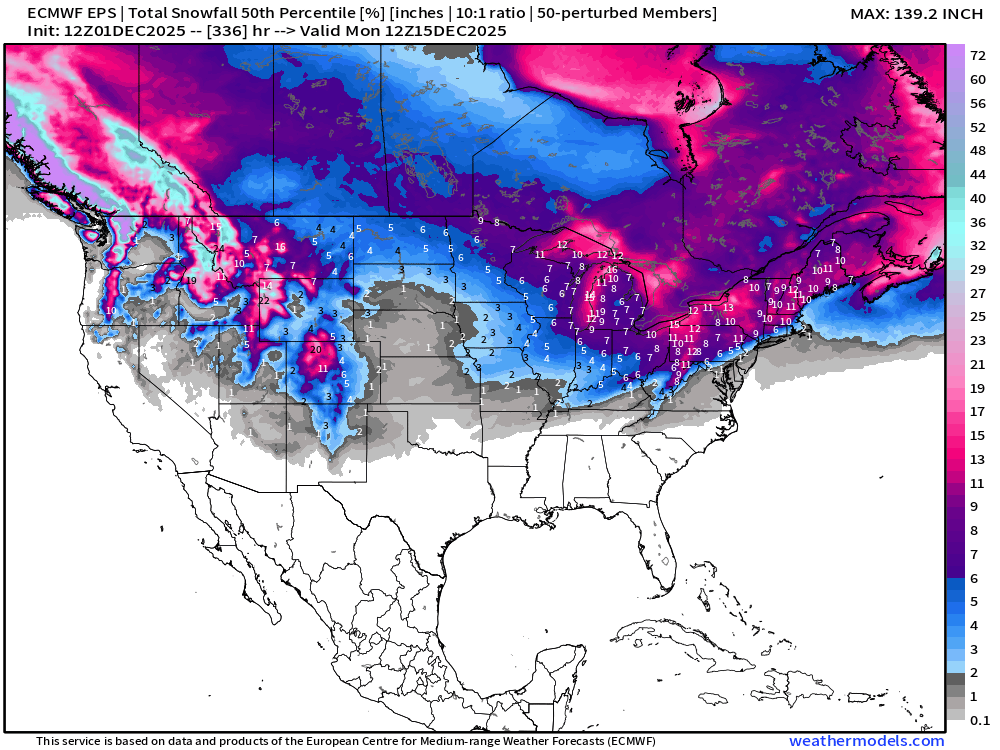
ECMWF EPS 12z | Ensemble Median Snowfall Next 14-days
ECMWF EPS 12z | Ensemble Snowfall Probability > 1” | Next 10-days
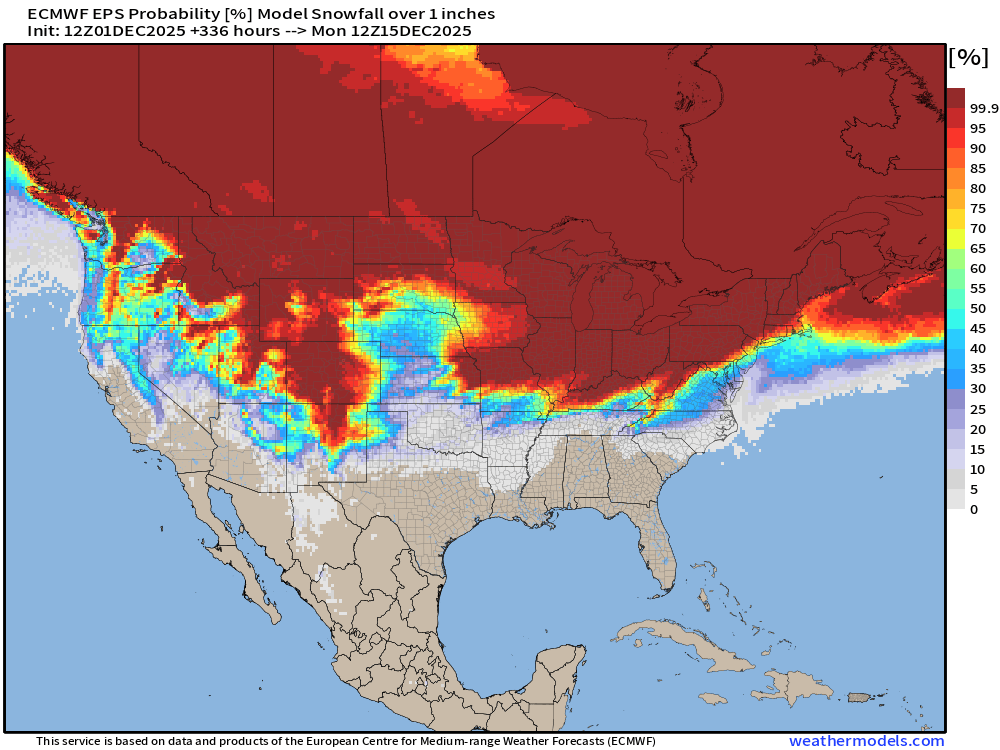
We’ll be monitoring the 1” chance of snowfall for a “White Christmas” in the coming weeks.
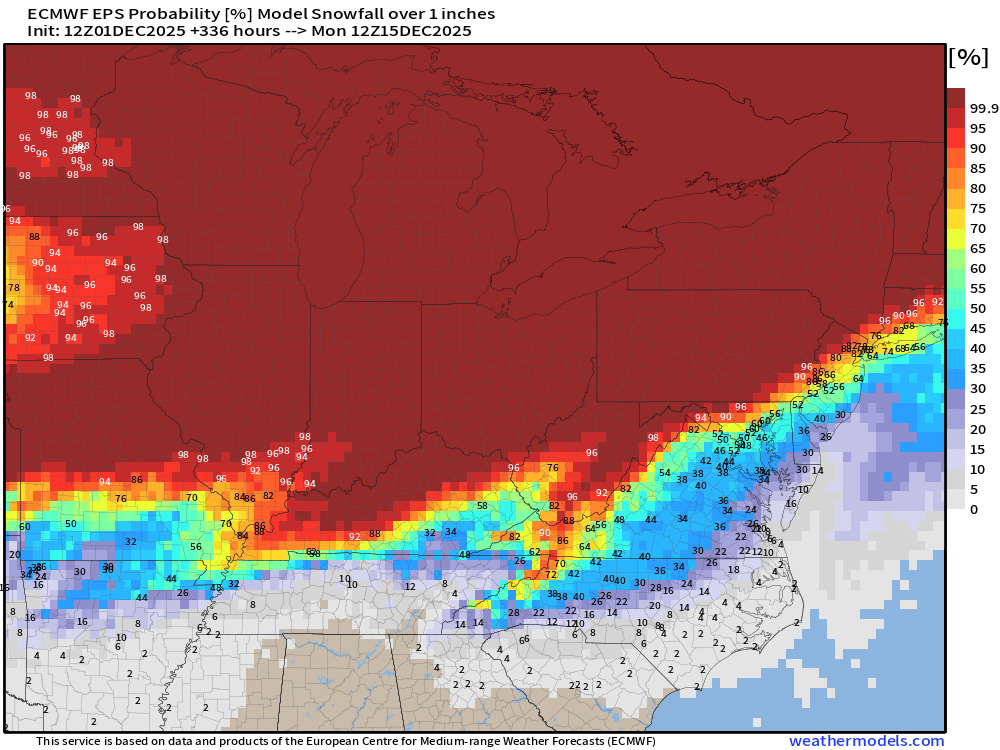
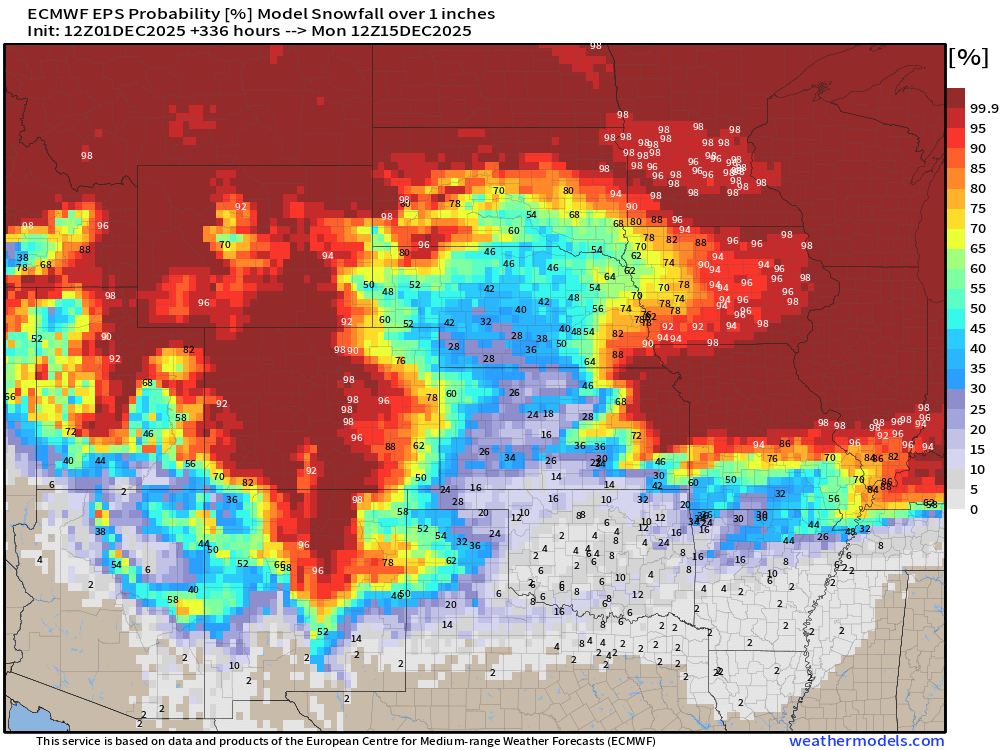
Need to look at the snowfall margin again in the Southeast — thankfully only 2% chance in Atlanta for next 14-days, but this is an impressive cold pattern + snow for early December.
ECMWF EPS 12z | Ensemble Snowfall Probability > 6” | Next 14-days
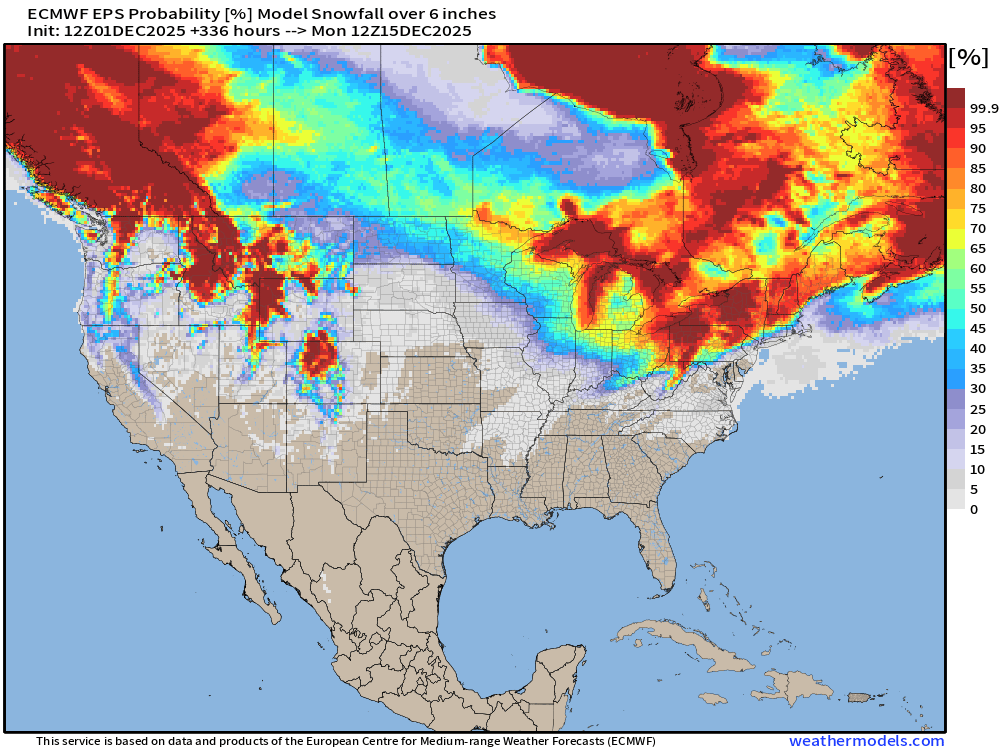
6-inches is sufficient for a “big storm” and Lake Effect machine diagnostic
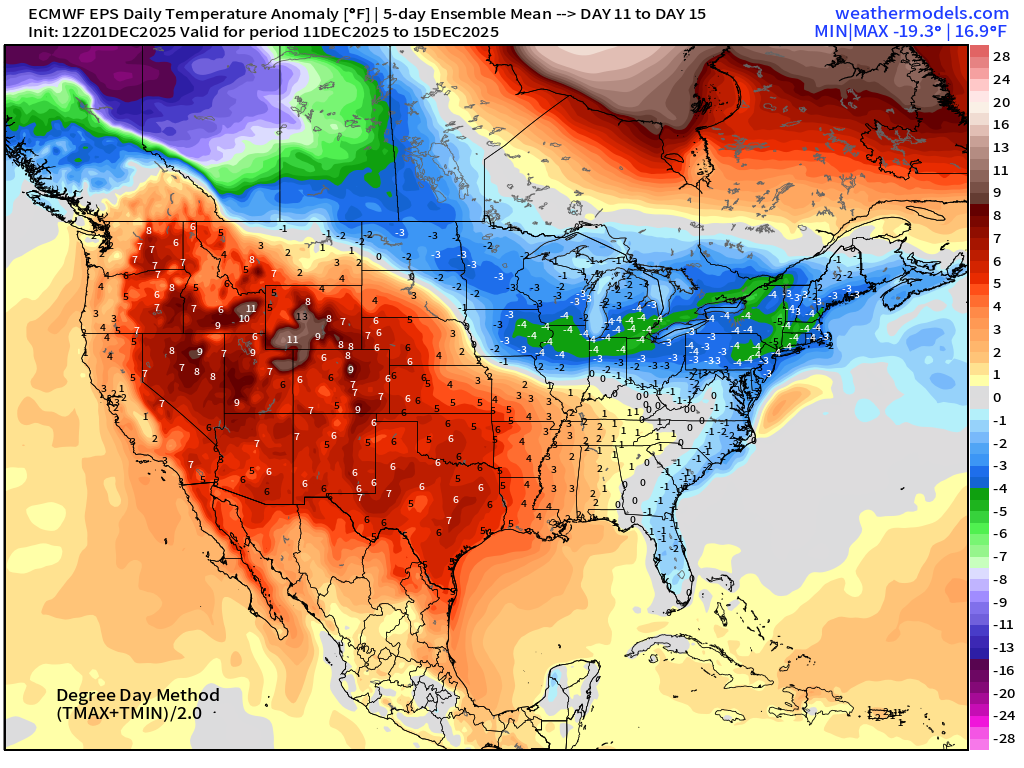
Temperature Anomaly | Next 15-days | ECMWF EPS 12z
5-Day Chunk #1 | Temperature Anomaly | Dec 1 - Dec 5
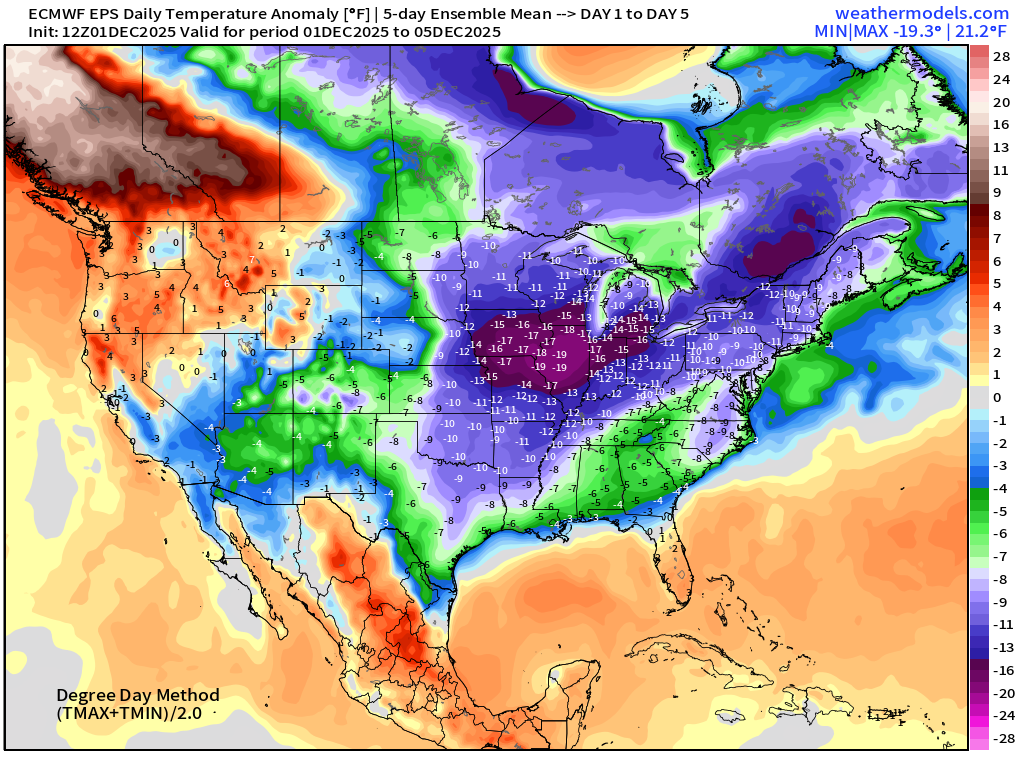
5-Day Chunk #2 | Temperature Anomaly | Dec 6 - Dec 10
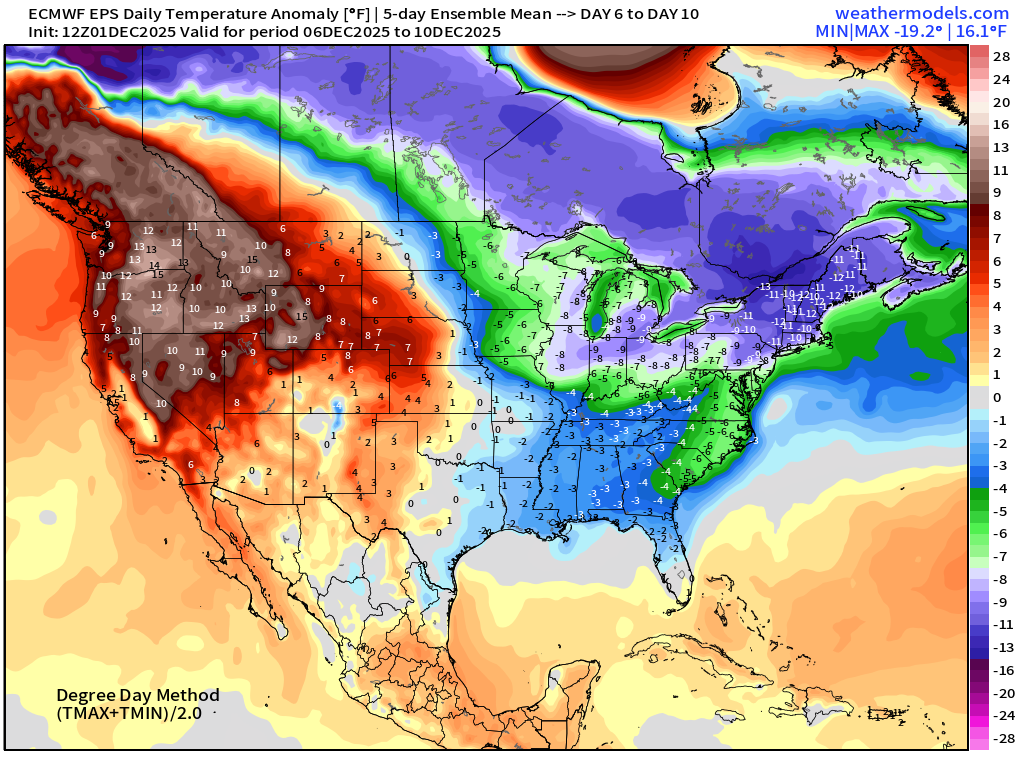
5-Day Chunk #3 | Temperature Anomaly | Dec 11 - Dec 15
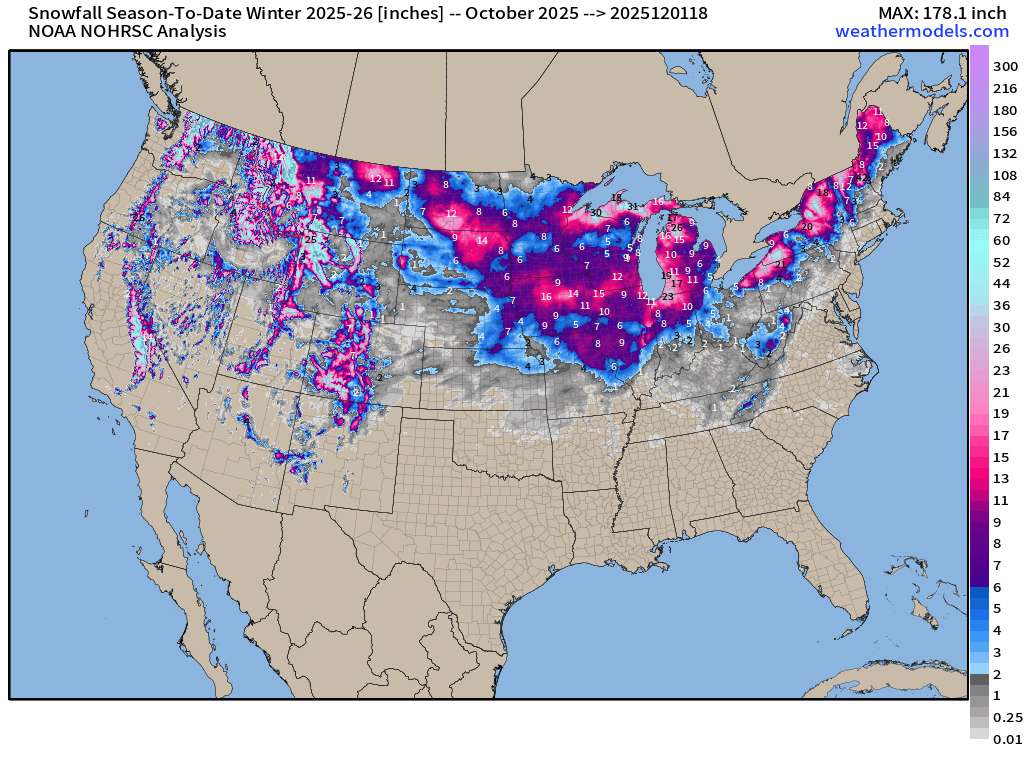
Snowfall Analysis | October 2025 - today
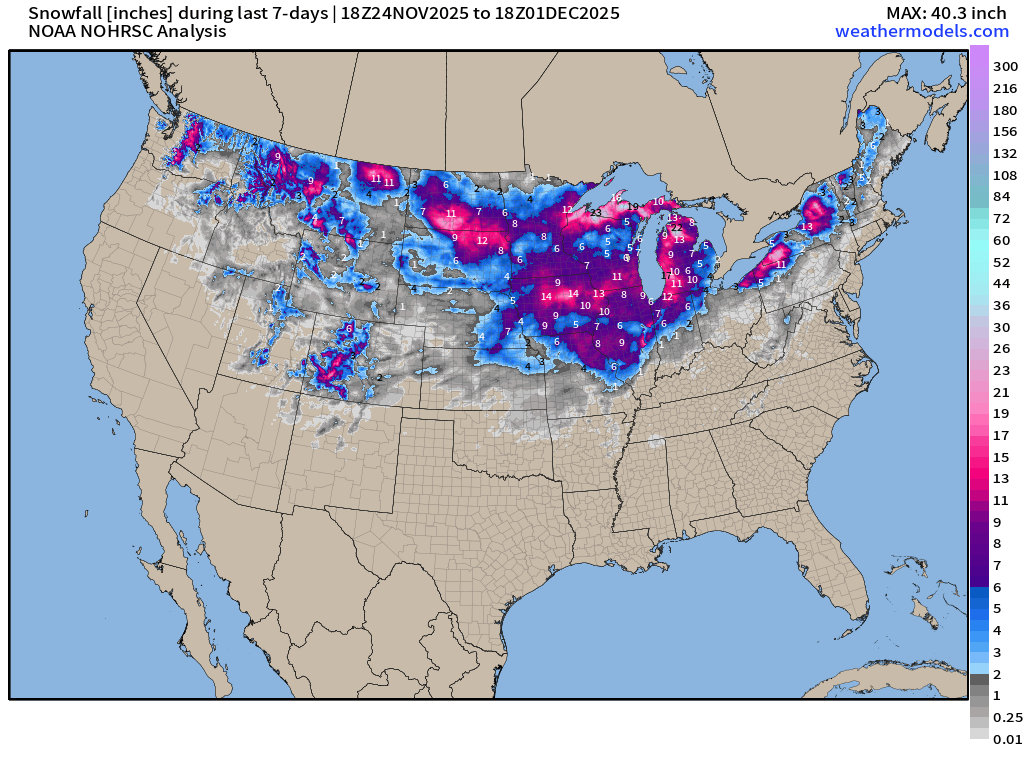
Snowfall Analysis | Last 7-days
Maps sourced from weathermodels.com designed and innovated by yours truly! Please subscribe there for real-time access to the newest maps, charts from all of the weather models including ECMWF and AIFS, NOAA AI-GFS/AI-GEFS
- Milepost
- 802 · laid 2025-12-01T23:44:47.921000Z
- Source
- https://weather.substack.com/p/december-1-2025-monday-winter-weather
- Digest
- b78b41d54c421dbc0cfec41f5a1e1221a4940d81537f93a23e5087f3695d086c
- Machine
- JSON