November 18, 2025 Tuesday Winter Weather
Arctic cold for Thanksgiving weekend but main event may wait until December
November 2025 was the 4th-warmest November in the 131-year national record (1895–2025), at 46.7°F against a 1991–2020 normal of 43.0°F (+3.7°F).
November 2025 was the 29th-driest November in the 131-year national record (1895–2025), at 1.7in against a 1991–2020 normal of 2.3in (-0.6in).
NOAA/NCEI Climate at a Glance, contiguous United States. This is the observed record for the month, not a score of anything said in this piece — the forecast ledger begins 2026-08-17 and cannot reach earlier posts.

Gallery of 10-Days | 500 mb Height Anomaly
A sharp trough will dip into the Great Lakes and Eastern U.S. by Day 10. There is uncertainty in the timing, intensity and longevity of the “Arctic blast” — and we have no shortage of solutions from countless global weather models — conventional (full physics) and A.I. trained — plus ensembles.
How do we even begin to make sense of ALL of this data? Human interpretation can only go so far — we need diagnostics and verification. The individual models all have their own quirks or biases — and trend different ways as we look over the forecast horizon. This is a hard problem — but there are ways to simplify and optimize the medium range forecasting workflow. More on that front soon …
Lower 48 precipitation type + MSLP for the next 6-days!
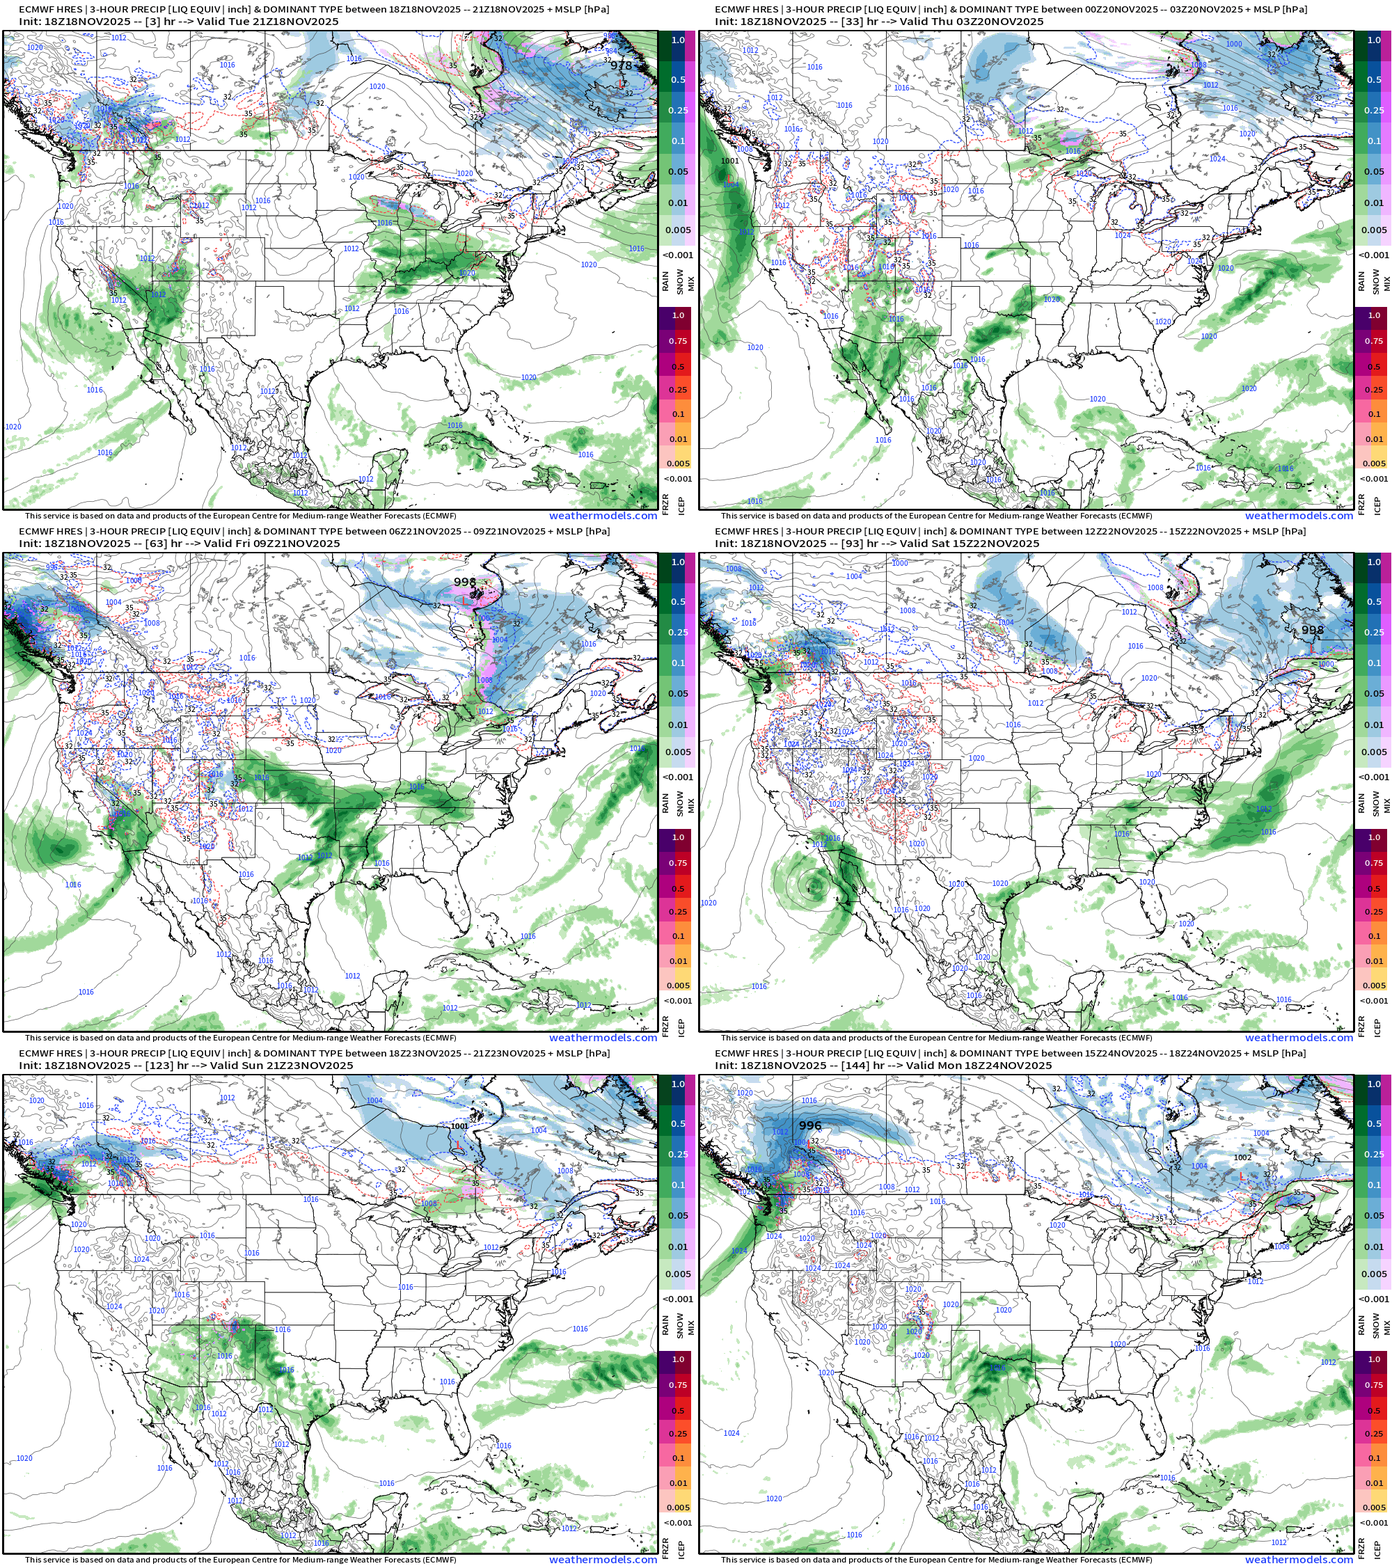
Headlines Tuesday Evening
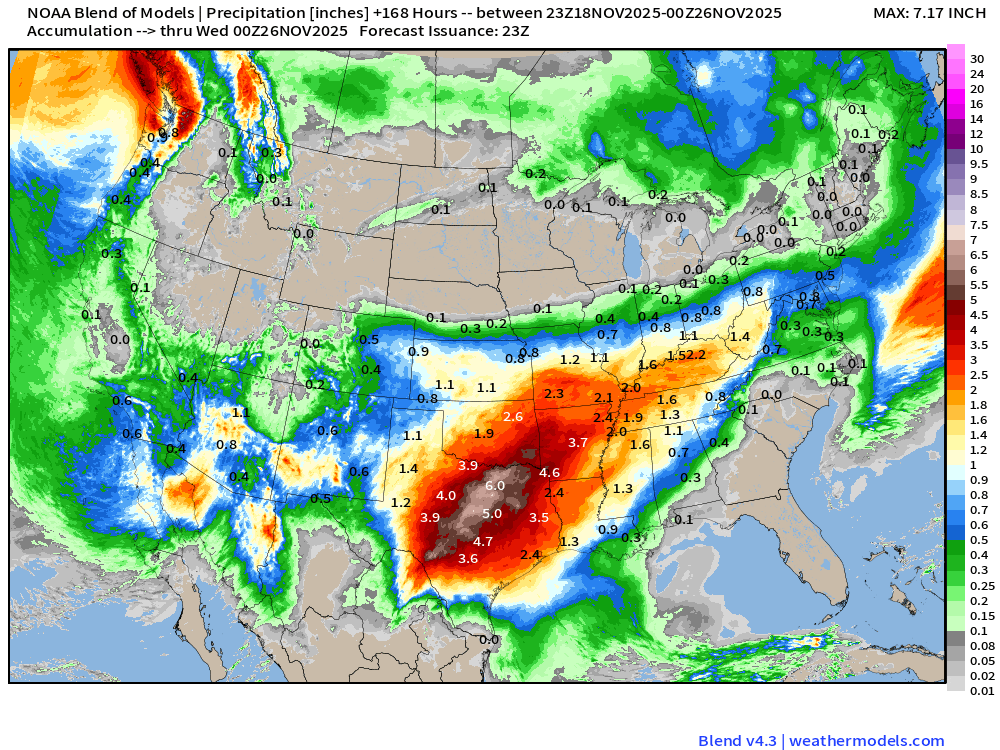
Slow moving cut-off lows spin over California .. and slowly eject eastward into the Southwest and Texas. Counter-clockwise flow will bring subtropical Pacific warmth and moisture into the Lower 48. This sets stage for major rainfall in Texas by early next week.
Northeast is very slow to ditch the lingering storm system and troughing that has made for a chilly, gloomy past several days. And, we may see light snowfall in NYC on Wednesday morning.
Models are showing increasing risk of a “polar vortex” Arctic blast for the Rockies into the Central —> then Eastern U.S. in the 9-10 days time frame into early December. However, other than “below normal” temperature expected after a long period of warmth, we cannot yet pull the alarm for major/record lows. The “full load” of the polar vortex main remain “locked up” in Canada.
Temperature Anomaly | EPS 12z | Flagship Ensemble Mean
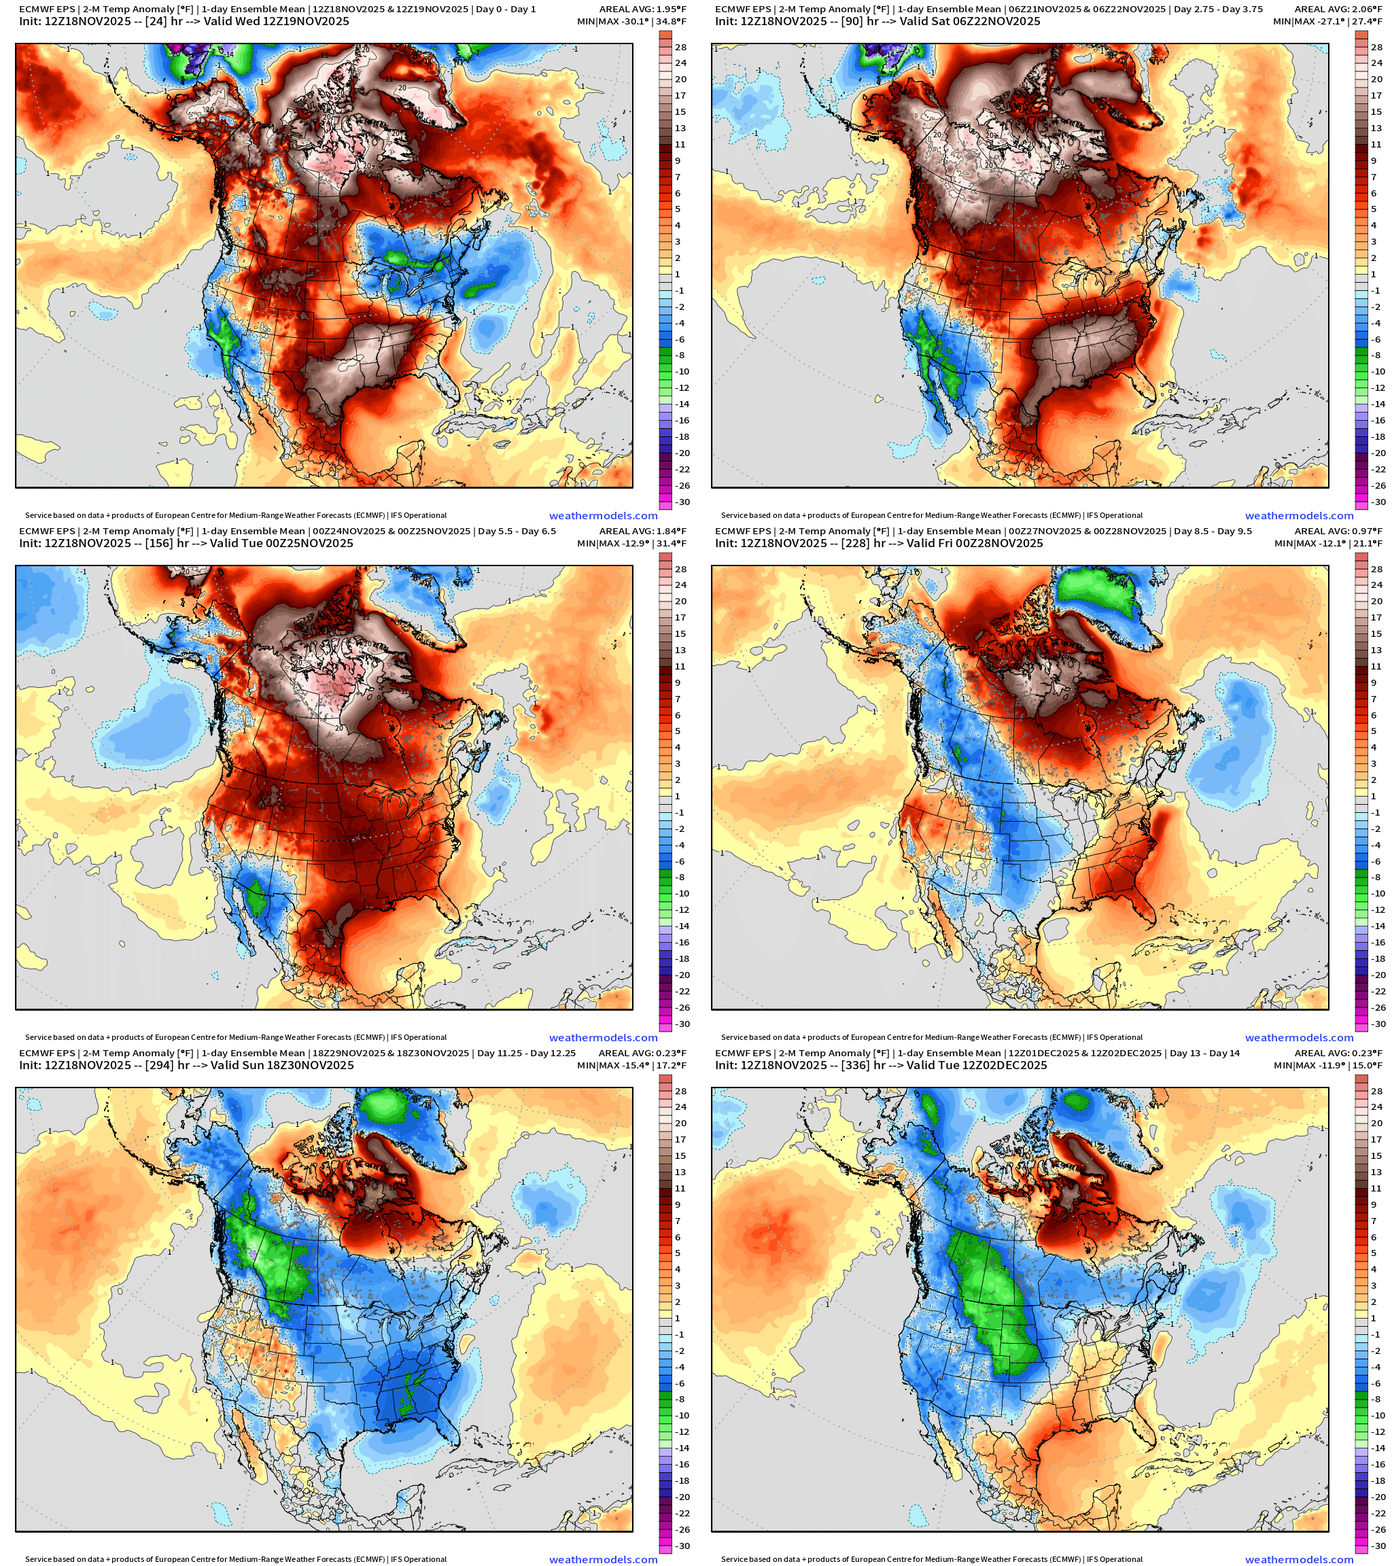
If there’s one animation that is the industry standard for monitoring cold air outbreaks, then it’s the ECMWF EPS full-physics ensemble mean 2-meter temperature anomaly. I’ll start showing this daily in this newsletter to monitor the impending Arctic cold in Days 9-15+
New and fancy AI tools from NOAA (discussed last Friday) | Mapping the Tropospheric Polar Vortex
AI-GFS 18z | 500 mb Temperature | Next 10-days
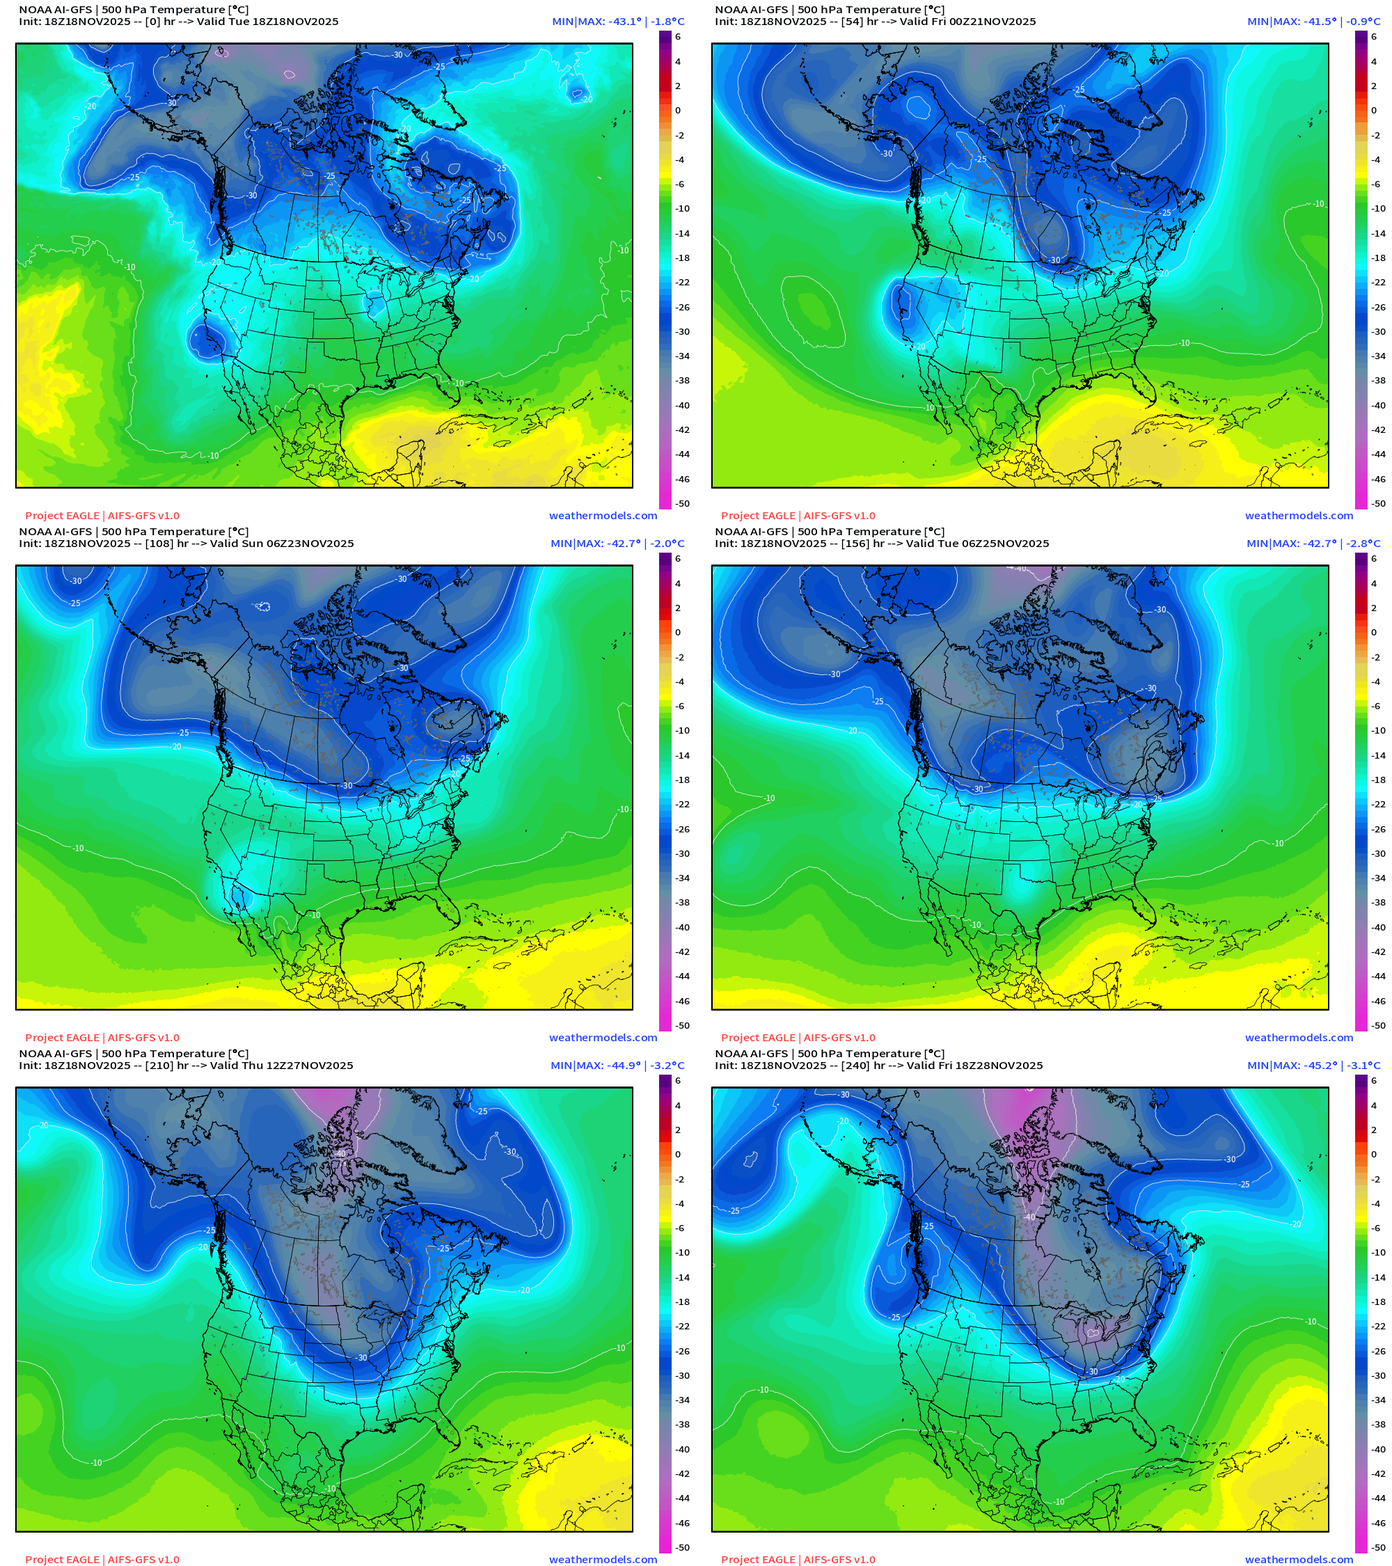
The AI-GFS will be sharper after ~Days 6-7 compared to the ensemble mean of the AI-GEFS output. The ensemble mean is a statistical field that averages the individual members. Reminder, it is not a member of the ensemble itself.
Into Day 10 —> strong Midwest trough forms from a Pacific shortwave phasing with the Hudson Bay anchored tropospheric Polar Vortex I see -40°C over Michigan at Day 10.
AI-GEFS 18z | 500 mb Temperature Ensemble Mean | Next 10-days
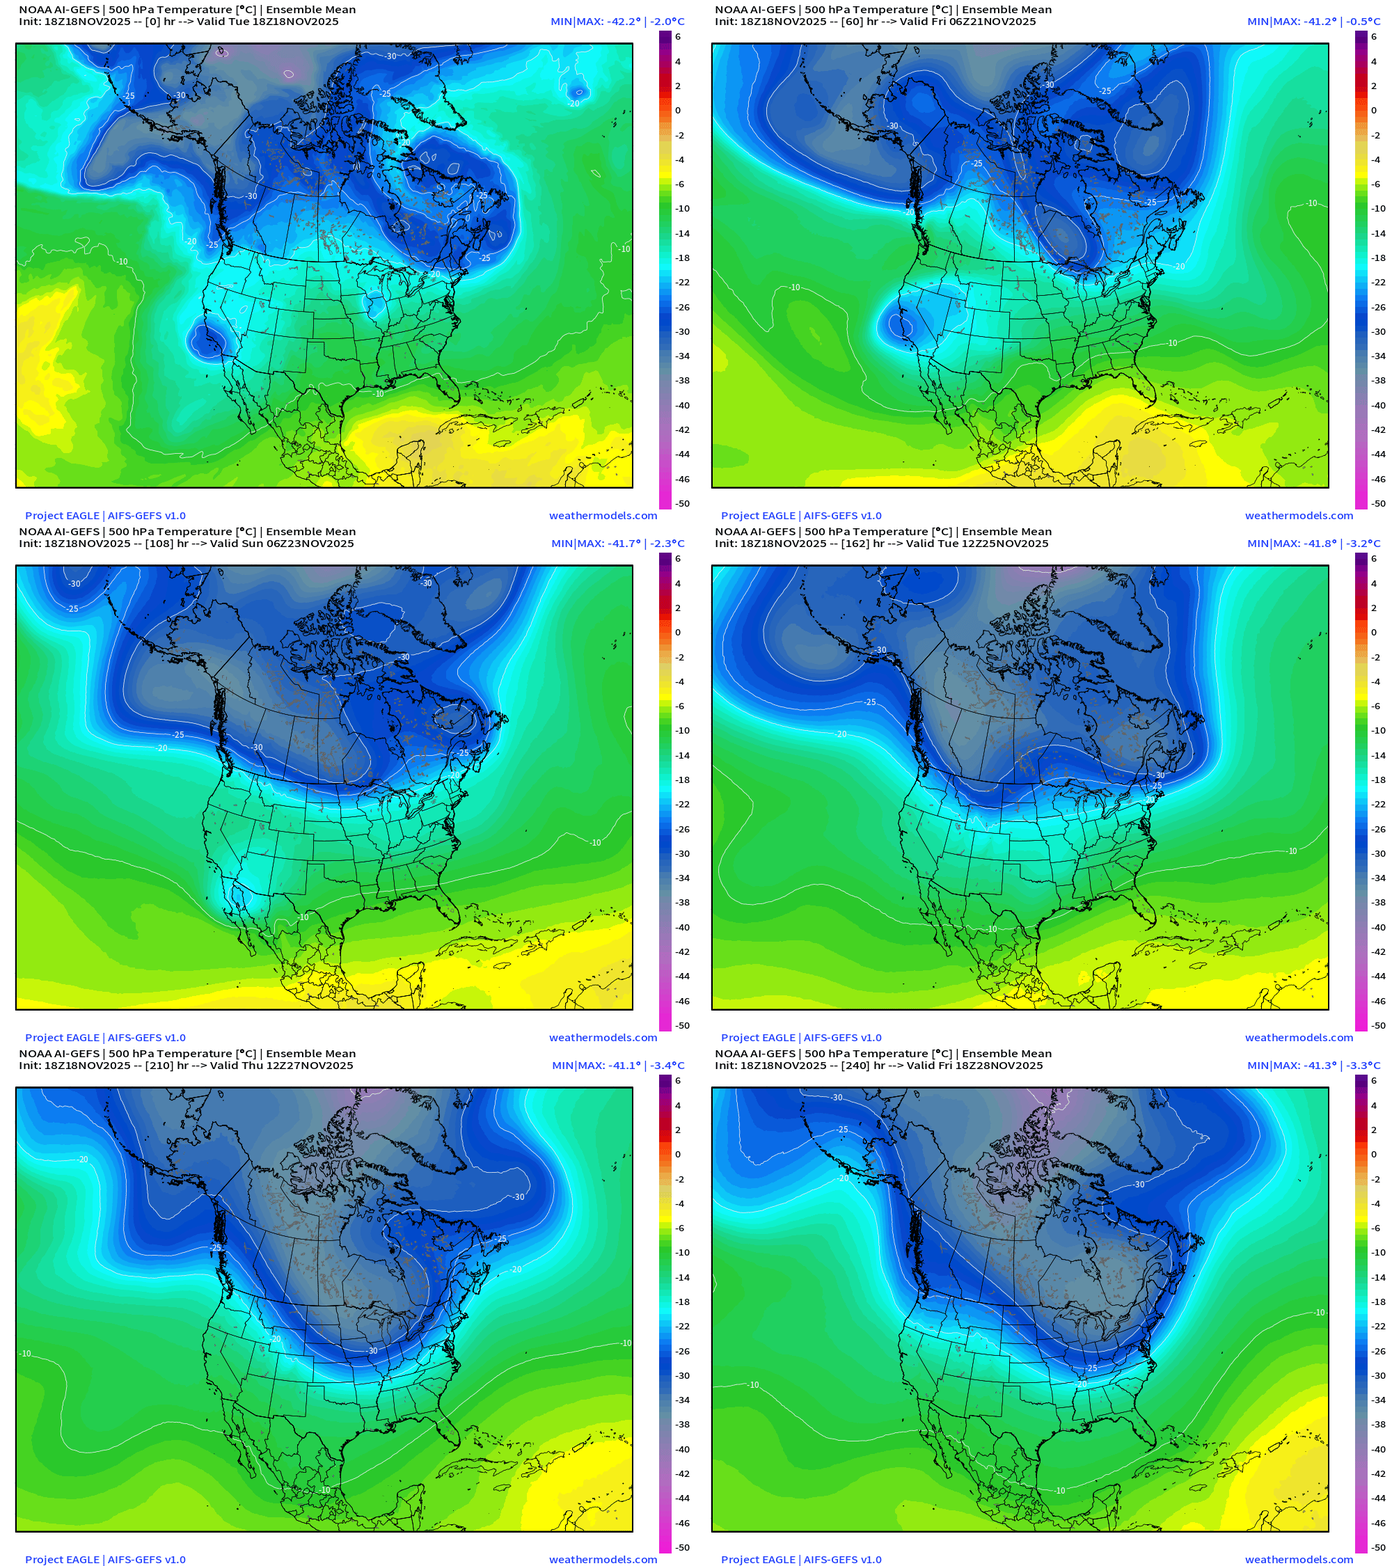
Similar upper-level pattern through Day 10 from the AI-GEFS ensemble mean as the AI-GFS. It is a technical hurdle to download the individual (pressure level) ensembles from NOAA NOMADS at this time — and I don’t want to put my servers on the “blocked IP” list by bombarding their server. Efforting.
In general, here on this platform, I’m going to defer to the ECMWF suite of guidance mainly because I do not know how skillful or added benefit/value of AI-GFS/AI-GEFS at this time. But, for the next 2-weeks, we’re going for a ride.
Extended Range | IFS Ensemble Control (Flagship model)
ECMWF 12z | 500 mb Temperature | Days 7-15
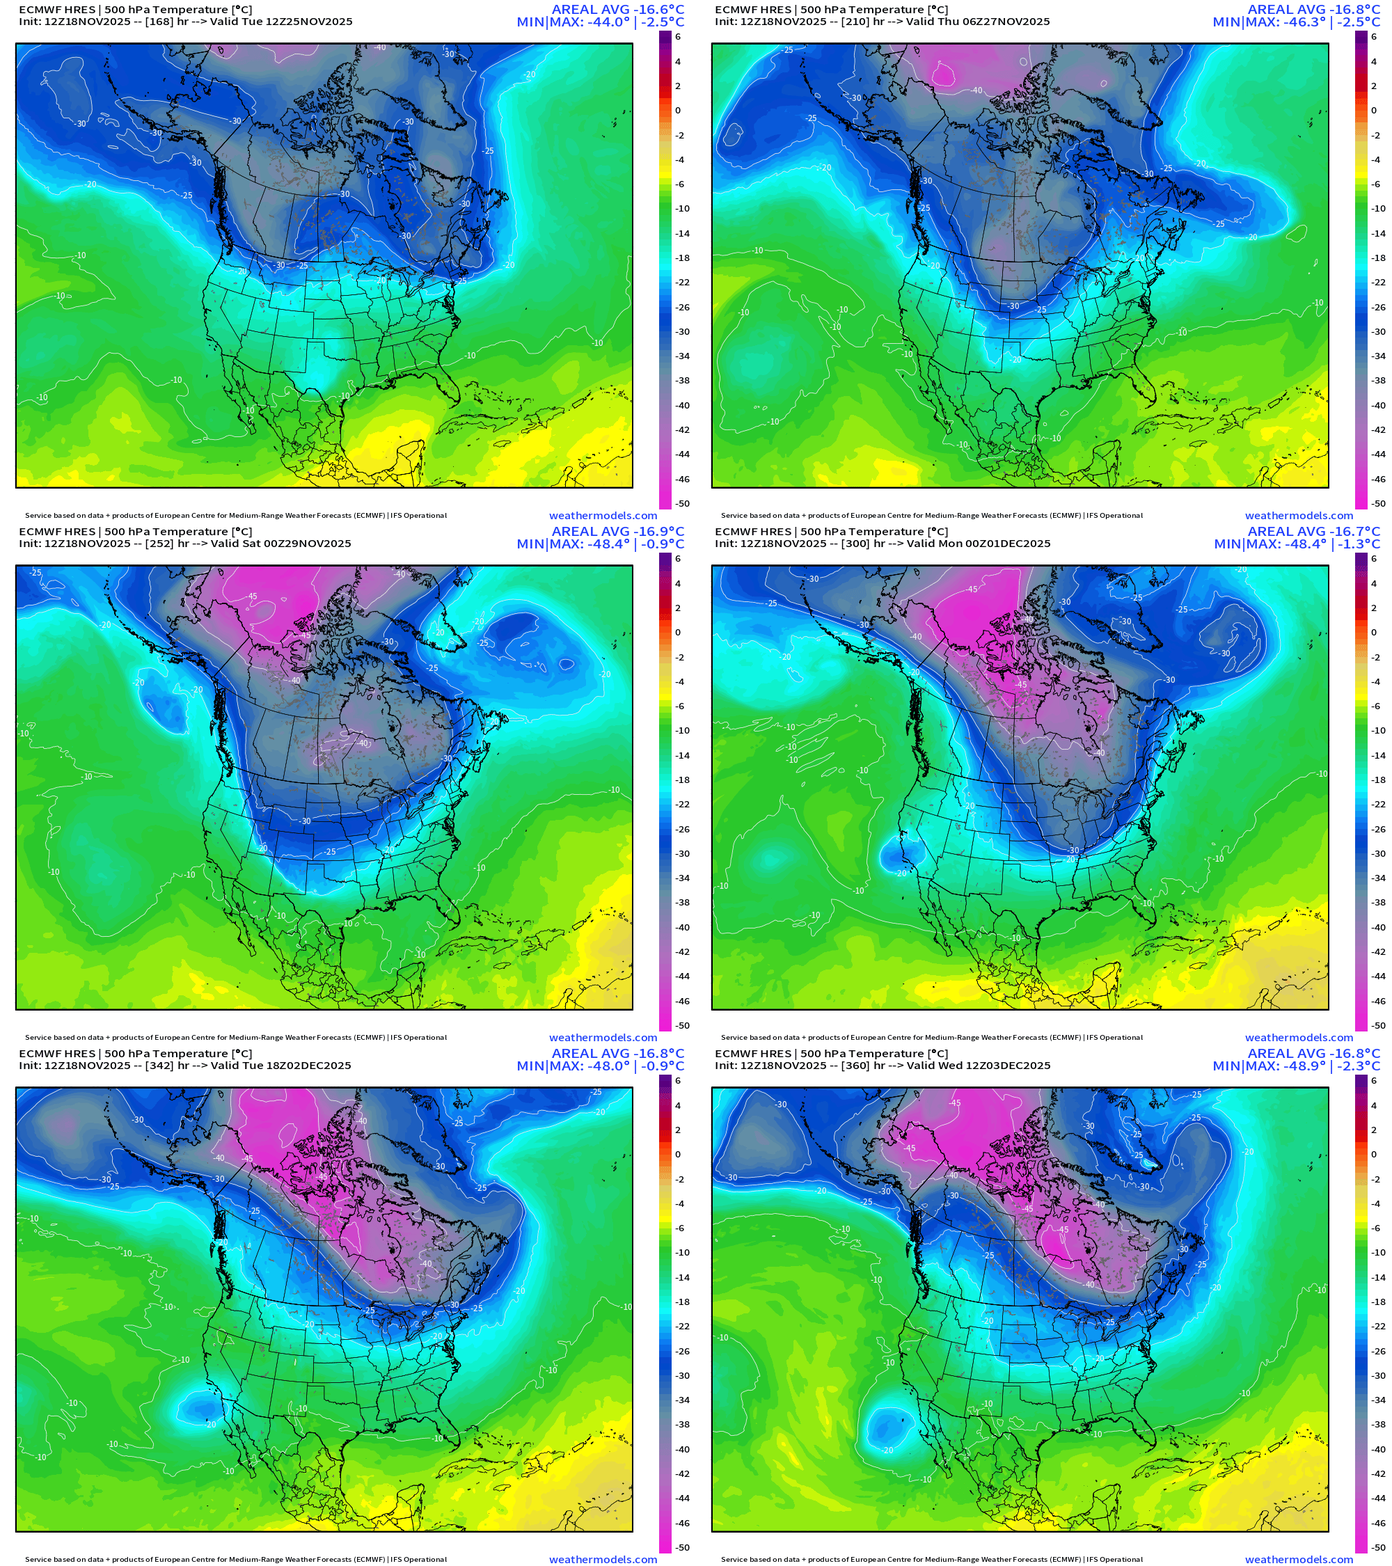
The 500 mb temperature field (middle troposphere) has become quite popular on my X feed as I’ve shared quite a few animations of both North America and Europe. ZeroHedge is featuring today!
The dark blue is about -25°C and represents Arctic origin air — shows up nicely within the main blobs over Canada, and the pieces that break off with “lobes” as Rossby wave breaking or trough thinning sends little cut-off low circulations into the subtropics were they cause mischief!
This is Days 7 to 15 from the ECMWF IFS HRES from 12z. This is a very promising upper-level patten with a “blob” of cold over central Canada just waiting for Pacific shortwaves to drag it south, however it remains locked up. The cold pool is approaching -50°C (!)
AIFS 12z | 500 mb Temperature | Days 7-15
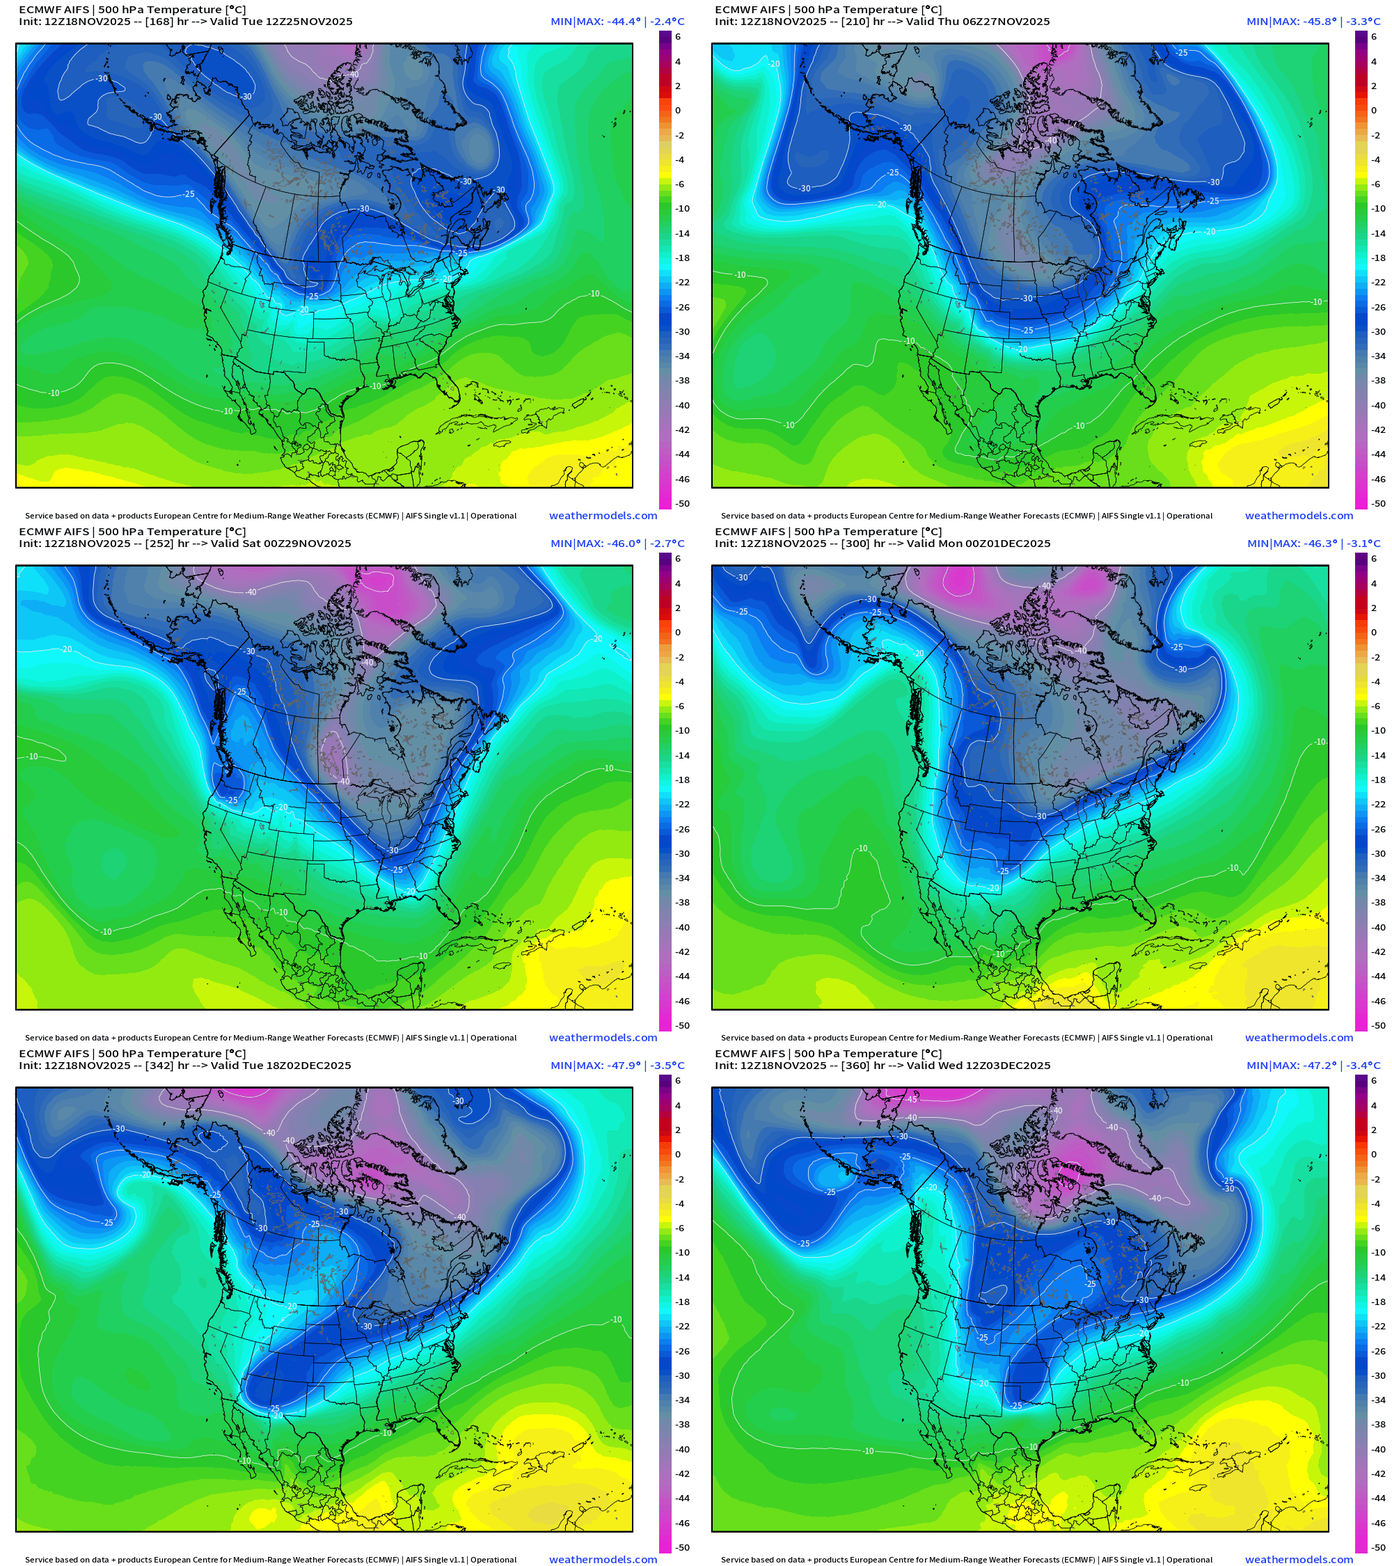
Pattern from the AI trained AIFS-Single is more amplified in the long-range. Can’t really say much about likelihood of a given solution past Day 10, or so. But, there is a massive pool of very cold air forming over the Arctic.
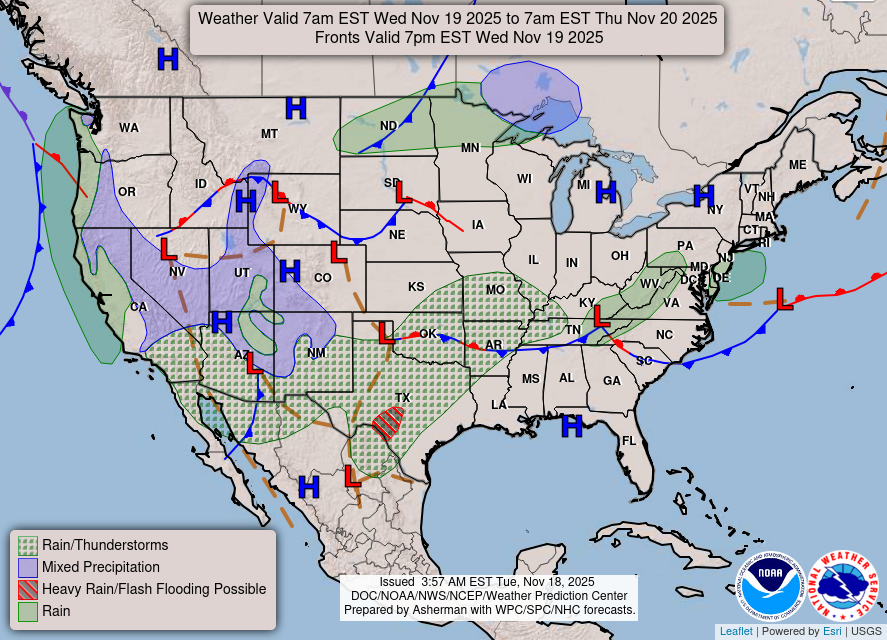
Lower 48 | Evening Frontal Boundaries
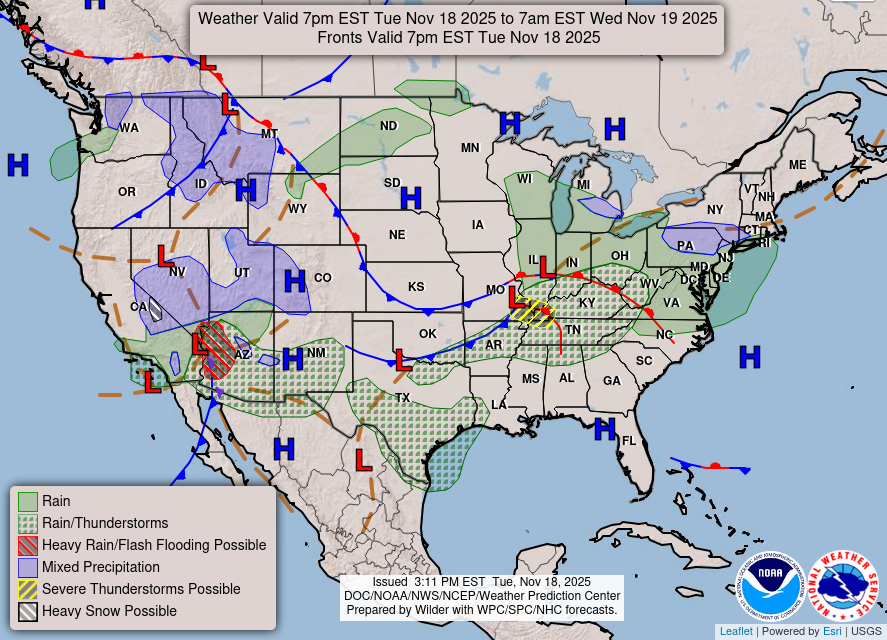
Area of rain + embedded thunderstorms will move east across the mid-Atlantic with some potential of light snow for NYC metro — but unlikely to see accumulations.
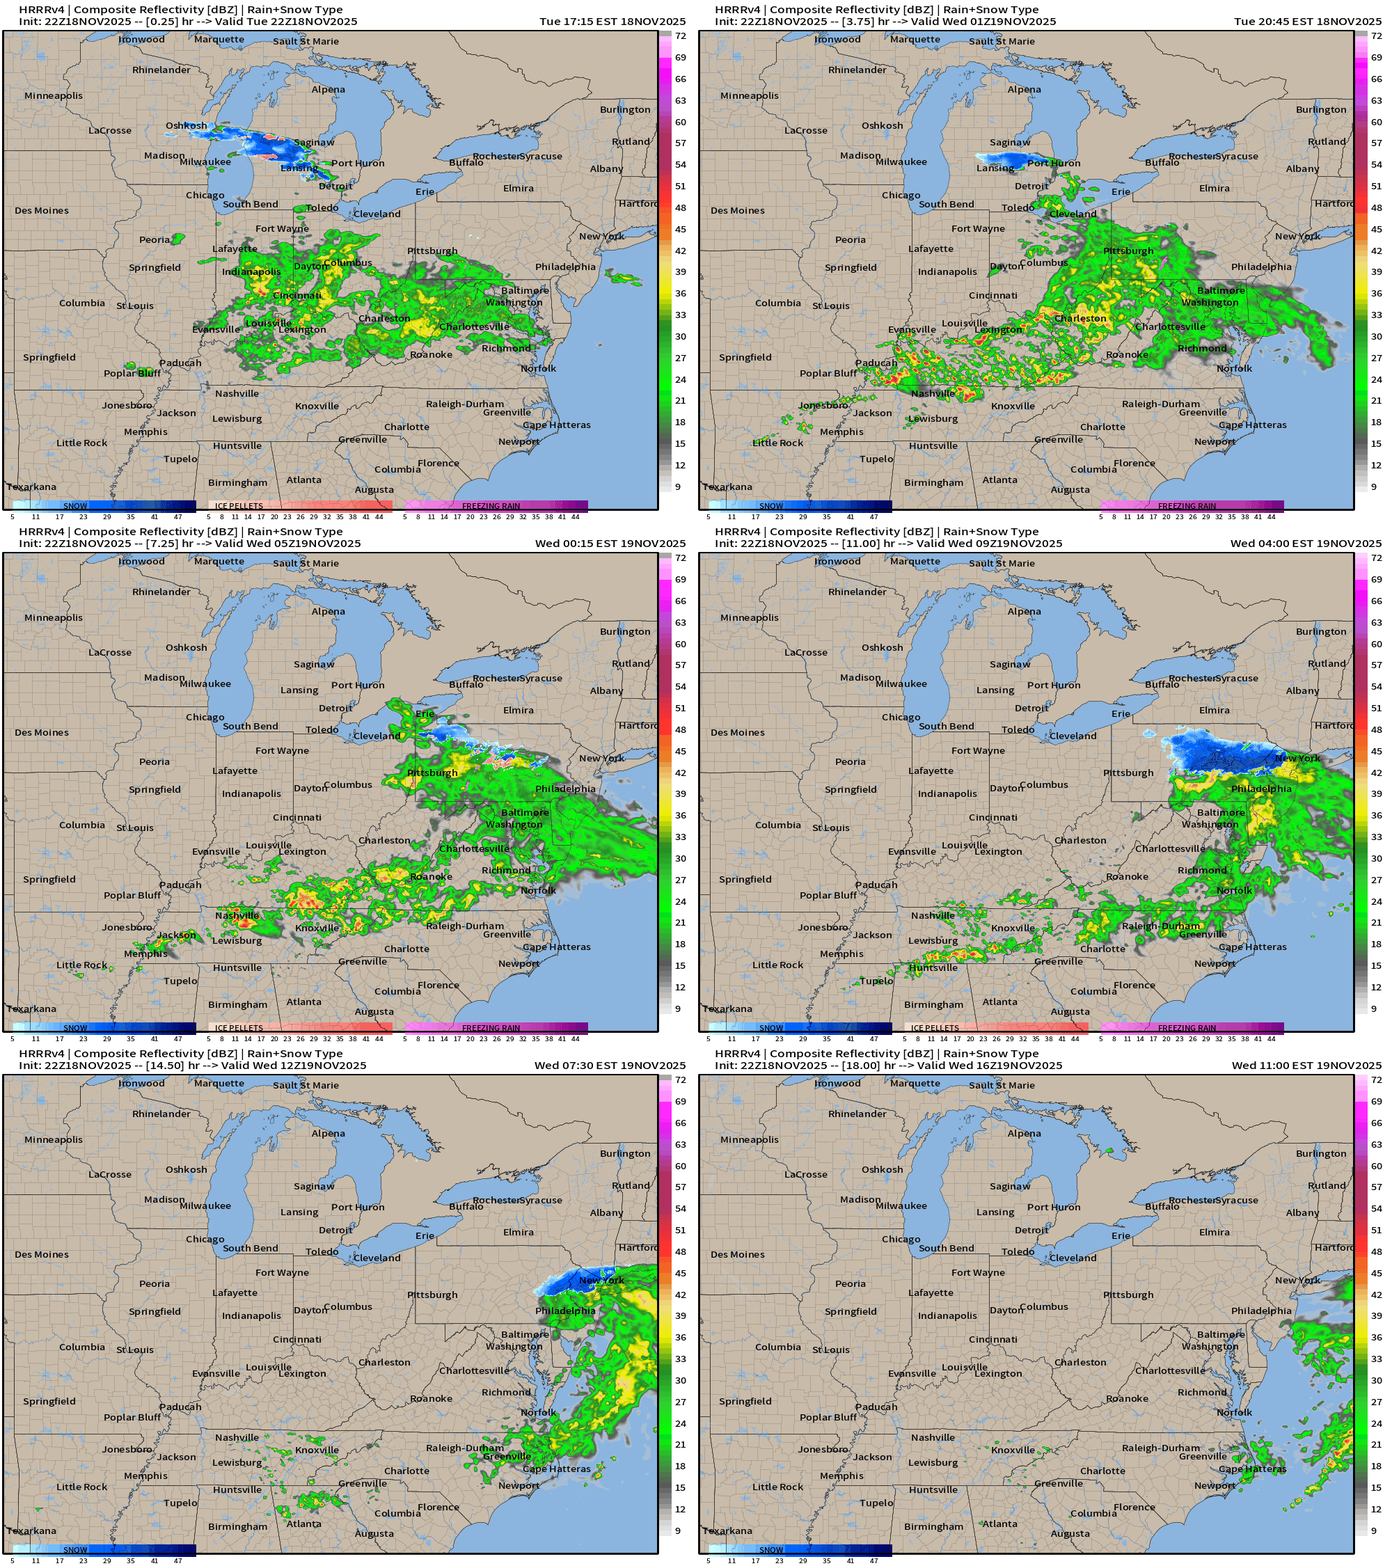
Weather on Wednesday
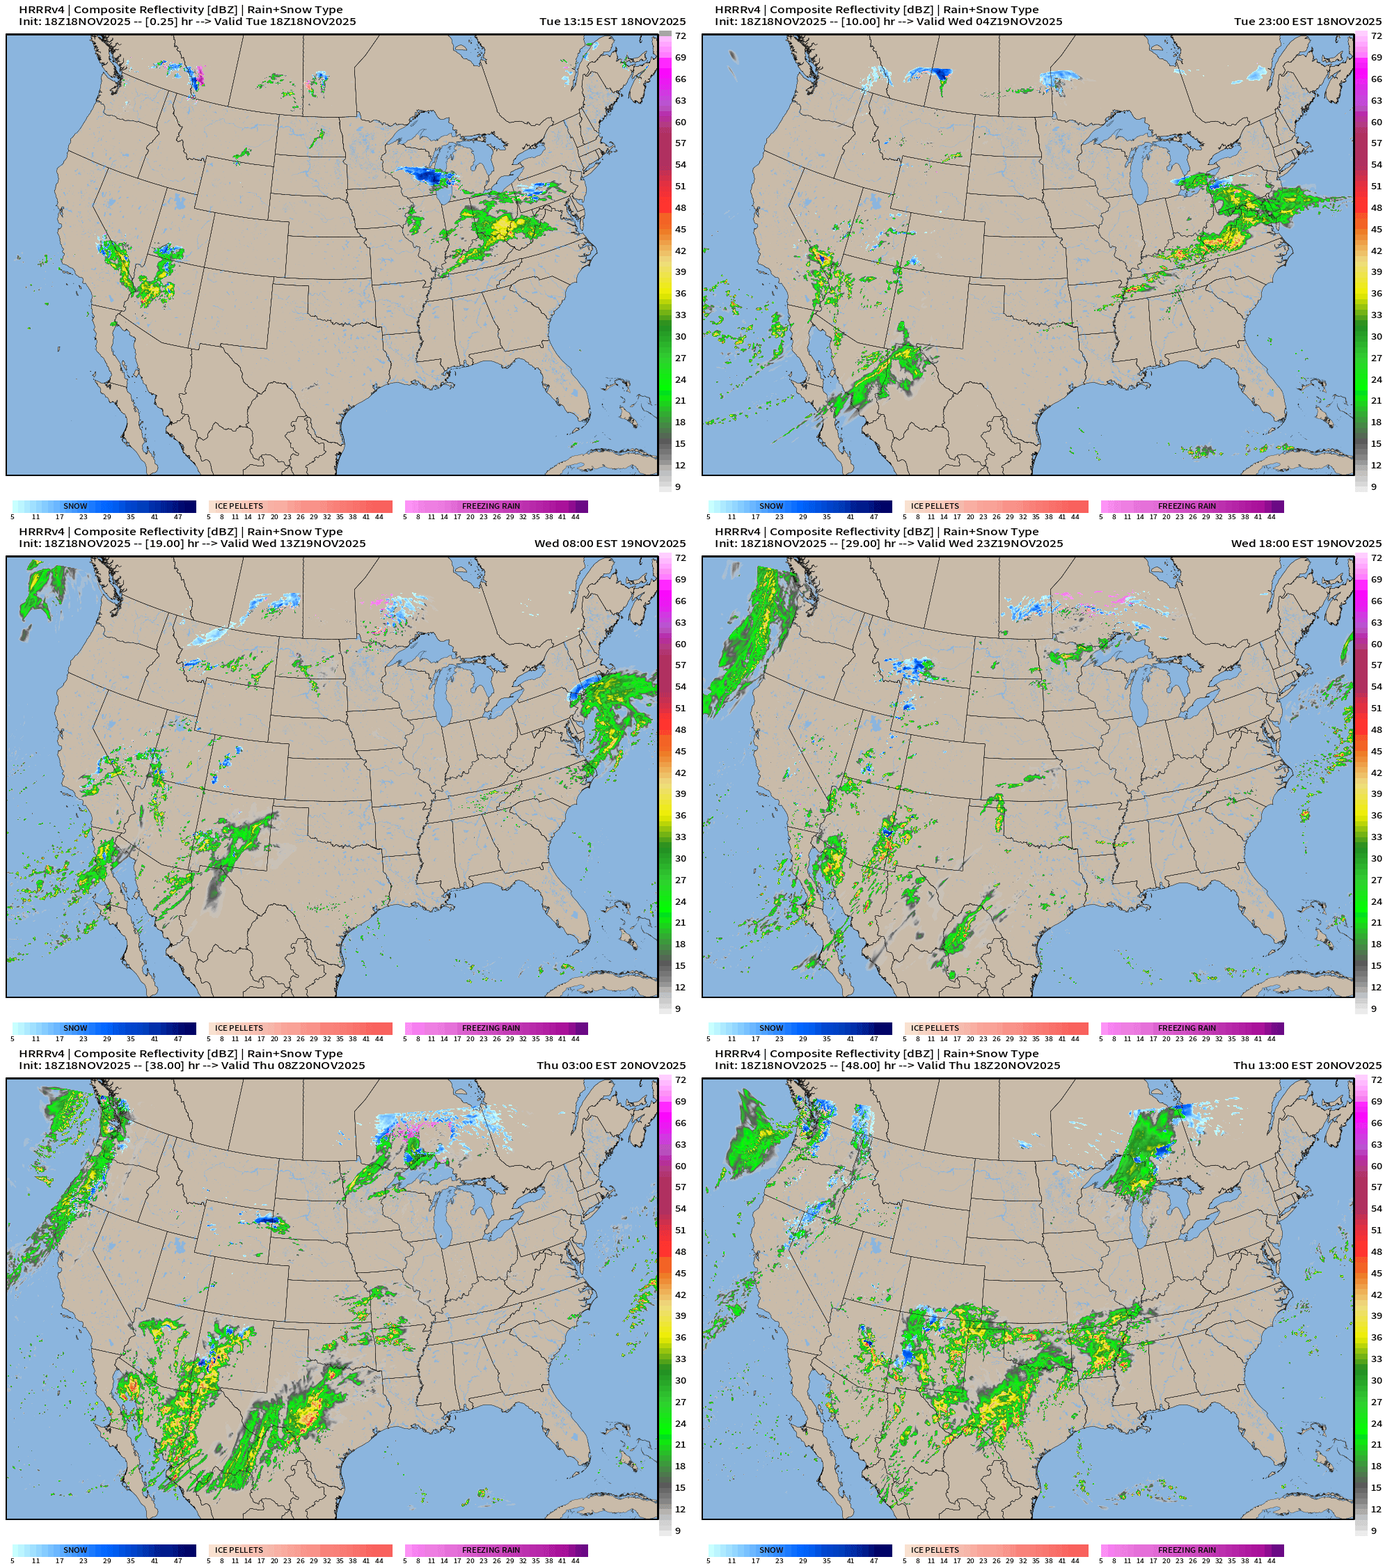
HRRR Simulated Radar | Next 48-hours | Through Thursday Afternoon
Temperature Analysis | 6:30 PM ET
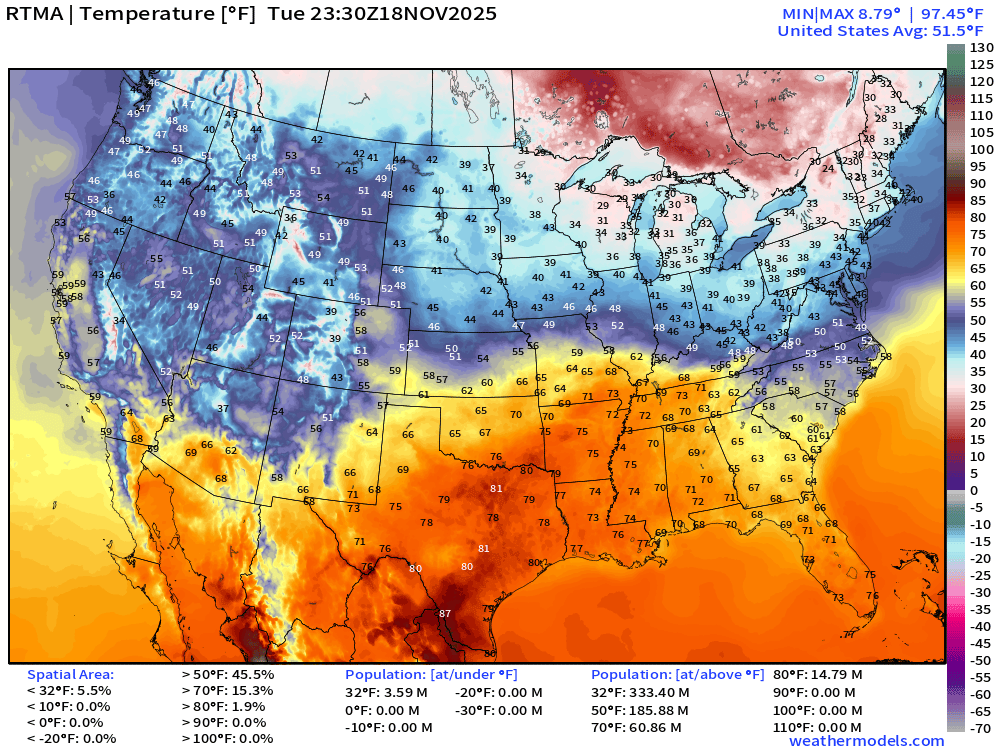
Chilly across New England and the Great Lakes … below freezing for 3.6 million population
Temperature Anomaly | 6:30 PM ET
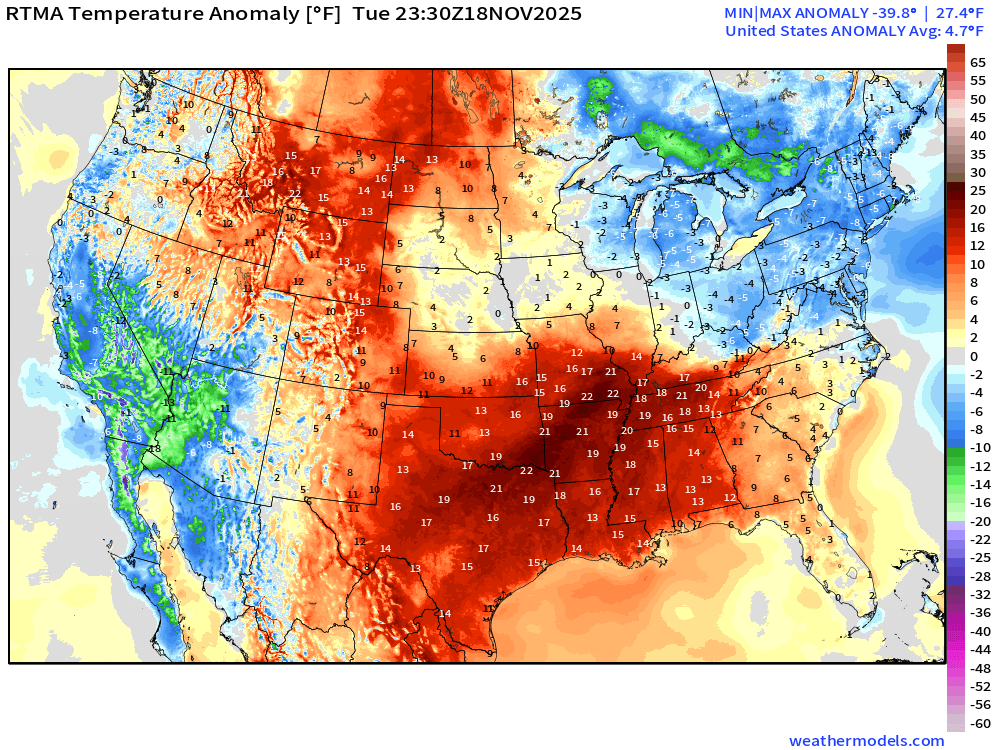
Lower 48 Temperature Anomaly was 4.7°F above normal
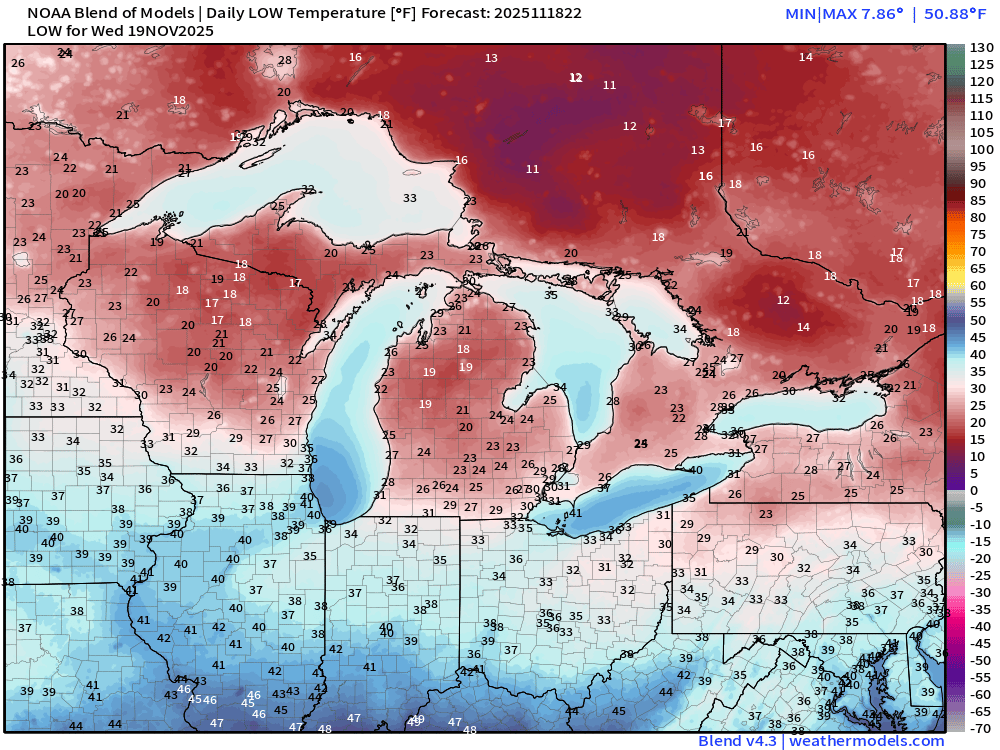
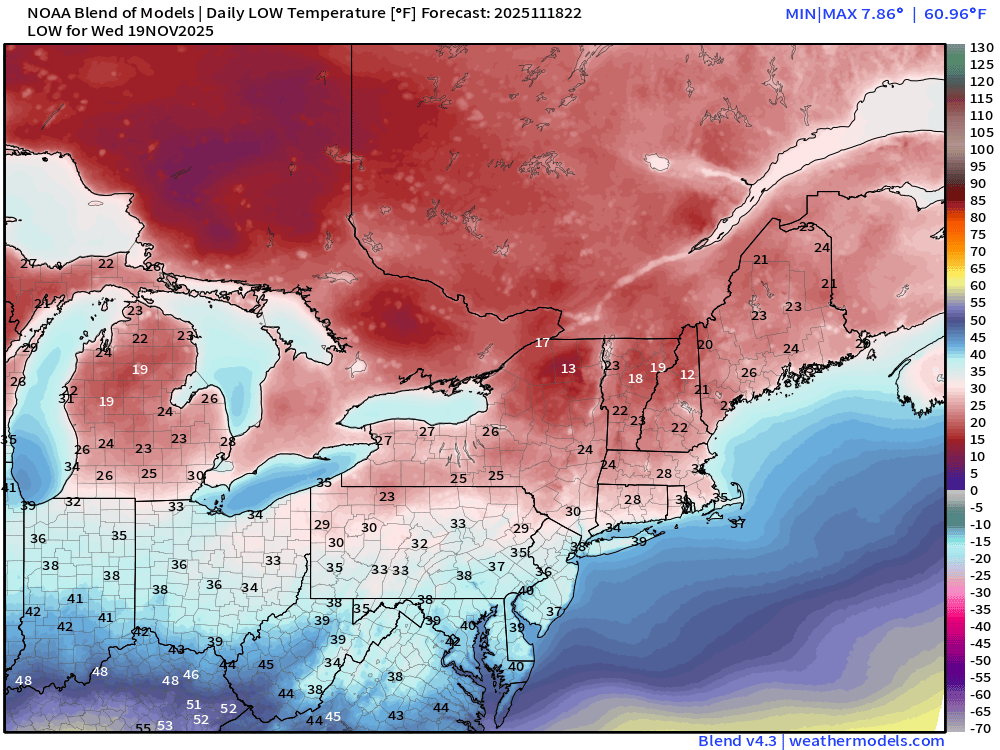
Wednesday Morning Lows
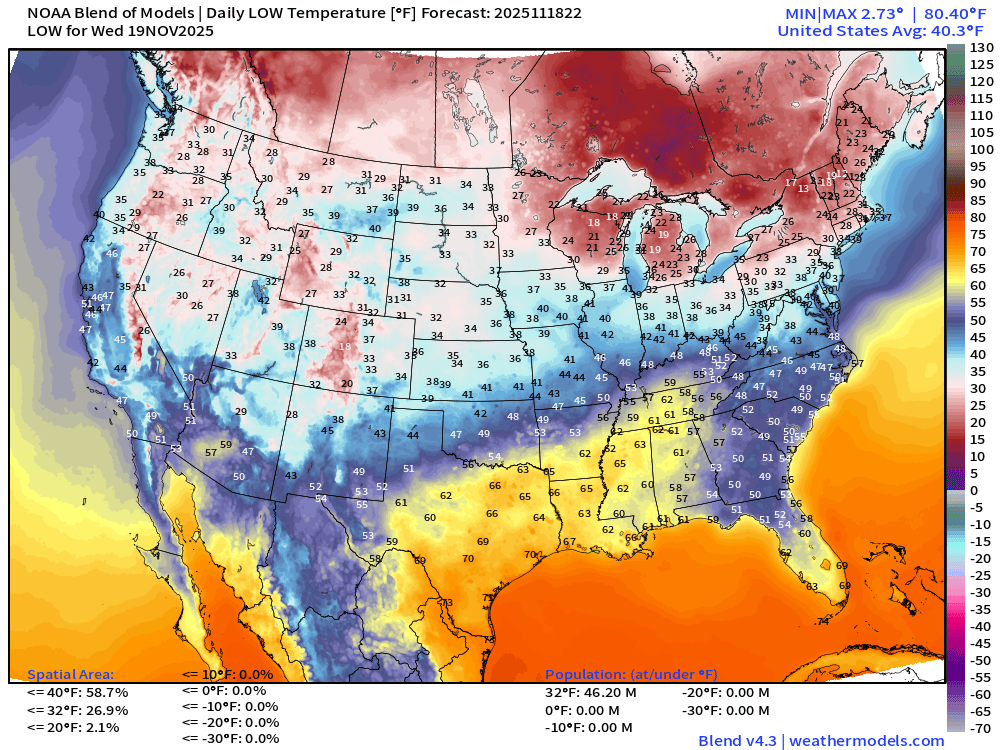
46 million below freezing: 40.3°F avg Lower 48 Low Temperature
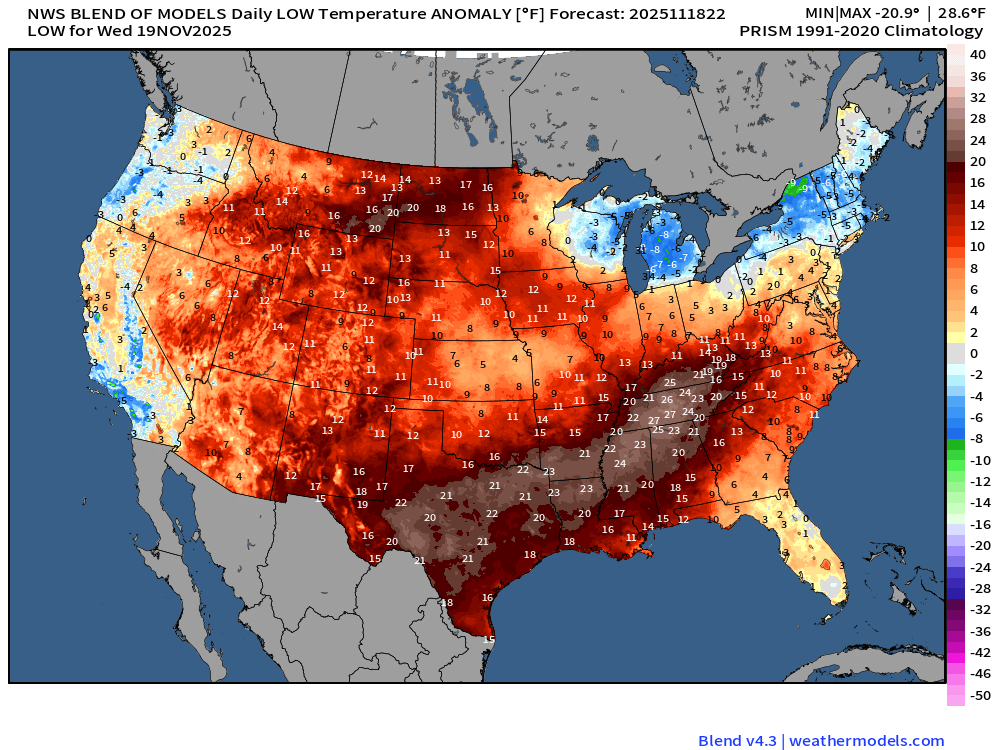
Very warm across the South — lows 25°F warmer than normal. However, rather cold across Michigan and upstate NY into VT/NH.
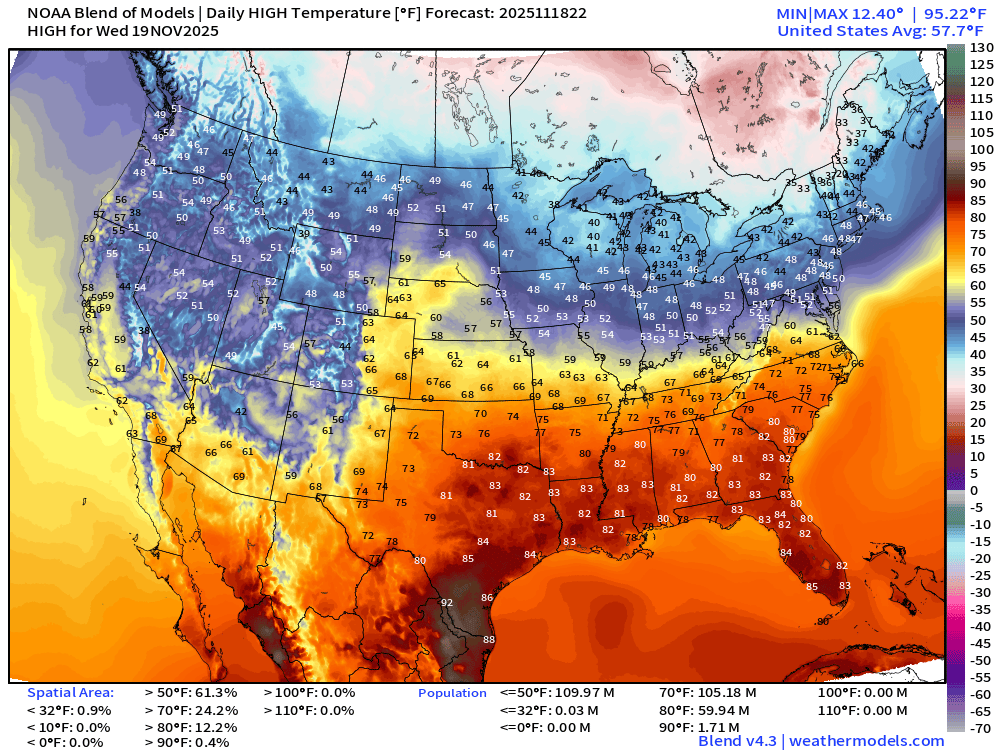
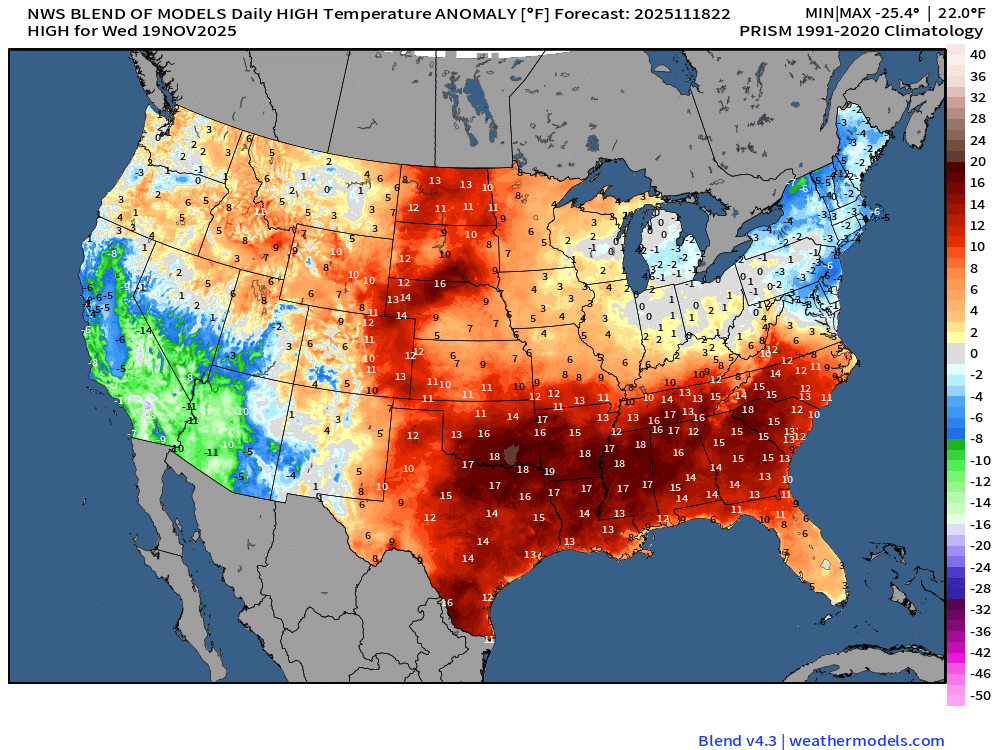
High Temperatures Wednesday + Anomaly
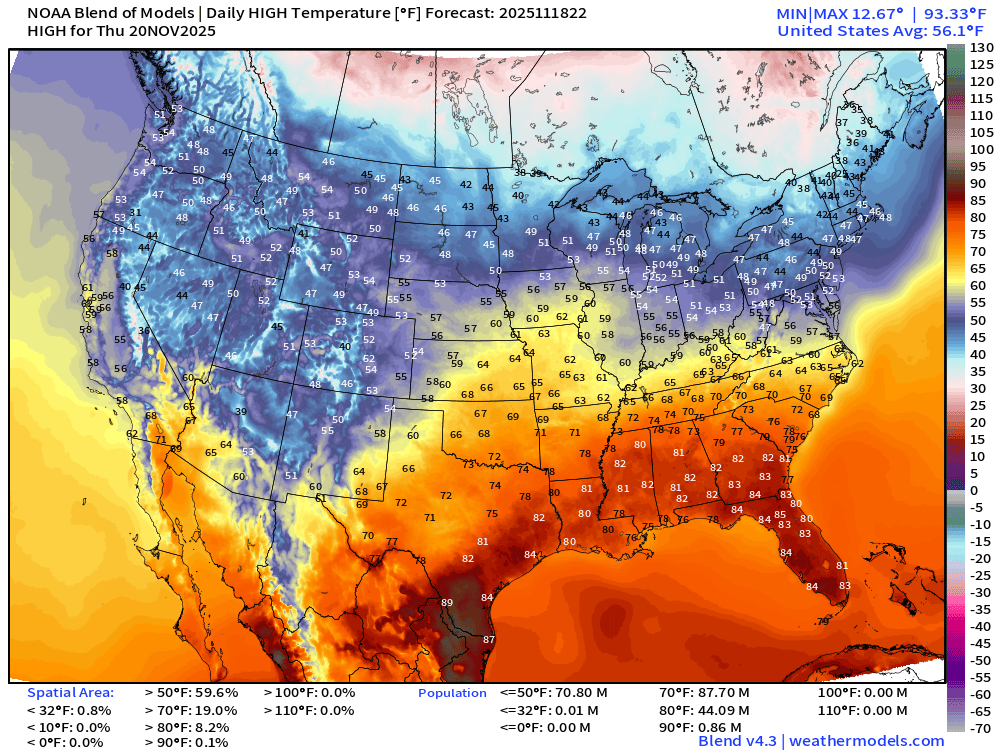
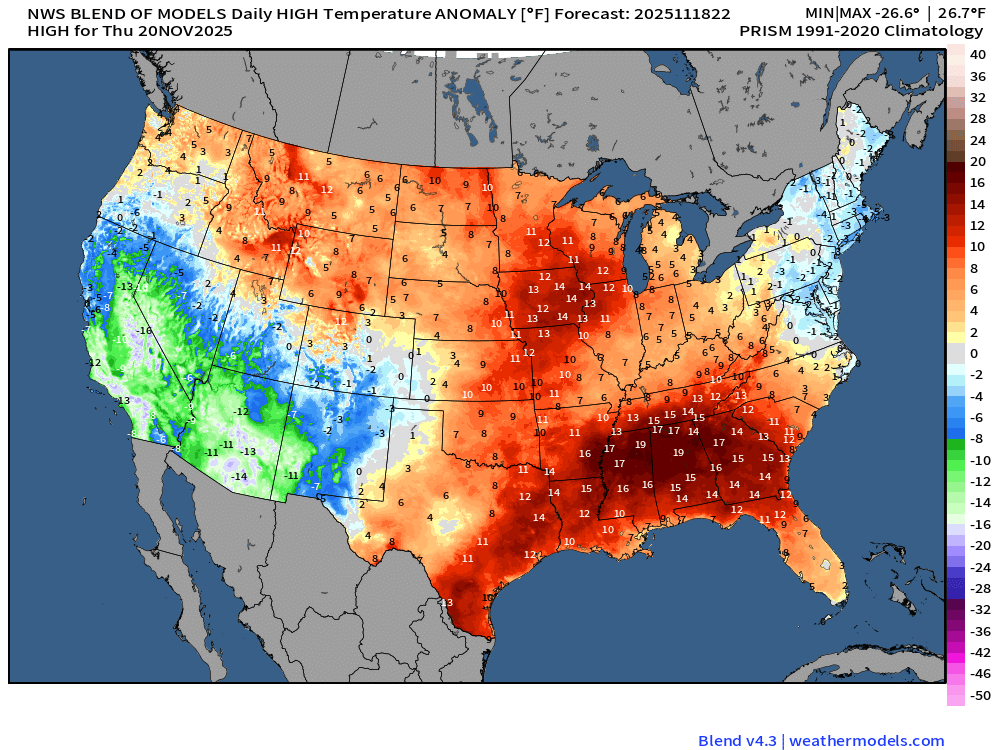
High Temperatures Thursday + Anomaly
NWS Precipitation Next 72-hours
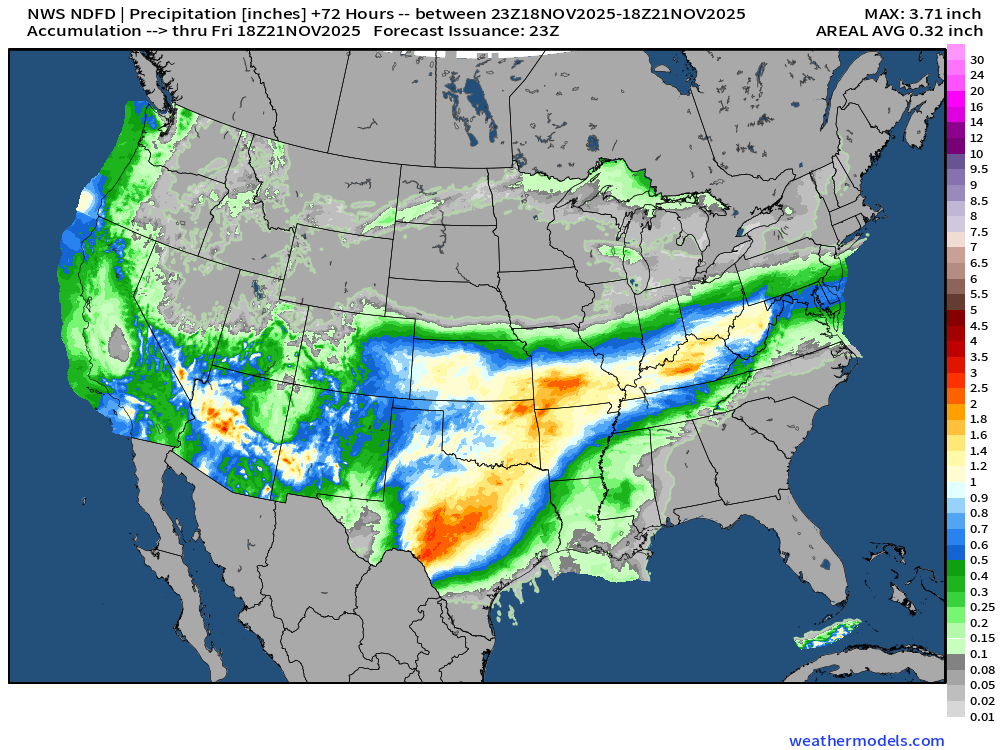
NWS Snowfall Next 72-hours
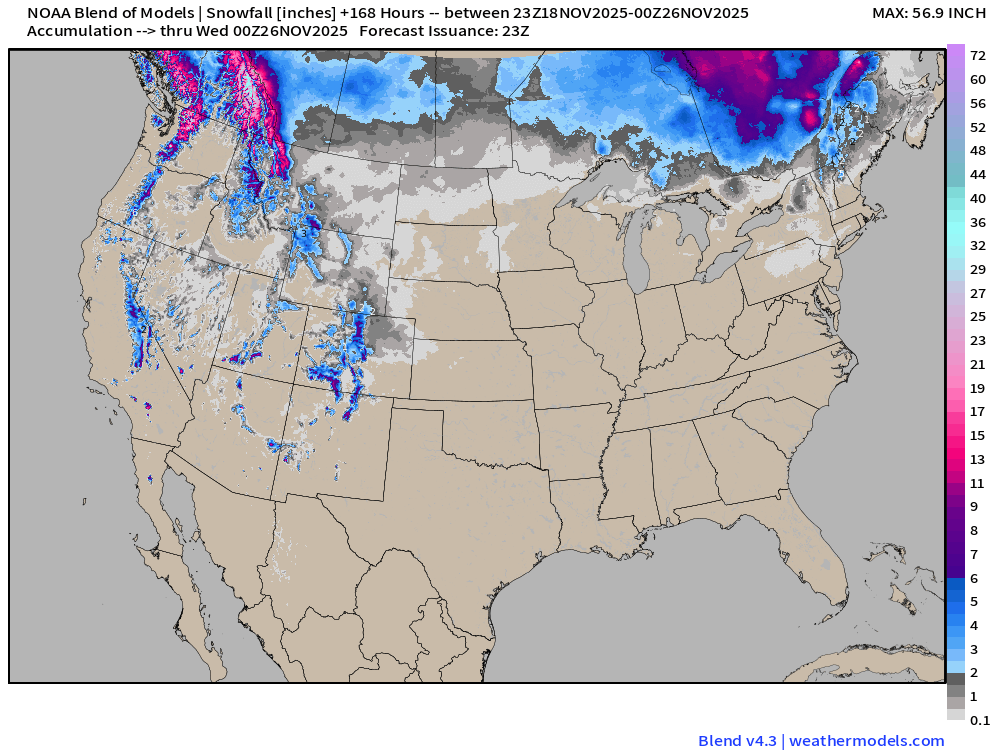
Blend of Models | 7 Days Precipitation and Snowfall Totals
Integrated Vapor Transport | Next 10-days ECMWF 12Z
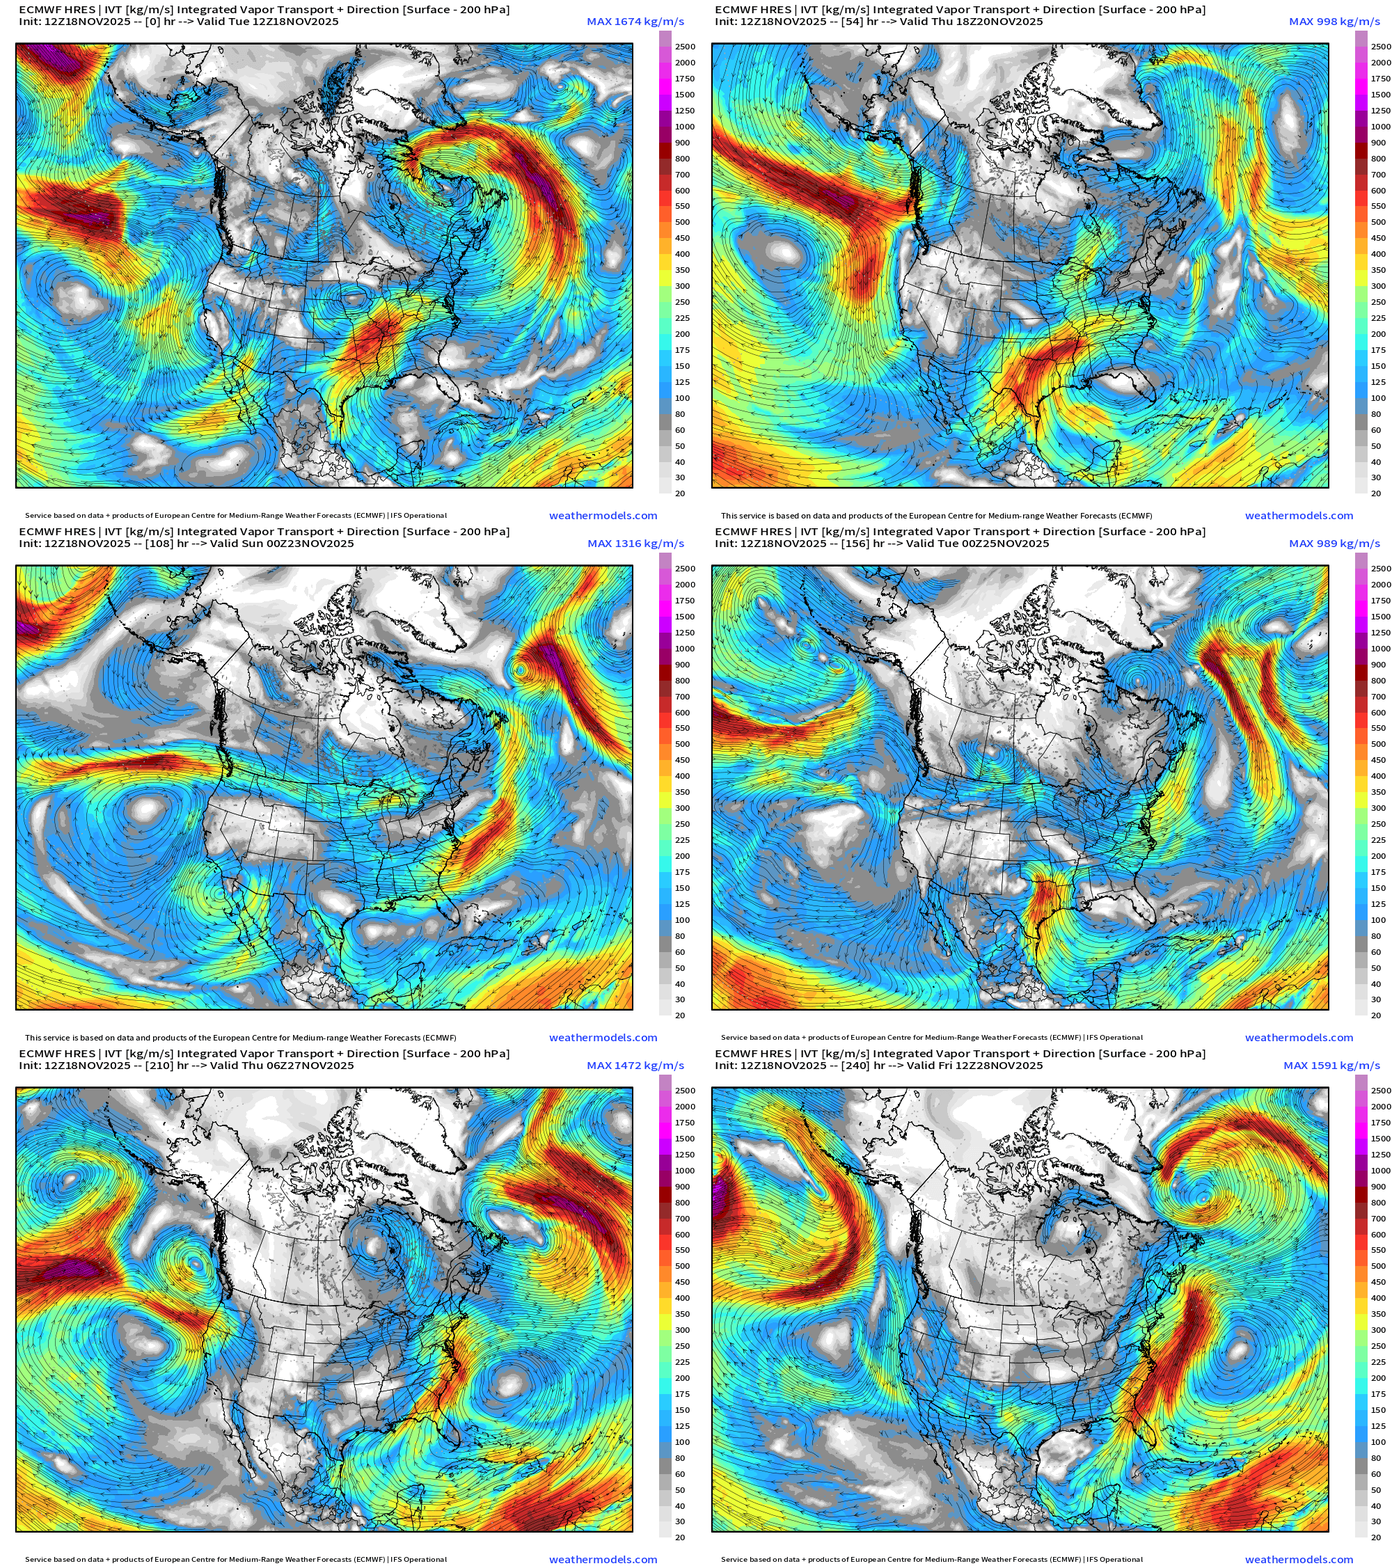
IVT highlights atmospheric rivers of moisture in the atmosphere — and we typically look at the U.S. West Coast … but also works elsewhere, including the East Coast.
ECMWF AIFS 12z | Height Anomaly (500 hPa) Next 10-days
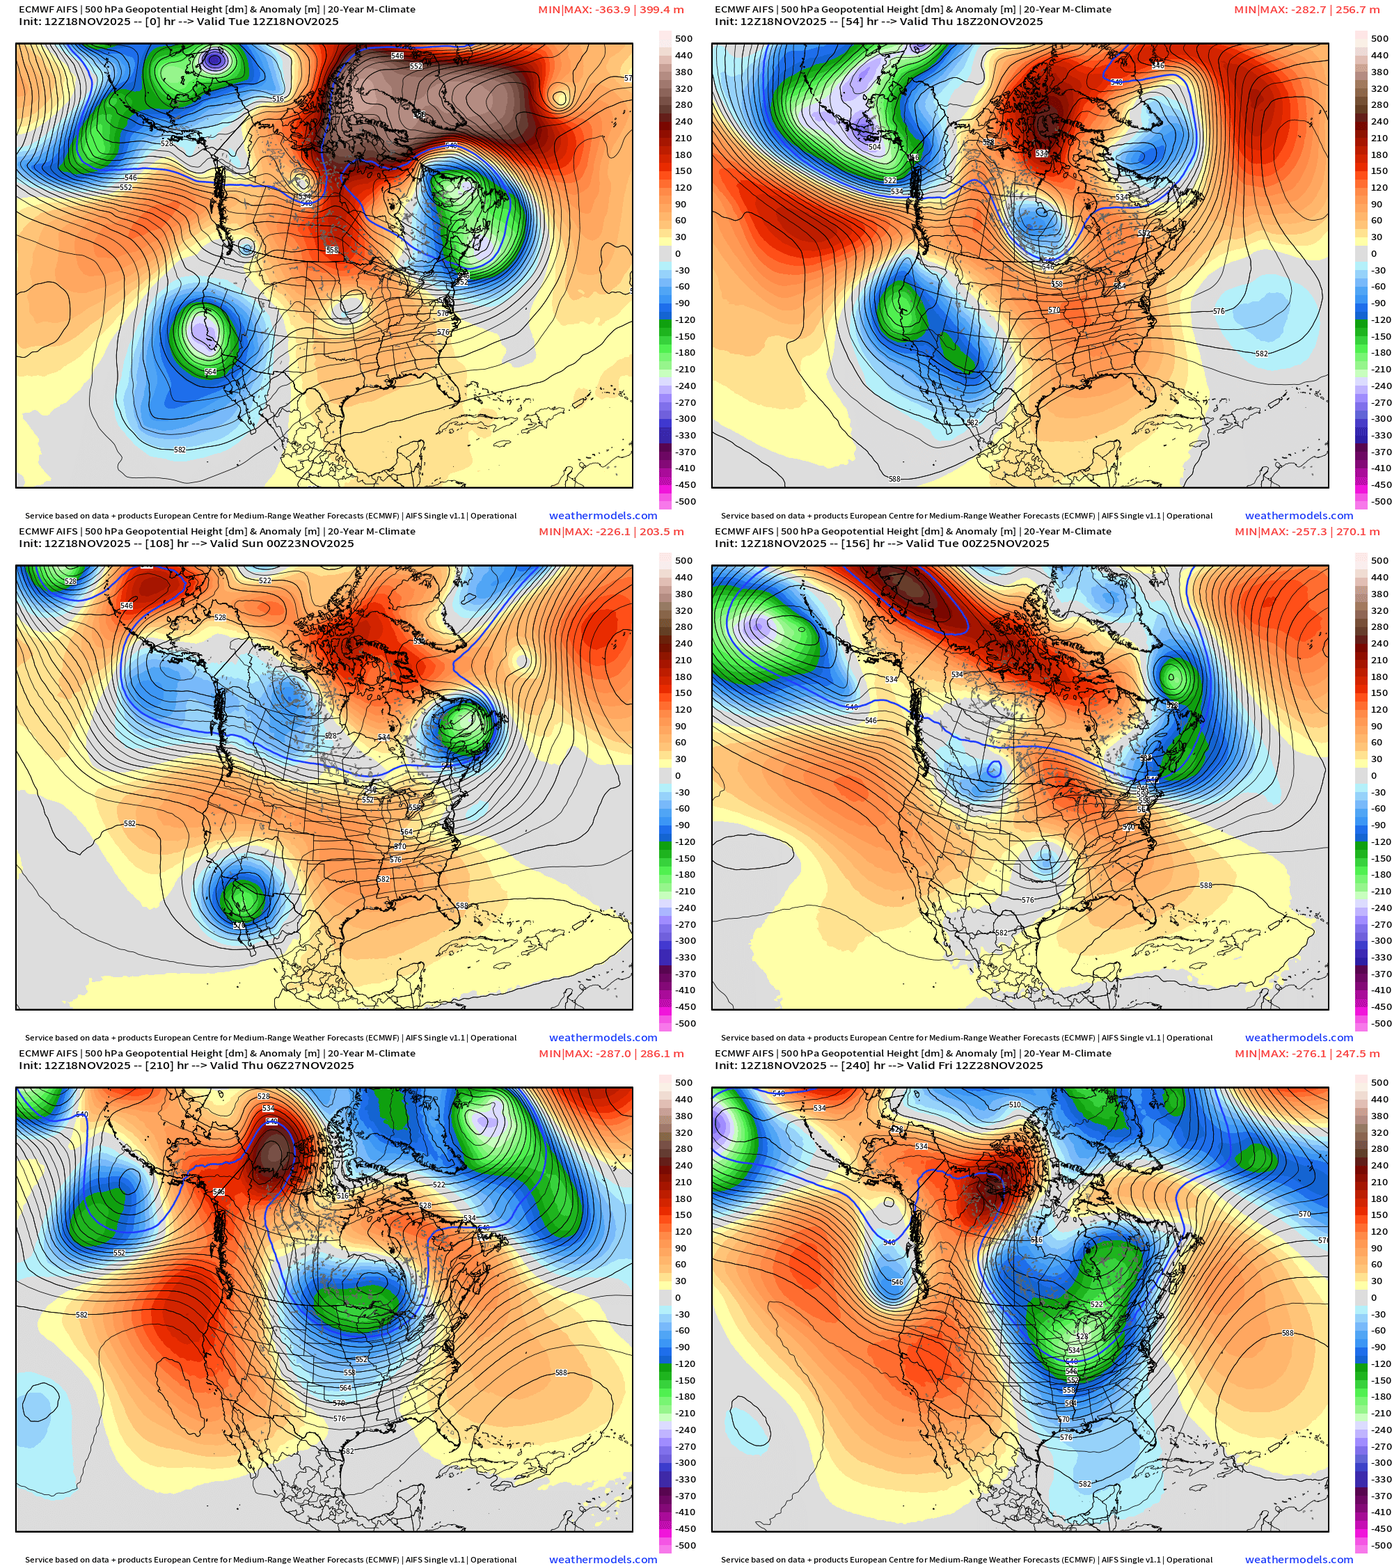
The cut-offs along the West Coast are repetitive — and as they slide eastward through the Southwest into Texas — provide cyclonic flow to bring up warmer, moister air out of the Gulf of Mexico.
Similar to AI-GFS and AI-GEFS, we see a strong Midwest Trough formation into Thanksgiving.
ECMWF 18z | Snowfall | Next 6-days
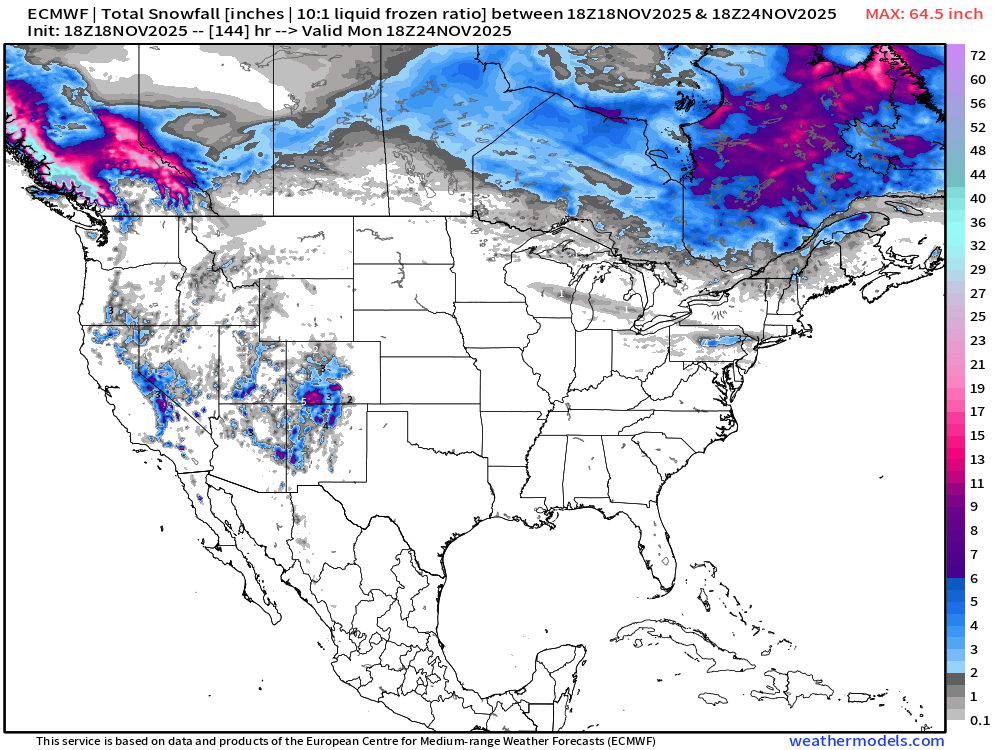
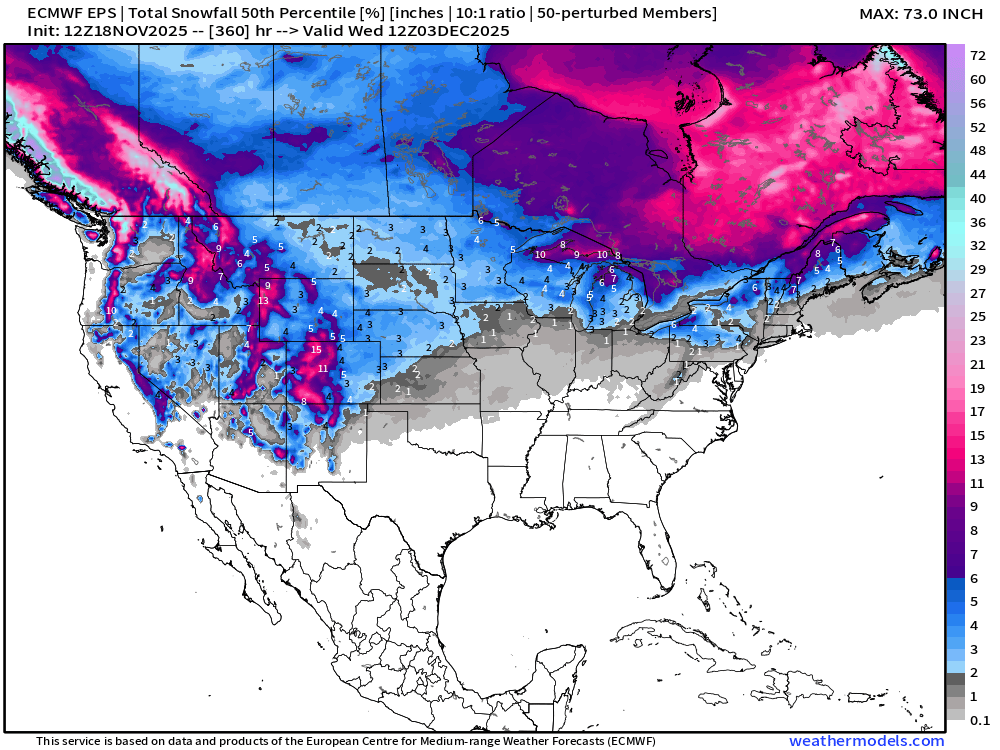
ECMWF EPS 12z | Ensemble Median Snowfall Next 15-days
ECMWF EPS 12z | Ensemble Snowfall Probability > 1” | Next 15-days
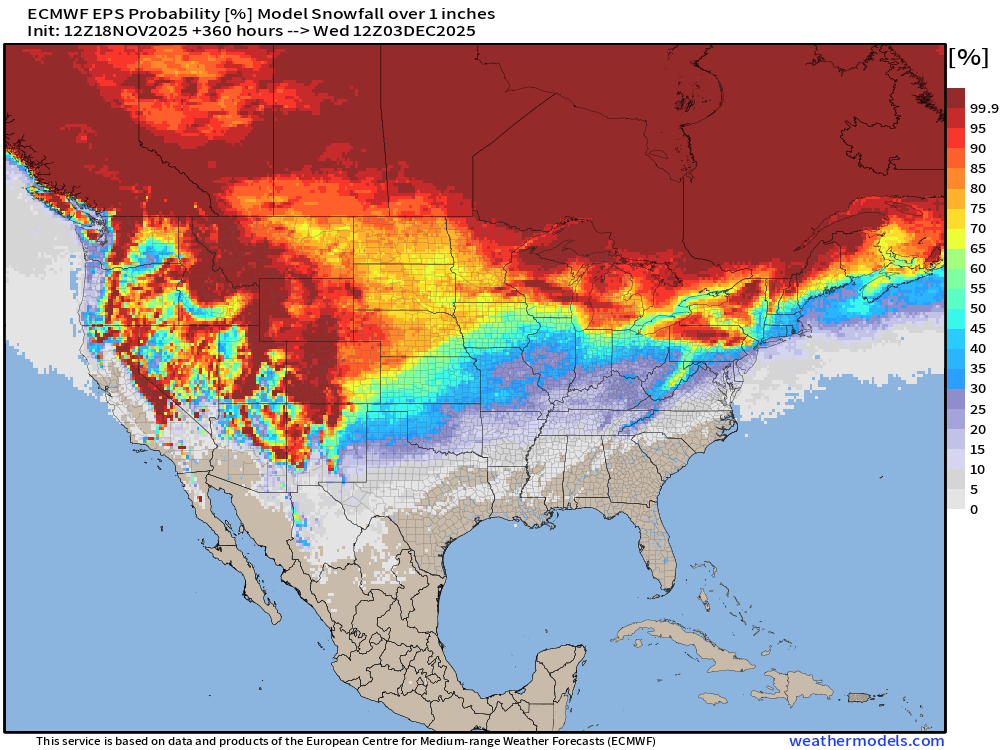
Total for the next 15-days from the flagship ECMWF ensemble model shows nationwide snowfall but still lacking a major East Coast Nor’easter
ECMWF EPS 12z | Ensemble Snowfall Probability > 3” | Next 15-days
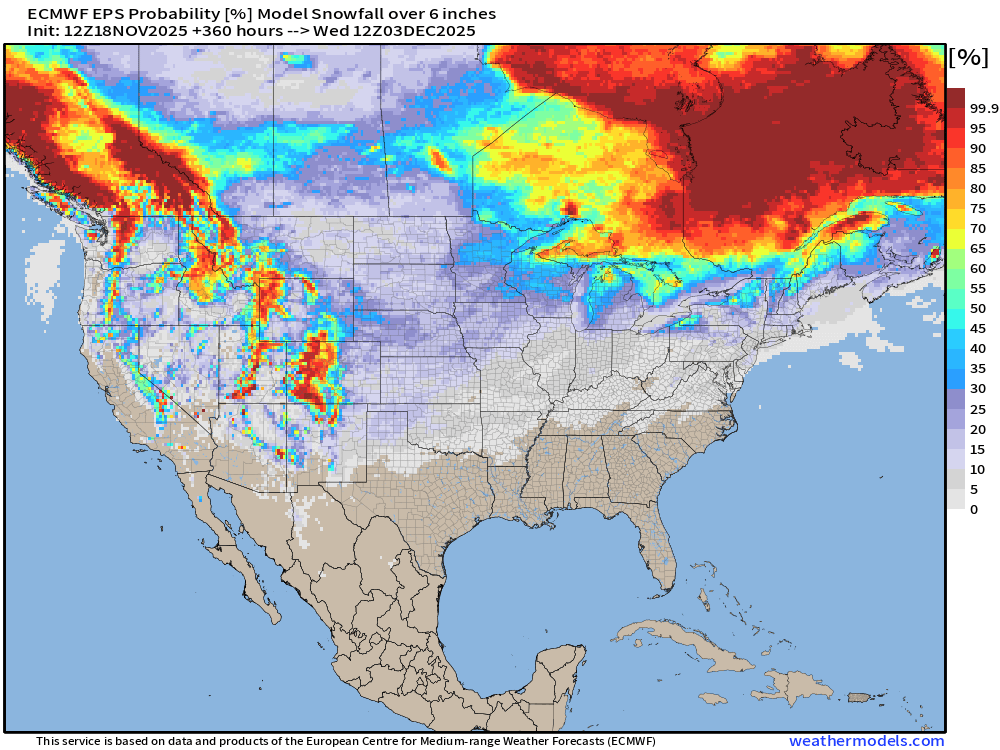
5-Day Chunk #1 | Temperature Anomaly | Nov 18 - Nov 22
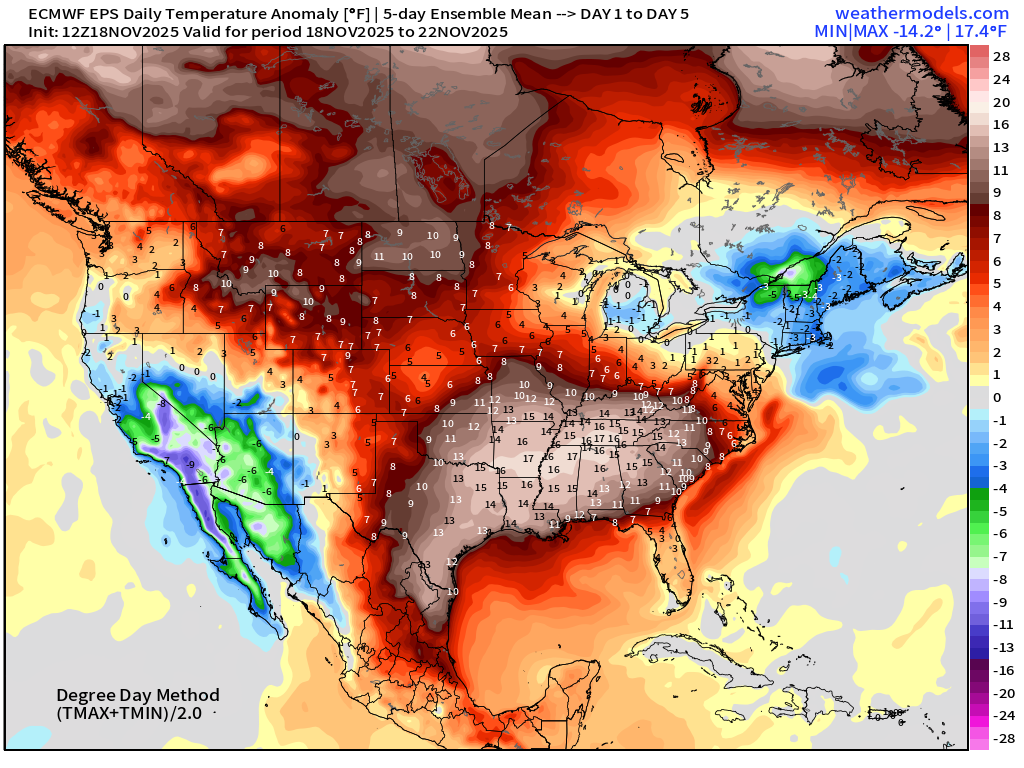
5-Day Chunk #2 | Temperature Anomaly | Nov 23 - Nov 27
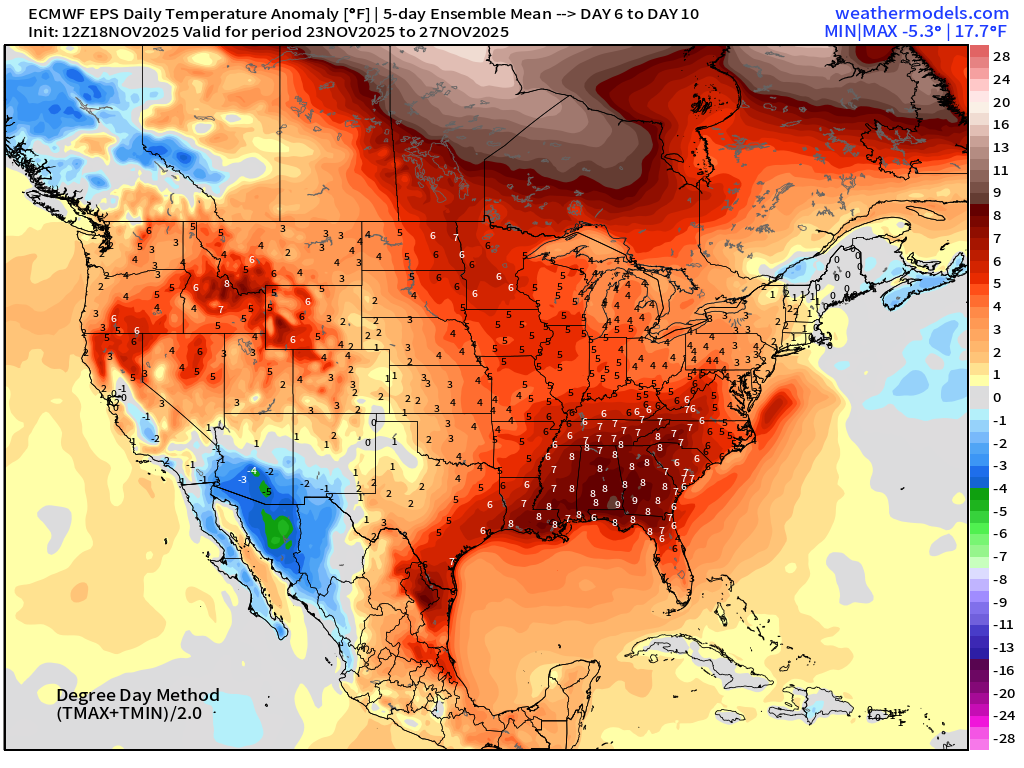
5-Day Chunk #3 | Temperature Anomaly | Nov 28 - Dec 2
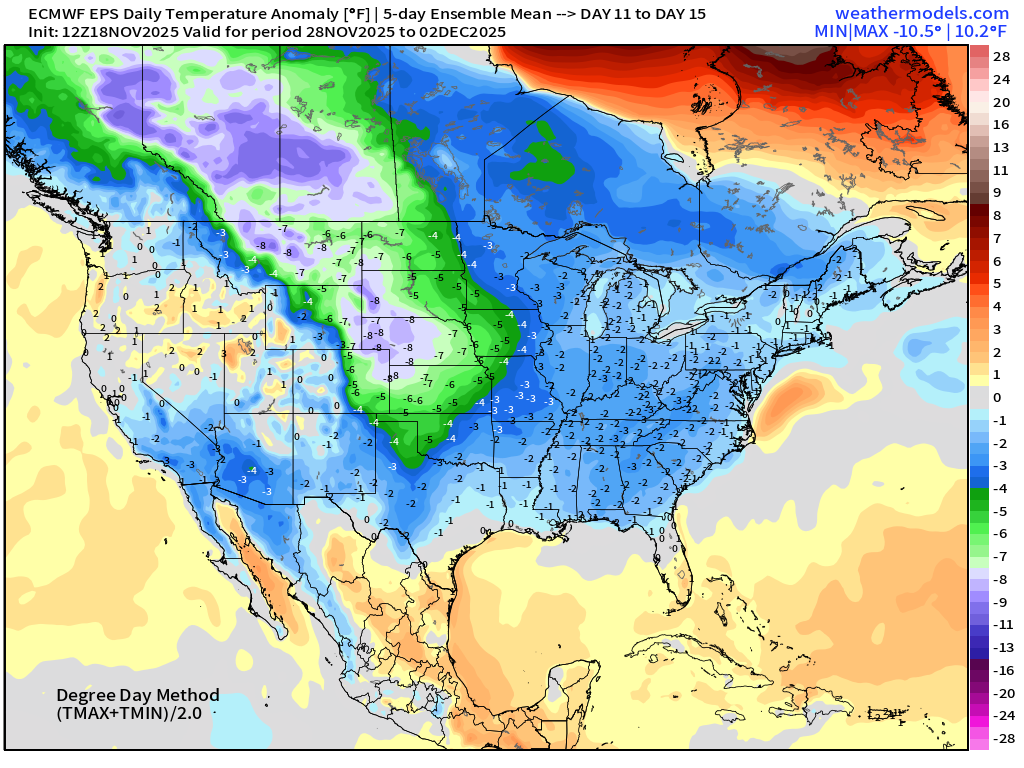
Cold really loading up in Canada into the Northern Rockies by Days 11-15 — and now coast-to-coast
Atlantic Hurricane Season Statistics | November 18, 2025
Declaring victory with my 2025 Atlantic Hurricane Season Forecast.
I predicted the long-term average —> winner, winner.
Nothing brewing in the next 7-days —> November 20th according to NHC. Not seeing anything in the ensembles through Nov 26th — high likelihood that the 2025 season is complete, ending with Melissa.
2025 Hurricane Season [Day 171]. My FORECAST for this year was 14 named storms, 7 hurricanes, and 3 major hurricanes (near average)
2025 Season to Date: 13 Named Storms, 5 Hurricanes, and 4 Majors, and 3 Category 5’s | Accumulated Cyclone Energy (ACE) = 135.5
Atlantic Basin | IR Satellite
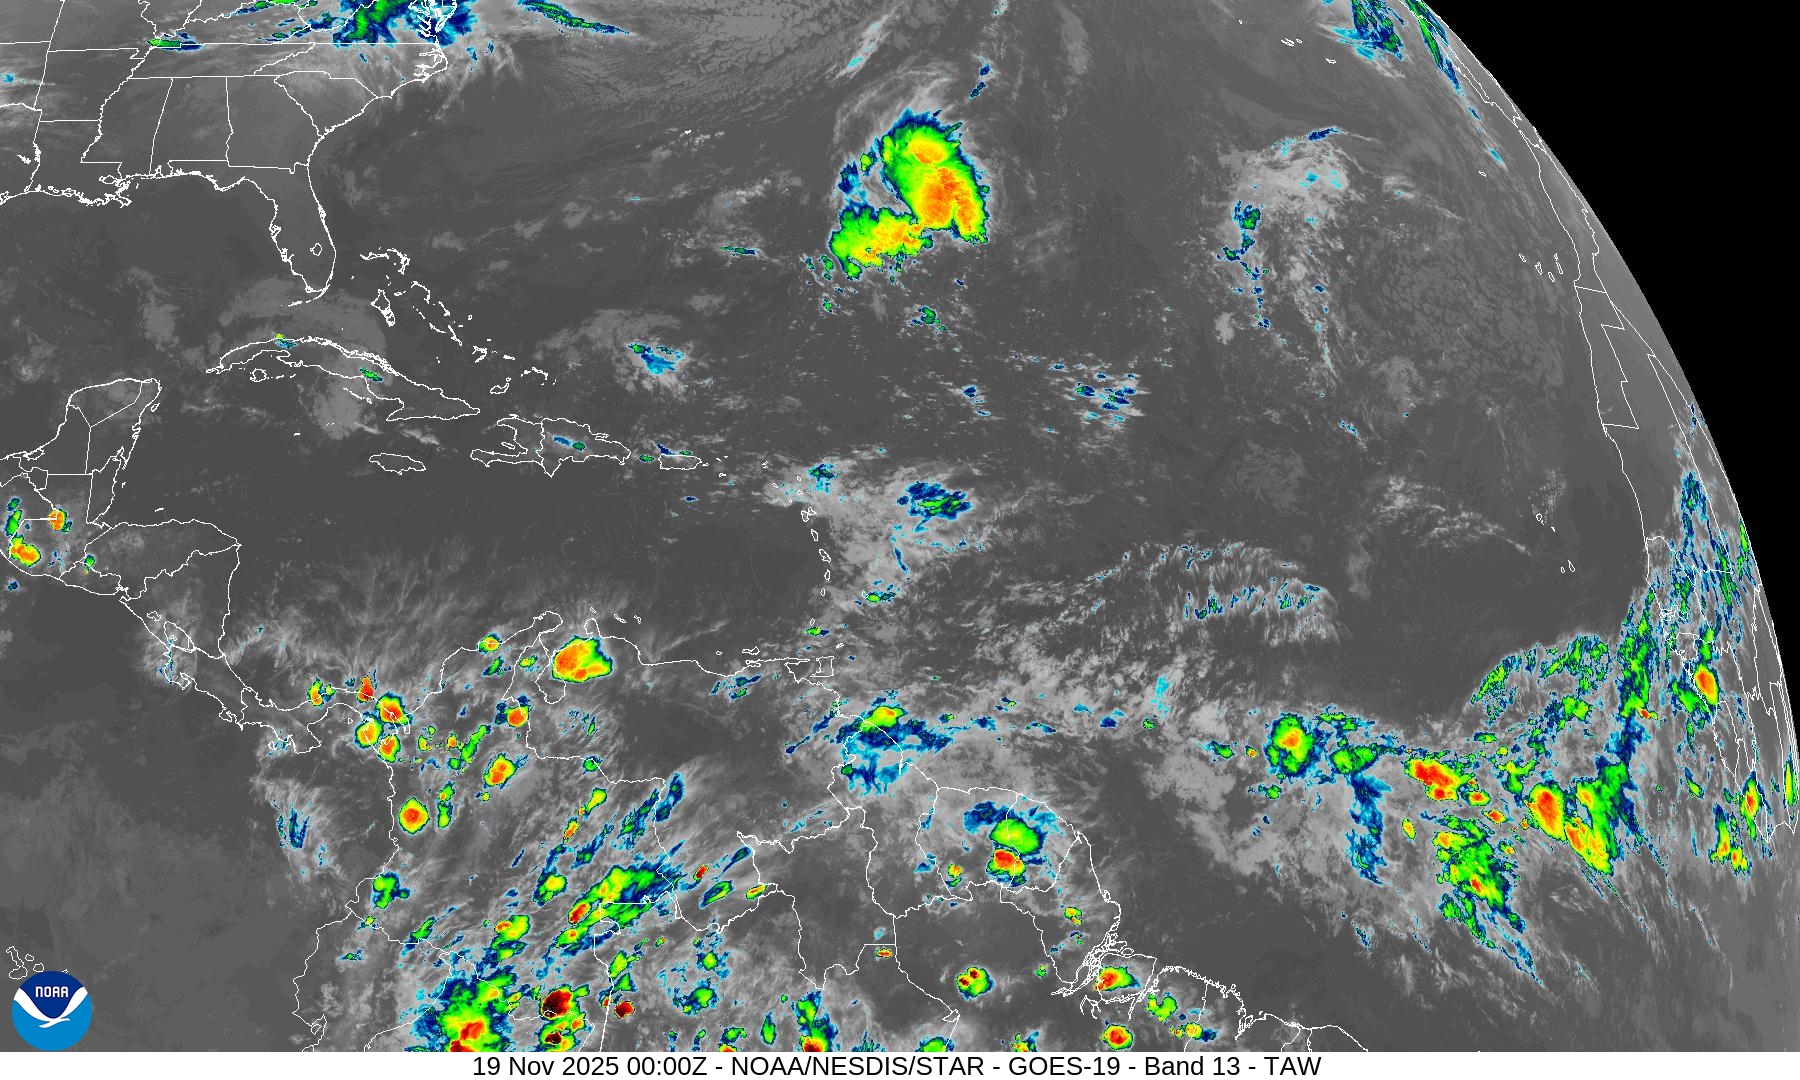
All tracks thru 15-days: December 3nd — end of the road —> QUIET
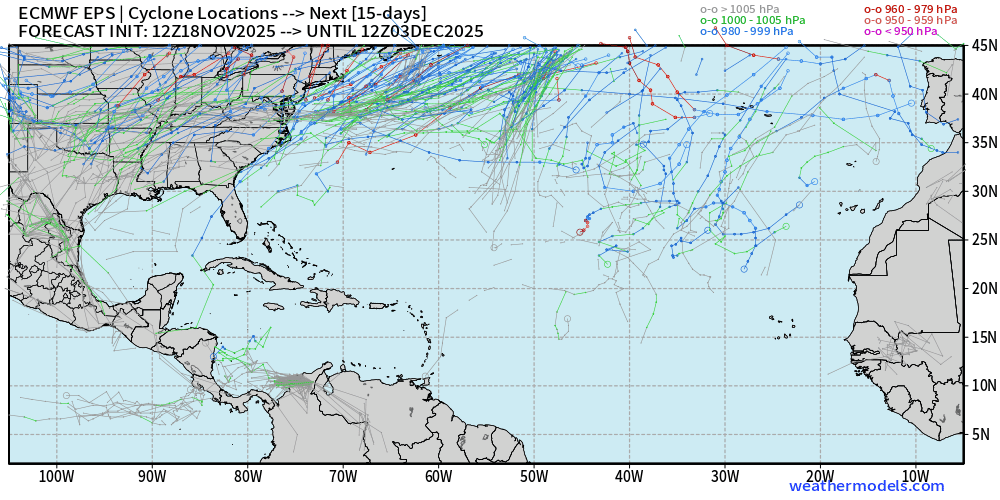
Nothing [much] brewing in the 2-week ensemble tracking —> a few members showing a weak low pressure system in the southern Caribbean, where we would look for very late season activity.
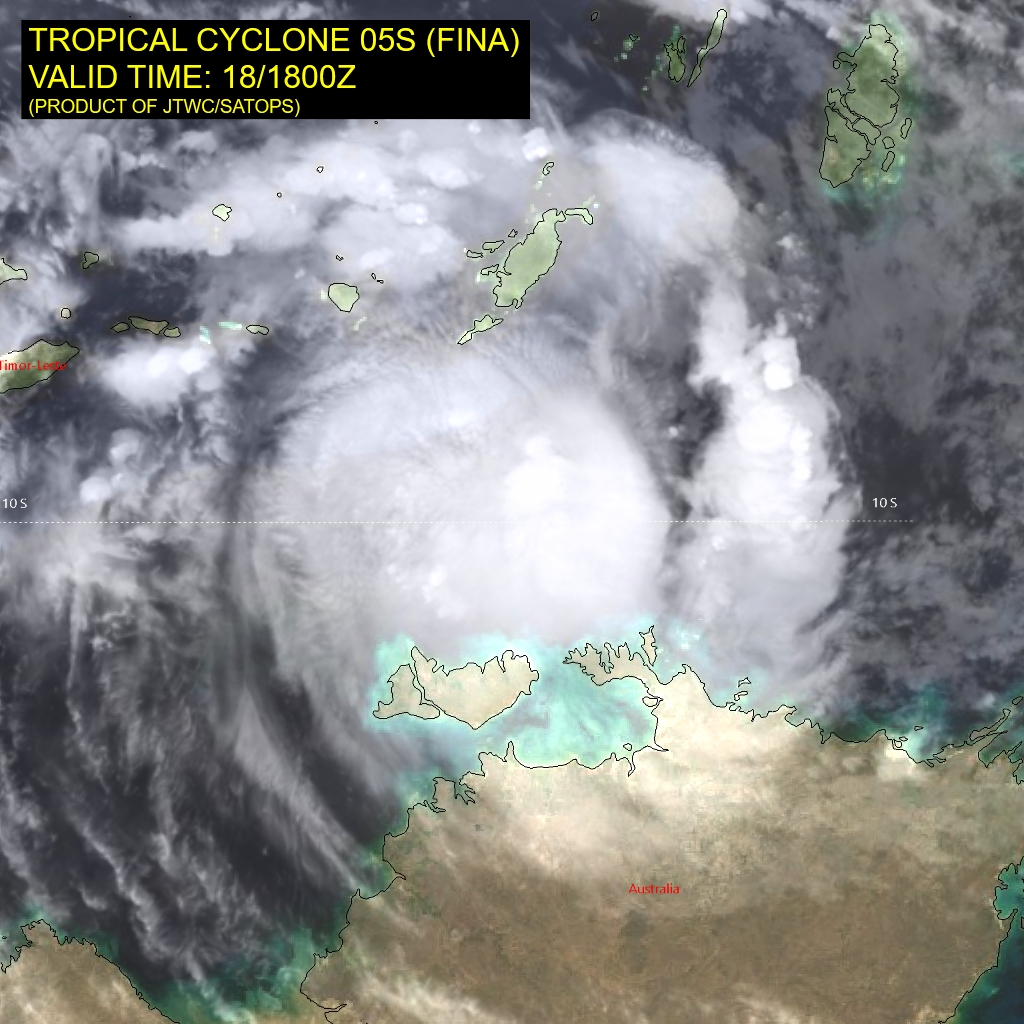
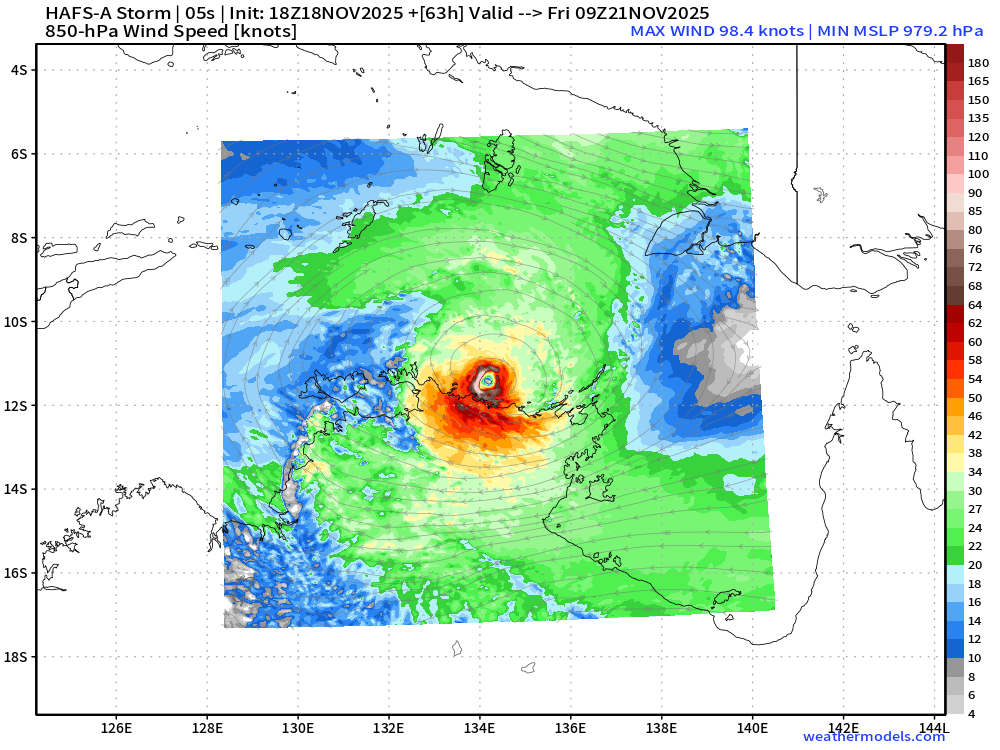
Australia | Tropical Storm Fina (05S) NNE of Darwin
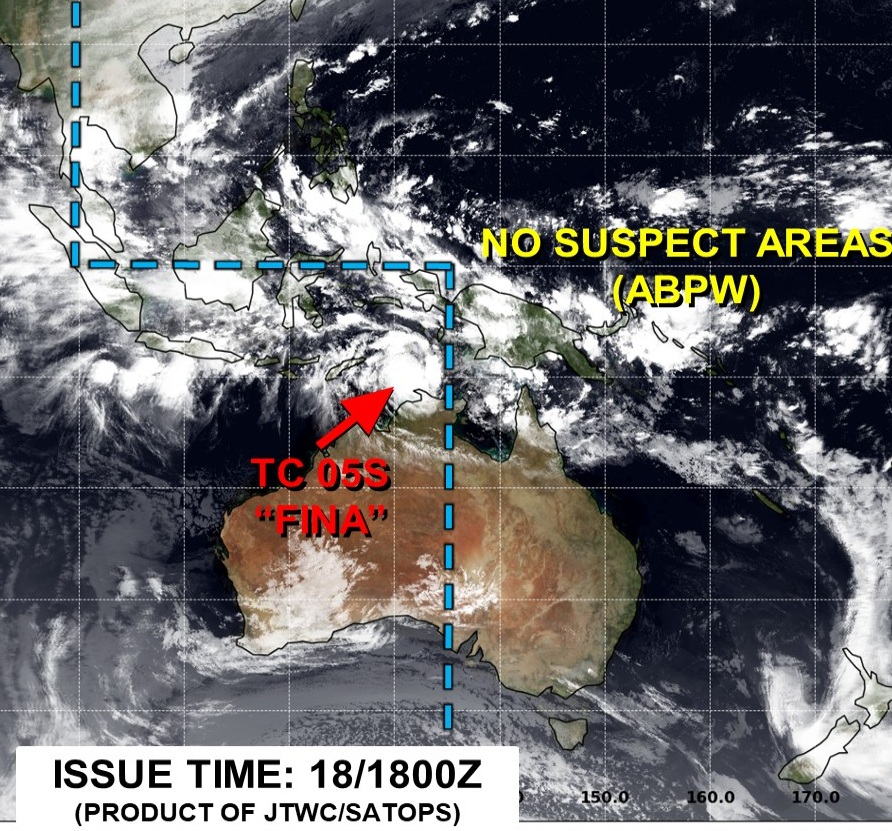
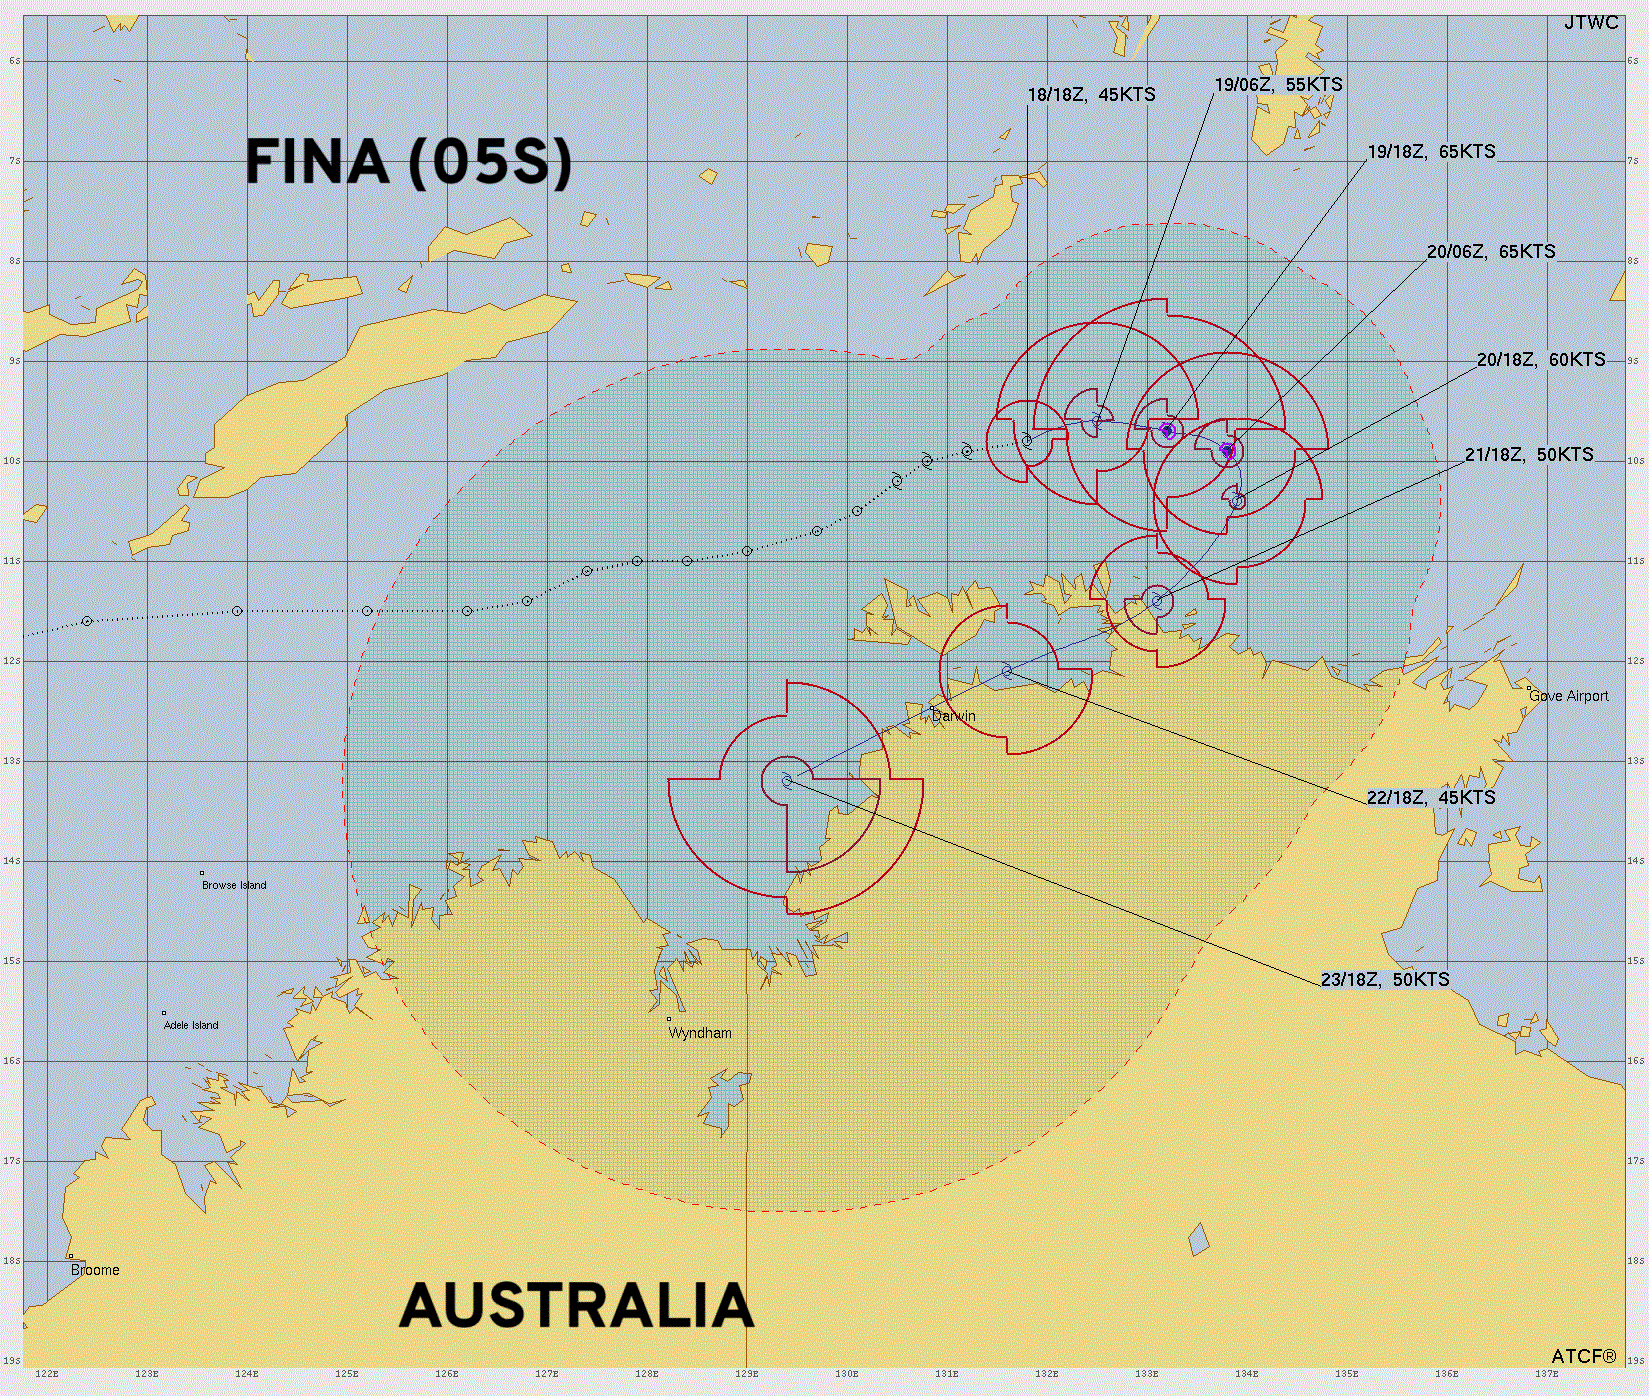
HAFS-A shows 979 mb with a small inner-core prior to landfall … Cat 1-2 hurricane intensity equivalent.
Maps sourced from weathermodels.com designed and innovated by yours truly! Please subscribe there for real-time access to the newest maps, charts from all of the weather models including ECMWF.
- Milepost
- 792 · laid 2025-11-19T01:30:09.457000Z
- Source
- https://weather.substack.com/p/november-18-2025-tuesday-winter-weather
- Digest
- 0f01fe1214e42803f098e8aea2dd470a6bff1880f3375a11c83d362bbfeef80e
- Machine
- JSON