January 16, 2025 Thursday Evening Update
Yes, this is the Polar Vortex.
January 2025 was the 33rd-coolest January in the 132-year national record (1895–2026), at 29.2°F against a 1991–2020 normal of 32.3°F (-3.2°F).
January 2025 was the 5th-driest January in the 132-year national record (1895–2026), at 1.4in against a 1991–2020 normal of 2.3in (-1.0in).
NOAA/NCEI Climate at a Glance, contiguous United States. This is the observed record for the month, not a score of anything said in this piece — the forecast ledger begins 2026-08-17 and cannot reach earlier posts.

Good Evening!
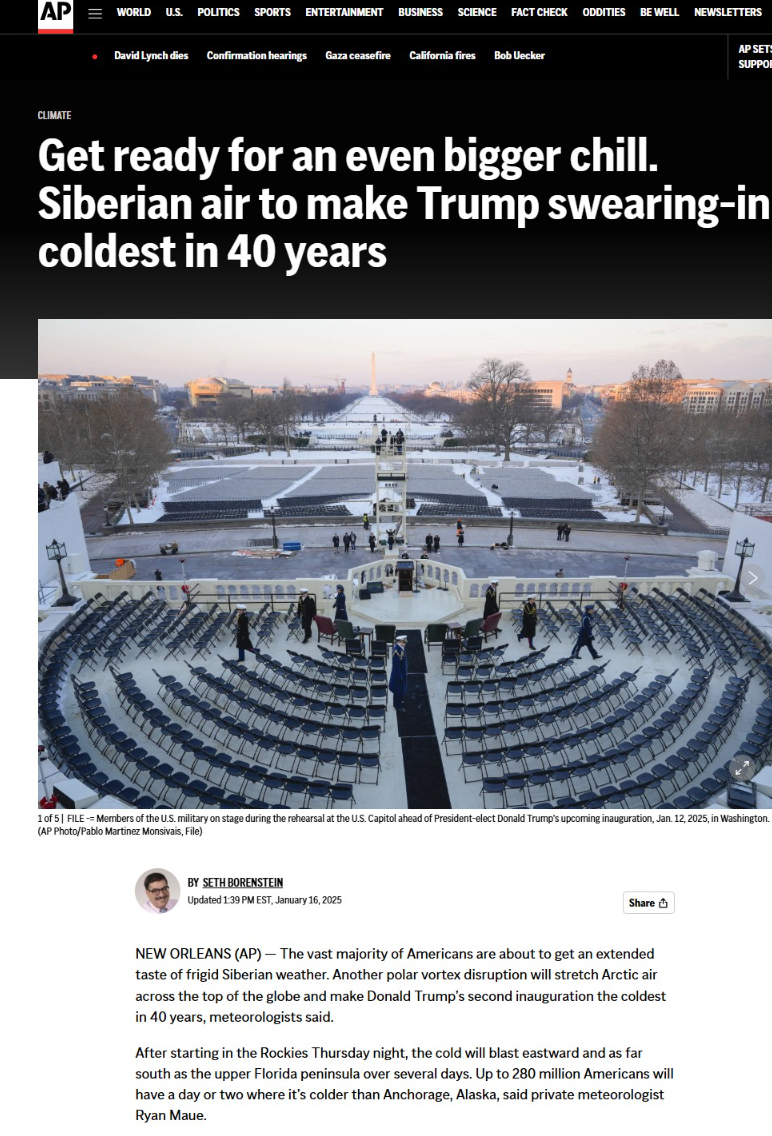
I’m quoted in the AP News on the upcoming Polar Vortex episode.
Now more than 11-years since we helped popularize the “polar vortex” term in the national discourse in January 2014. And, it looks like this next week will see a couple mornings very close to the coldest day then.
My goal is to be informational but also quotable meaning some unique tidbit or trivia that contextualizes the extreme event usually historically or something like “trillions of gallons” of precipitation.
Is this the Polar Vortex or Not?
Prior to January 2014 and the viral usage of polar vortex in the news and social media, the term would have most likely referred to the stratospheric PV only observed in the winter. It is usually very smooth and consists of long-wavelength features with minimal synoptic activity. This is opposite to the omnipresent year-round tropospheric circumpolar vortex, which consists of the wave patterns we see at mid-levels to the jet stream or tropopause.
The extrusions or lobes of the polar vortex winter ebb and flow to lower latitudes and bring extremely cold polar air to the middle or even subtropical latitudes. These synoptic waves are energized by baroclinic instability due to the temperature gradient between the equator and poles providing all the exciting weather we talk about everyday.
So are we being hit by the polar vortex? Yes — scientifically and now colloquially.
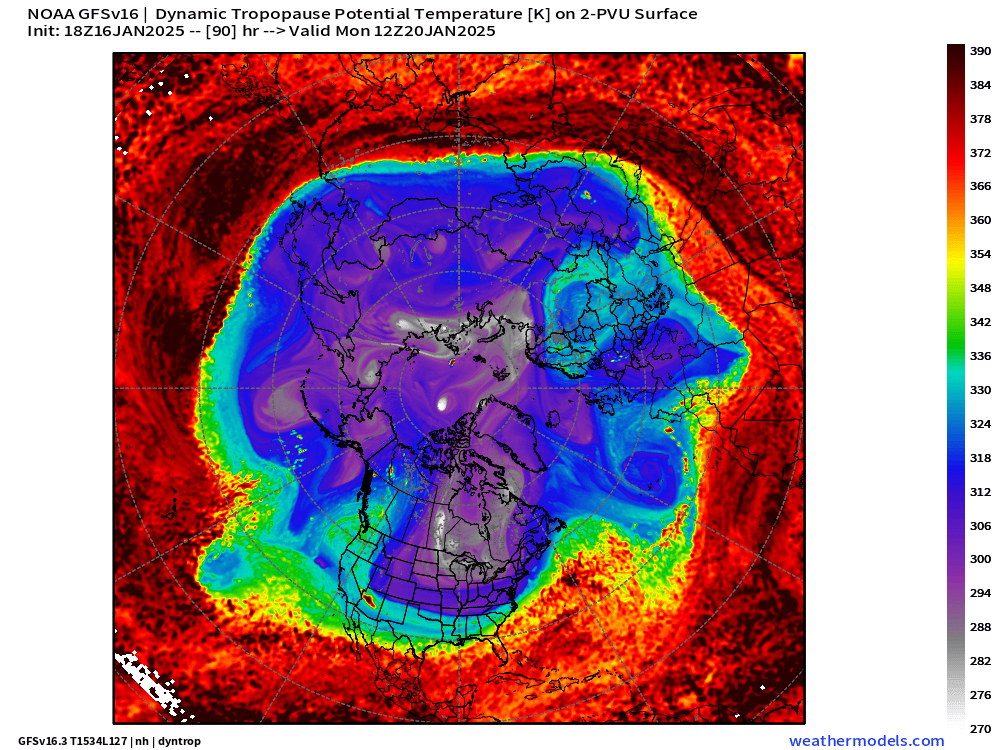
The PV in the troposphere is loosely defined as the 315K to 320K potential temperature level on the dynamic tropopause (2 PVU surface) with fine details quite apparent in this parameter: the little white fuzzballs that correspond to extreme thickness anomalies and coldest air near the surface.
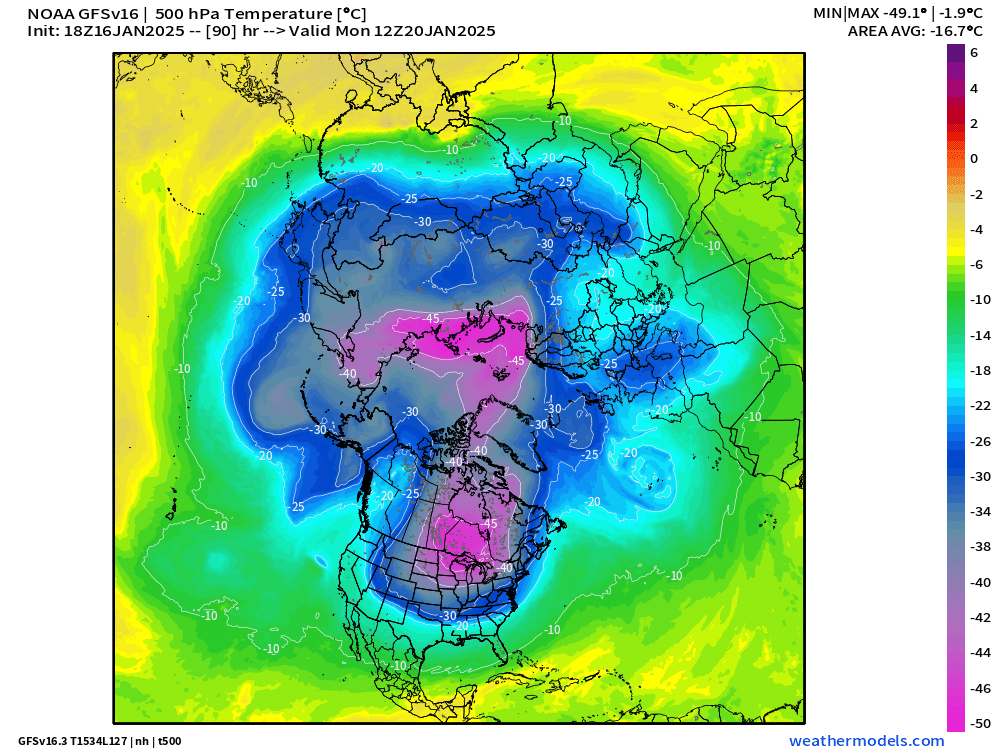
Or, in January, I’d use the -25°C isotherm on the 500 hPa pressure level.
The Polar Vortex allows cold air to traverse the pole though the Great Circle route and transfer cold air formed in Siberia over the Arctic into Canada and then the U.S.
Winter Precipitation Opportunities
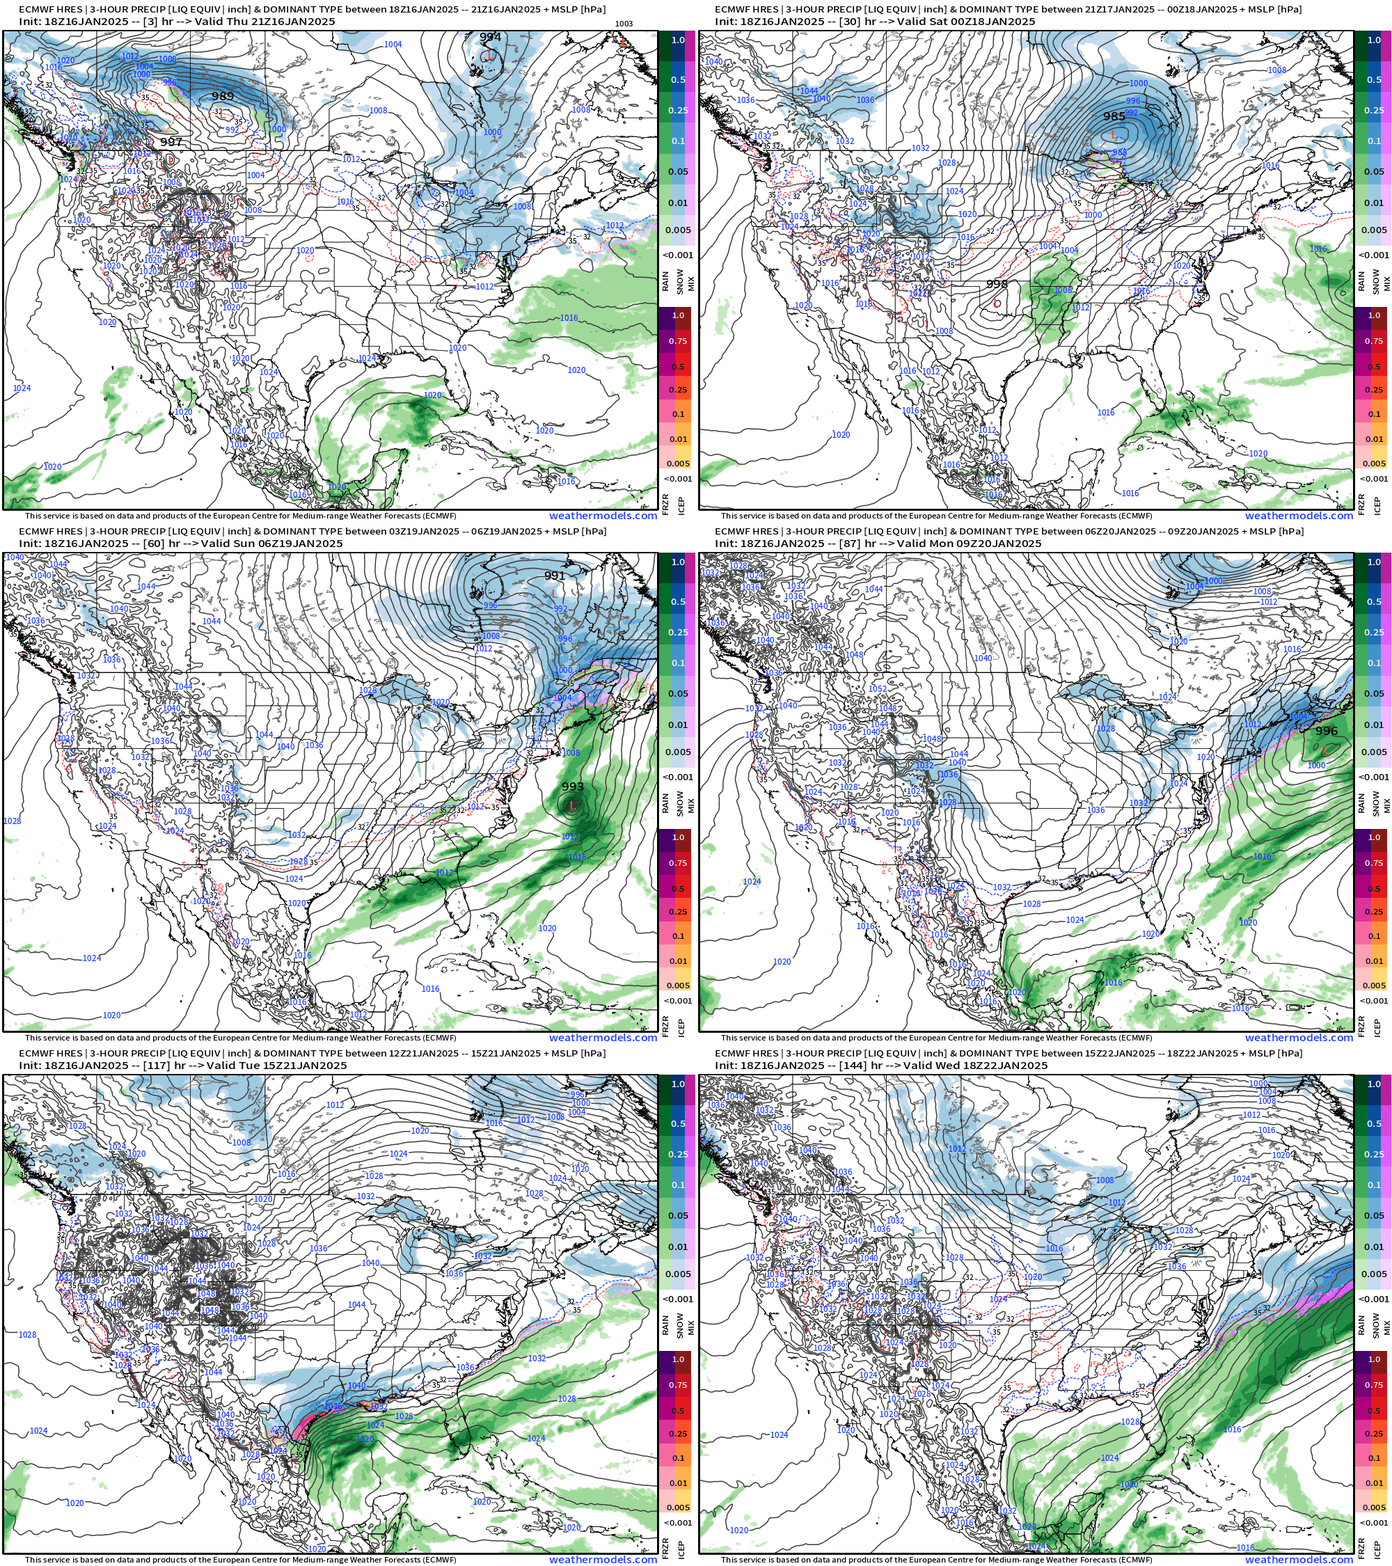
A weak system could bring a couple inches of snowfall to the Mid-Atlantic including Washington D.C. on Sunday.
That low pressure develops more into a mini-Nor’easter that would blanket New England with some snowfall.
Then, the focus shifts to the Gulf Coast with ECMWF 18z and other models now consistently showing a mess from Houston to New Orleans and Tallahassee with historical snowfall 3”-6” or more along with heavy freezing rain in North Florida.
This is probably going to shift north or south, but I’d admit that it’s amazing to even be talking about this only 4-5 days out.
Snowfall next 6-days — Crazy!
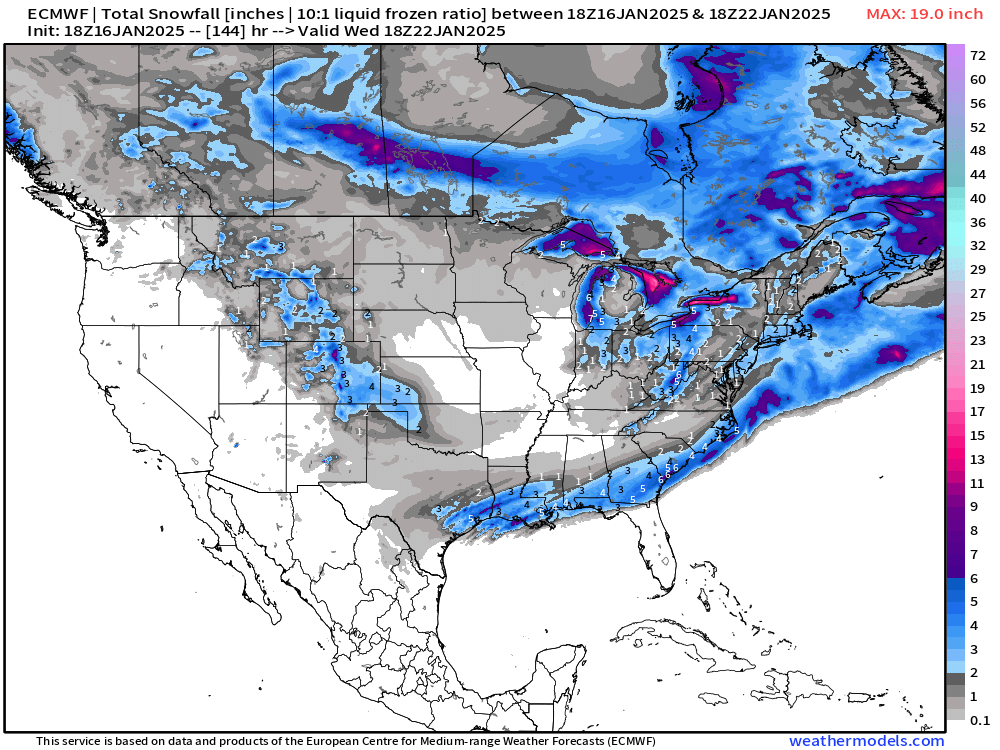
How realistic is this snowfall? Well, it’s a 10% to 50% probability depending upon the snowfall threshold. We can get there with percentiles or probabilities.
—> quite plausible
Extreme Cold Waves
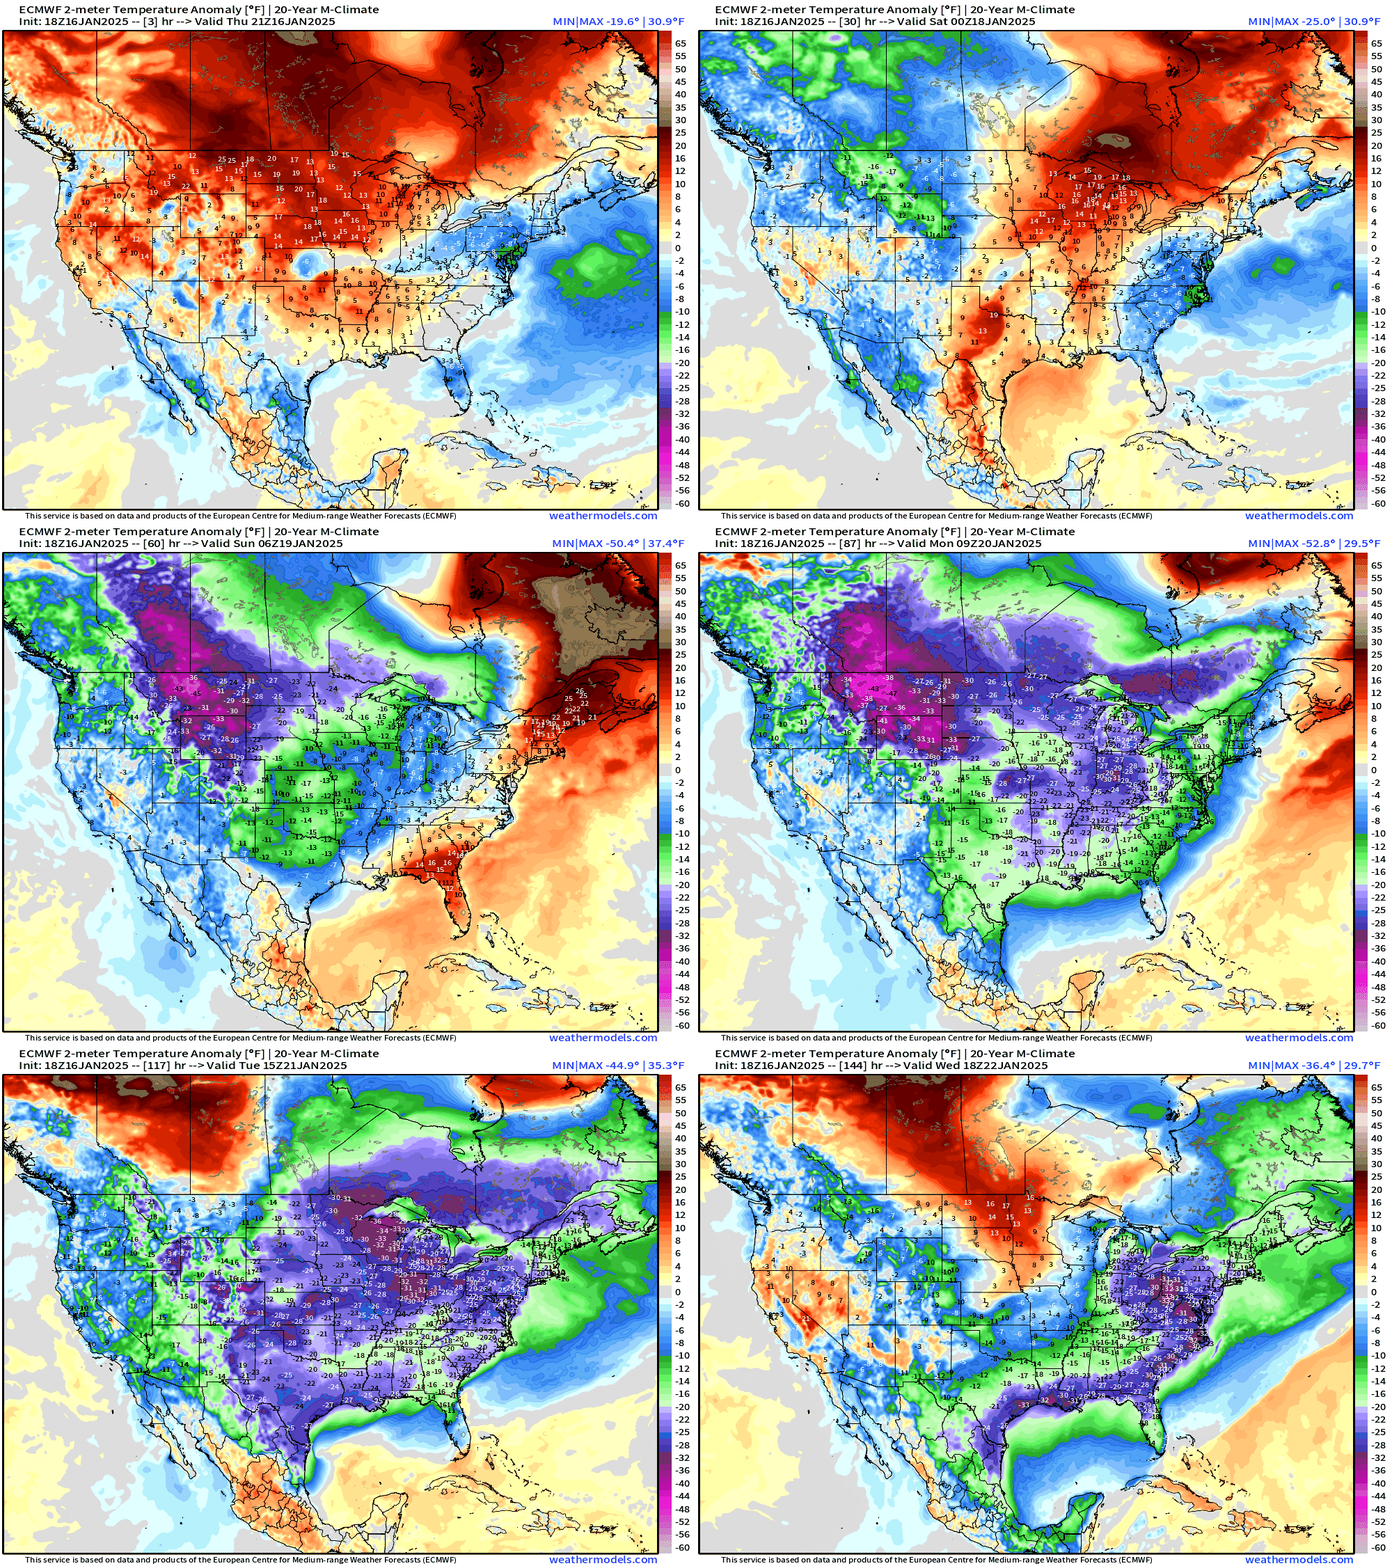
Next 6-days temperature anomaly — the Arctic blast doesn’t surge southward all at once but instead evolves behind a positively inverted trough.
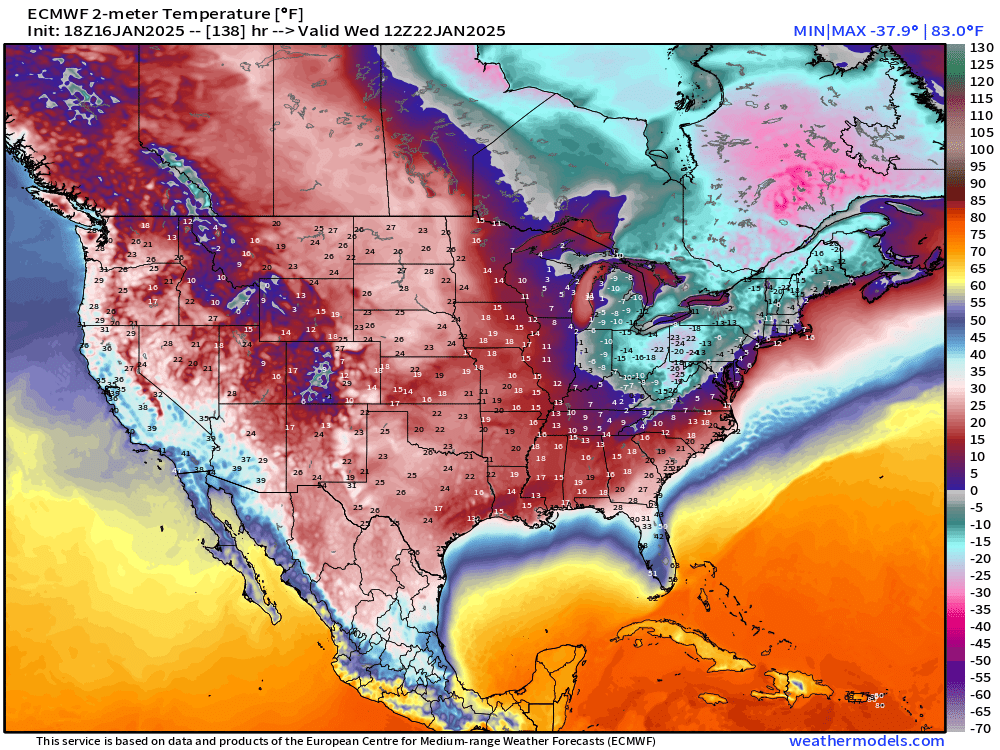
I’d note the corridor of extreme cold from Chicago to Pittsburgh that shows up in the HRES and EPS over the snow covered ground.
Pittsburgh into the minus 20s Wednesday morning?
I’m not sure how good the ECMWF model is with extreme cold over snow cover, but it’s indicating dangerously cold numbers.
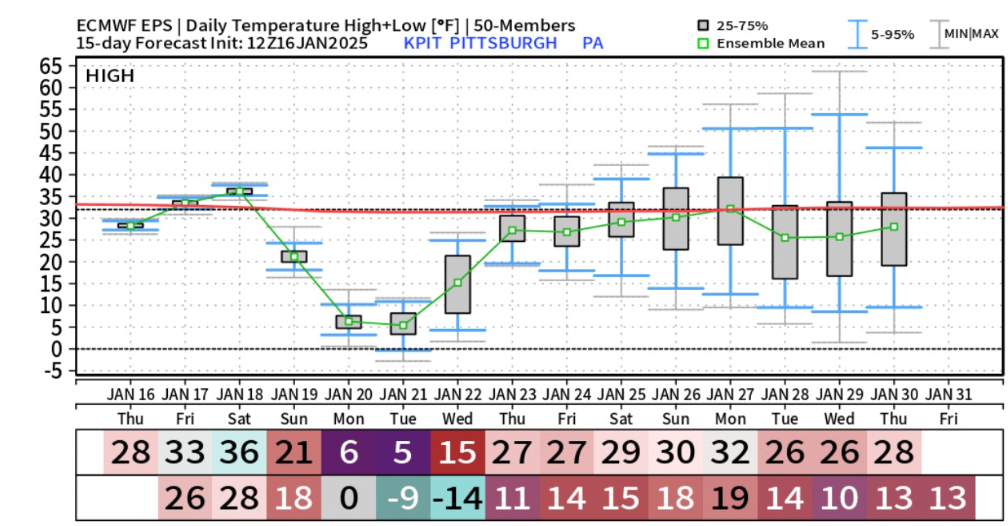
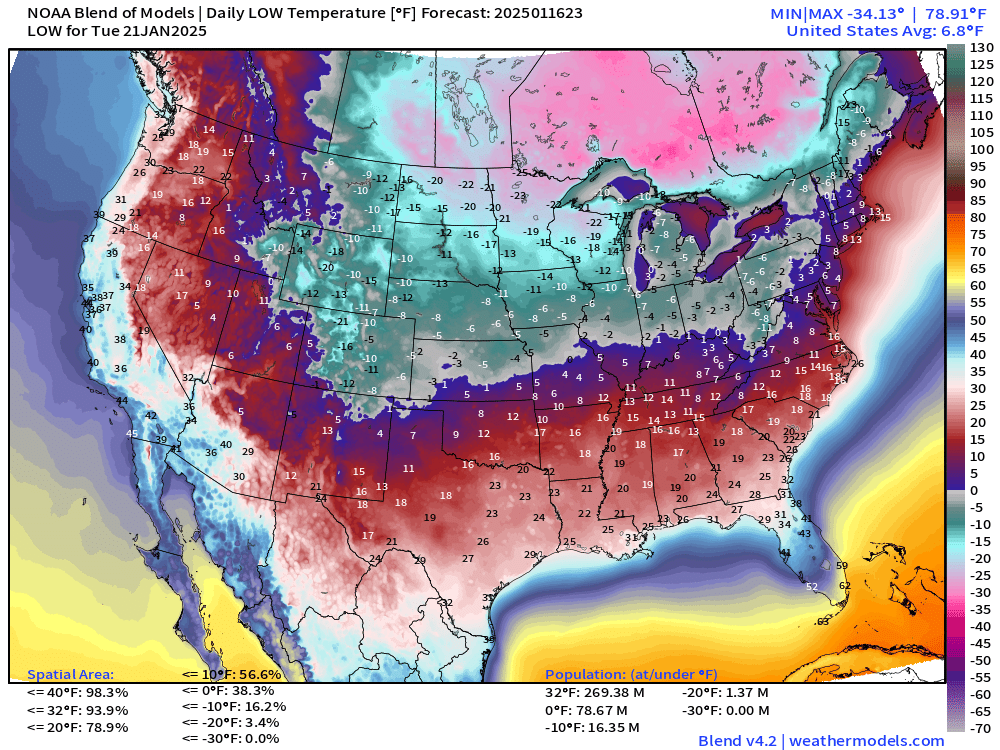
EPS mean is at -14°F in Pittsburgh for Wednesday morning.
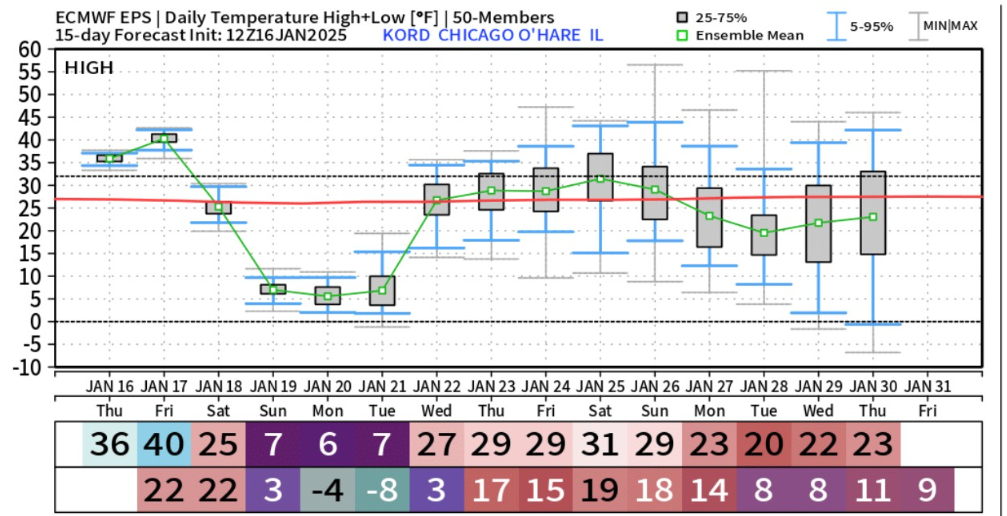
Chicago goes down to -8°F on Tuesday morning.
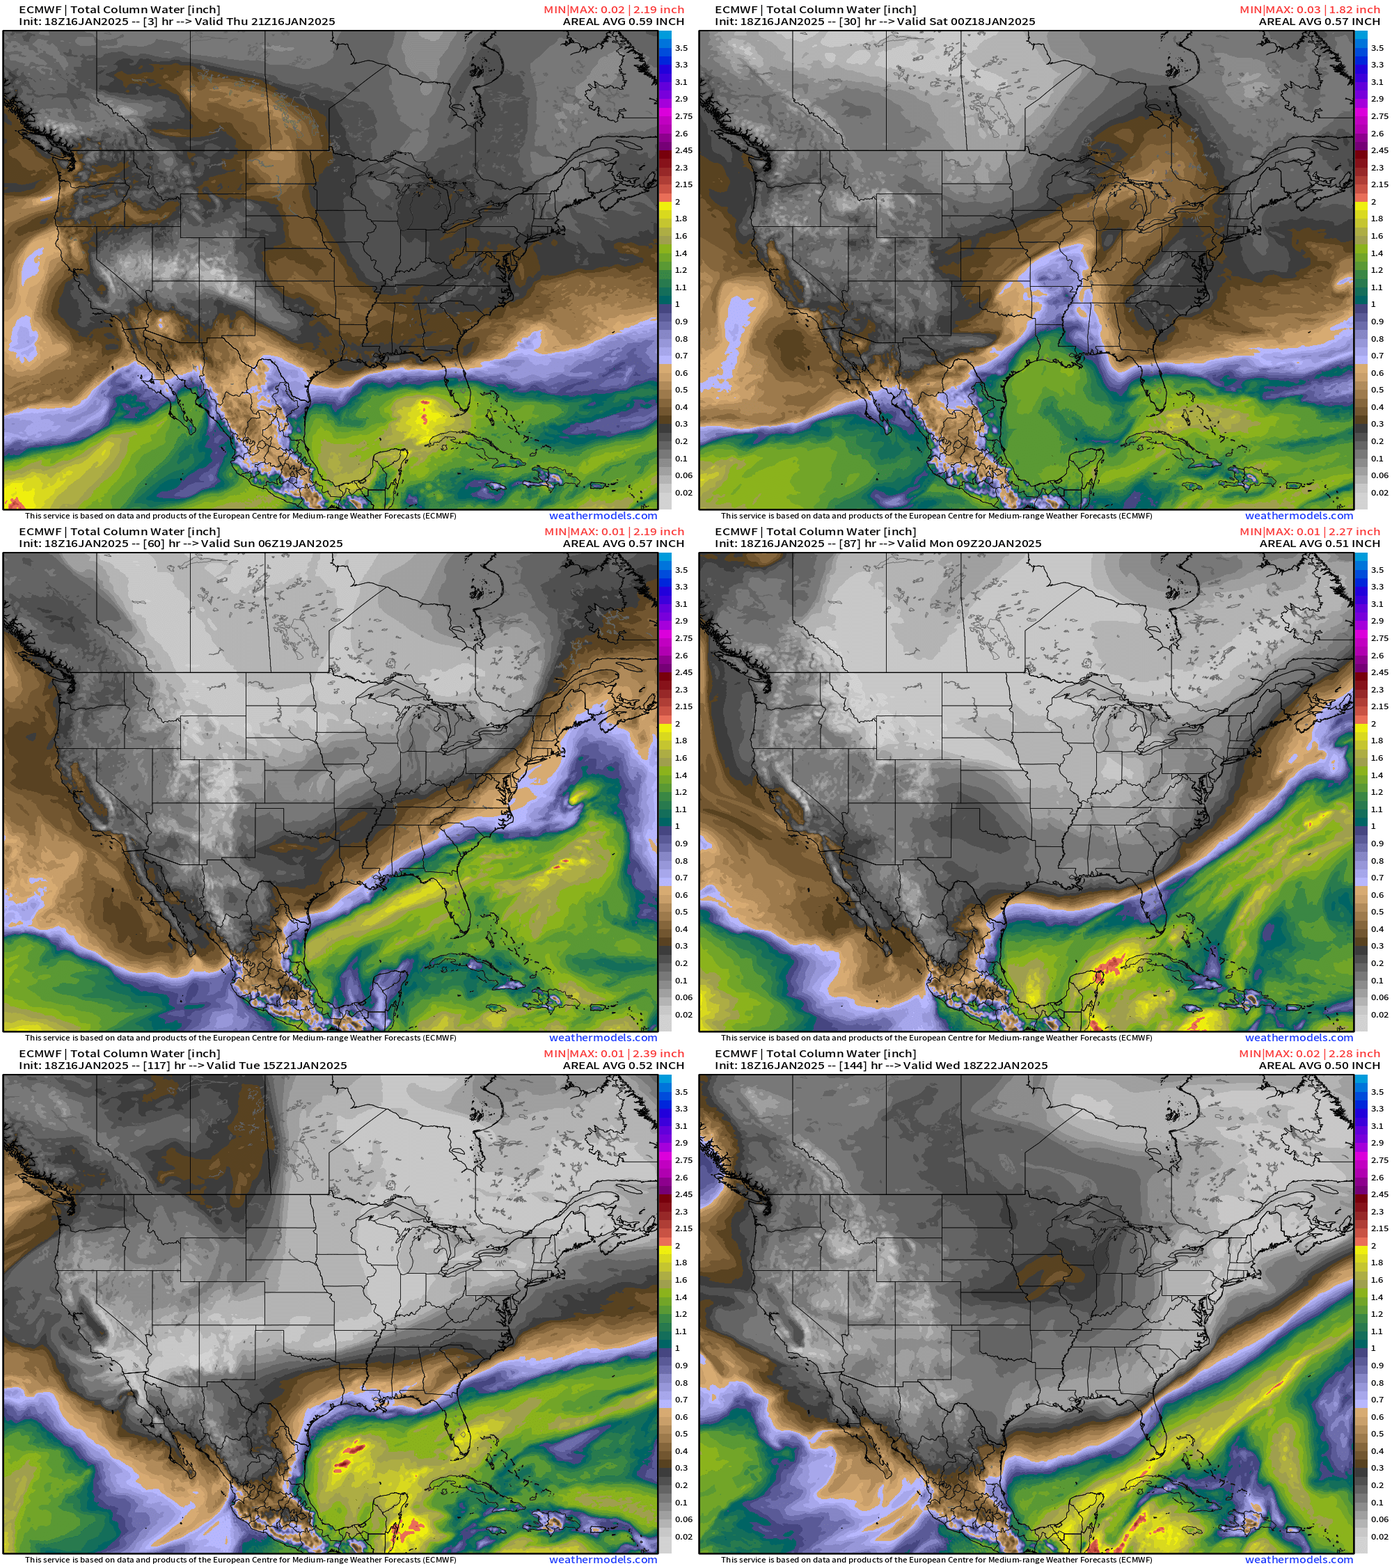
My Favorite Variable Precipitable Water
The surge of moisture out of the Gulf of Mexico is enormous, and if it is able to reach the Gulf Coast where the Arctic cold dome sits, then it mean heavy snowfall along Interstate 10 from Houston to New Orleans to Jacksonville, Florida.
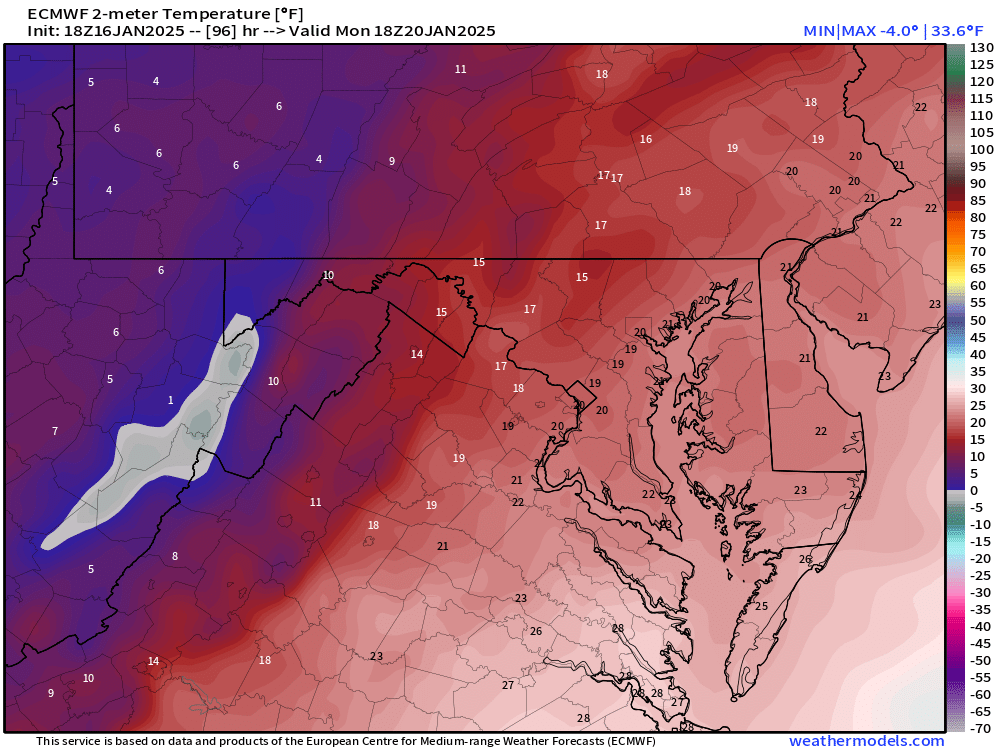
Inauguration Day in Washington D.C.= cold. Temperature maybe 20°F with wind chills in single digits. No ongoing snowfall, but 1” of snow from Sunday maybe on the ground.
NFL playoffs: Temperatures in the teens in Buffalo on Sunday. Colder now 20s in Philadelphia, but wind chills will make it feel much colder with some light snowfall possible.
Temperature Anomaly over the Next 15-days
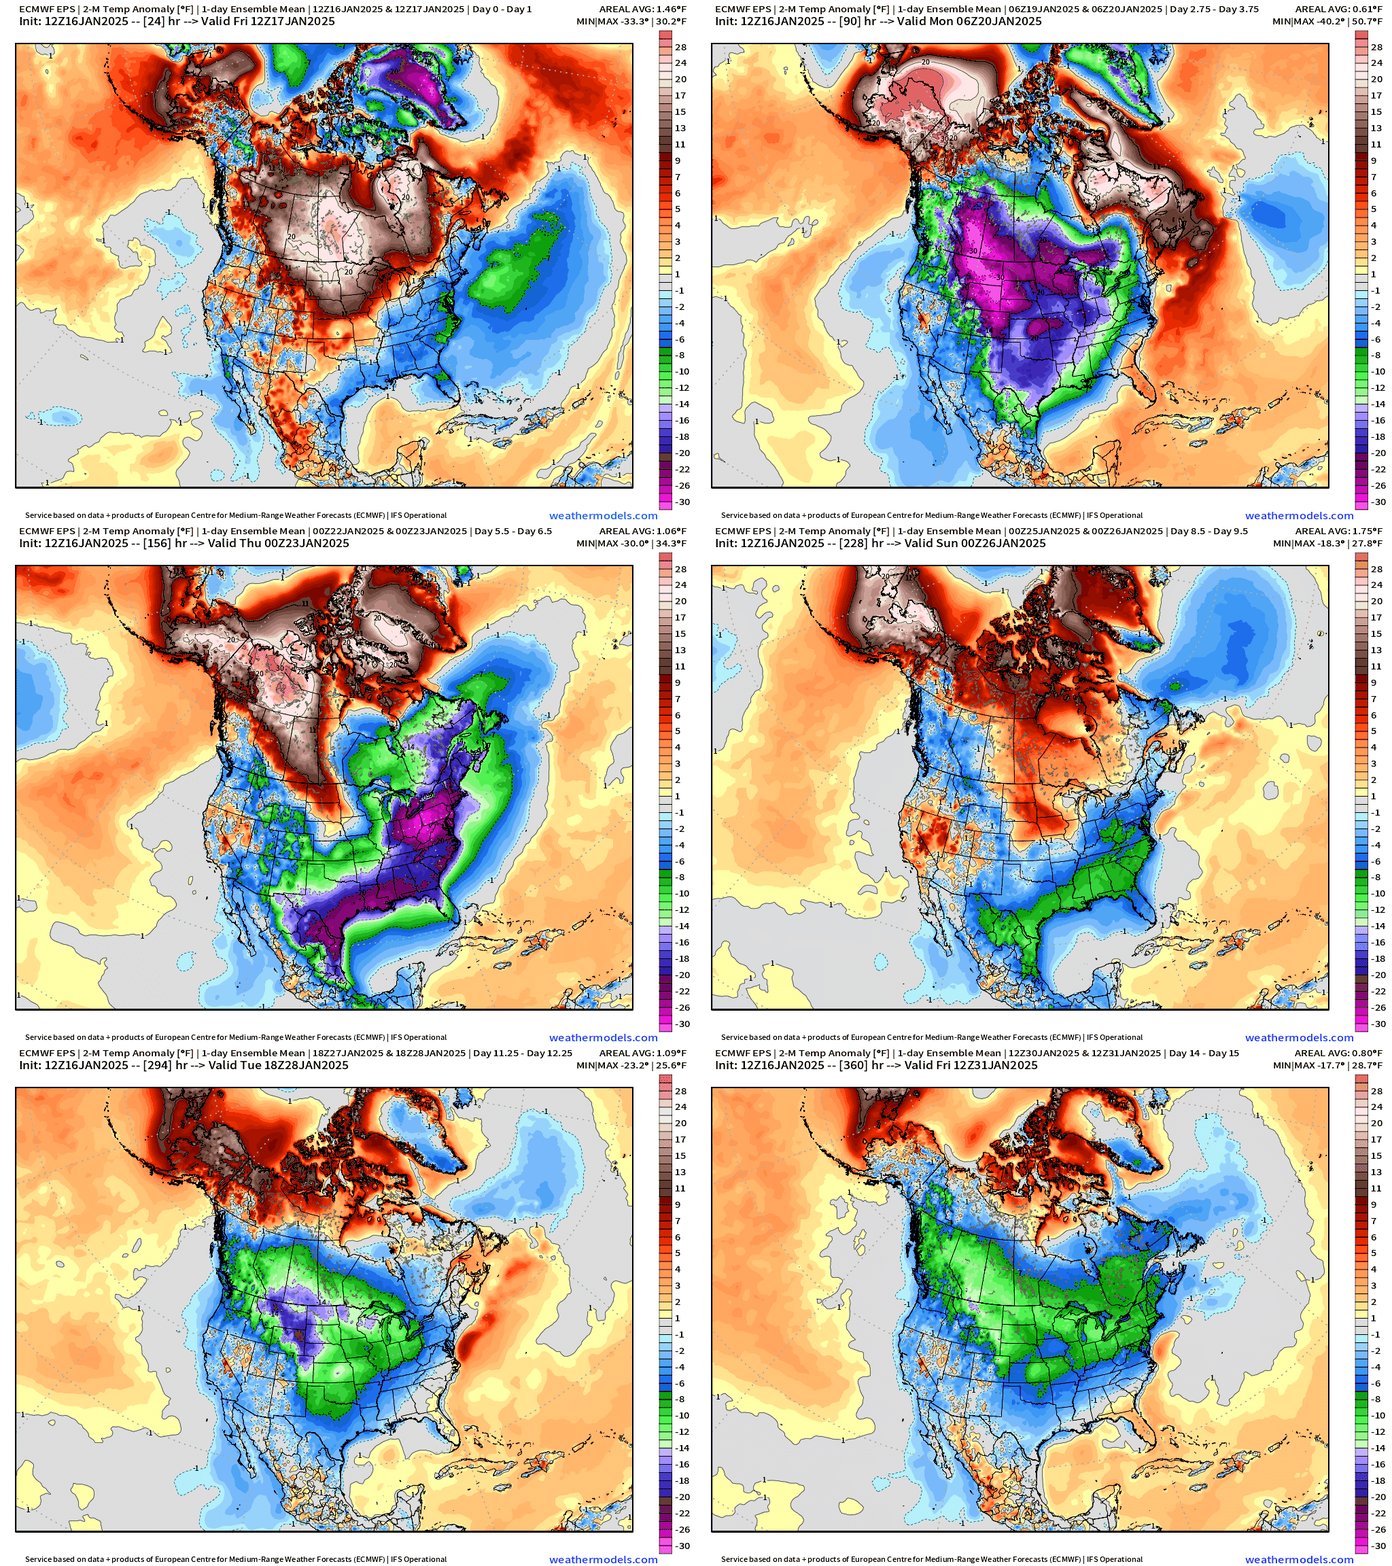
The signal for another cold period ending January is settled into the Ensembles across the Northern Tier of states. Sigh.
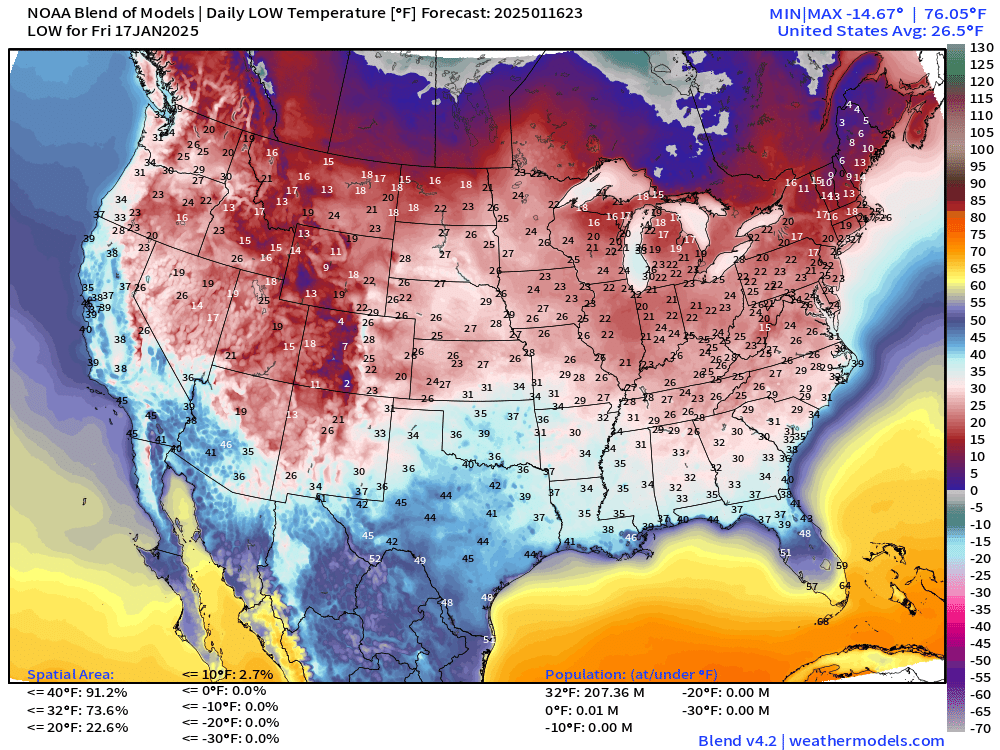
Friday Morning Lows
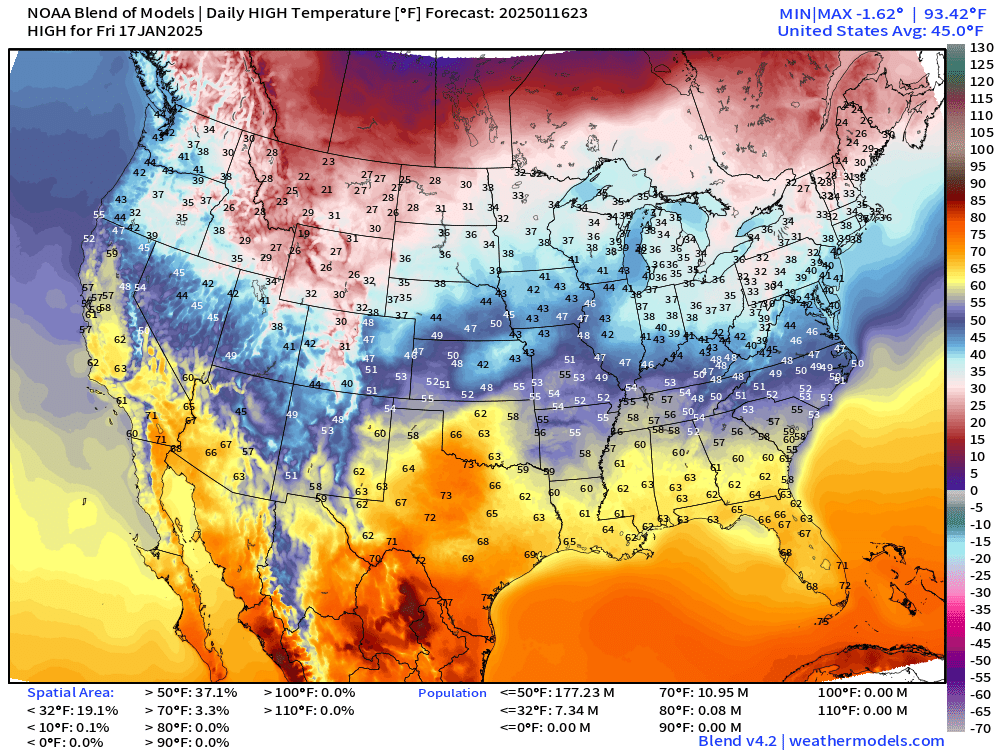
Friday Afternoon Highs
Sunday Low Temperatures
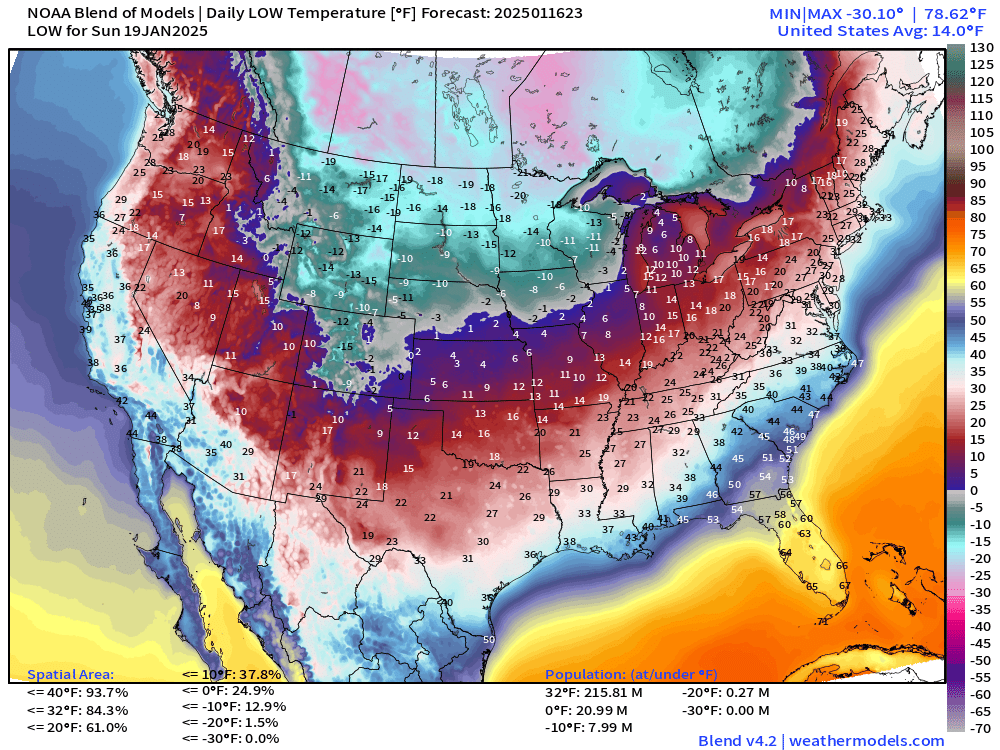
Lower 48 average of only 14°F
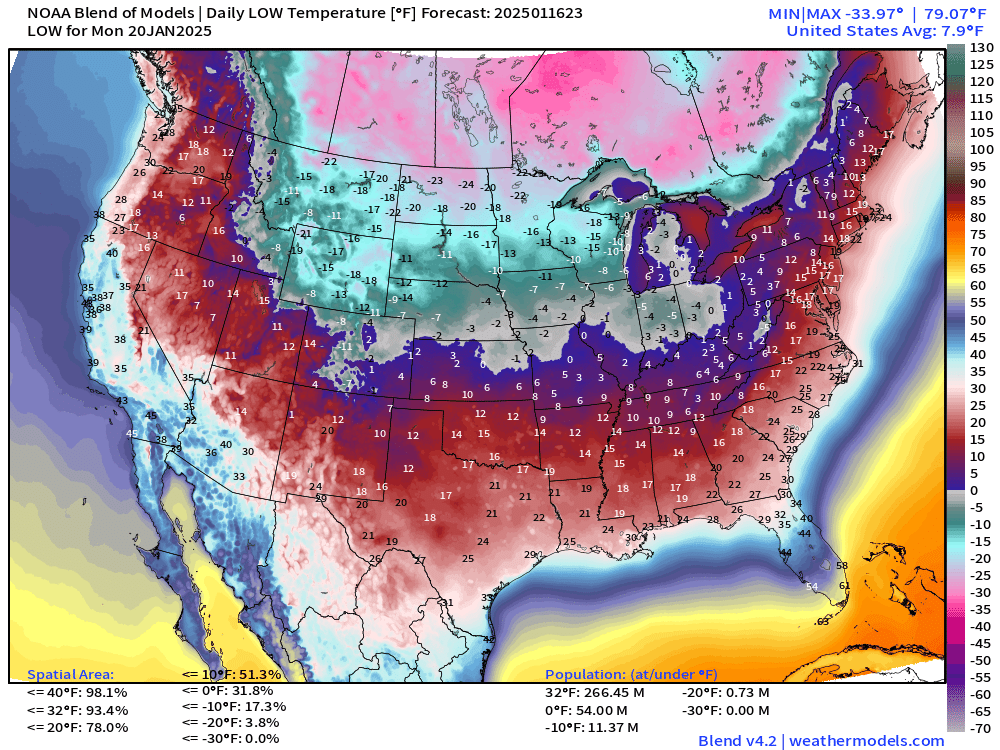
Next Monday Lows —> LOWER 48 average of 7.9°F
Next Tuesday Lows —> Lower 48 average of 6.8°F
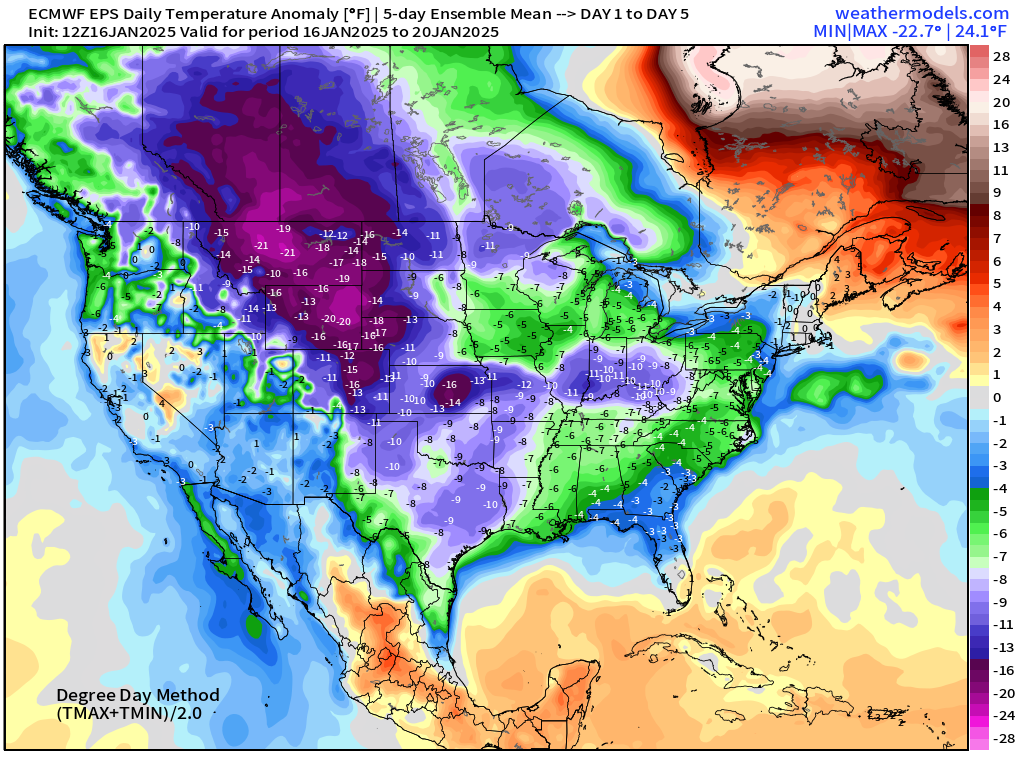
ECMWF EPS 12z | 5-Day Chunk Temperature Anomaly
Days 1-5: January 16 - January 20
Days 6-10: January 21 - January 25
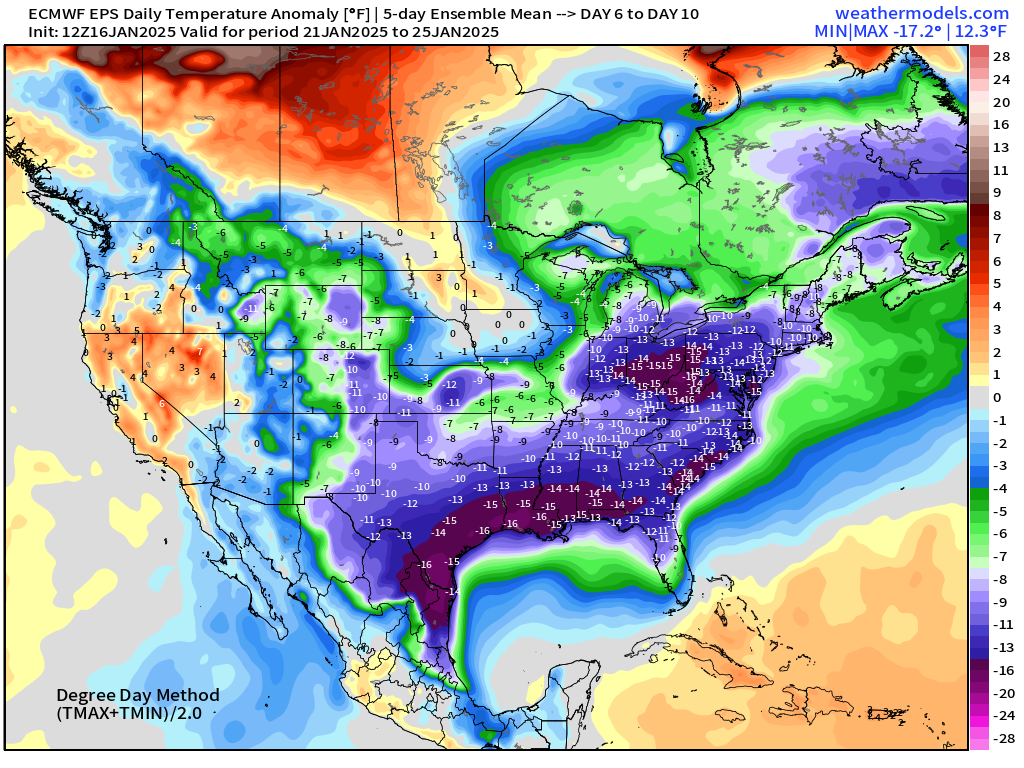
Entire Lower 48 is below normal except for perhaps Miami.
Days 11-15: January 26 - January 30
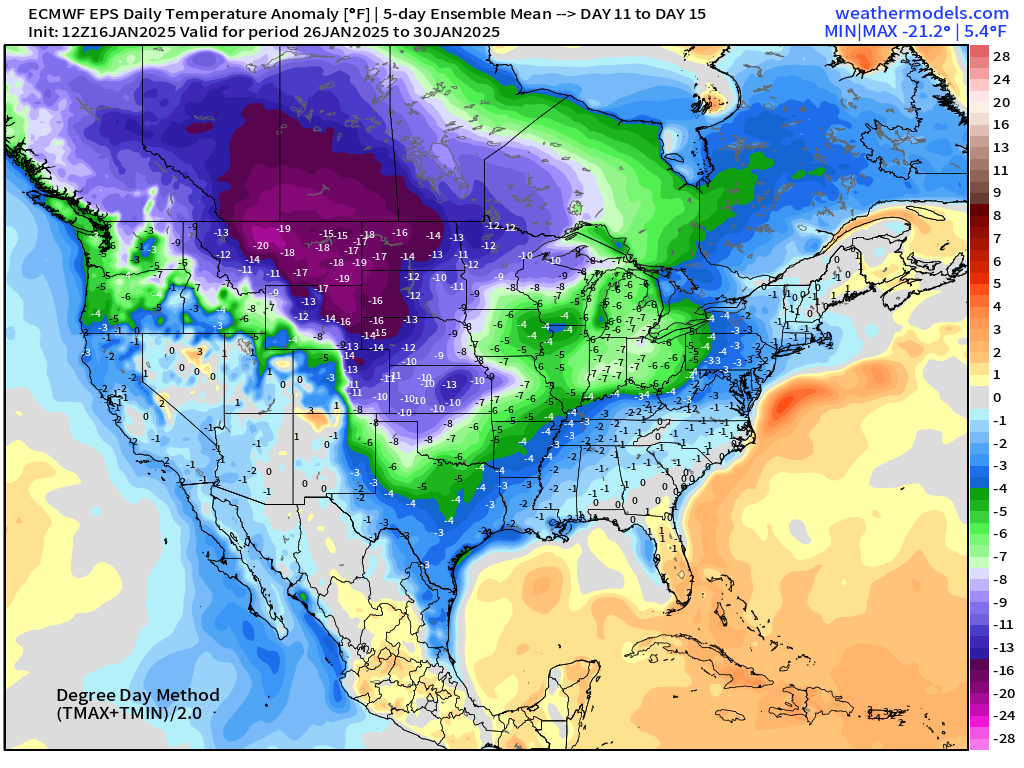
Another very strong cold signal over the Western U.S. with -20°F below normal in Montana in the ensemble mean.
For new followers coming from Substack, X, or friends, you’ll get daily updates of mainly Lower 48 weather including winter storms, heat waves, hurricanes, and now Arctic blast. The goal is to provide a “heads up” to impending extreme weather in the coming 1-2 weeks — medium range weather prediction. I use the best and most advanced Numerical Weather Prediction (NWP) systems including ECMWF ensembles, NOAA GFS, and the state-of-the-art A.I. systems.
Who writes and researchers this Newsletter? Dr. Ryan N. Maue [X https://x.com/ryanmaue] with 20-years experience of daily weather model production and analysis. You may have seen my weather maps! I live in Atlanta but was born and raised in Northern Michigan. I know snow, and southern heat and humidity.
Maps sourced from weathermodels.com designed and innovated by yours truly! Please subscribe there for real-time access to the newest maps, charts from all of the weather models including ECMWF.
- Milepost
- 498 · laid 2025-01-17T02:52:31.532000Z
- Source
- https://weather.substack.com/p/january-16-2025-thursday-evening
- Digest
- 1b57419dc0a486b1e15167cfaaeaa13803a489f563b3f014c2de31c419a6365a
- Machine
- JSON