December 30, 2024 Monday Evening Winter Update
Still on track for major Arctic blast, but details remain foggy
December 2024 was the 4th-warmest December in the 131-year national record (1895–2025), at 38.1°F against a 1991–2020 normal of 34.3°F (+3.8°F).
December 2024 was the 64th-driest December in the 131-year national record (1895–2025), at 2.4in against a 1991–2020 normal of 2.5in (-0.1in).
NOAA/NCEI Climate at a Glance, contiguous United States. This is the observed record for the month, not a score of anything said in this piece — the forecast ledger begins 2026-08-17 and cannot reach earlier posts.

Monday Evening Update
Meteorologists use ensembles to highlight the uncertainty in space and time of weather events especially after Day 5 or 7, in the medium to extended range. Indeed, after a week, some of the ensemble members (perturbed with tiny noise at t=0) show large variability — could be totally out of phase or opposite sign of an anomaly.
The ensemble mean [Ens-Mean] is typically used to represent the overall upper-level weather pattern. The ENS-Mean is a smoother in space and time. Think of a storm system moving along a similar track but 15 ensembles have it north of NYC and 15 ensembles have it south of NYC, but also 6-12 hours before, or later. In the grand scheme of things, the overall pattern shows a storm, but the details about track are different along with the timing. However, when you average it all together, you get a smooth signal.
The Ens-Mean is NOT a member of the ensemble. It is the average of the individual members. The Ens-Mean is not dynamically or physically balanced as linear averaging won’t preserve the balance equations. Lastly, the Ens-Mean necessarily sacrifices detail in the extremes. This is also why the Ens-Mean scores so highly with RMSE or anomaly correlation: avoiding the double-penalty of a misplaced extreme or bullseye.
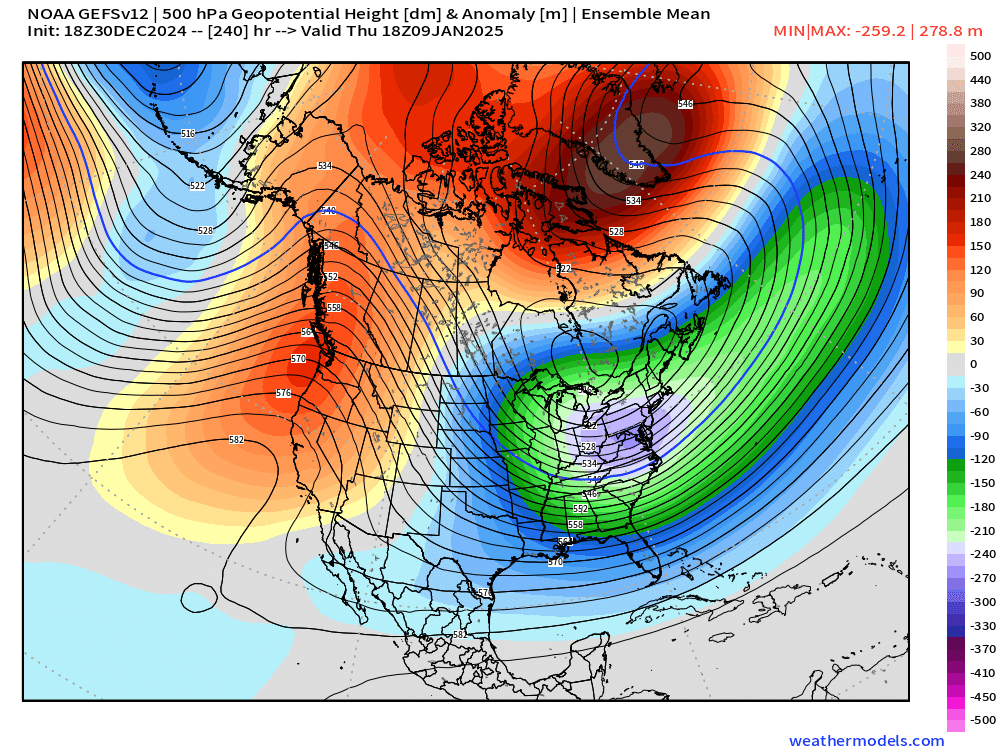
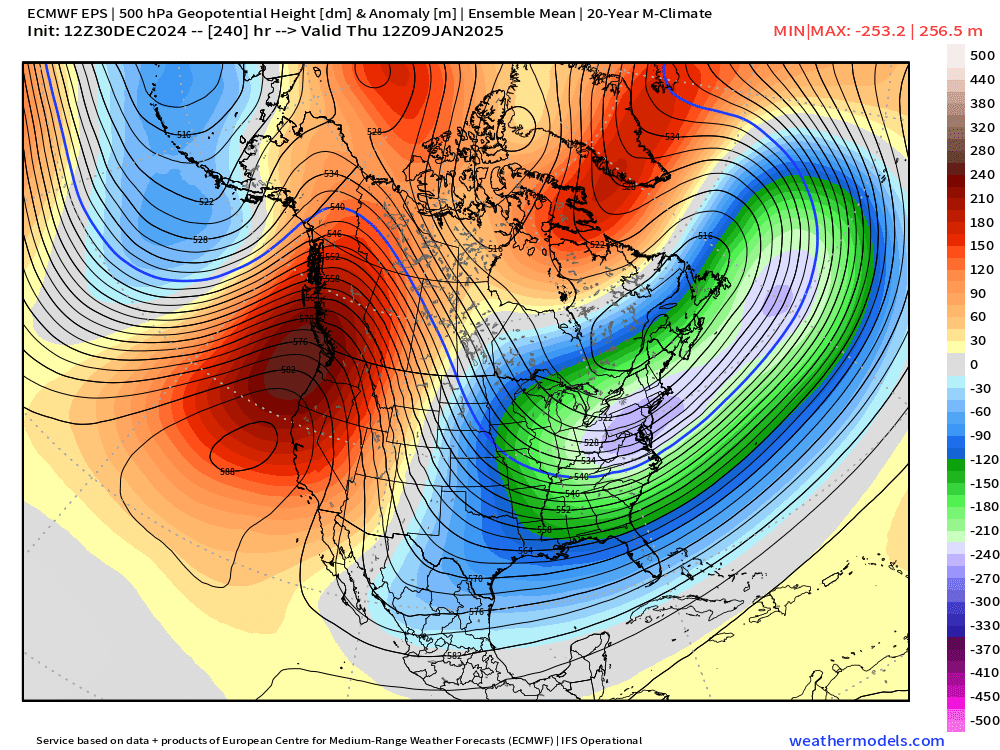
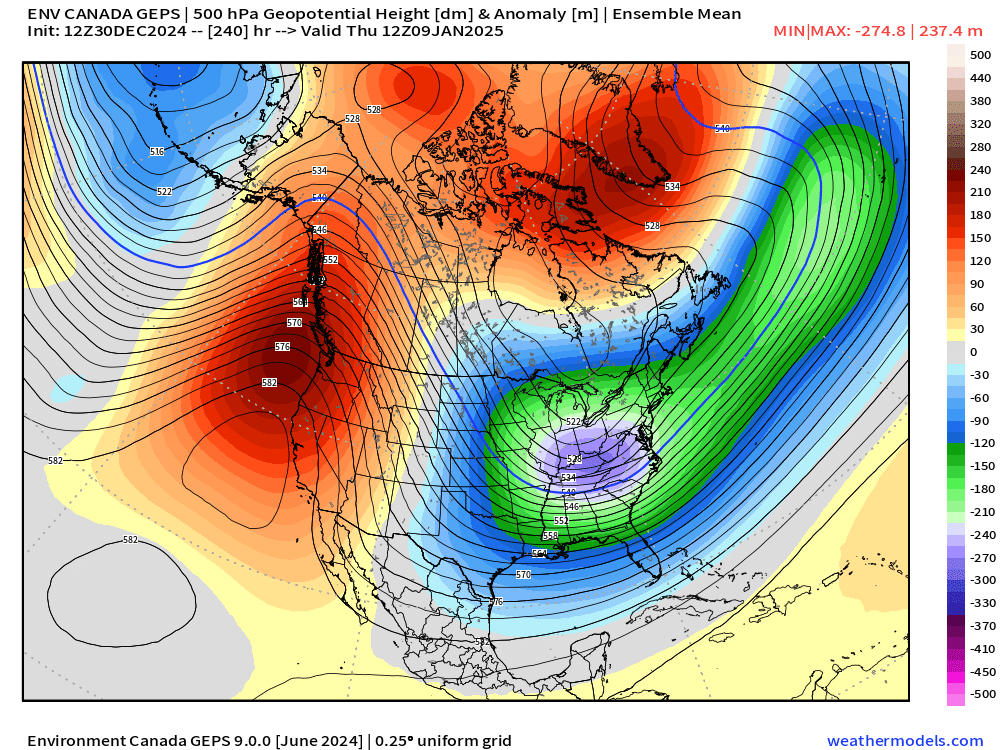
Example: Very little difference between the 10-day height fields from GEFS, GEPS, and EPS.
NOAA GEFS 12z Ensemble Mean height anomaly at 500 mb | Day 10
ECMWF EPS 12z Ensemble Mean height anomaly at 500 mb | Day 10
Environment Canada GEPS 12z Ensemble Mean height anomaly at 500 mb | Day 10
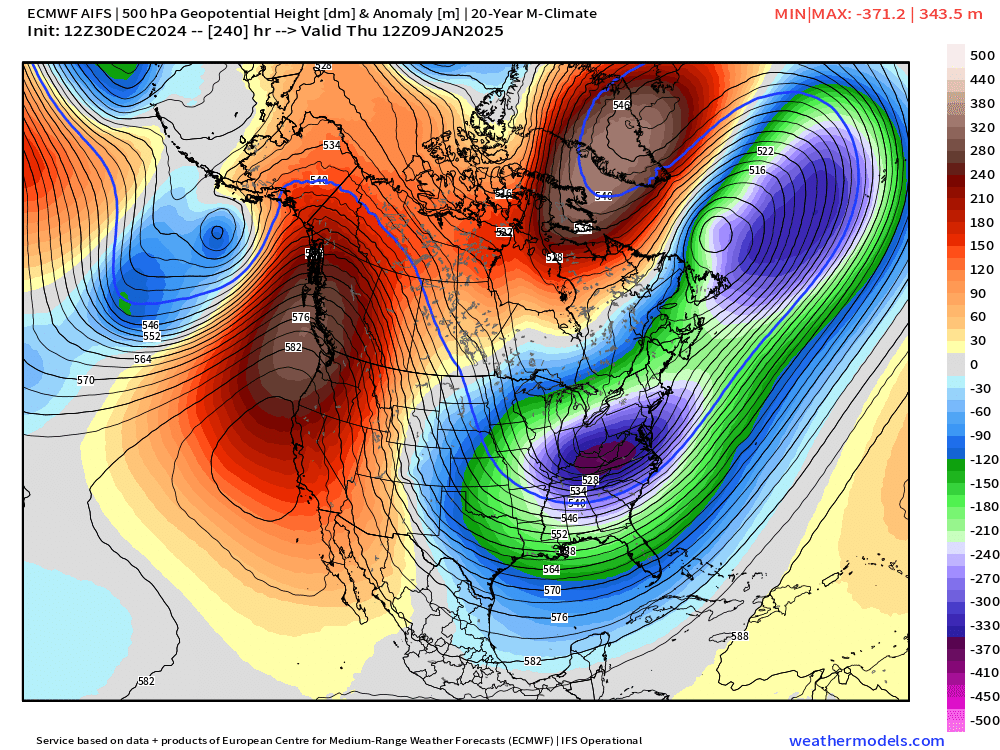
Note: the ECMWF AIFS 12z and other A.I. models look quite similar to the ensemble means with varying levels of smoothness depending upon the method.
Now, look at ECMWF HRES, NOAA GFS, and Canada GEM: the 10-day height anomaly maps show a cut-off low over northern Mexico that is NOT seen in the ensemble mean. And, that cyclonic circulation in the mid-levels would be perfectly positioned to drag Gulf of Mexico moisture/warmth north into Texas colliding with the Arctic air = snowfall or mixed precip. Huge impacts at the surface — and details you wouldn’t see in the ensemble mean.
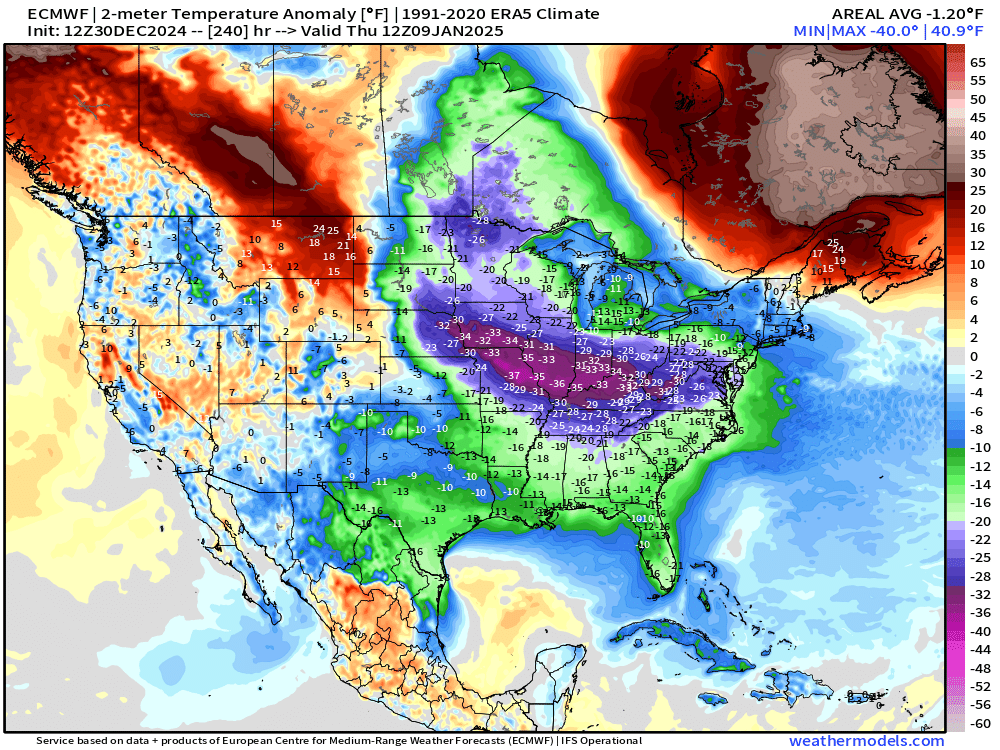
What Temperature Anomaly are we looking at Day 10?
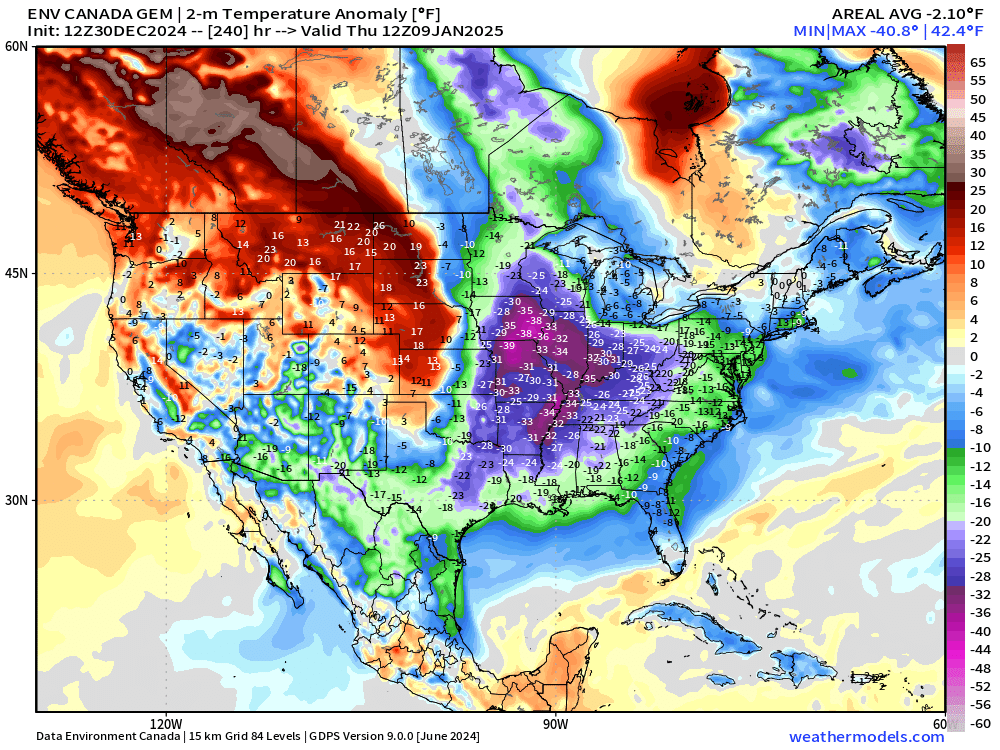
Just a snapshot from ECMWF 12z to see what level of cold compared to normal for January 9, 2025. Looks like coldest is 35°F below normal centered over St. Louis.
Canadian GEM 12z | Day 10 has the same intensity of the cold pool over the central U.S. but more N/S oblong shape. Again, details that will be worked out in the coming days.
Radar Simulation Next 48-hours | Through 1 PM Wednesday
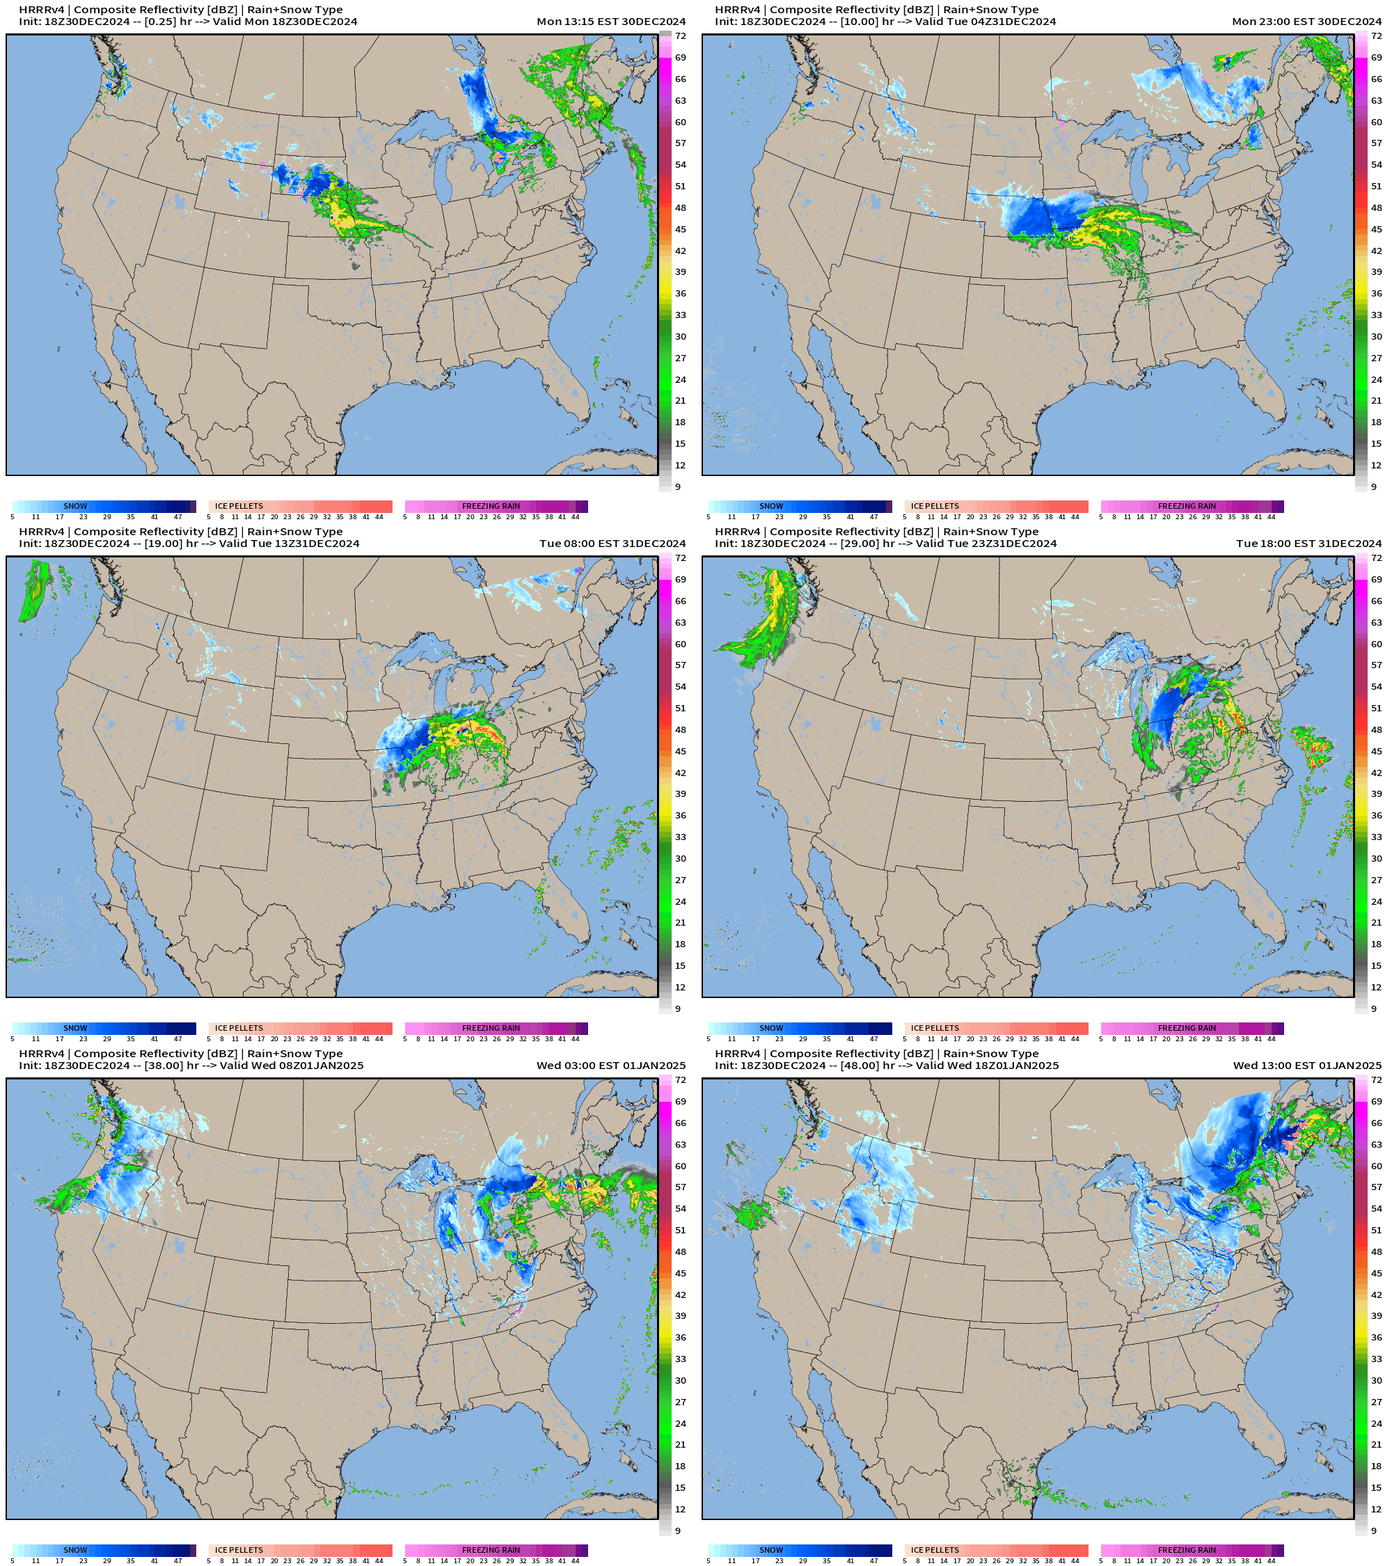
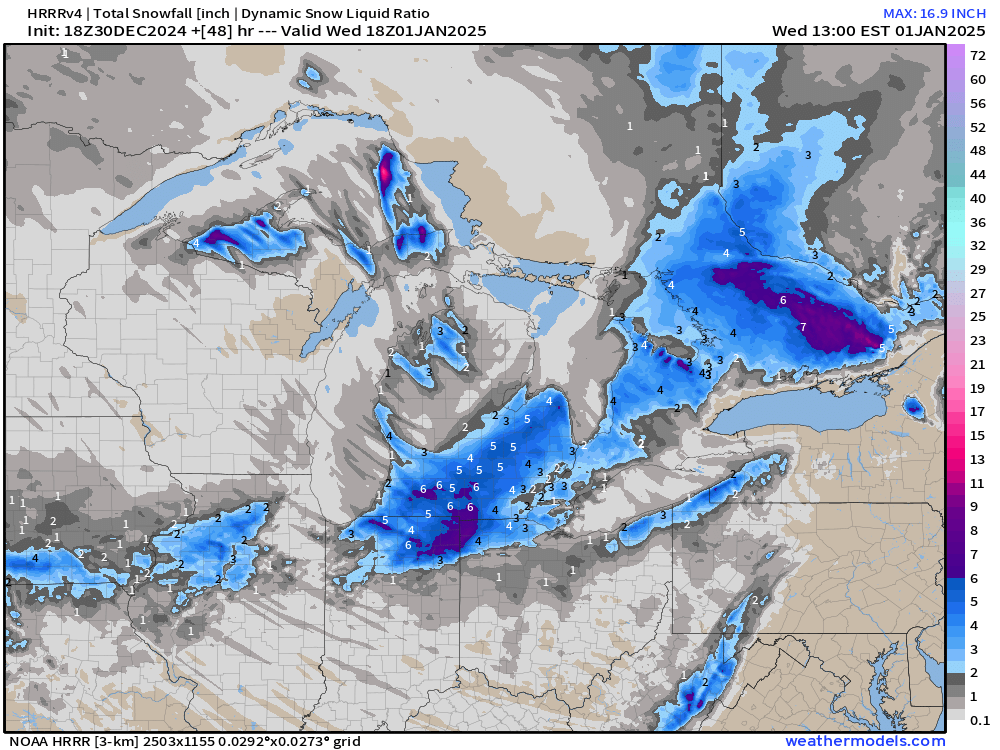
Area of low pressure moves through Chicago, Detroit, and into Toronto by early Wednesday. The storm system is small but seems to be performing well in the HRRR with a healthy precipitation plume. However, cold air is limited except on the back edge of the precipitation shield limiting the snow accumulations.
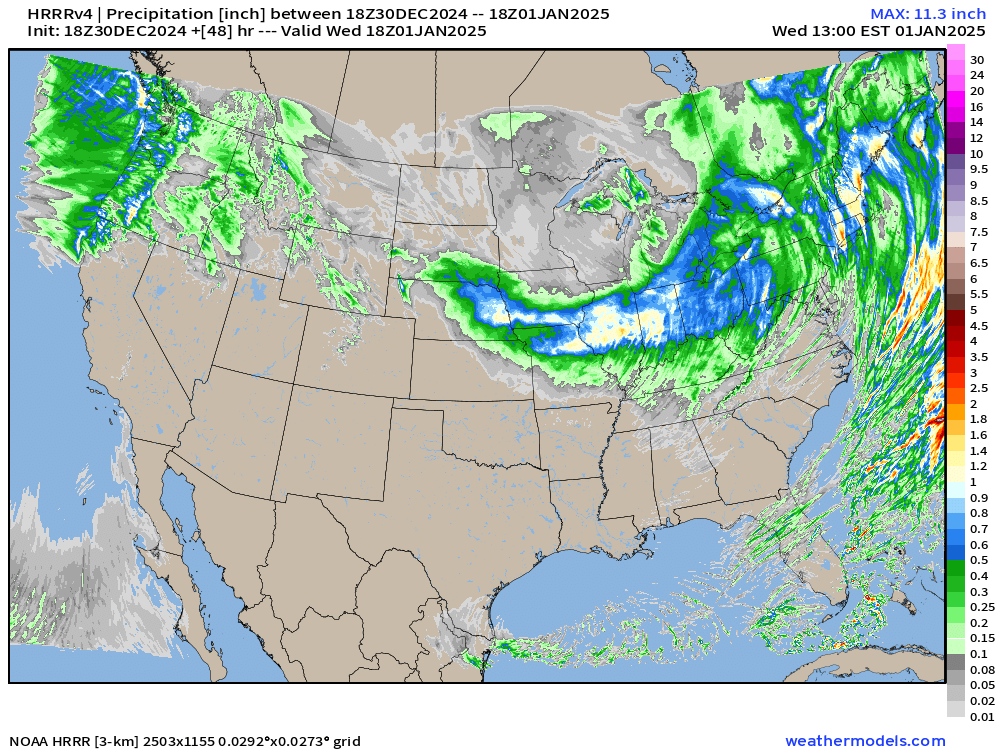
However, rainfall totals could exceed 1-2” in Illinois and Indiana, and then again in New England.
Precipitation Next 48-hours (includes rain/snow)
Snowfall Next 48-hours
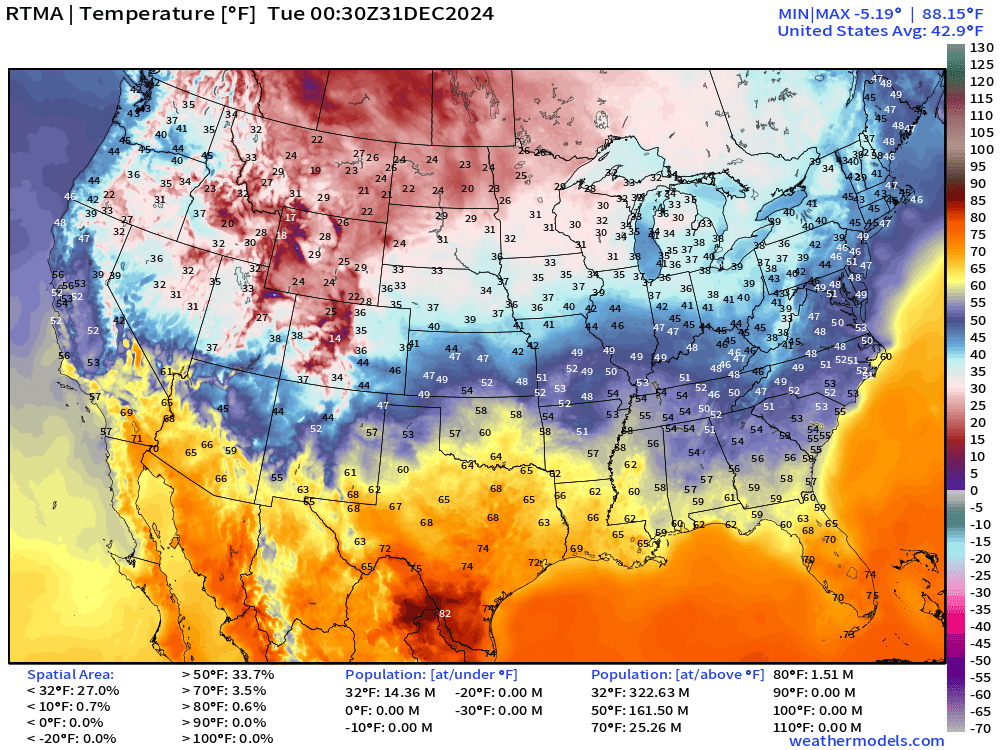
7:30 PM ET Temperatures across the Lower 48
Temperature Anomaly | 7:30 PM ET
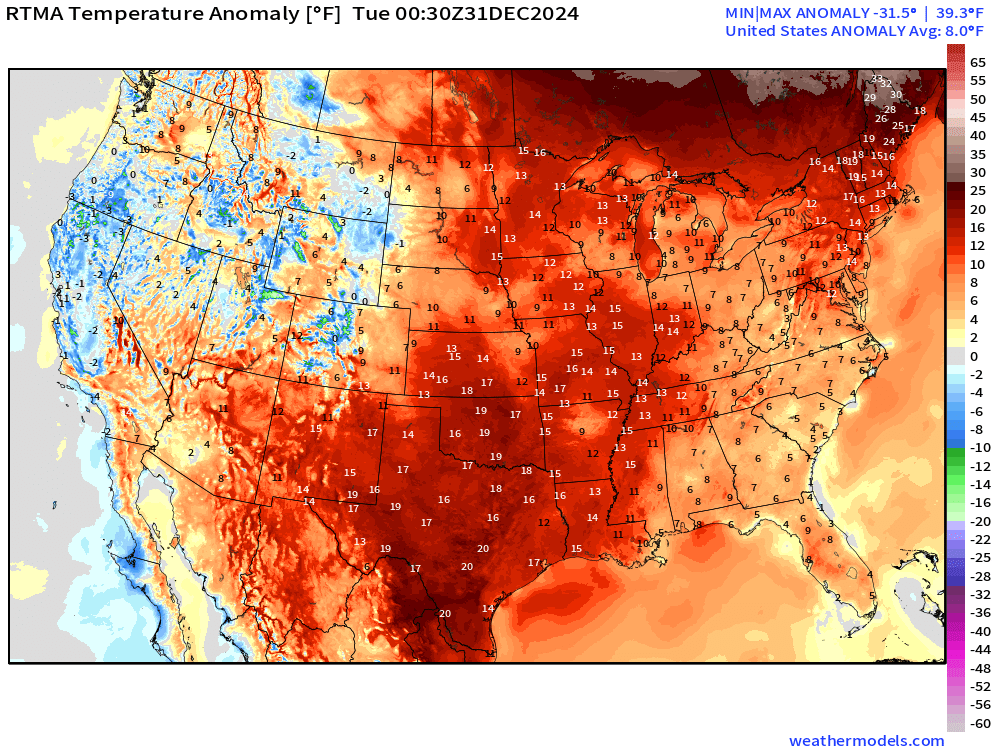
Overall the Lower 48 is still well above normal +8.0°F (above normal)
Tuesday Low Temperatures
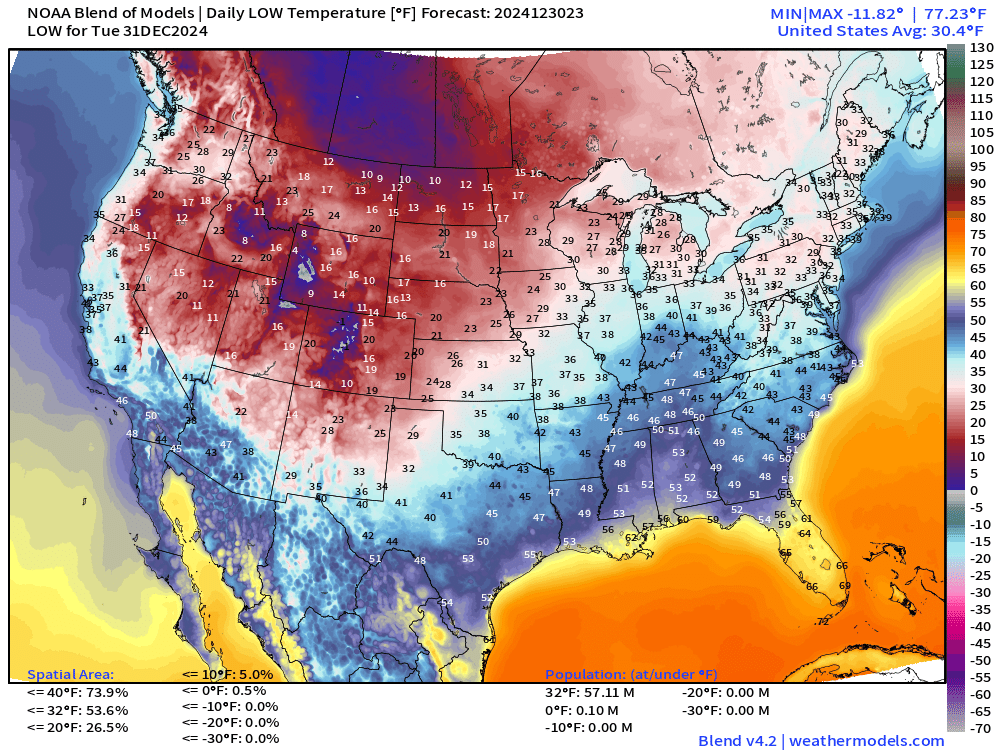
54% of the Lower 48 is below freezing but only 57 million population (less than 1/6th)
Tuesday High Temperatures
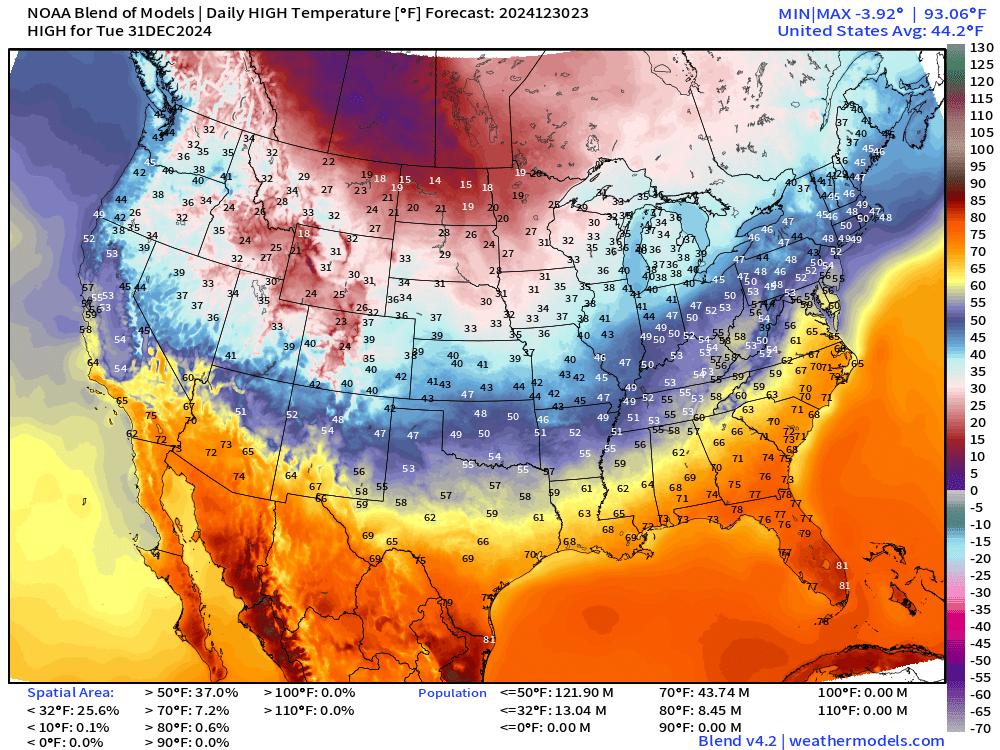
Quite mild across the Southeast into the 70s in south Georgia and 80s in South Florida. Only teens for highs in the Dakotas.
Upcoming Weather Systems | Winter Storms
ECMWF 12z precipitation type and MSLP next 8-days
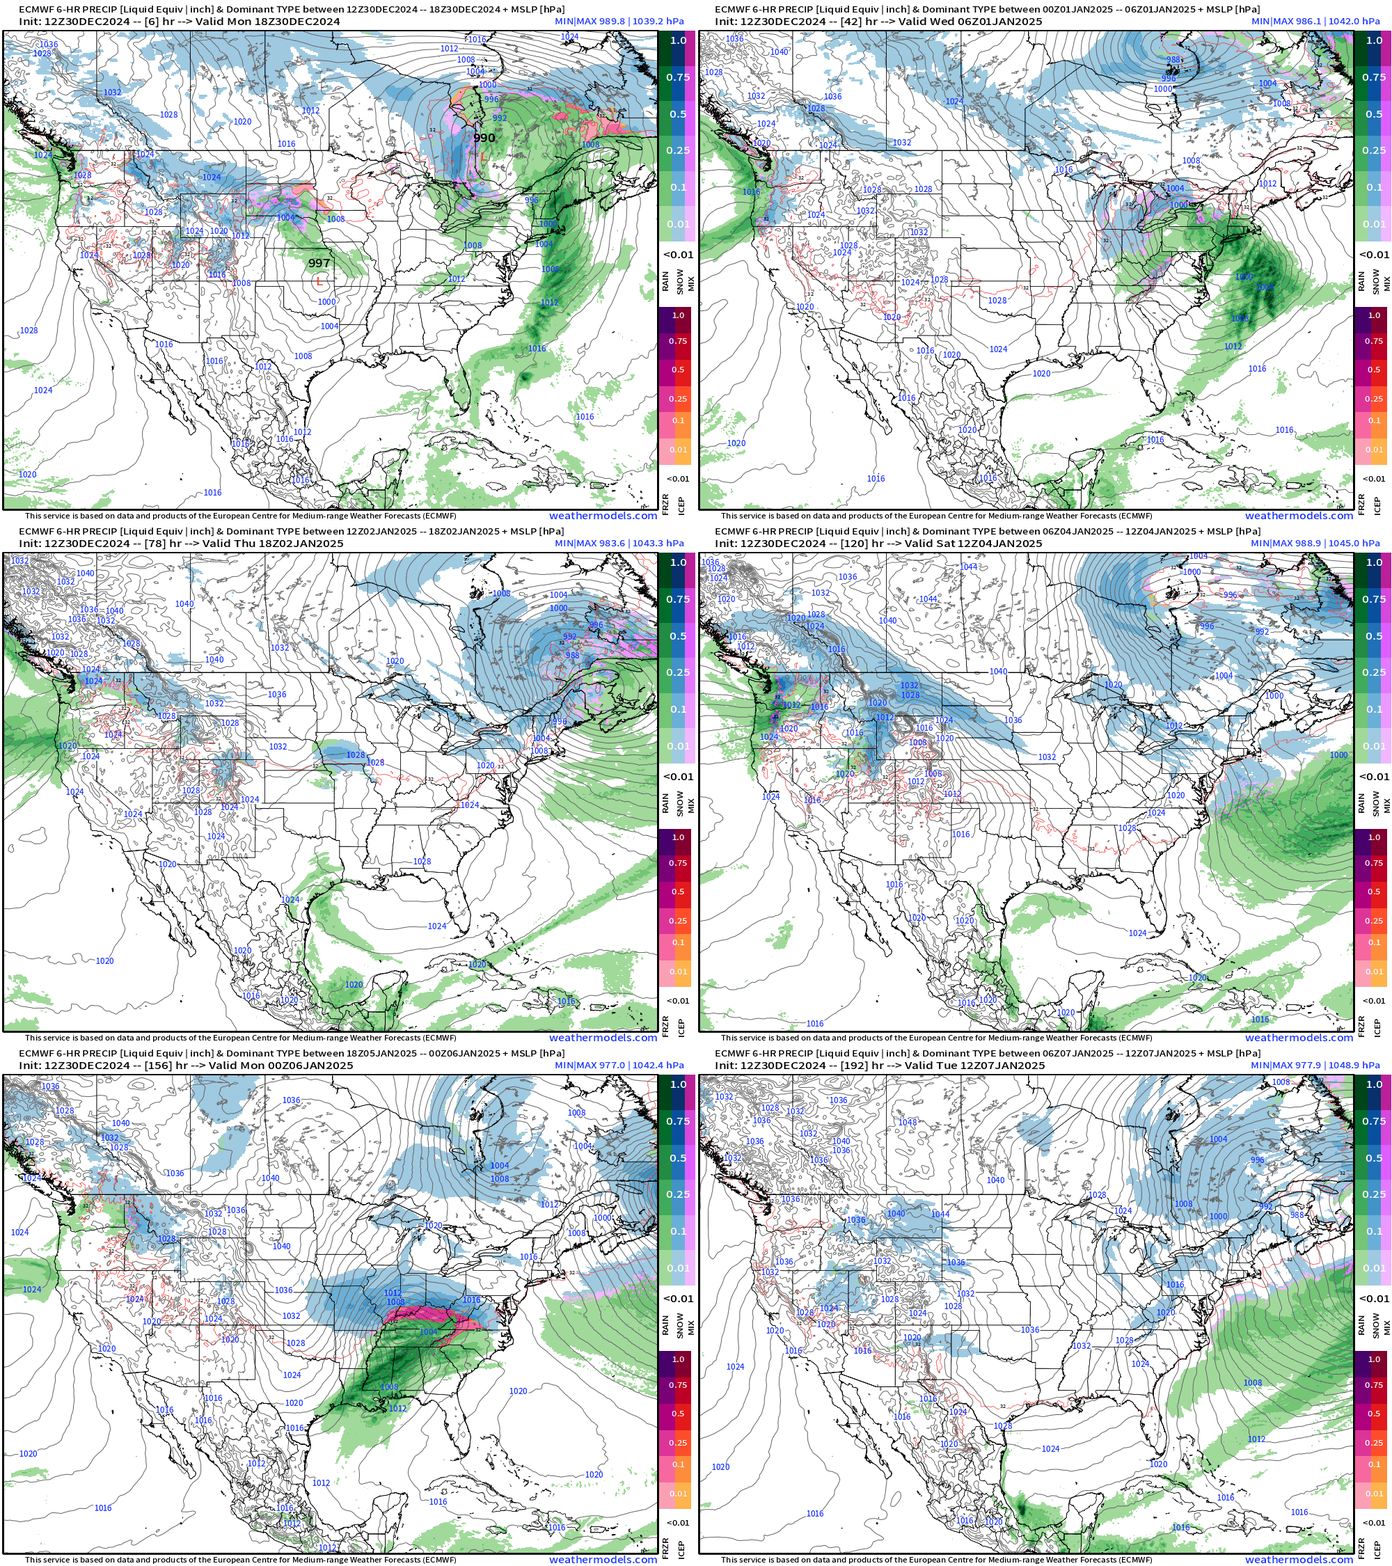
Today into Thursday: Winter storm tracks from Iowa into eastern Great Lakes, New England and then, again Quebec. Mainly rain in the warm sector, but some snowfall on the backside.
Major winter storm gathers Pacific moisture w/Colorado Lee low pressure system Sunday with potential for significant impacts into following week. ECMWF 12z tracks this storm due east through the Mid-Atlantic with limited intensification until offshore.
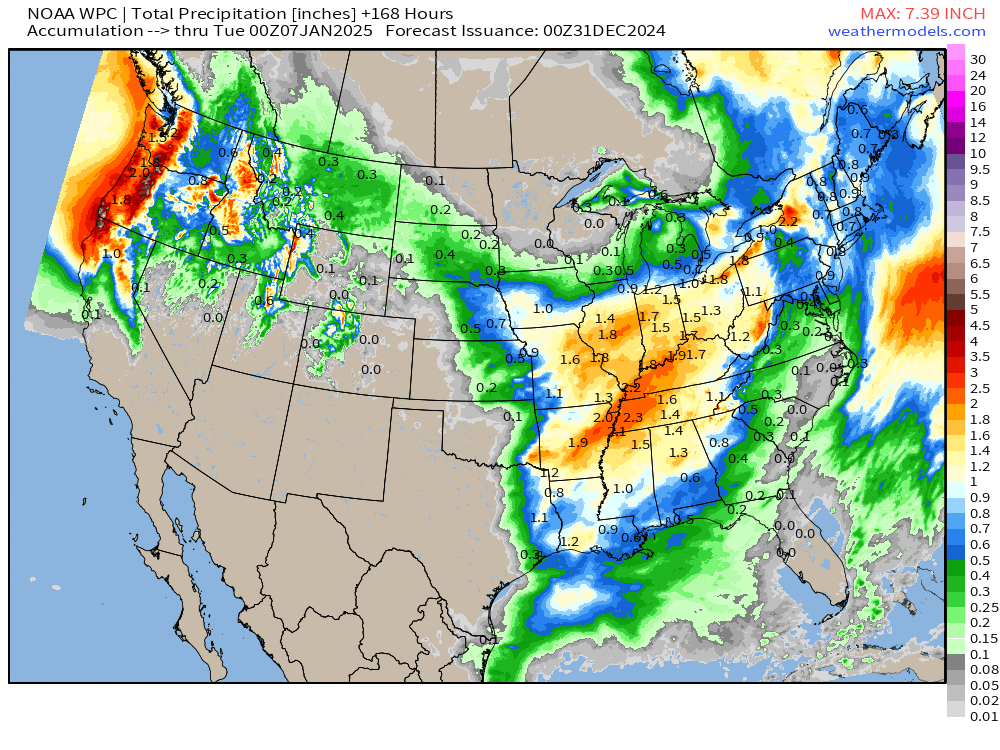
Total Precipitation next 7-Days | NOAA WPC
Extreme Weather | Winter Storm Outcomes
I only want to show the 15 or 16 snowfall totals to show that the storm track details matter. You can get a lot of snow or zero in a 2-week period. While the Lake Effect snowfall is pretty easy to predict — all you need is the cold air — the storm tracks through Texas, the Southeast, or Mid-Atlantic + Nor’easters is not predictable in 10-days+
Instead, we use the ensembles in order to build up a basket of scenarios to pull from and assign percentages.
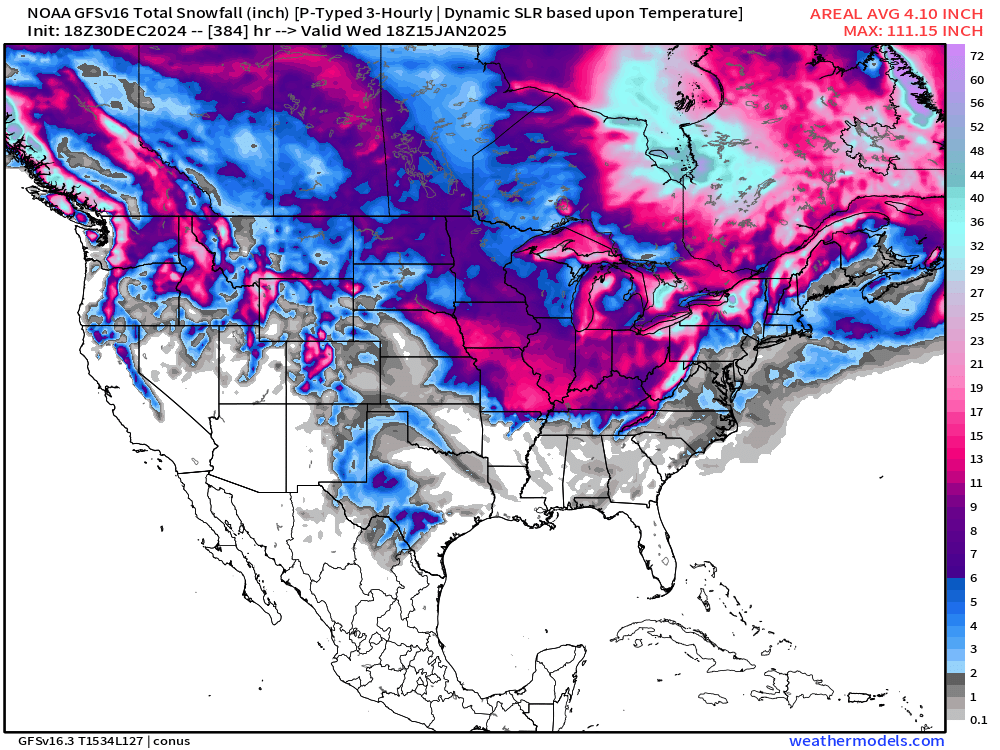
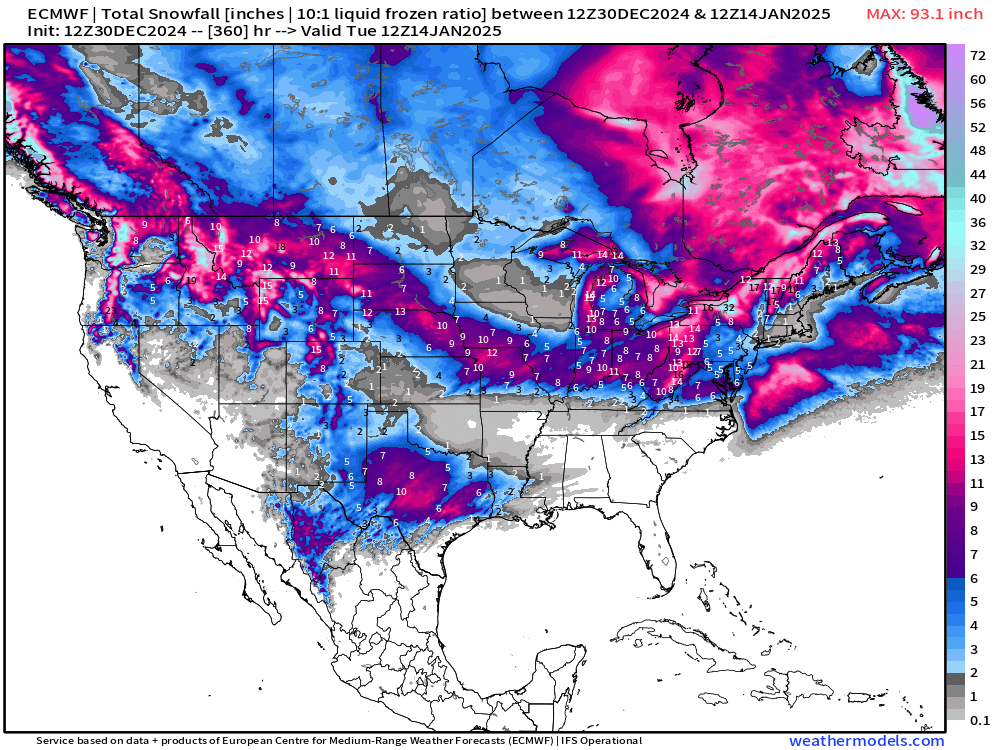
15-Days Ensemble Snowfall 50th Percentile Solution Through 15-days
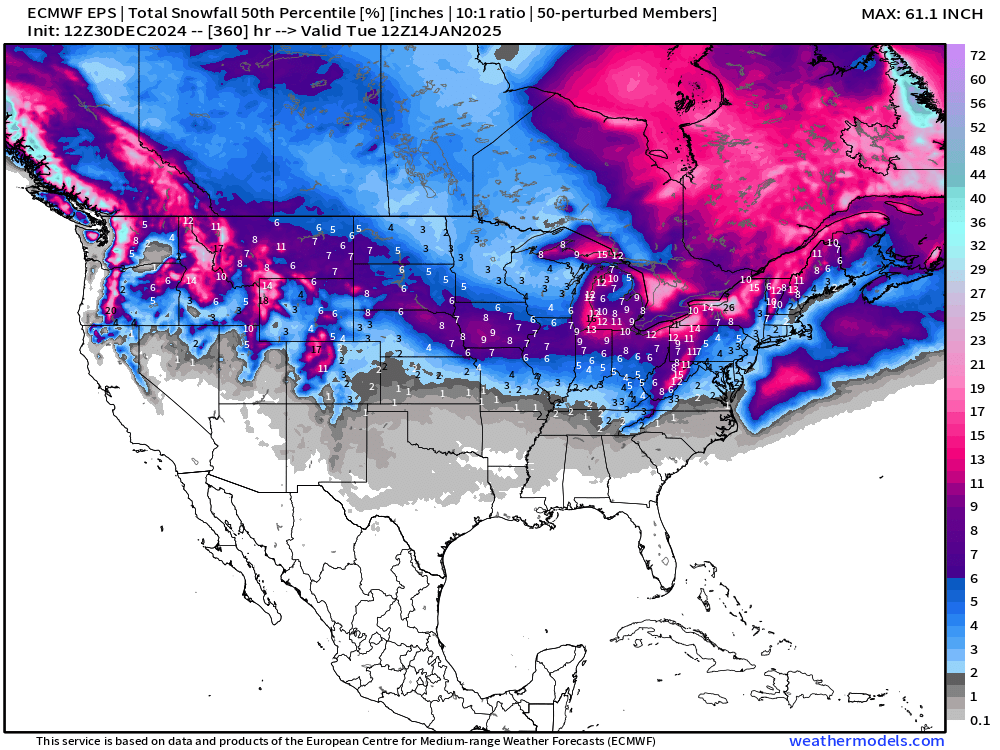
Best practice is to use Ensembles, sorted according to an event threshold for probability mapping!
Yes, there is a chance of non-zero snowfall over Florida, but it is small < 10%.
Probability in the next 15-days of at least 0.1-inch of snowfall
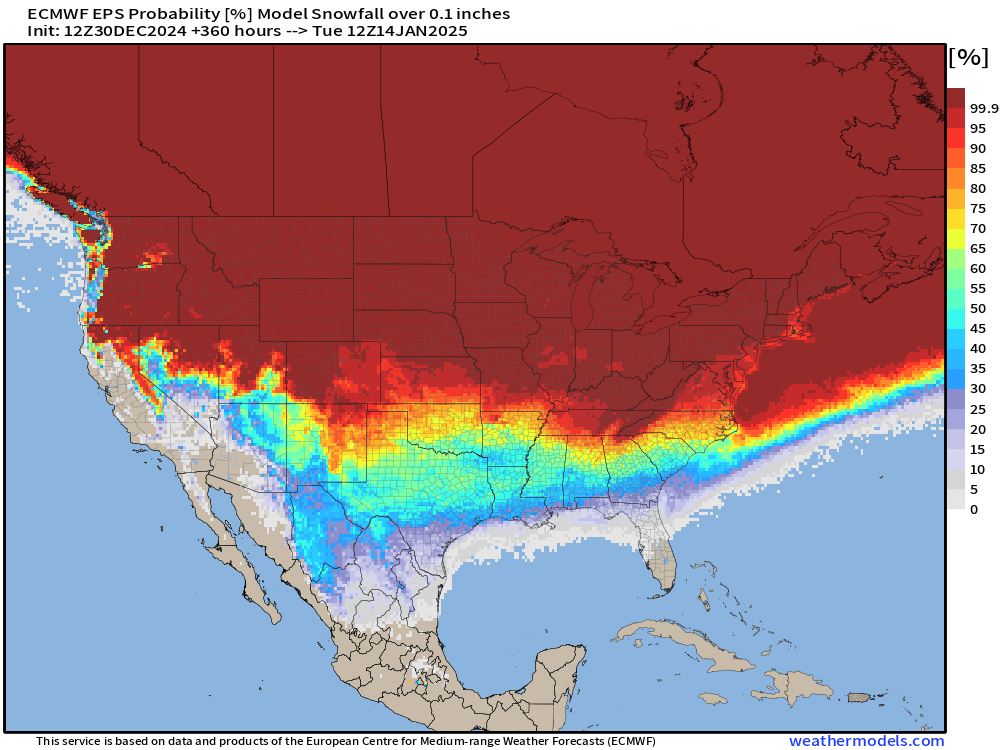
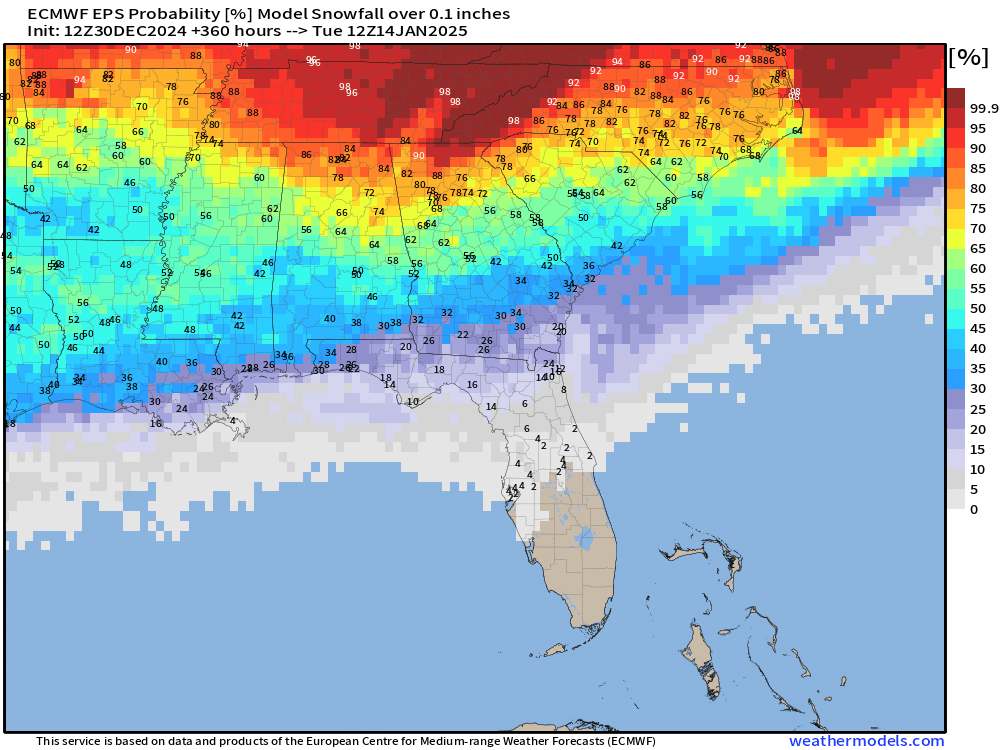
Ramp up to 6-inches to scan for major winter storms removes much of the high-probability zones, instead only leaving small chances < 5% across much of the map.
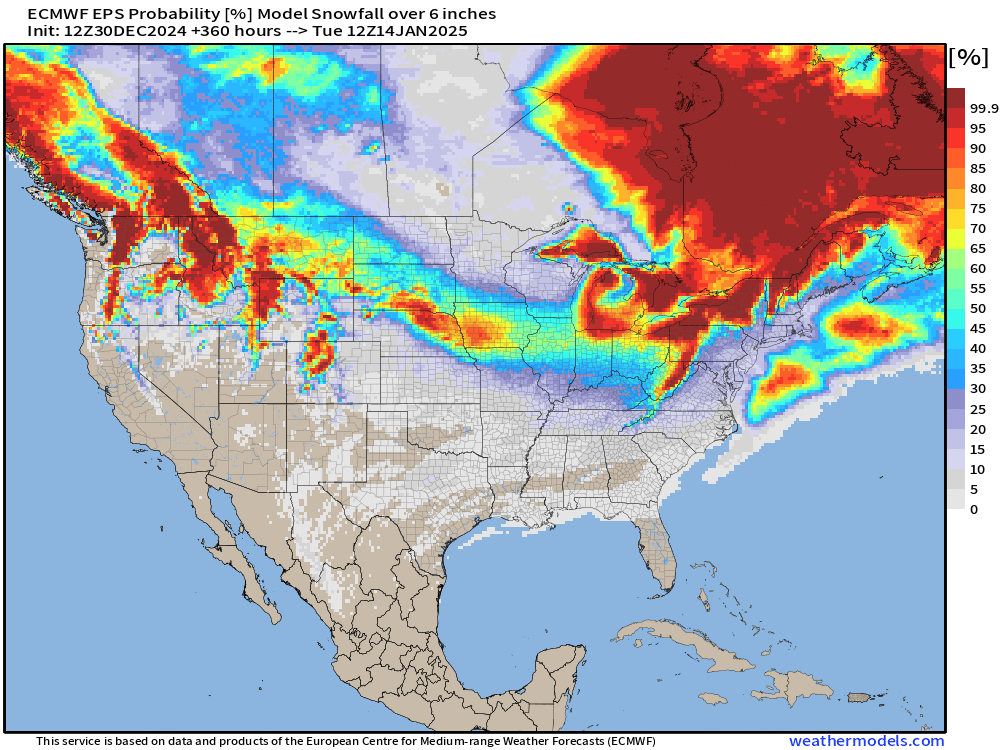
Of course, 1-inch in Atlanta is high-impact, but also need to consider time of day, and temperature context. These are details we cannot know 10-days out … so, we can only look at the overall pattern.
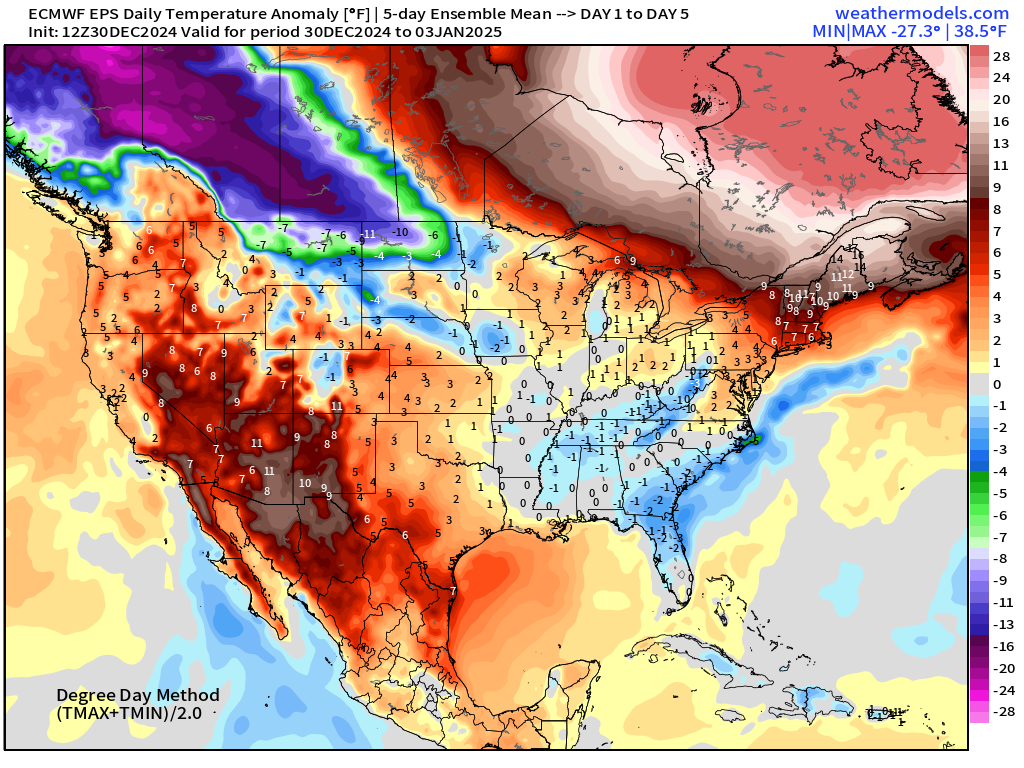
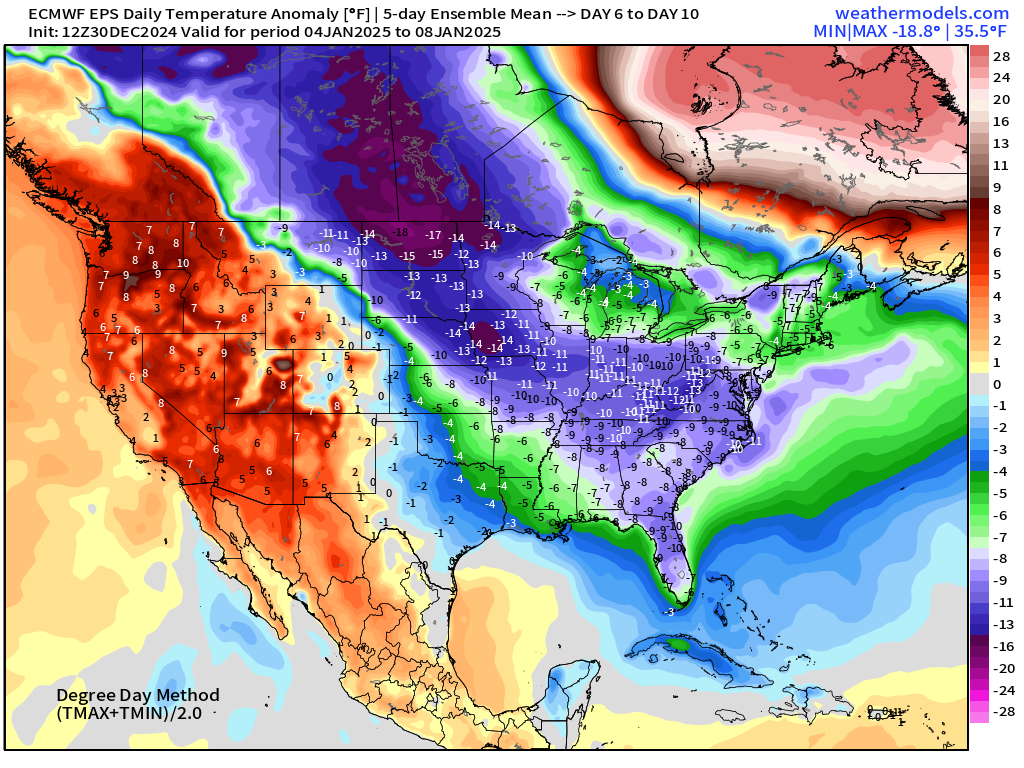
ECMWF EPS 12z | 5-Day Chunk Temperature Anomaly
Days 1-5: December 30 - January 3
Days 6-10: January 4 - January 8
Days 11-15: January 9 - January 13
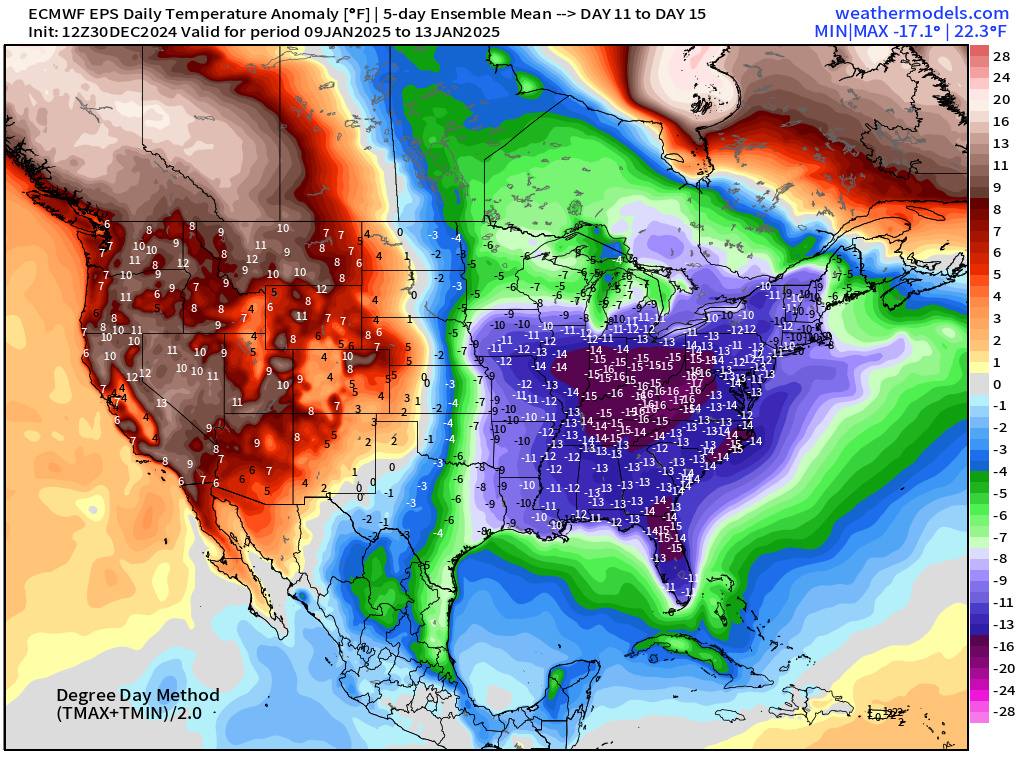
Very significant cold anomaly across Eastern U.S. with huge [relative] warmth out west.
Maps sourced from weathermodels.com designed and innovated by yours truly! Please subscribe there for real-time access to the newest maps, charts from all of the weather models including ECMWF.
For new followers coming from Substack, X, or friends, you’ll get daily updates of mainly Lower 48 weather including winter storms, heat waves, hurricanes, and now Arctic blast. The goal is to provide a “heads up” to impending extreme weather in the coming 1-2 weeks — medium range weather prediction. I use the best and most advanced Numerical Weather Prediction (NWP) systems including ECMWF ensembles, NOAA GFS, and the state-of-the-art A.I. systems.
Who writes and researchers this Newsletter? Dr. Ryan N. Maue [X https://x.com/ryanmaue] with 20-years experience of daily weather model production and analysis. You may have seen my weather maps! I live in Atlanta but was born and raised in Northern Michigan. I know snow, and southern heat and humidity.
- Milepost
- 477 · laid 2024-12-31T01:43:37.557000Z
- Source
- https://weather.substack.com/p/december-30-2024-monday-evening-winter
- Digest
- c69aef02d188d6010fb79453cd092e633de49ac2d2b9536e04b7418460e9fe06
- Machine
- JSON