December 30, 2024 Monday Severe Arctic Blast Watch
Models continue to produce extreme cold and snowy outcomes into second week of January
December 2024 was the 4th-warmest December in the 131-year national record (1895–2025), at 38.1°F against a 1991–2020 normal of 34.3°F (+3.8°F).
December 2024 was the 64th-driest December in the 131-year national record (1895–2025), at 2.4in against a 1991–2020 normal of 2.5in (-0.1in).
NOAA/NCEI Climate at a Glance, contiguous United States. This is the observed record for the month, not a score of anything said in this piece — the forecast ledger begins 2026-08-17 and cannot reach earlier posts.

For new followers coming from Substack, X, or friends, you’ll get daily updates of mainly Lower 48 weather including winter storms, heat waves, hurricanes, and now Arctic blast. The goal is to provide a “heads up” to impending extreme weather in the coming 1-2 weeks — medium range weather prediction. I use the best and most advanced Numerical Weather Prediction (NWP) systems including ECMWF ensembles, NOAA GFS, and the state-of-the-art A.I. systems.
Who writes and researchers this Newsletter? Dr. Ryan N. Maue [X https://x.com/ryanmaue] with 20-years experience of daily weather model production and analysis. You may have seen my weather maps! I live in Atlanta but was born and raised in Northern Michigan. I know snow, and southern heat and humidity.
Good Monday morning as 2024 comes to a close.
Weather Headlines for Monday
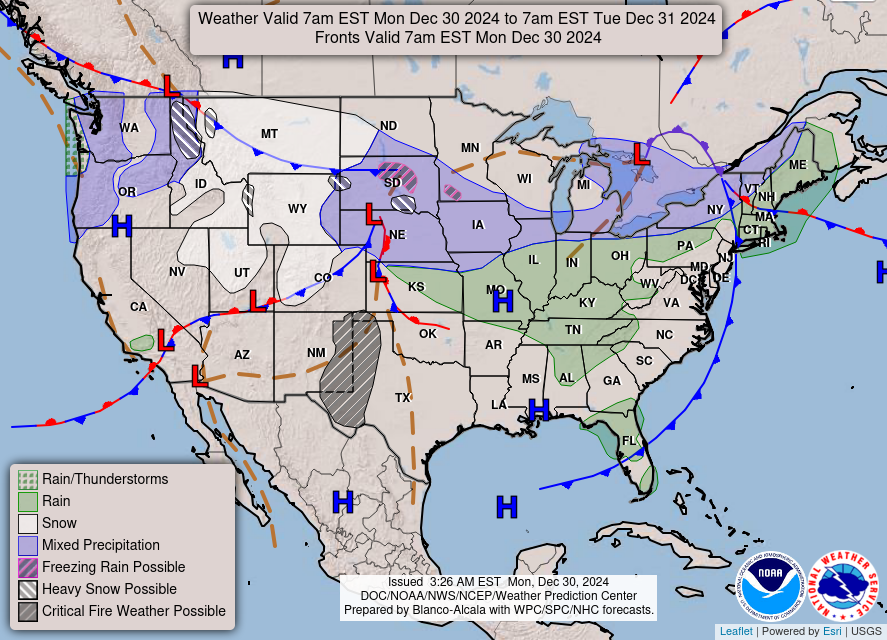
Storm system tracking through Nebraska and Iowa this afternoon with rainfall in the warm sector and some snowfall behind the cold front.
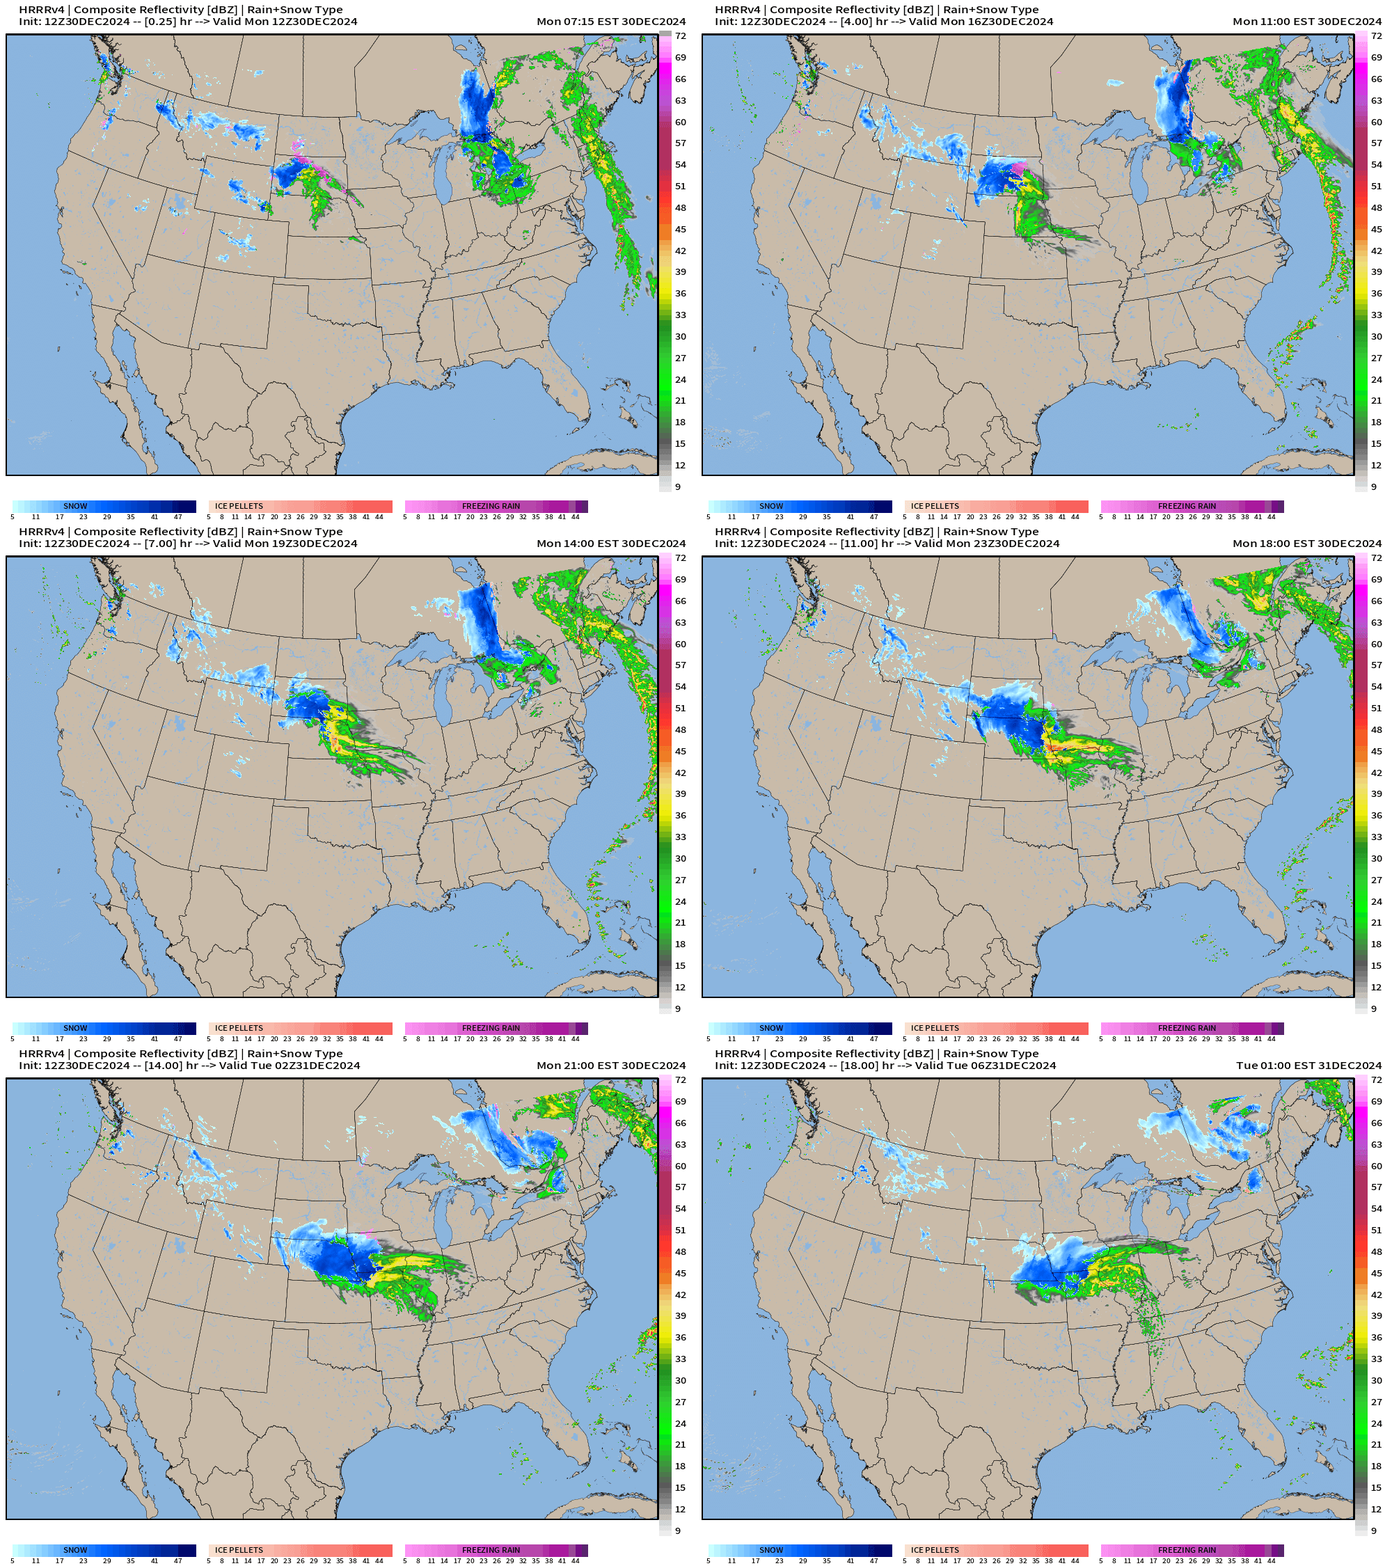
Radar Simulation Next 18-hours | Through 1 AM Tuesday
Temperature Anomaly (Ensemble Mean) next 15-days:
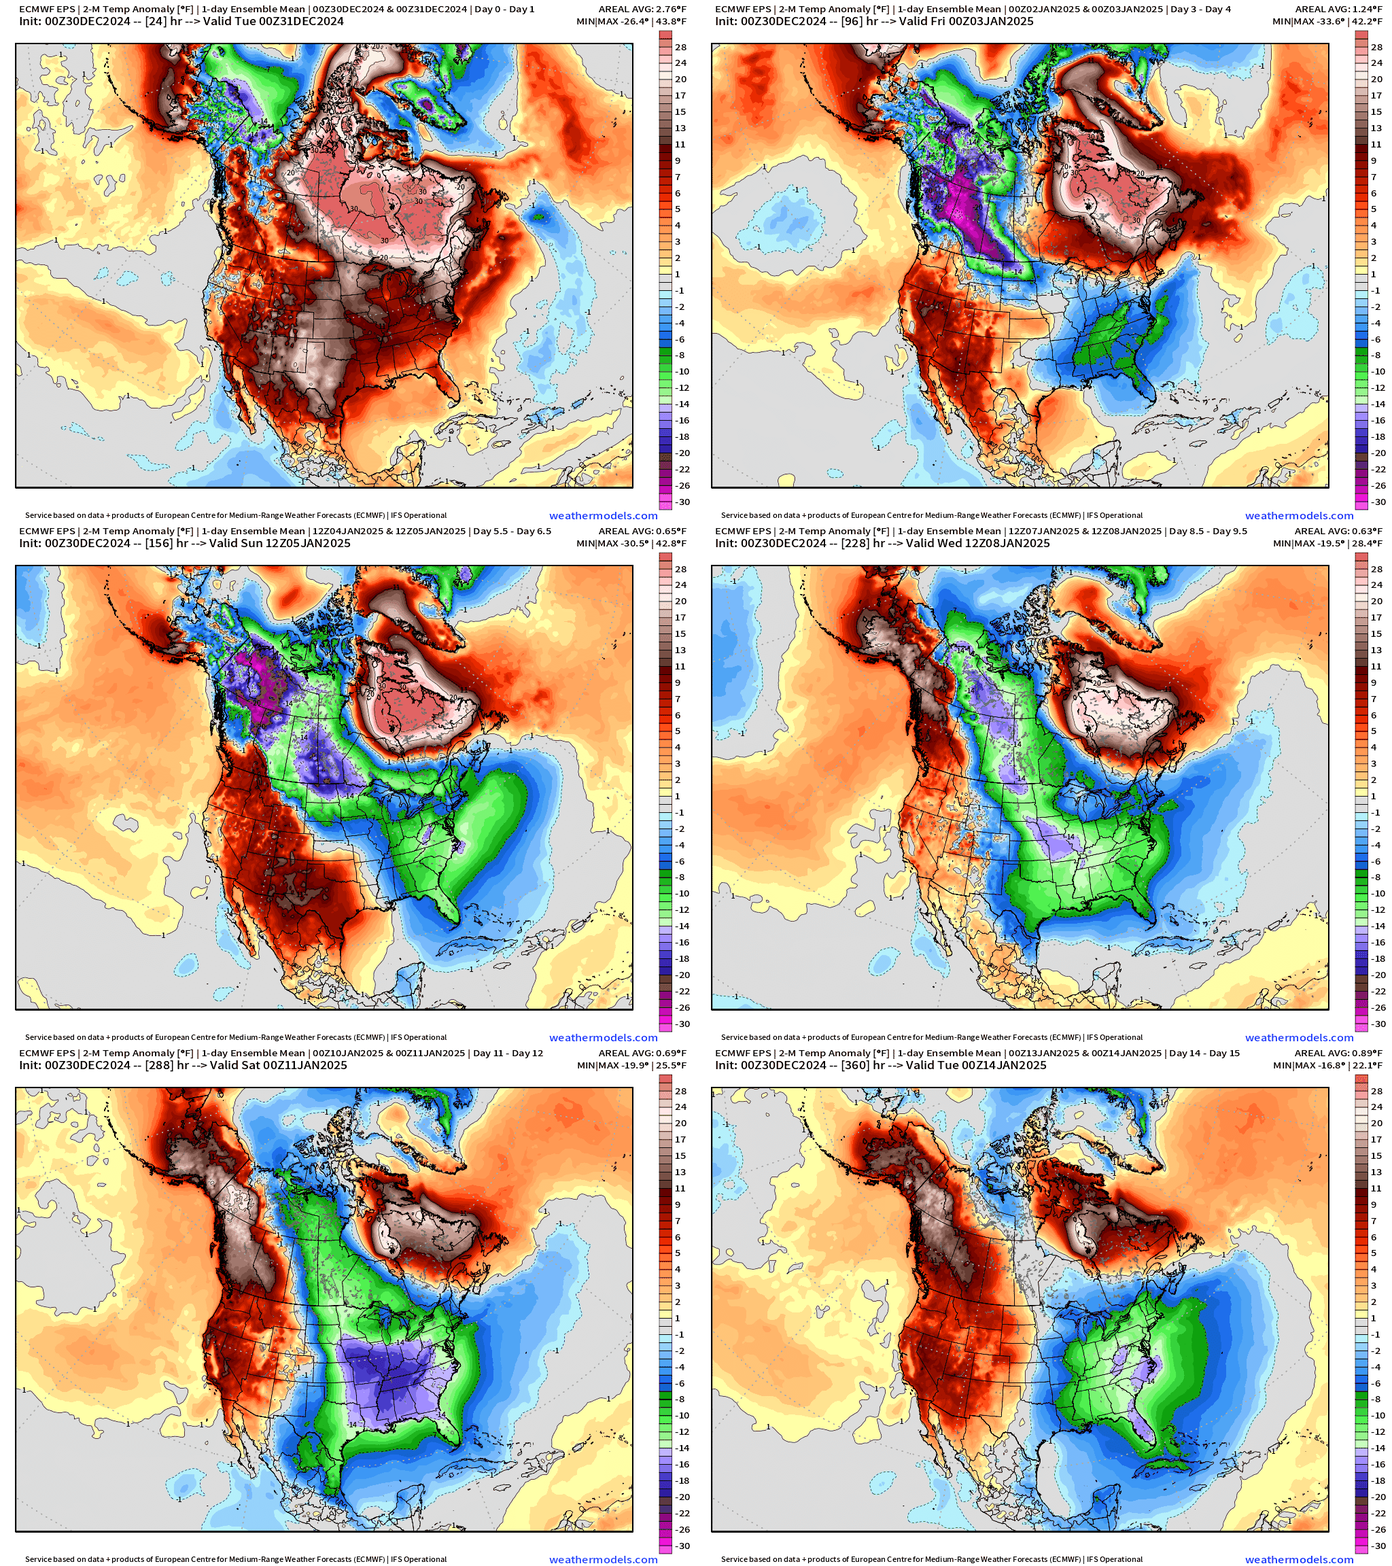
A Western Canada cold pool forms beneath strong high pressure over the next week, and breaks off into the Lower 48, but not entirely and all at once.
— An initial cold wave arrives this weekend.
— “Main Event” polar vortex plunge in the 10-12 day range more typical of extreme Arctic blasts e.g. January 2014.
Remaining uncertainty: it’s clear from all of the model guidance that an extended 7-10 period of much below average temperatures will affect mainly east of the Rockies. However, we cannot pinpoint the intensity and southern extent of the Canadian Arctic cold pool into the Lower 48 Southeast. Similarly, at the margin of the cold pool and warmer subtropical air masses, there is the potential for winter storm development. The variety of winter storm tracks, relation to warm/cold air, and time of day could mean all the difference between heavy snowfall in your location vs. dry weather. So, we can only make probabilistic forecasts after Day 7 — into Week 2 — to predict snowfall from blizzards.
8:45 AM ET Temperatures across the Lower 48
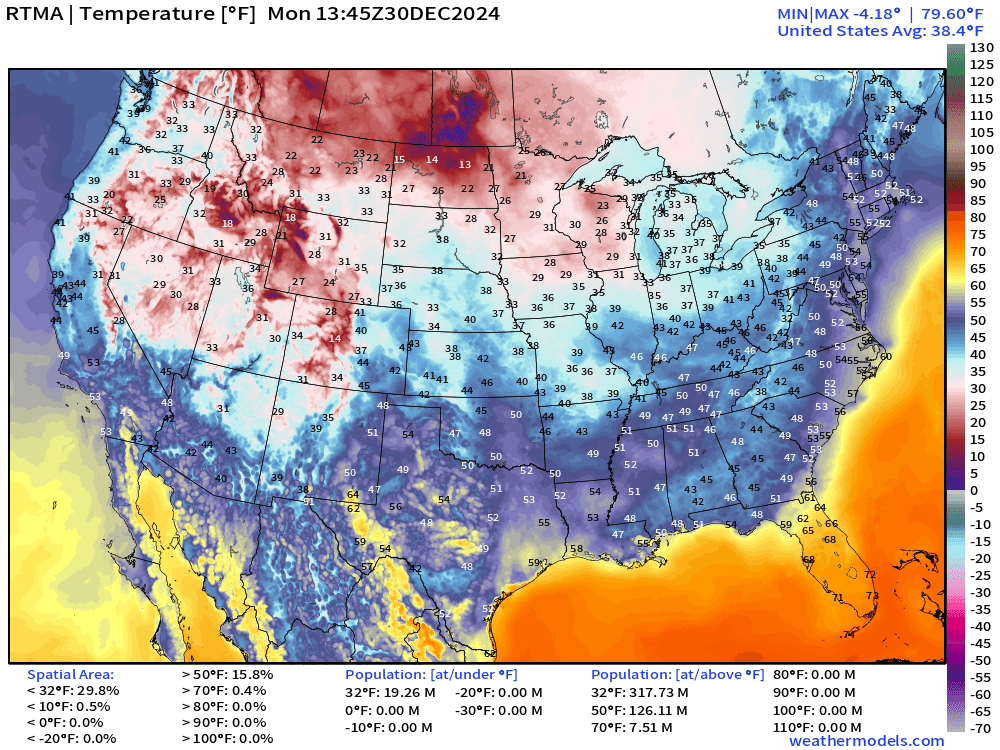
Very mild into New England with 50s in Boston — warmer than southern Alabama in the upper-30s.
Temperature Anomaly | 8:45 AM ET
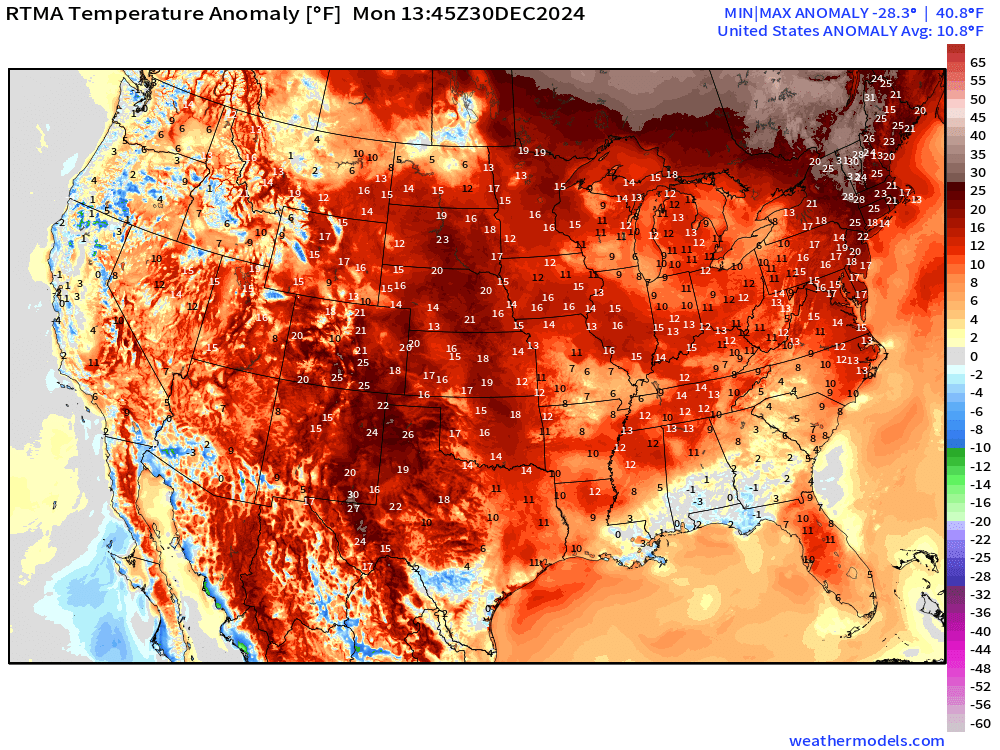
Overall the Lower 48 is still well above normal +10.8°F (above normal)
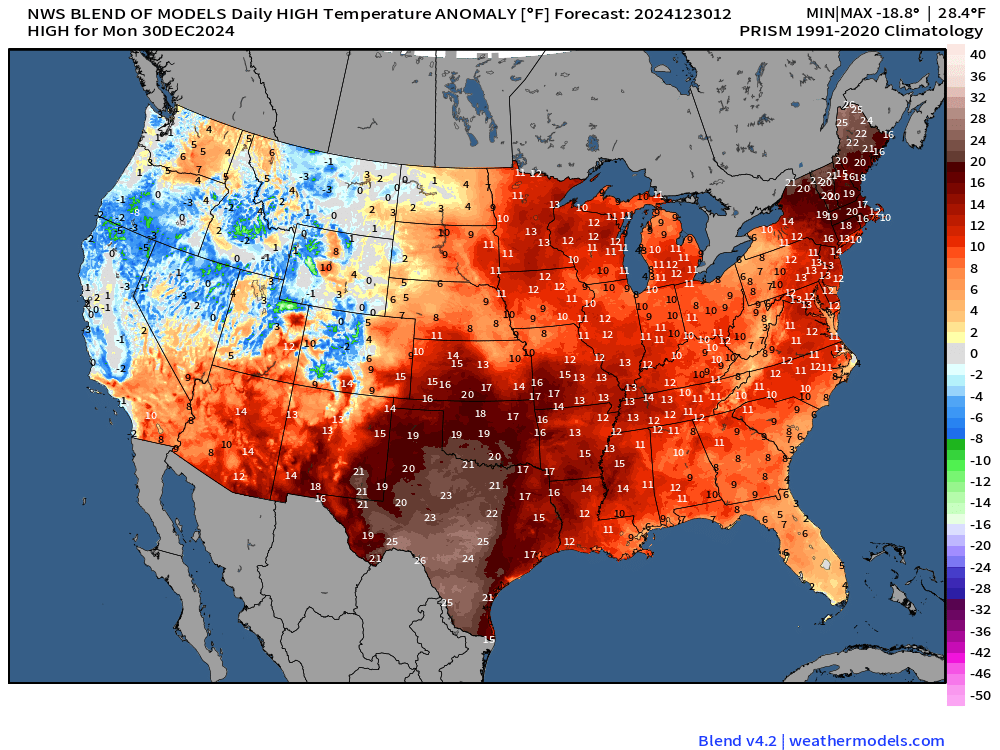
Monday High Temperatures and Anomaly
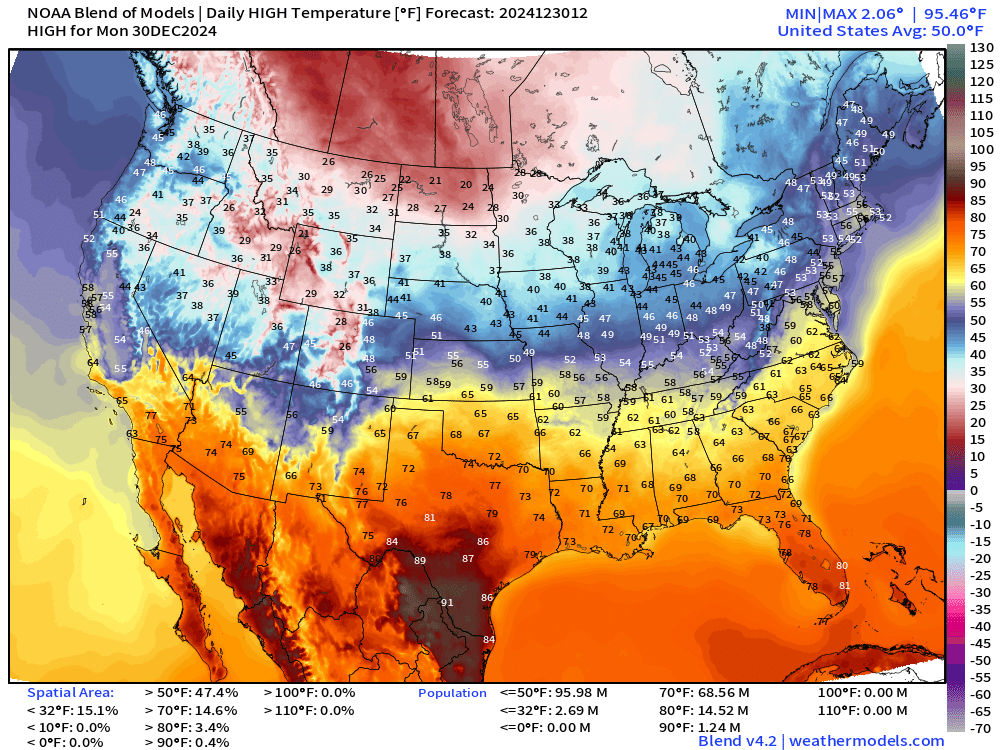
Average high temperature across Lower 48 is modeled to be exactly 50.0°F with 90s in South Texas — 1.25 million population. Amazing. 14.5 Million at/above 80°F including Texas and Florida.
Tuesday Low Temperatures
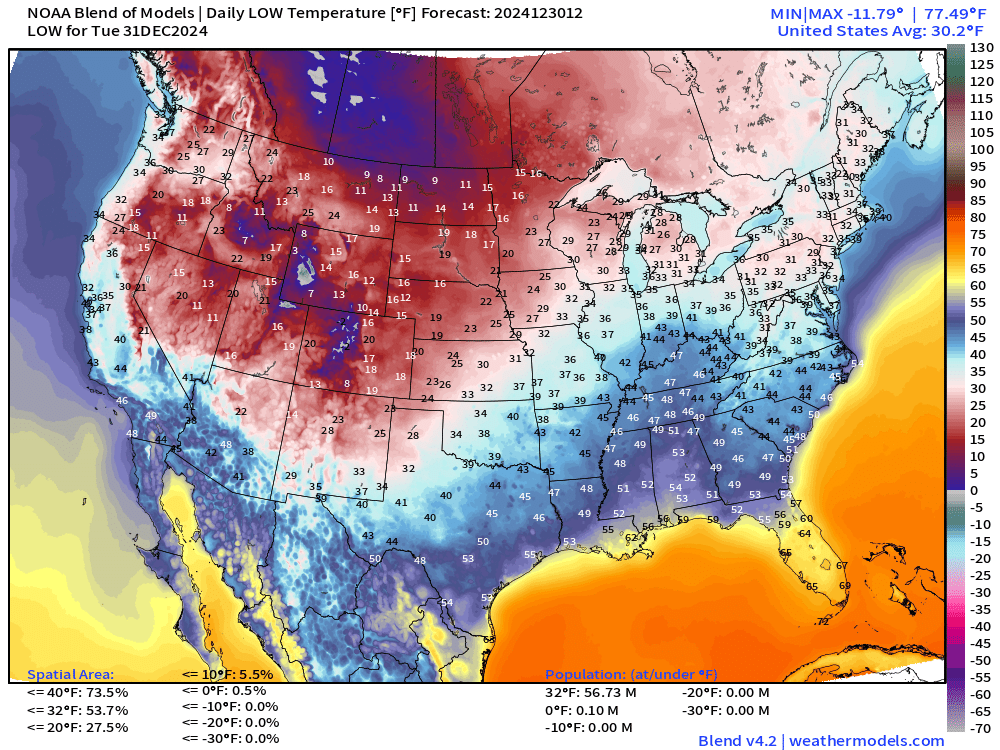
While 53% of the Lower 48 by area is below freezing, only 57 million population live there.
Upcoming Weather Systems | Winter Storms
ECMWF 00z precipitation type and MSLP next 8-days
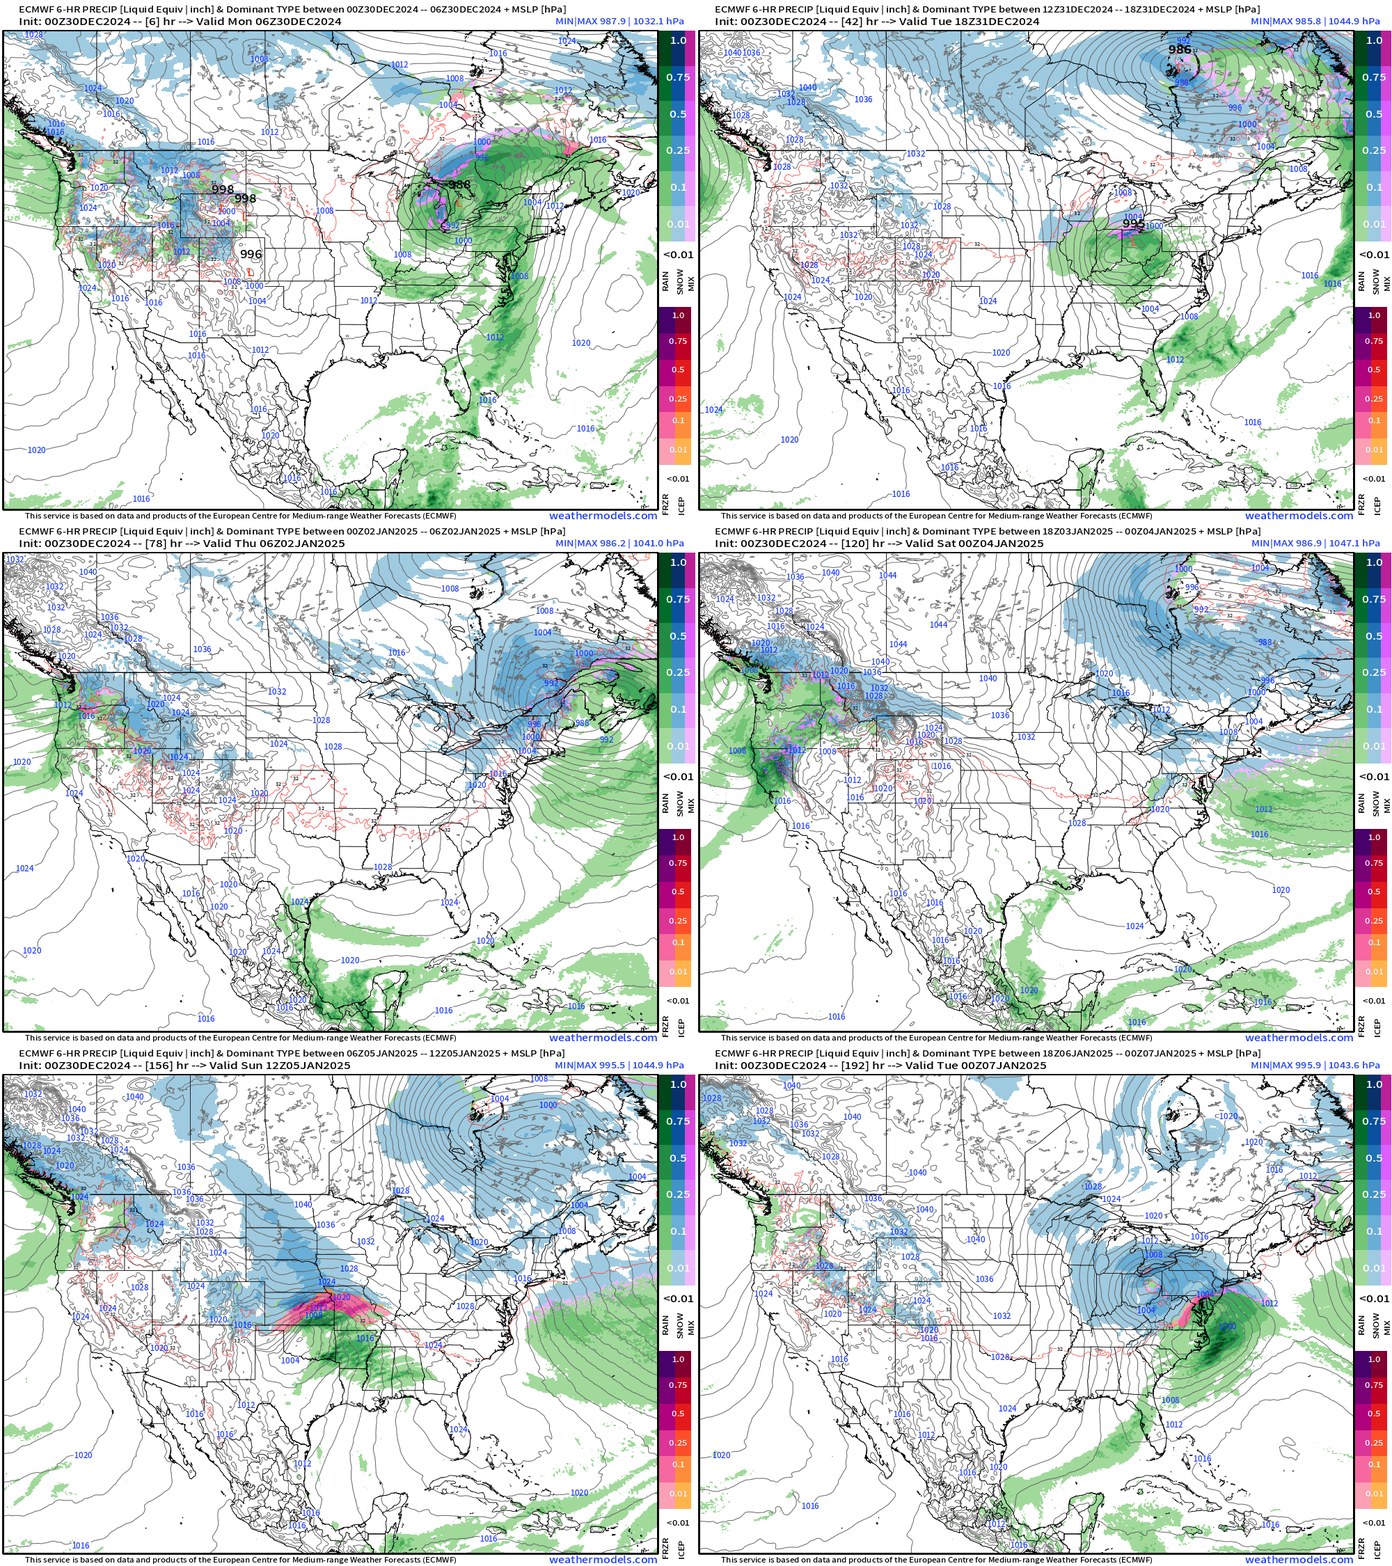
Today (Monday): Winter storm moves into Quebec with rain moving through Northeast
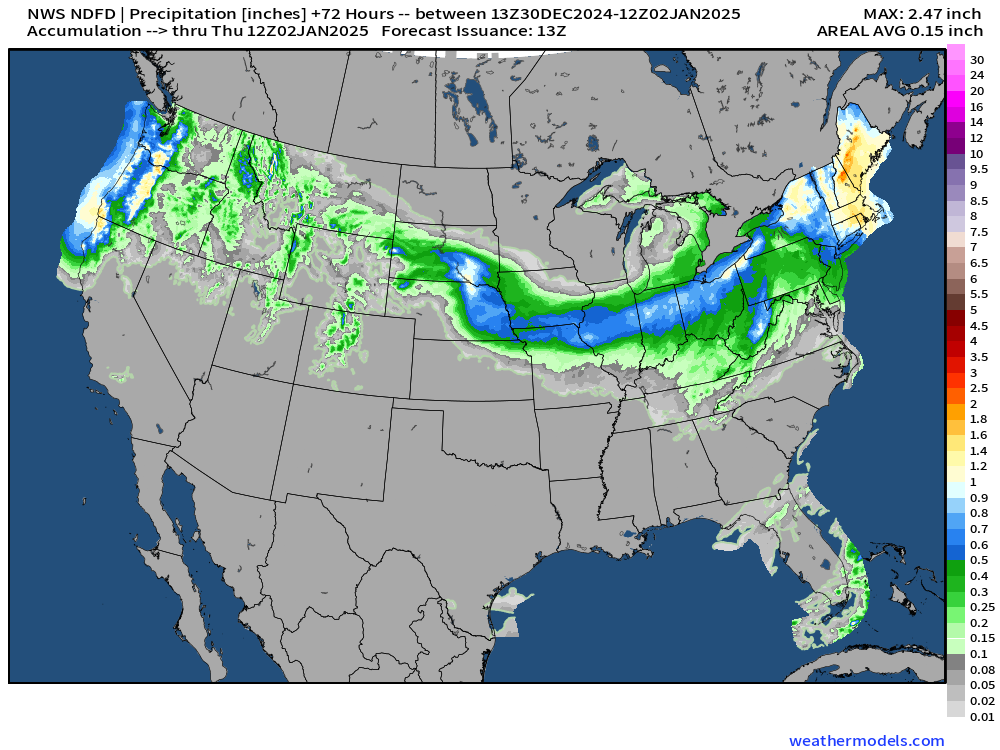
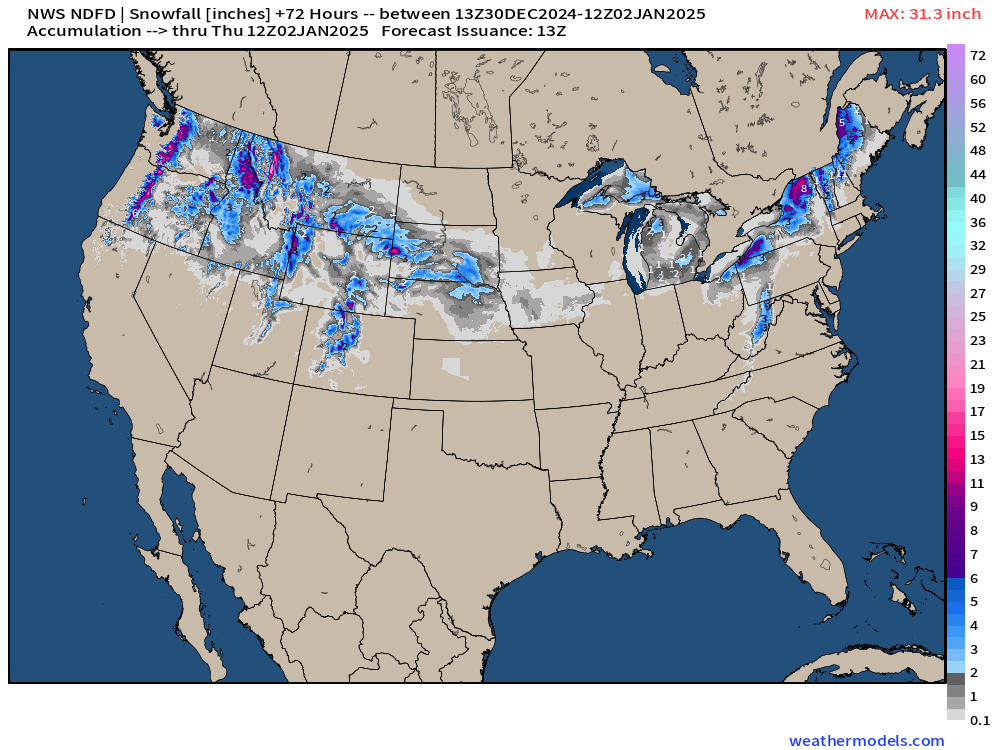
Today into Thursday: Winter storm tracks from Iowa into eastern Great Lakes, New England and then, again Quebec. Mainly rain in the warm sector, but some snowfall on the backside.
Major winter storm gathers as Colorado Lee low pressure system Sunday with potential for significant impacts into following week.
NWS | Total Precipitation Next 72-hours
NWS | Total Snowfall Next 72-hours
Total Precipitation next 7-Days | NOAA WPC
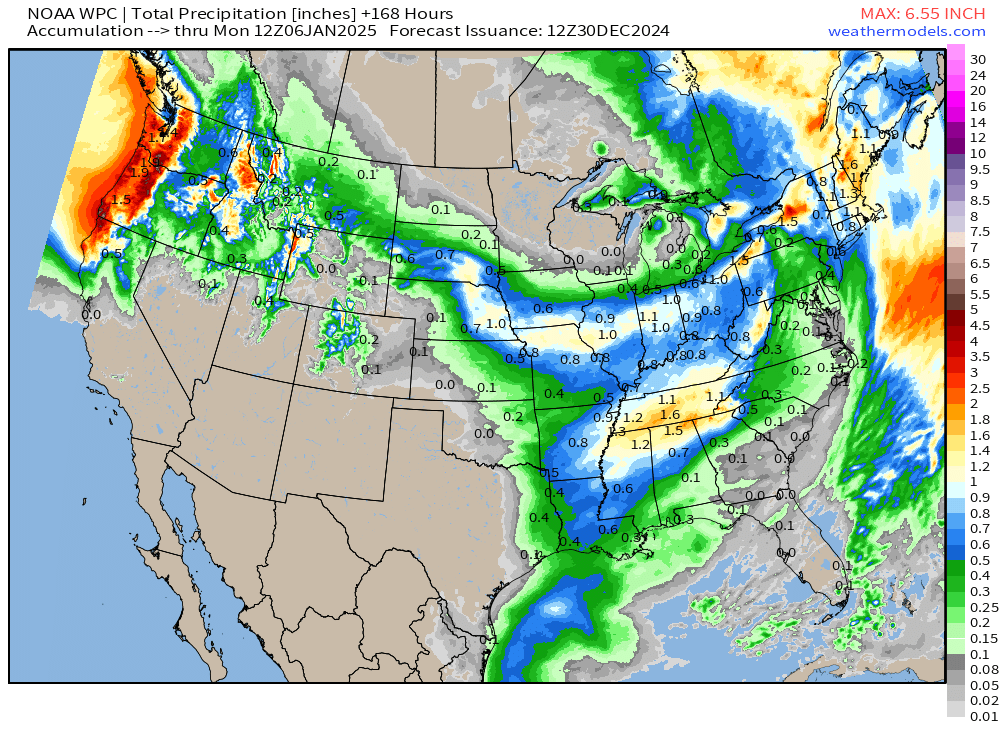
Pacific Northwest continues to see abundant moisture from atmospheric rivers, and enough of the remaining precipitable water does cross into the Rockies, and into the eastern U.S.
Upper-Level Height Anomaly Pattern | Next 15-days AIFS 00z
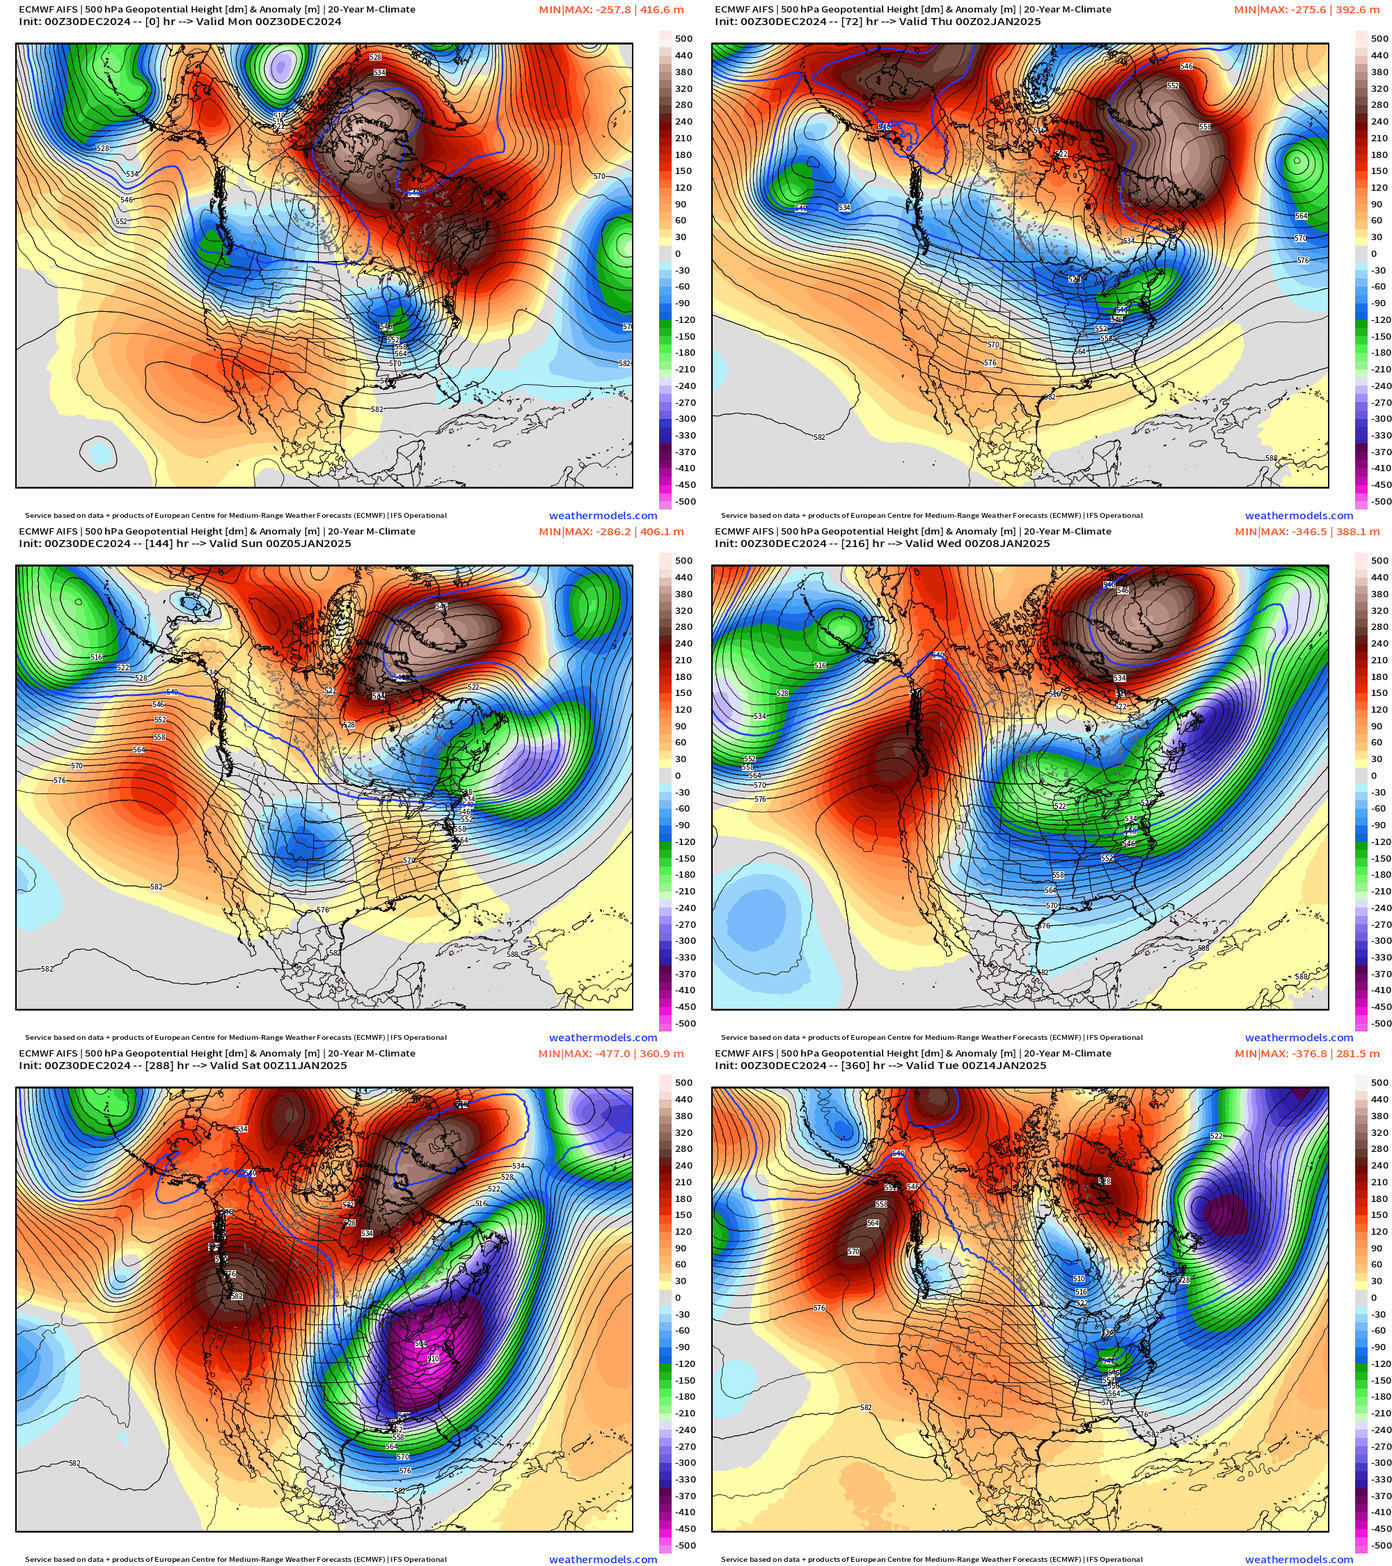
Choosing to show the animation of the ECMWF AIFS model since it has been more consistent than ECMWF HRES and NOAA GFS (deterministic) on the intensity of the “polar vortex” trough over the Eastern U.S. peaking at Day 12.
Synoptic variability: With so many moving parts e.g. Pacific ridge extending from California to Alaska, blocking over Greenland, and corridor for southward extension of tropospheric polar vortex, subtle timing or spatial changes in any of them could generate a much different sensible weather outcome in your location.
Plus, surface lows leading to rapid cyclogenesis — or bomb cyclone development — would also intensify the 500 mb trough by phasing the lower, mid, and upper-level circulations into a powerful extreme weather machine.
So, to judge the trend of cold of the upcoming extreme cold event, we look at the change in Ensemble Weekly Temperature Anomaly of Days 7-14 (Week 2) comparing the most recent 00z run with yesterday’s 12z cycle.
This “delta-temperature” map when integrated over a 1-week period digests a lot of underlying synoptic variability with 51 ensembles into a “pattern change recognition” map.
Easy to see colder over Western U.S. and Canada centered over Hudson Bay, but much warmer over Alaska.
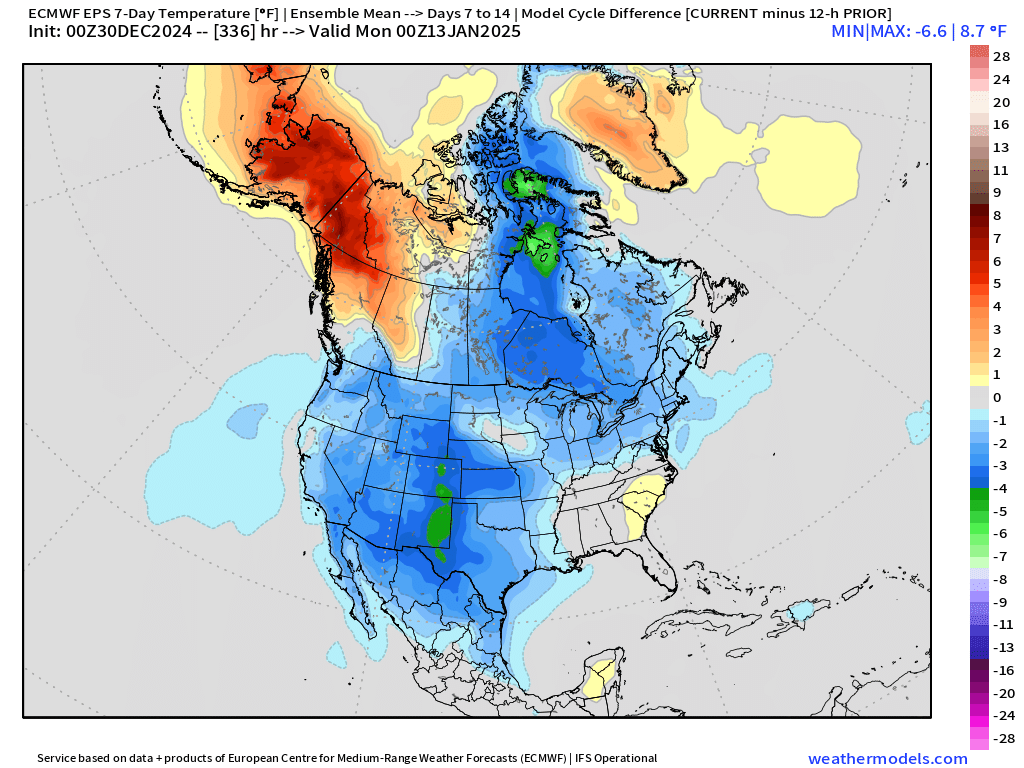
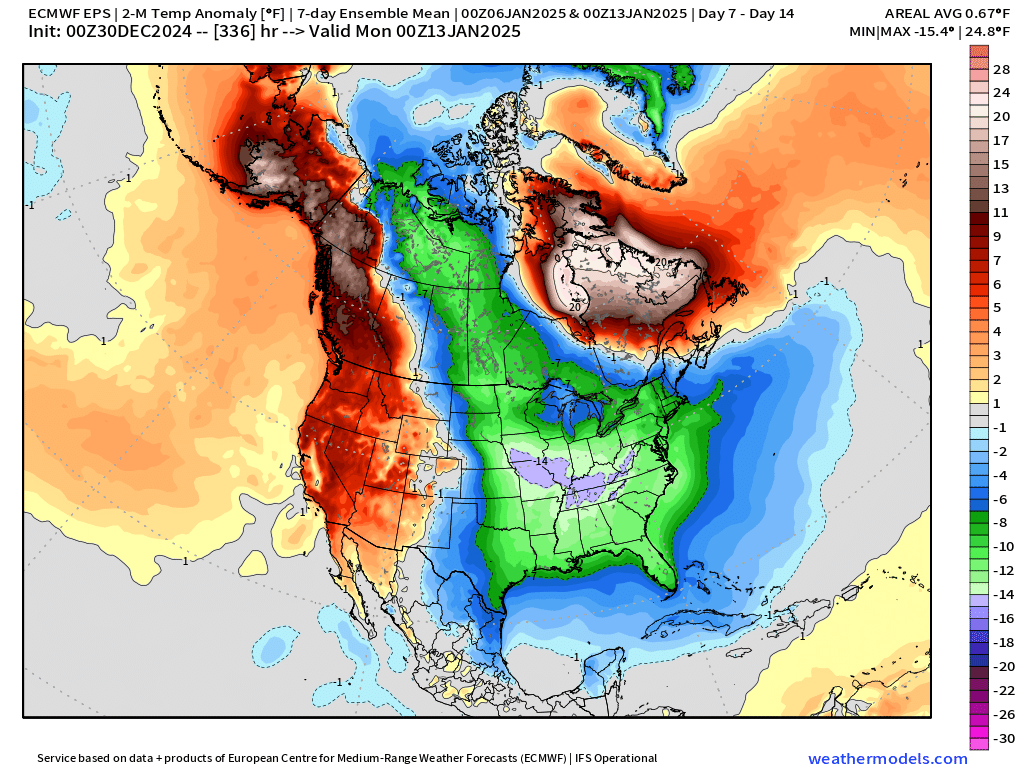
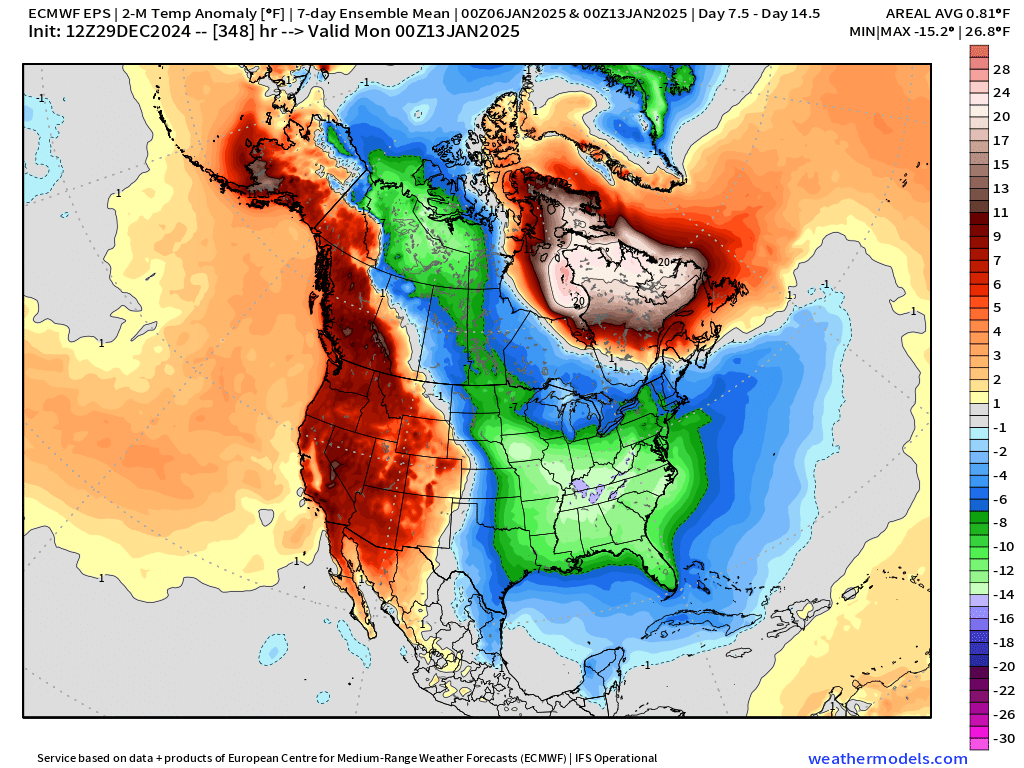
Those temperature changes might be difficult to see from the individual Weekly Ensemble temperature maps:
Current 00z ECMWF EPS Week 2
Previous 12Z ECMWF EPS Week 2
Another comparison between synoptic variability and ensemble means: 850 mb Temperature Anomaly (Barney maps) with ECMWF/GFS on top, and EPS/GEFS ensemble on bottom row.
You’ll always see stronger/deeper anomaly with the deterministic models like ECMWF HRES, and NOAA GFS, because ensembles are smoothing similar forecasts of the extreme event but slightly displaced in time and space.
Extreme Weather | Winter Storm Outcomes
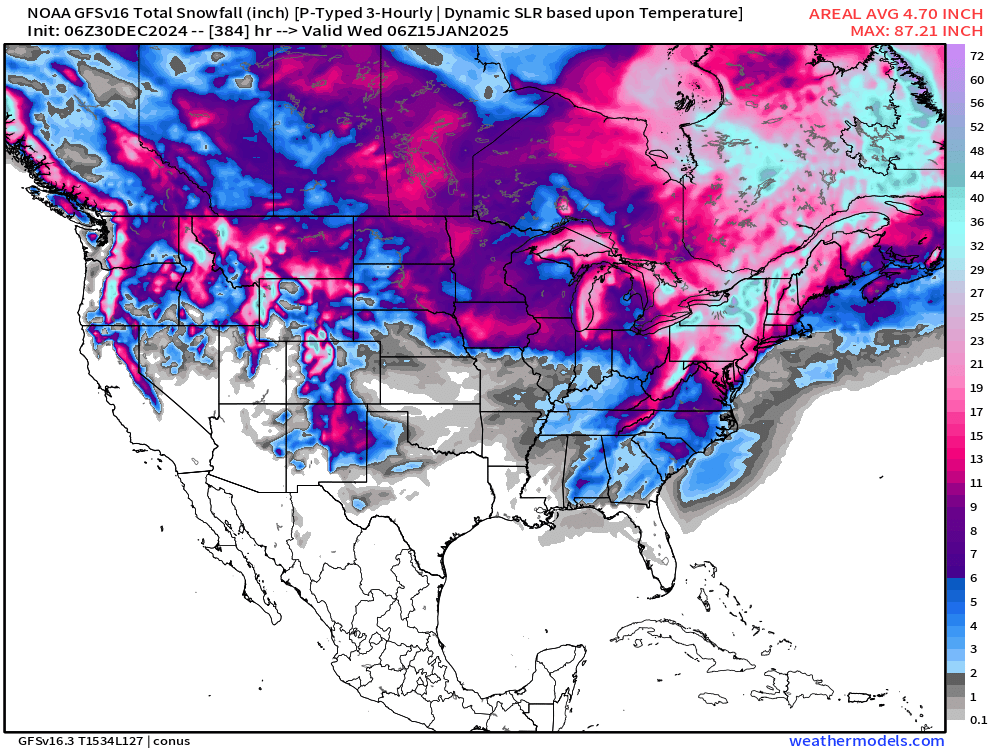
In the longer range past Day 10, plenty of opportunity for a Miller Type A blizzard or Nor’easter, like GFS 06z shows at Day 12.
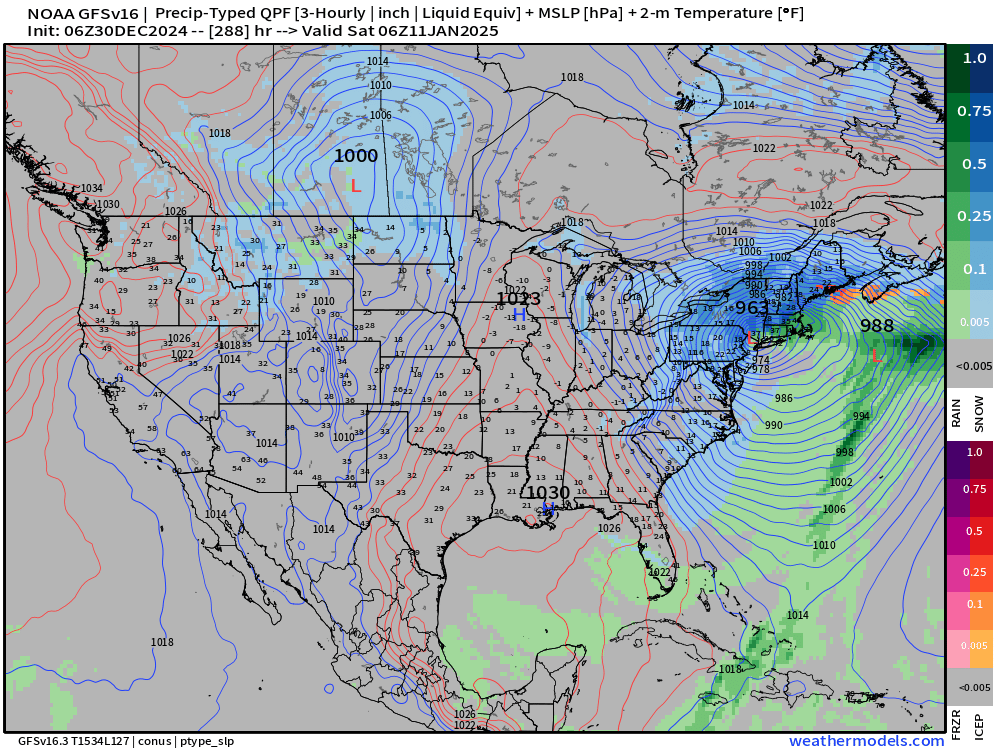
Total snowfall from GFS 06z is extreme for New York.
But, if we look at the same style map from the ECMWF HRES 00z through 15-days, we see a winter storm at Day 10.5 over Texas.
We could look at 40 forecast cycles and 2,000 ensembles over the next 10-days and find winter storms in every conceivable location from Texas to Florida.
BUT this is not a “forecast” but only a scenario or possible outcome in today’s climate with upper-level circulation or wave pattern. That’s all. Don’t get too excited but remain cognizant of the risk versus what you know from history or climatology.
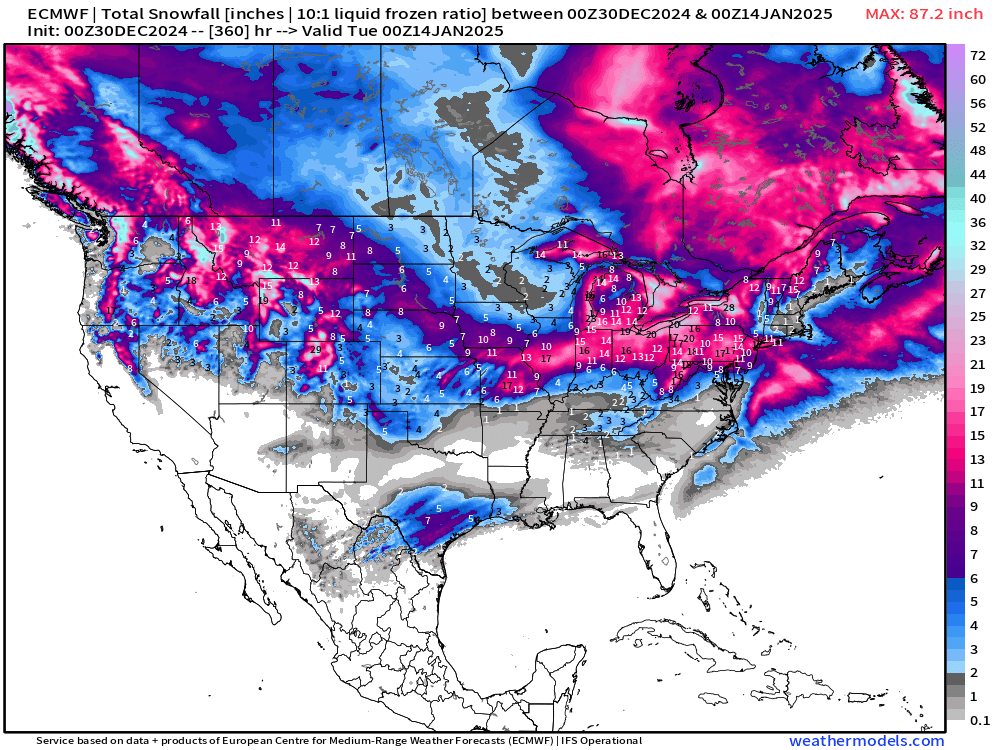
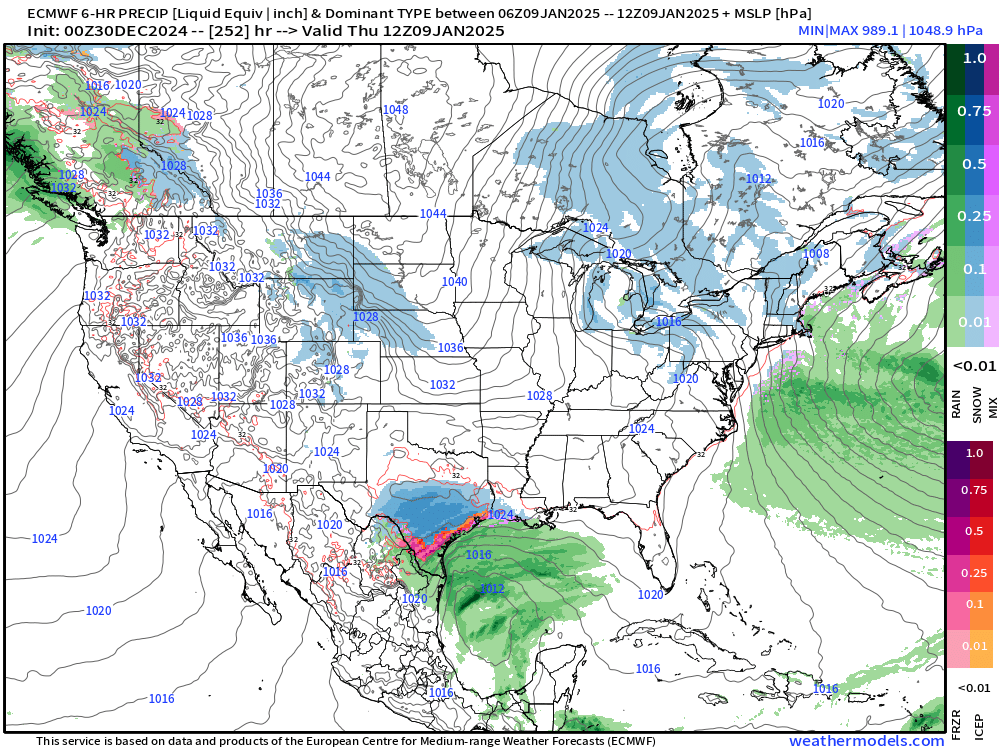
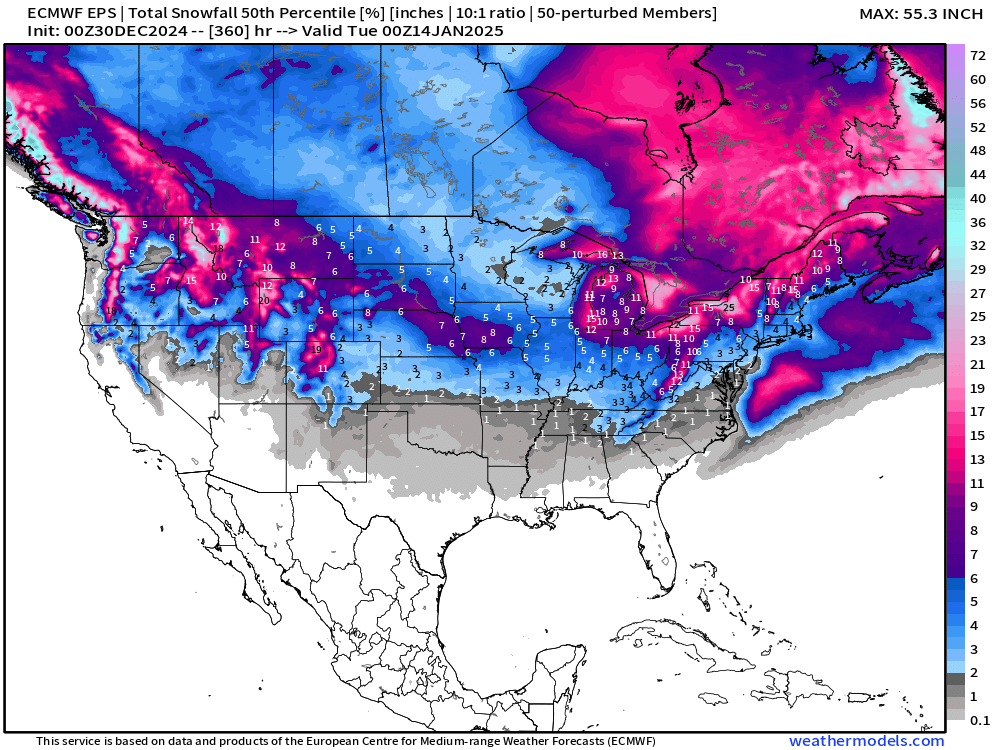
15-Days Ensemble Snowfall 50th Percentile Solution Through 15-days
Best practice is to use Ensembles, sorted according to an event threshold for probability mapping!
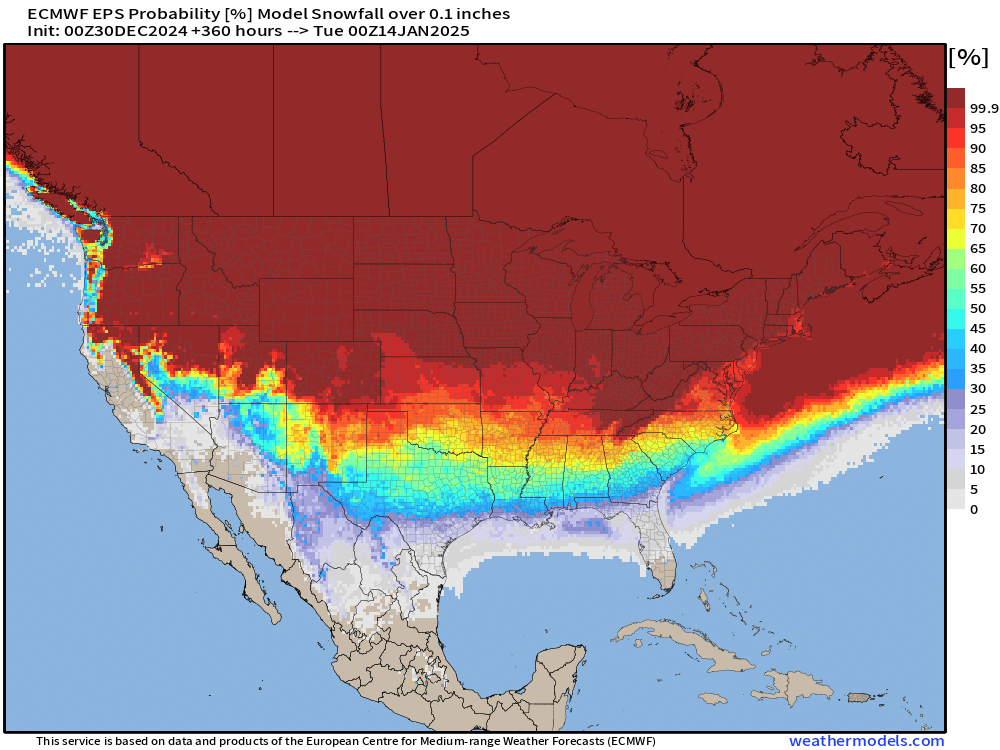
Yes, there is a chance of non-zero snowfall over Florida, but it is small < 10%.
Probability in the next 15-days of at least 0.1-inch of snowfall
Chance of “any snowfall” in next 15-days.
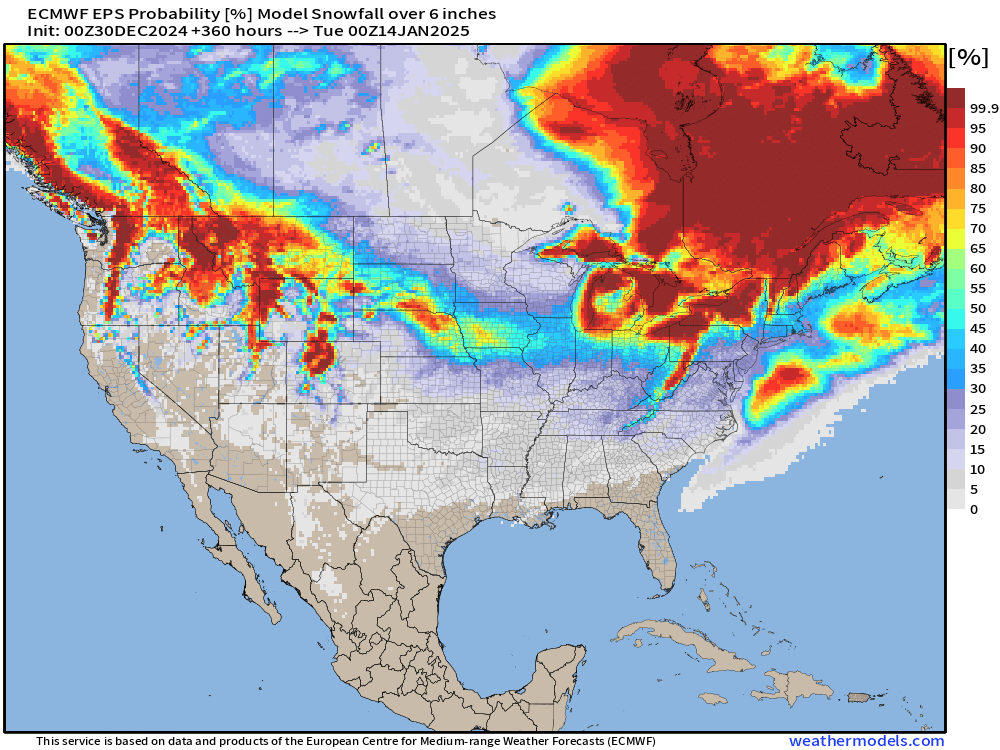
Ramp up to 6-inches to scan for major winter storms removes much of the high-probability zones, instead only leaving small chances < 5% across much of the map.
Of course, 1-inch in Atlanta is high-impact, but also need to consider time of day, and temperature context. These are details we cannot know 10-days out … so, we can only look at the overall pattern.
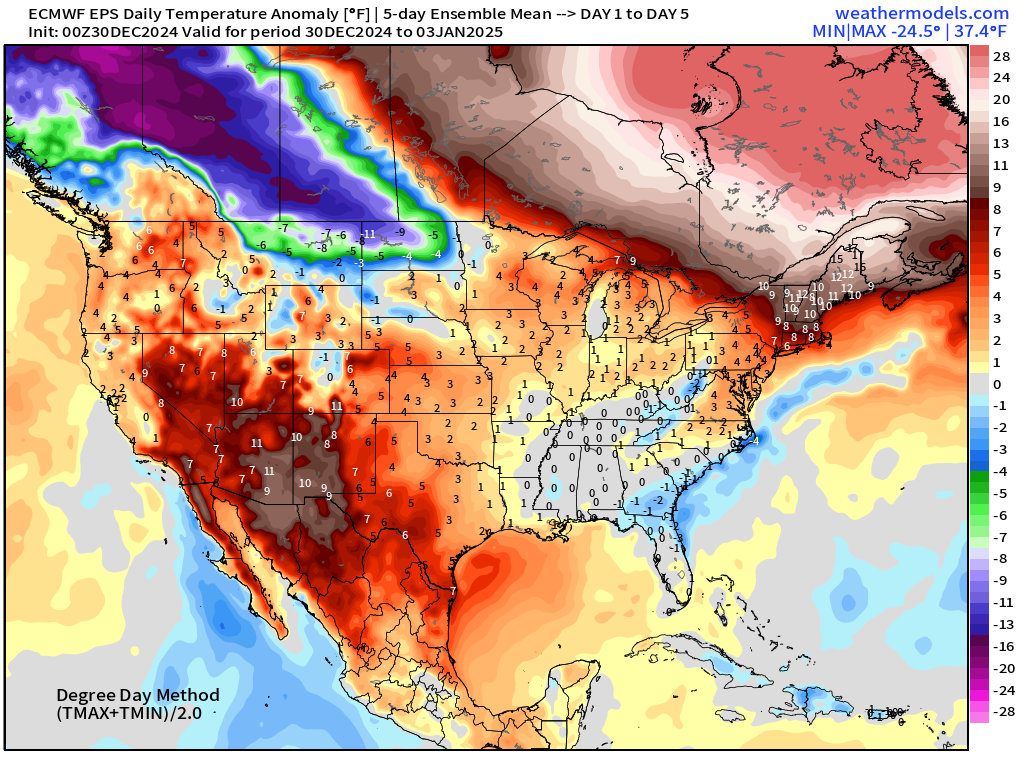
ECMWF EPS 00z | 5-Day Chunk Temperature Anomaly
Days 1-5: December 30 - January 3
Days 6-10: January 4 - January 8
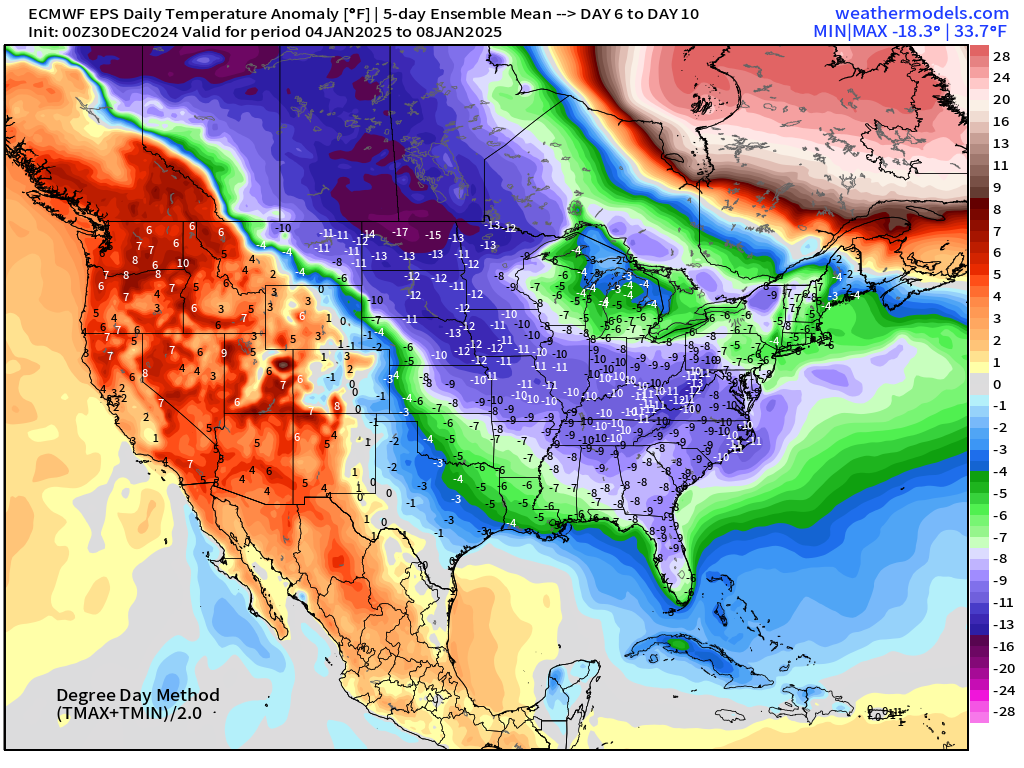
Very cold over Western Canada — poised to dump into the Lower 48 for 2nd week of January.
Days 11-15: January 9 - January 13
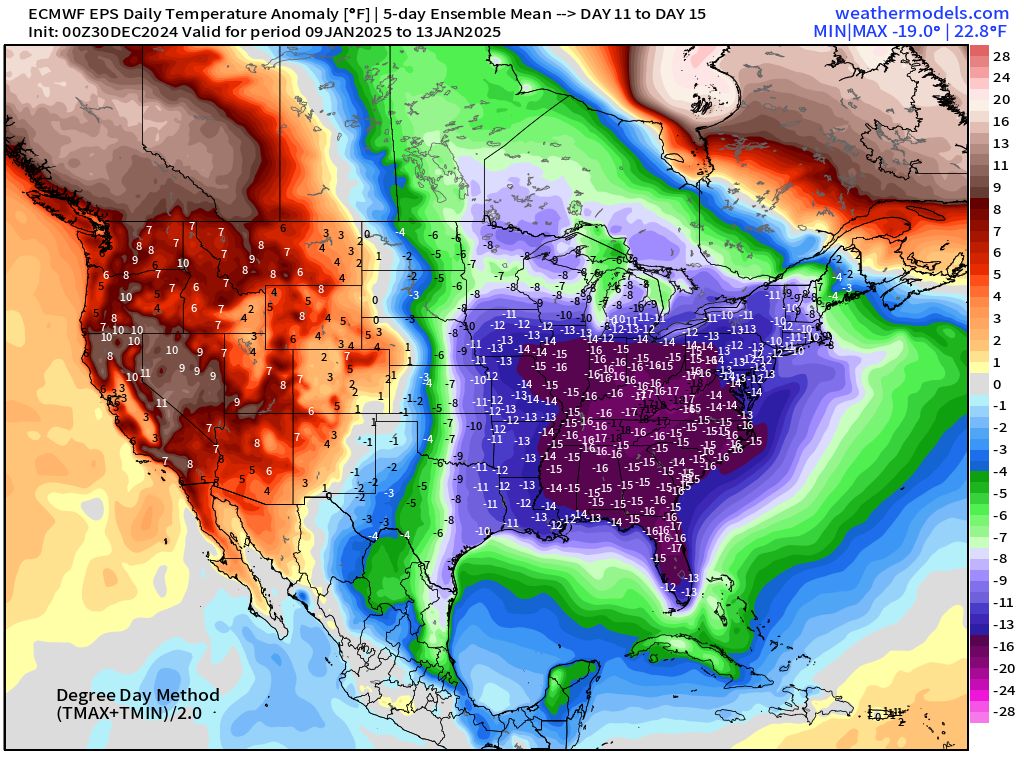
Very significant cold anomaly across Eastern U.S. with [relative] warmth out west.
Maps sourced from weathermodels.com designed and innovated by yours truly! Please subscribe there for real-time access to the newest maps, charts from all of the weather models including ECMWF.
- Milepost
- 476 · laid 2024-12-30T14:55:43.343000Z
- Source
- https://weather.substack.com/p/december-30-2024-monday-severe-arctic
- Digest
- 238e36423b1bfae132fe5715b3b0dbdcb0a5ac62214ee24b1b8f0553b088011c
- Machine
- JSON