July 24, 2024 Wednesday Update
Atlantic tropics starting to wake up
July 2024 was the 12th-warmest July in the 132-year national record (1895–2026), at 75.7°F against a 1991–2020 normal of 74.4°F (+1.3°F).
July 2024 was the 21st-wettest July in the 132-year national record (1895–2026), at 3.1in against a 1991–2020 normal of 2.9in (+0.2in).
NOAA/NCEI Climate at a Glance, contiguous United States. This is the observed record for the month, not a score of anything said in this piece — the forecast ledger begins 2026-08-17 and cannot reach earlier posts.

Wednesday Headlines
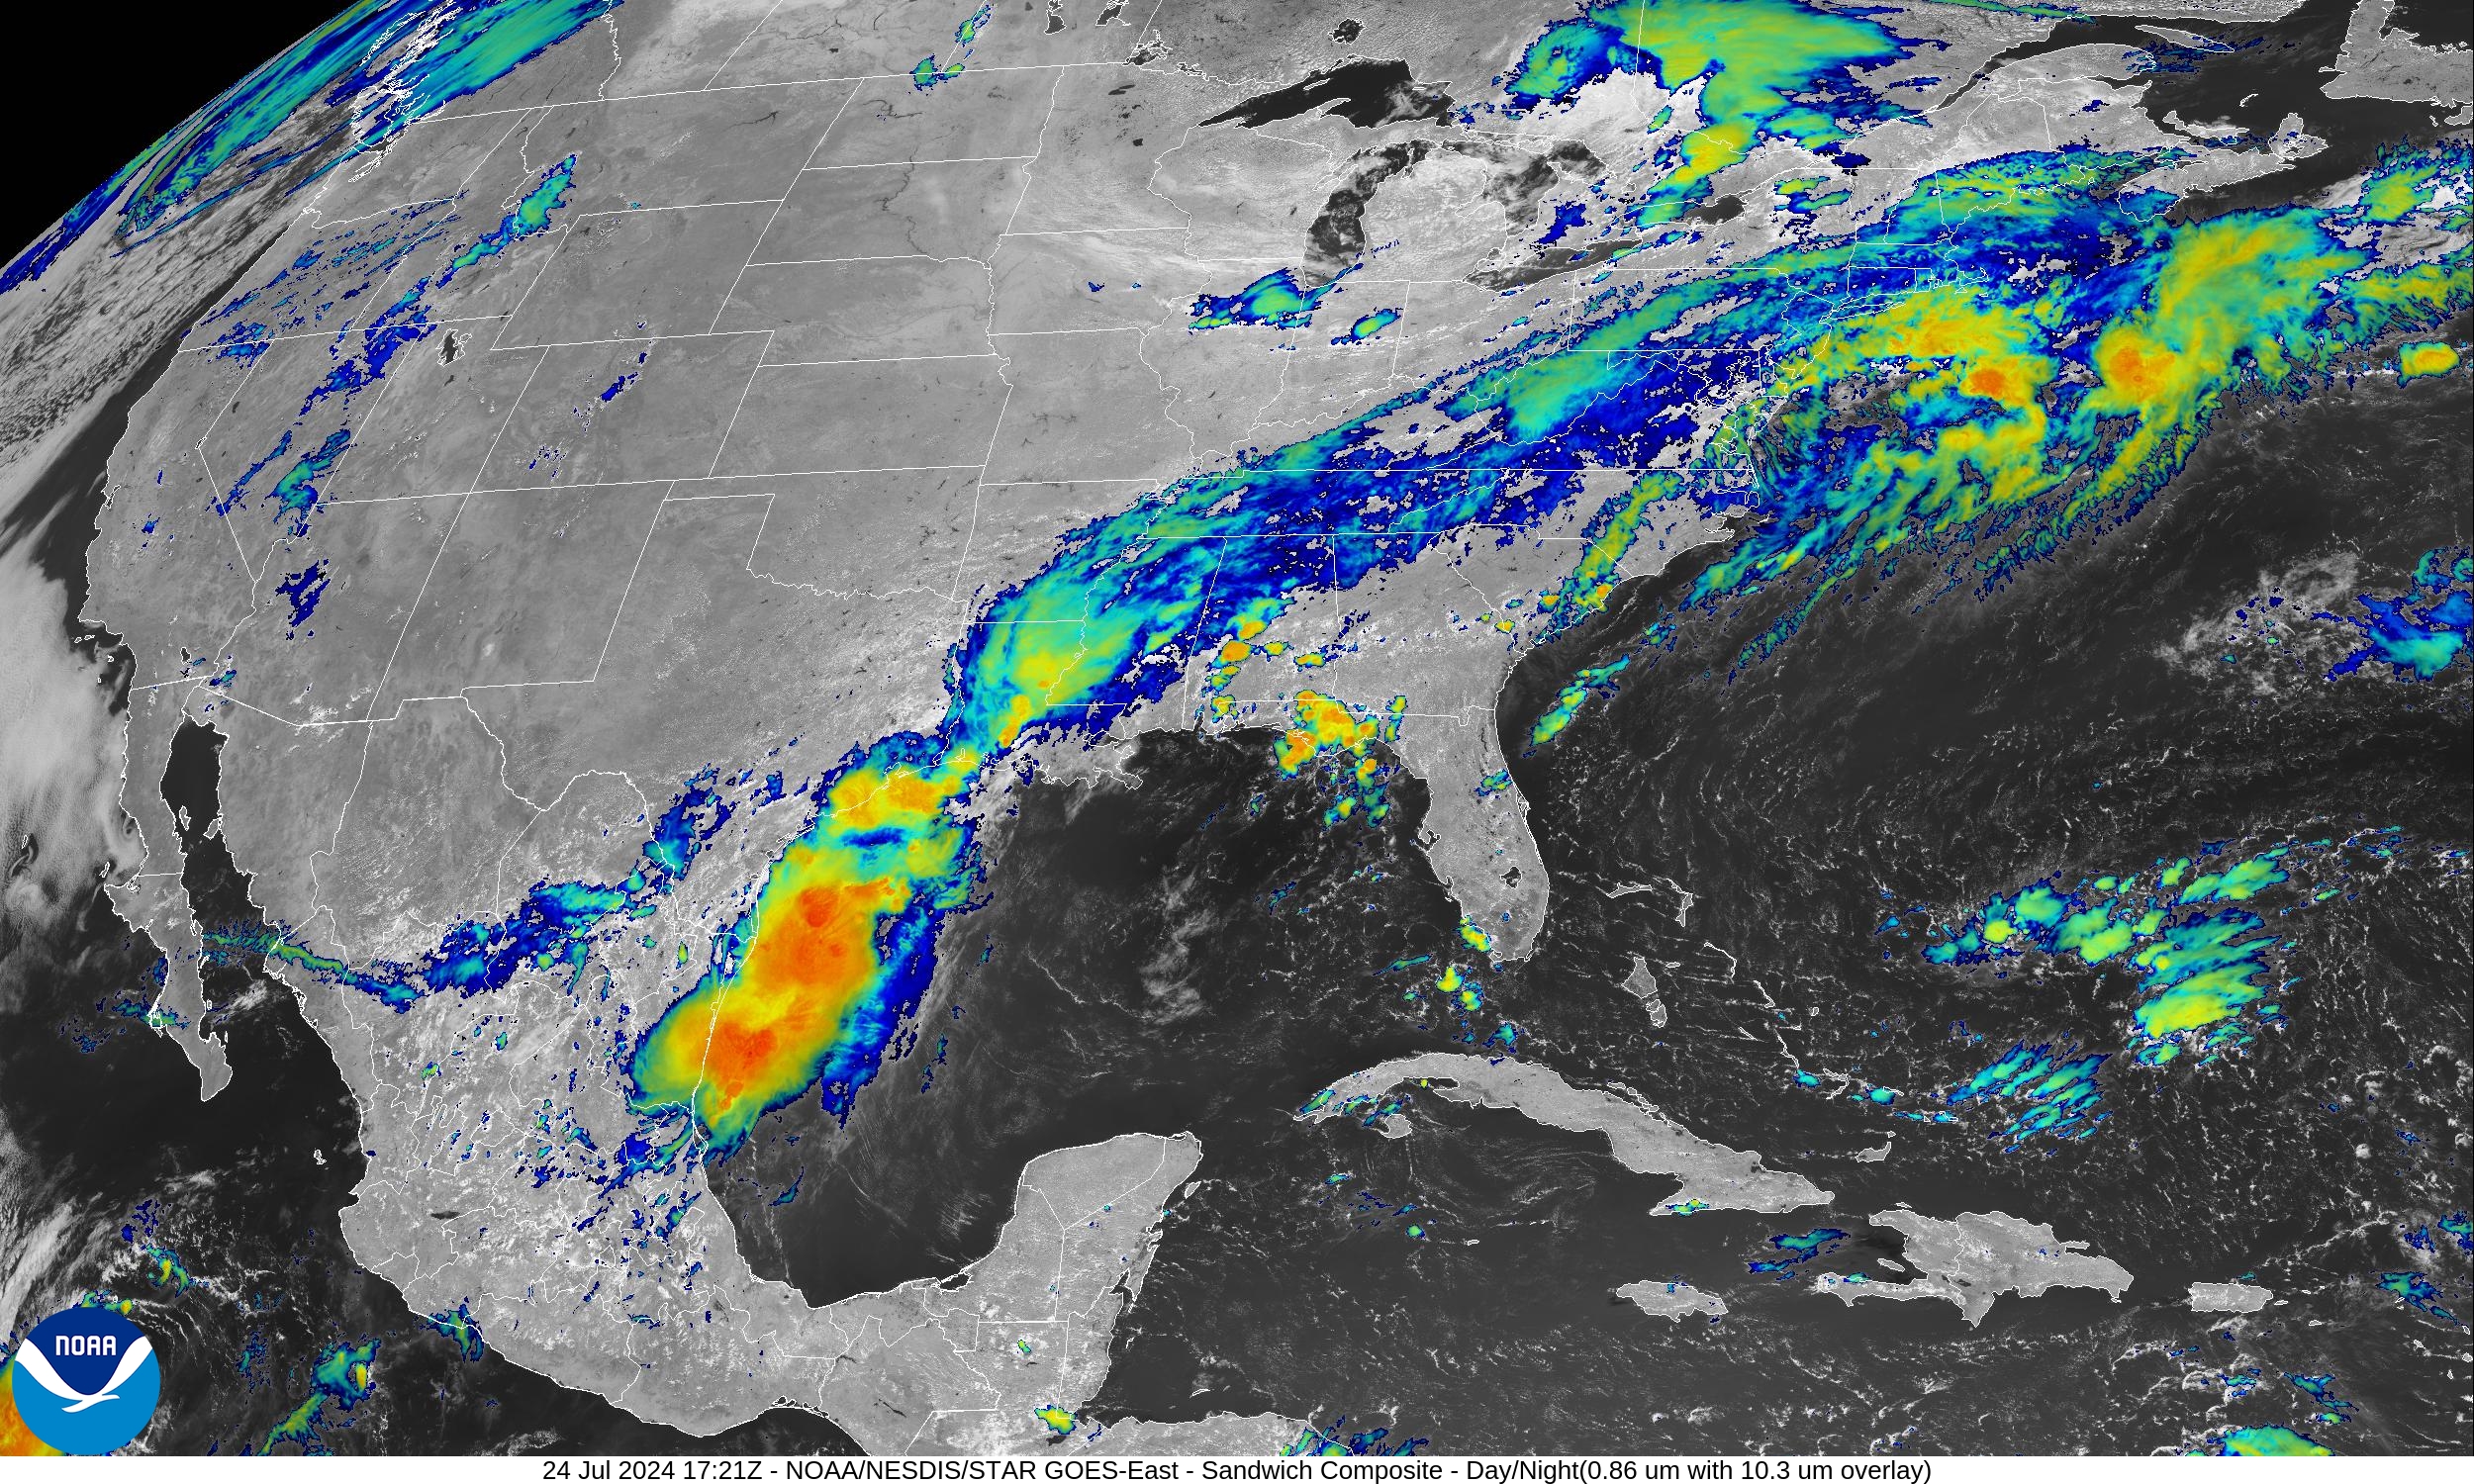
The frontal boundary has sagged into the Gulf of Mexico across south Texas into Louisiana and the Southeast to the Carolinas. Along and south of the front, more clouds and rainfall with the heating of the day.
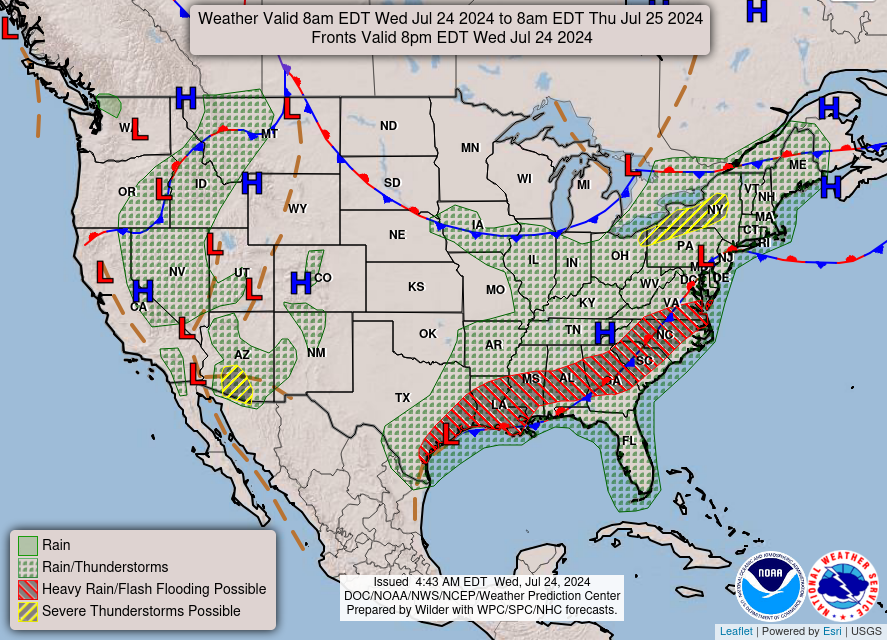
Very hot in the Western U.S. especially in Montana. Monsoon showers in southern Arizona could briefly become severe with gusty winds. Potential for some strong storms in western NY and around Erie, PA as an area of low pressure rotates through. Another front arrives into the Midwest and Great Lakes w/cooler, and dry Canadian air in the 70s.
Wednesday Weather
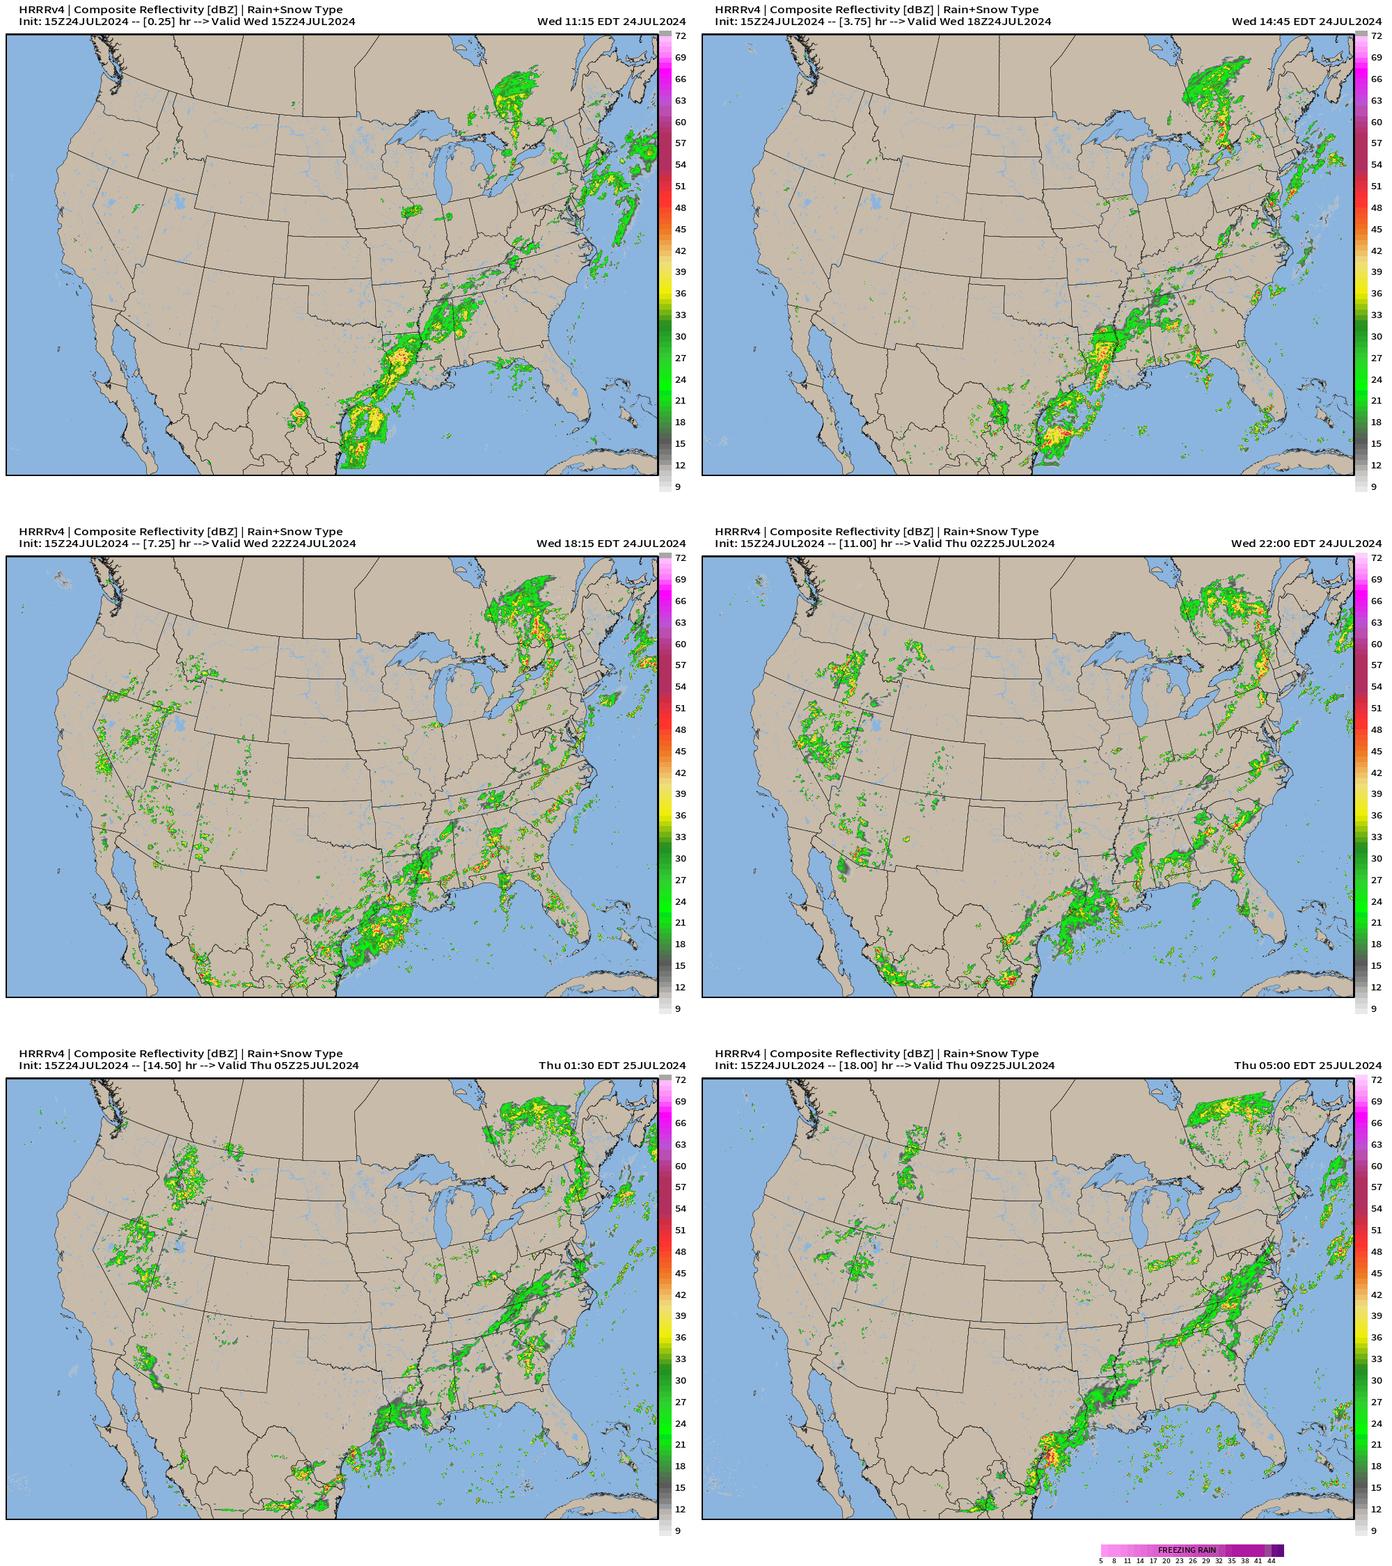
Simulated radar shows plenty of showers across the Lower 48, mostly spotty and convective w/heating of the day. Once the sun goes down, the CAPE is used up. This pattern for the end of July is superb for keeping the “heat dome” potential away as the dog days of summer march on into August.
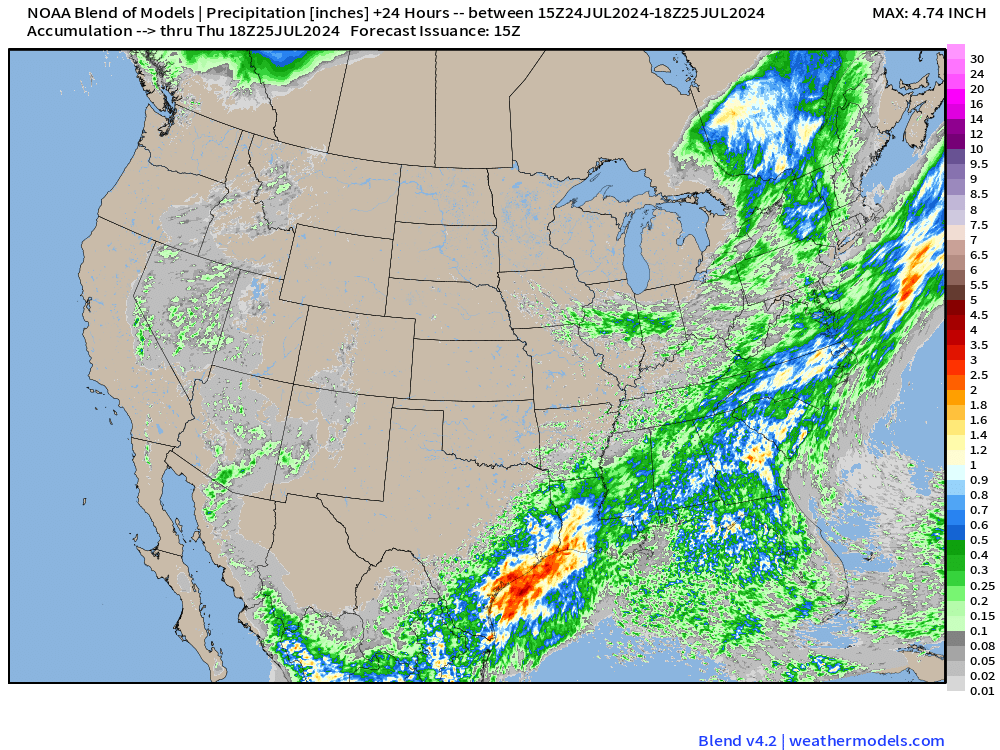
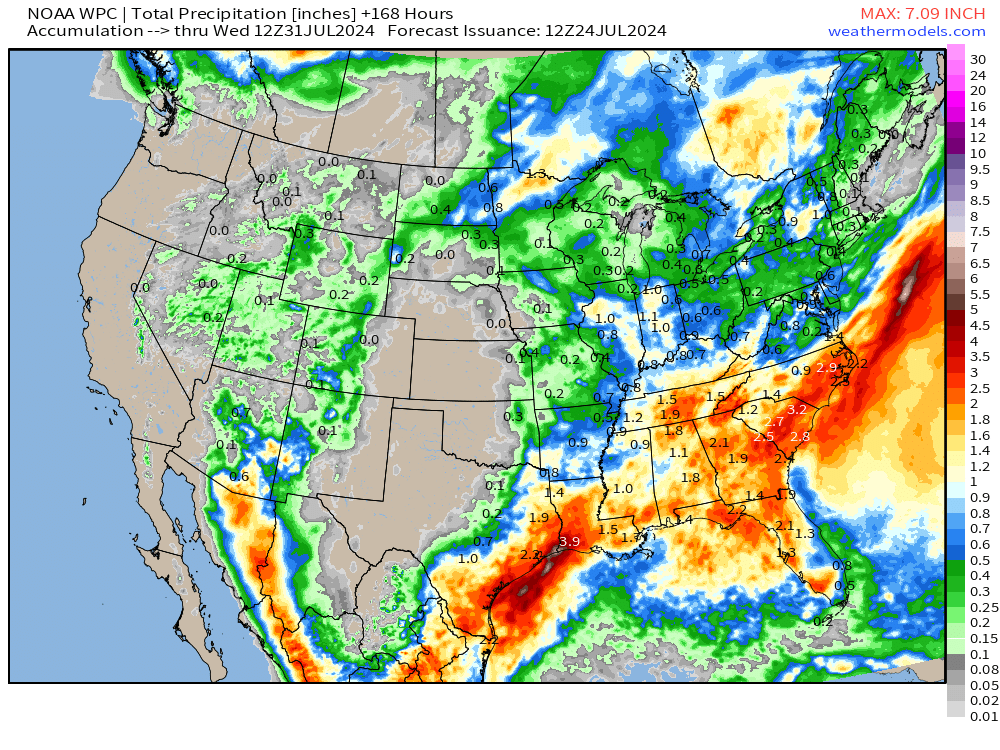
Heavy rain across Texas to the Carolinas along the long-stationary frontal boundary. Some pop-up showers across the Great Basin / West to provide spotty relief from the brutal heat with limited accumulations — maybe 1-inch in a local storm.
Wednesday High temperatures
Only 103 million population at least 90° — with the western U.S. very hot in the Southwest, California central Valley, and Montana. Temperatures kept down beneath the clouds of the frontal boundary in the deep south.
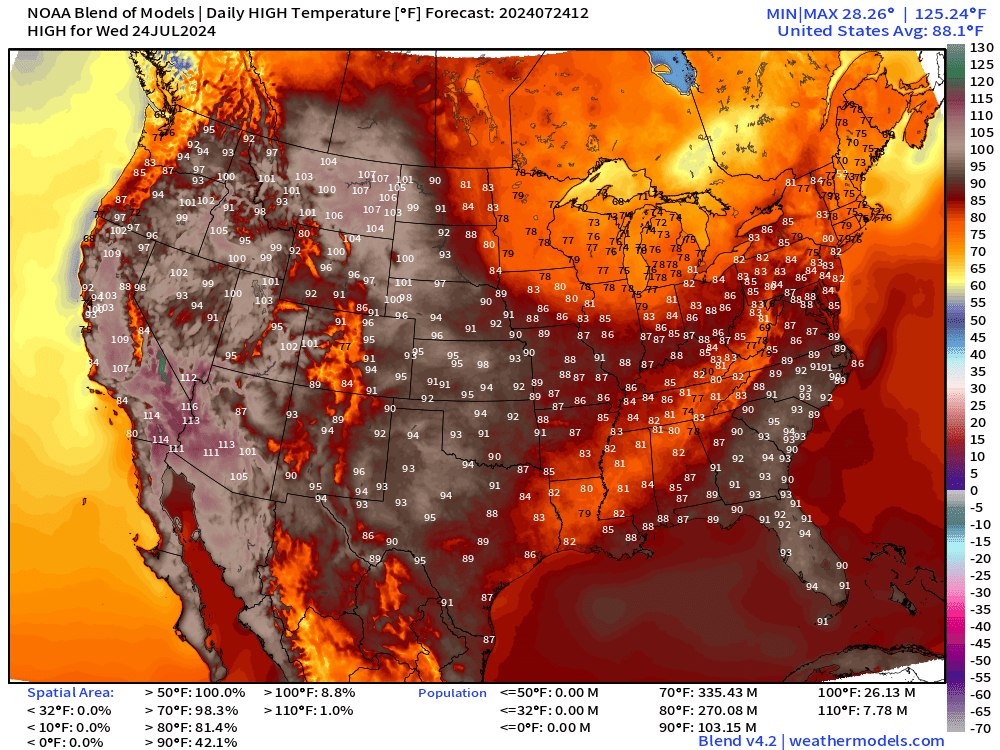
Thursday High Temperatures
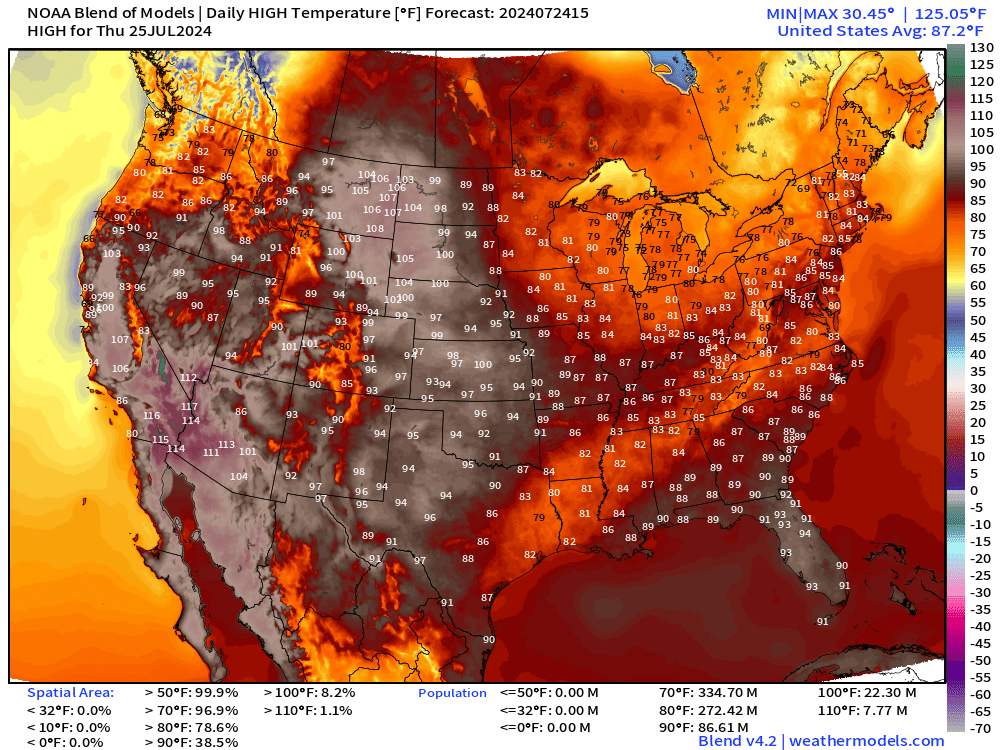
Actually, fewer Americans in the 90s on Thursday, only 87 Million as a front makes it into the Ohio Valley.
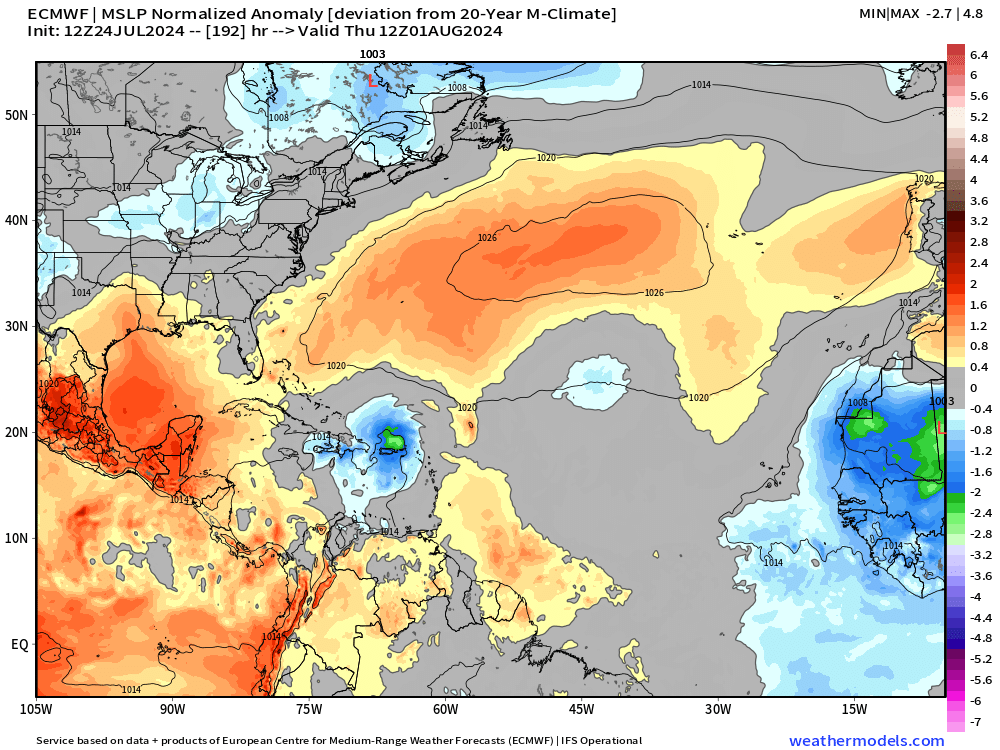
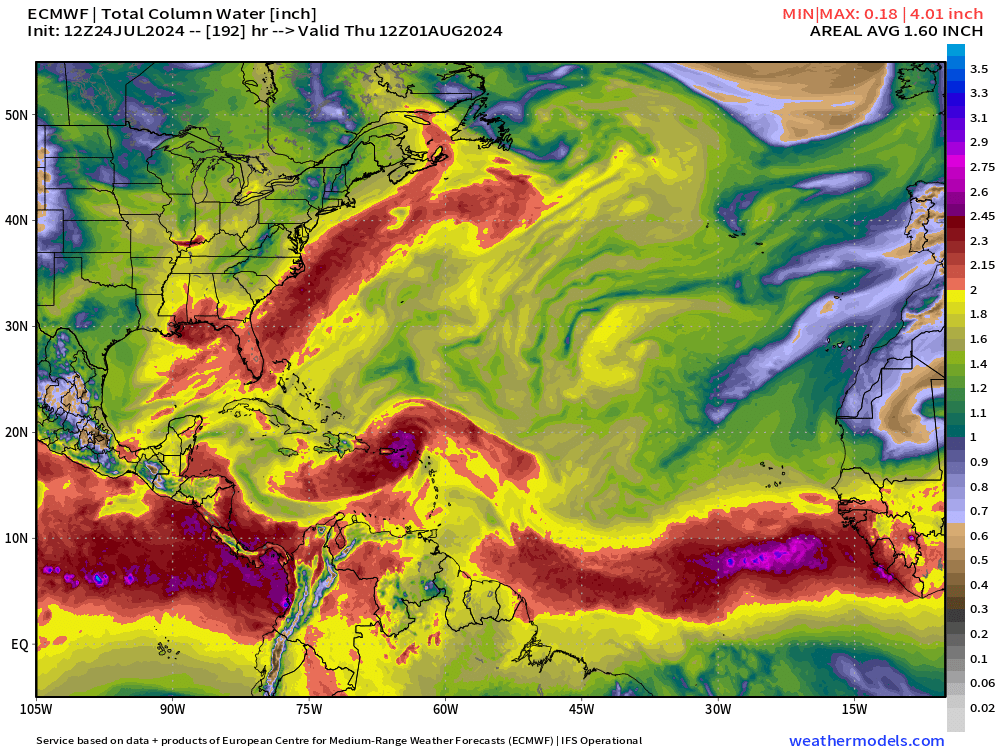
Atlantic Tropics are slowly waking up — and could become active in a big way by August 4-6 time frame or 11-13 days in the Bahamas/Florida/Gulf of Mexico as a tropical wave develops in ~20 ensembles = 40% chance.
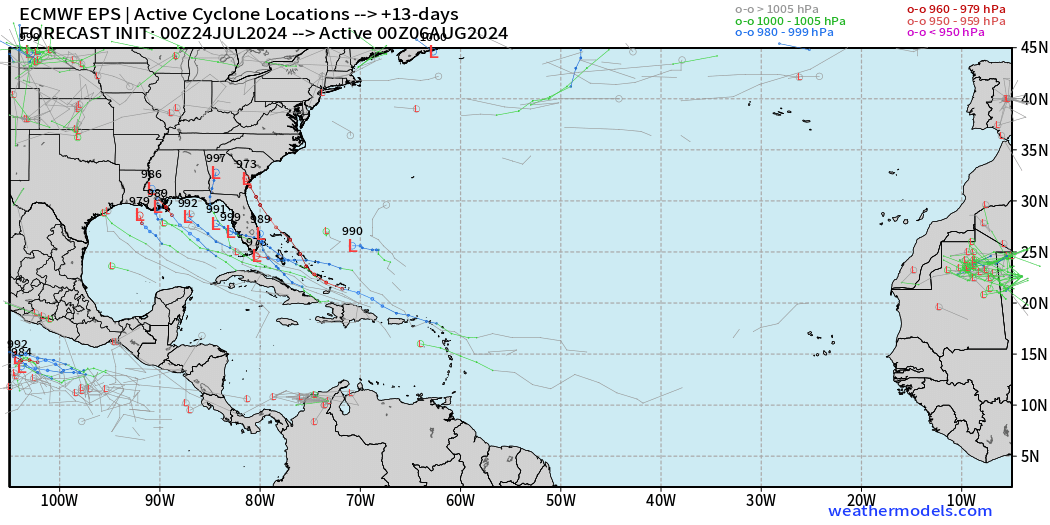
Ensemble Locations of Active Storms 00Z at Day 13 Looking at all 15-days: the tracks originate near the Bahamas as the Main Development Region (MDR) is unfavorable for development due to dry air, dust layers, and higher wind shear. If a tropical wave can survive, then more favorable environment lies ahead.
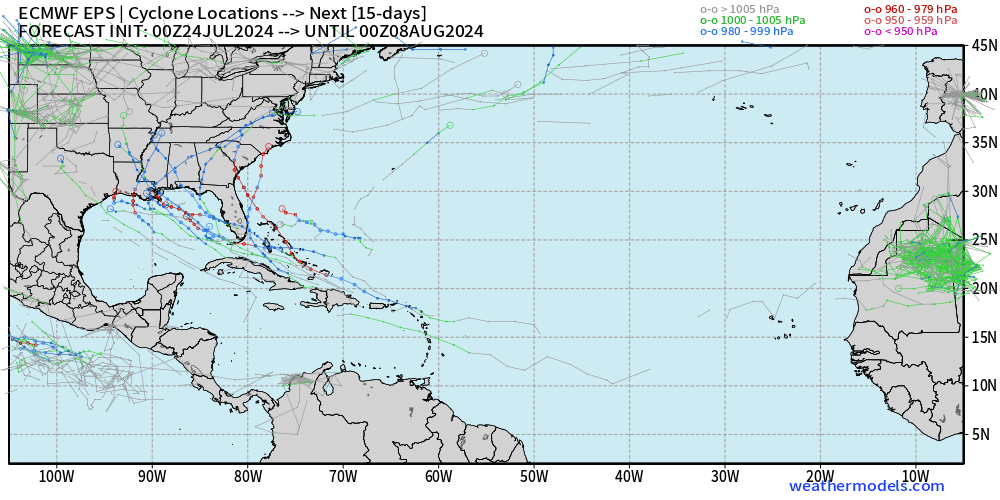
All Storms Through 15-days We can see the tropical wave in the ECMWF HRES 12z near Puerto Rico in 8-days
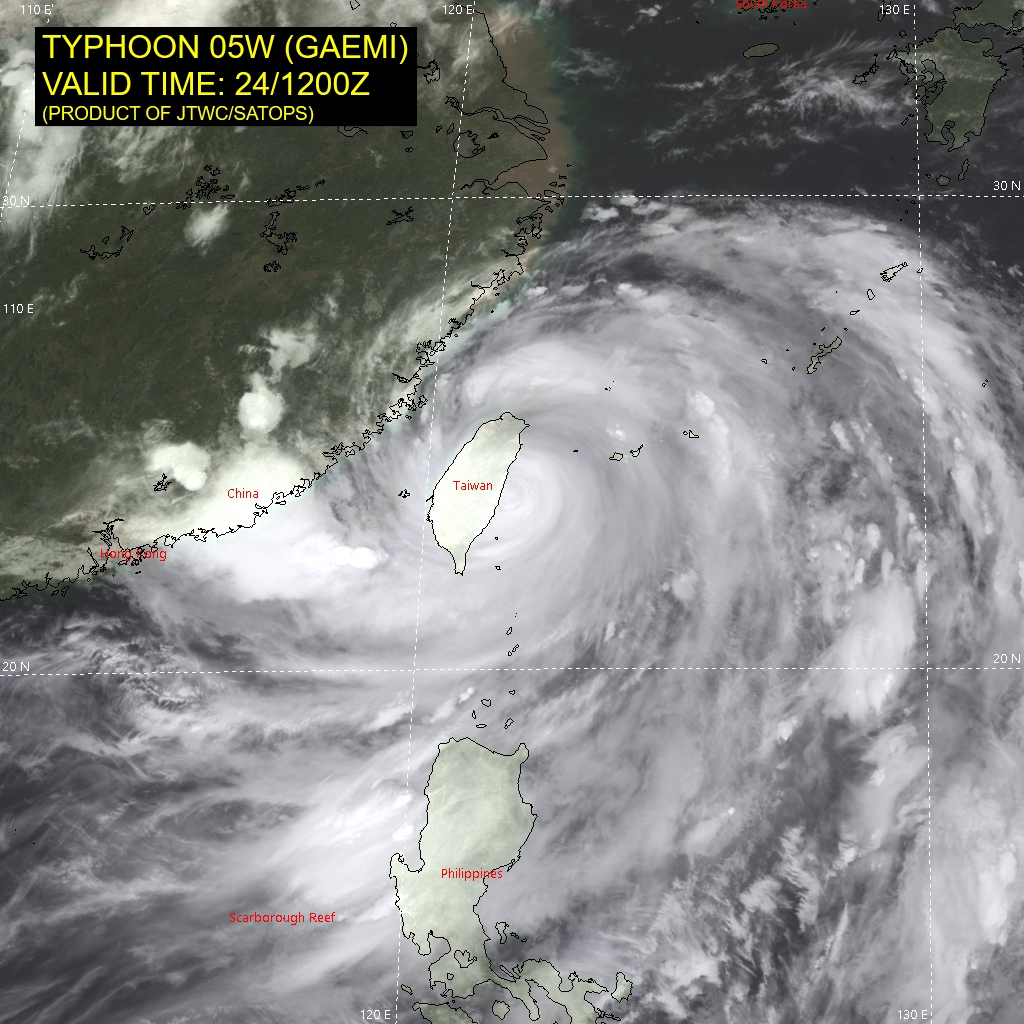
Western Pacific Typhoon Gaemi (05W)
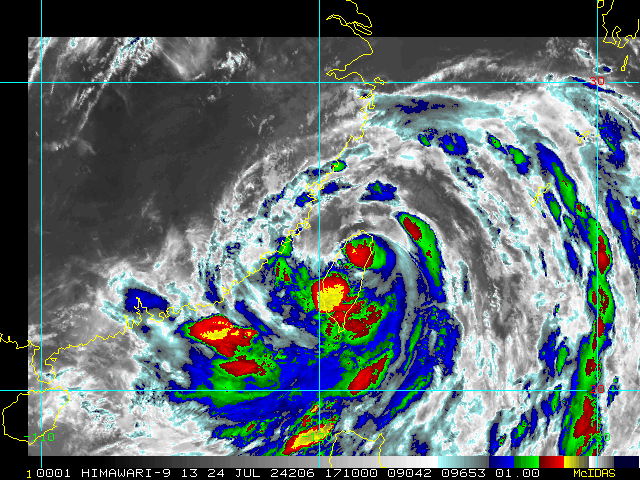
SATELLITE ANALYSIS, INITIAL POSITION AND INTENSITY DISCUSSION:
AS DEPICTED IN ANIMATED RADAR IMAGERY, TYPHOON (TY) 05W HAS TRACKED ERRATICALLY OVER THE PAST SIX HOURS, INITIALLY DEFLECTING SOUTHWARD, TRACKING PARALLEL TO THE NORTH-SOUTH ORIENTED MOUNTAIN RANGE ALONG THE NORTHEAST COAST OF TAIWAN. OVER THE PAST FEW HOURS, THE SYSTEM IS LOOPING CYCLONICALLY BACK TO THE NORTH.
Typhoon Gaemi bounced off the island of Taiwan as the mountainous terrain deflected the storm to the south, causing it to take a cyclonic loop before continuing on its original course into NE Taiwan. Landfall intensity is between 100-120 knots.
Atlantic Basin GeoColor Satellite Imagery
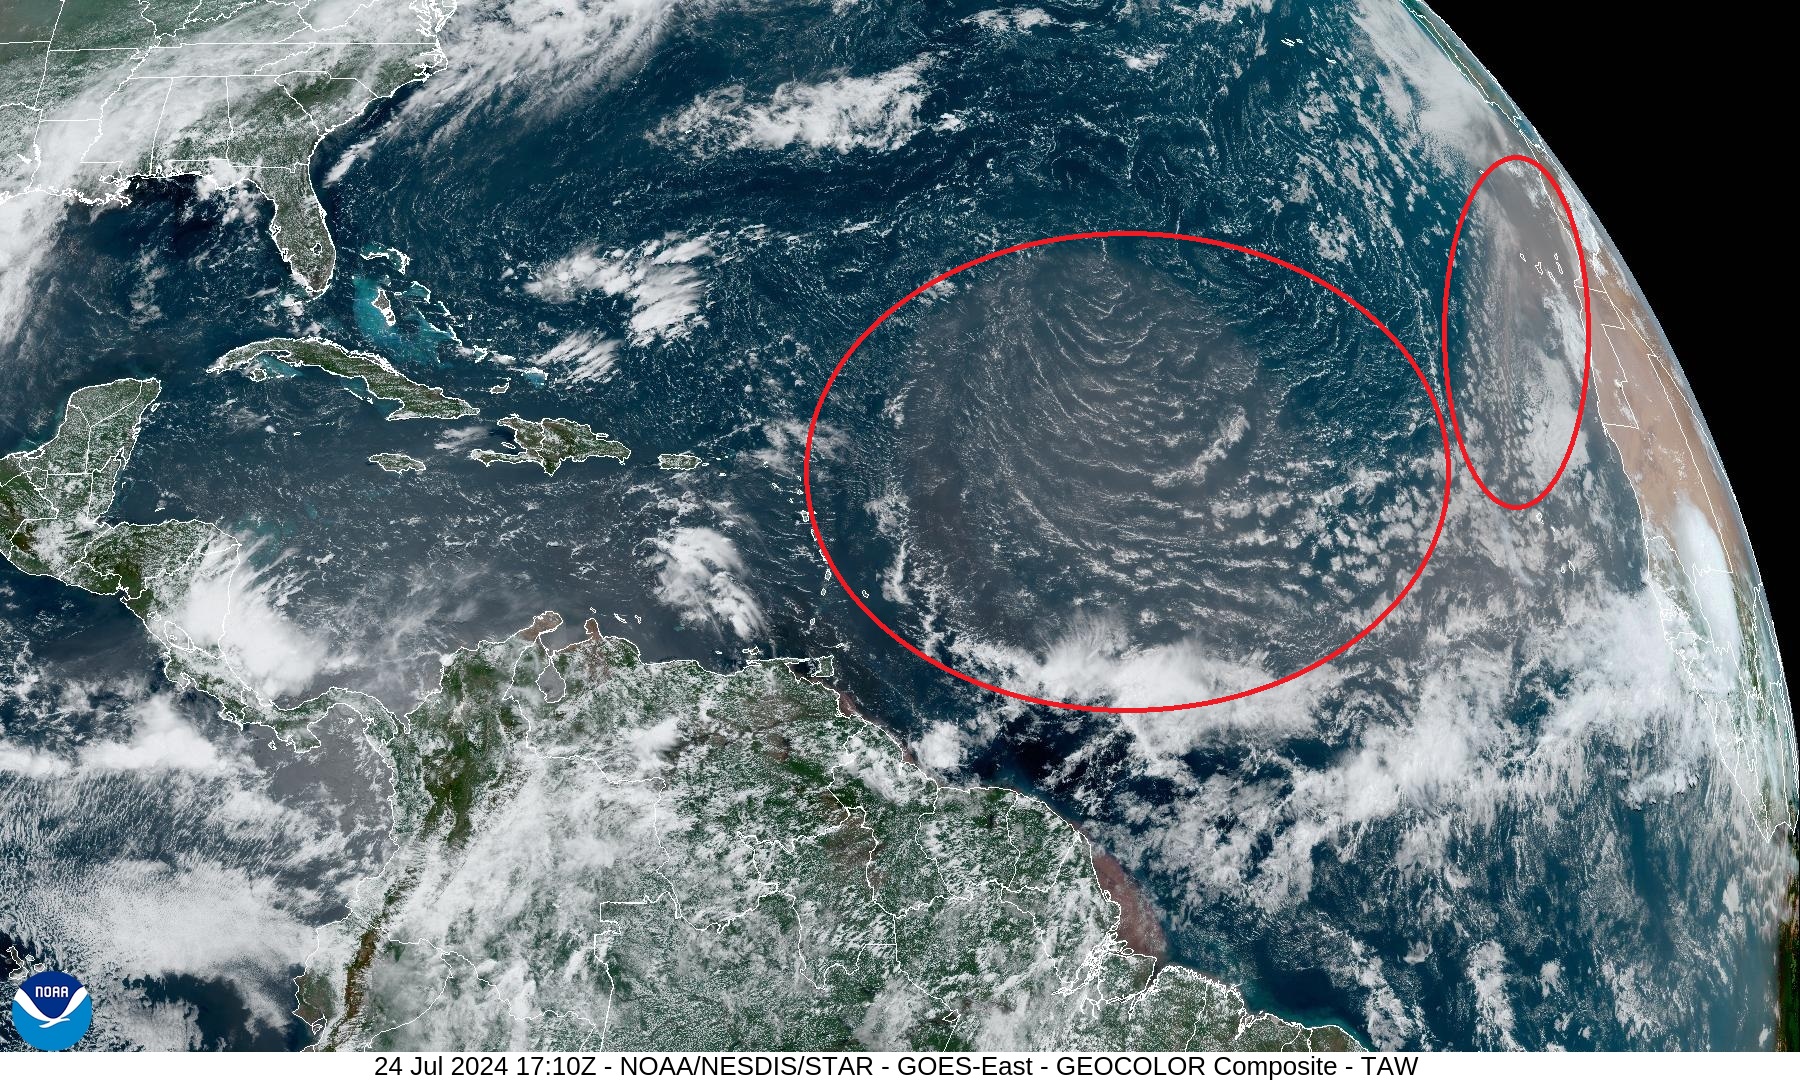
The Saharan dust cloud has moved into the central Atlantic with another plume coming off the African continent.
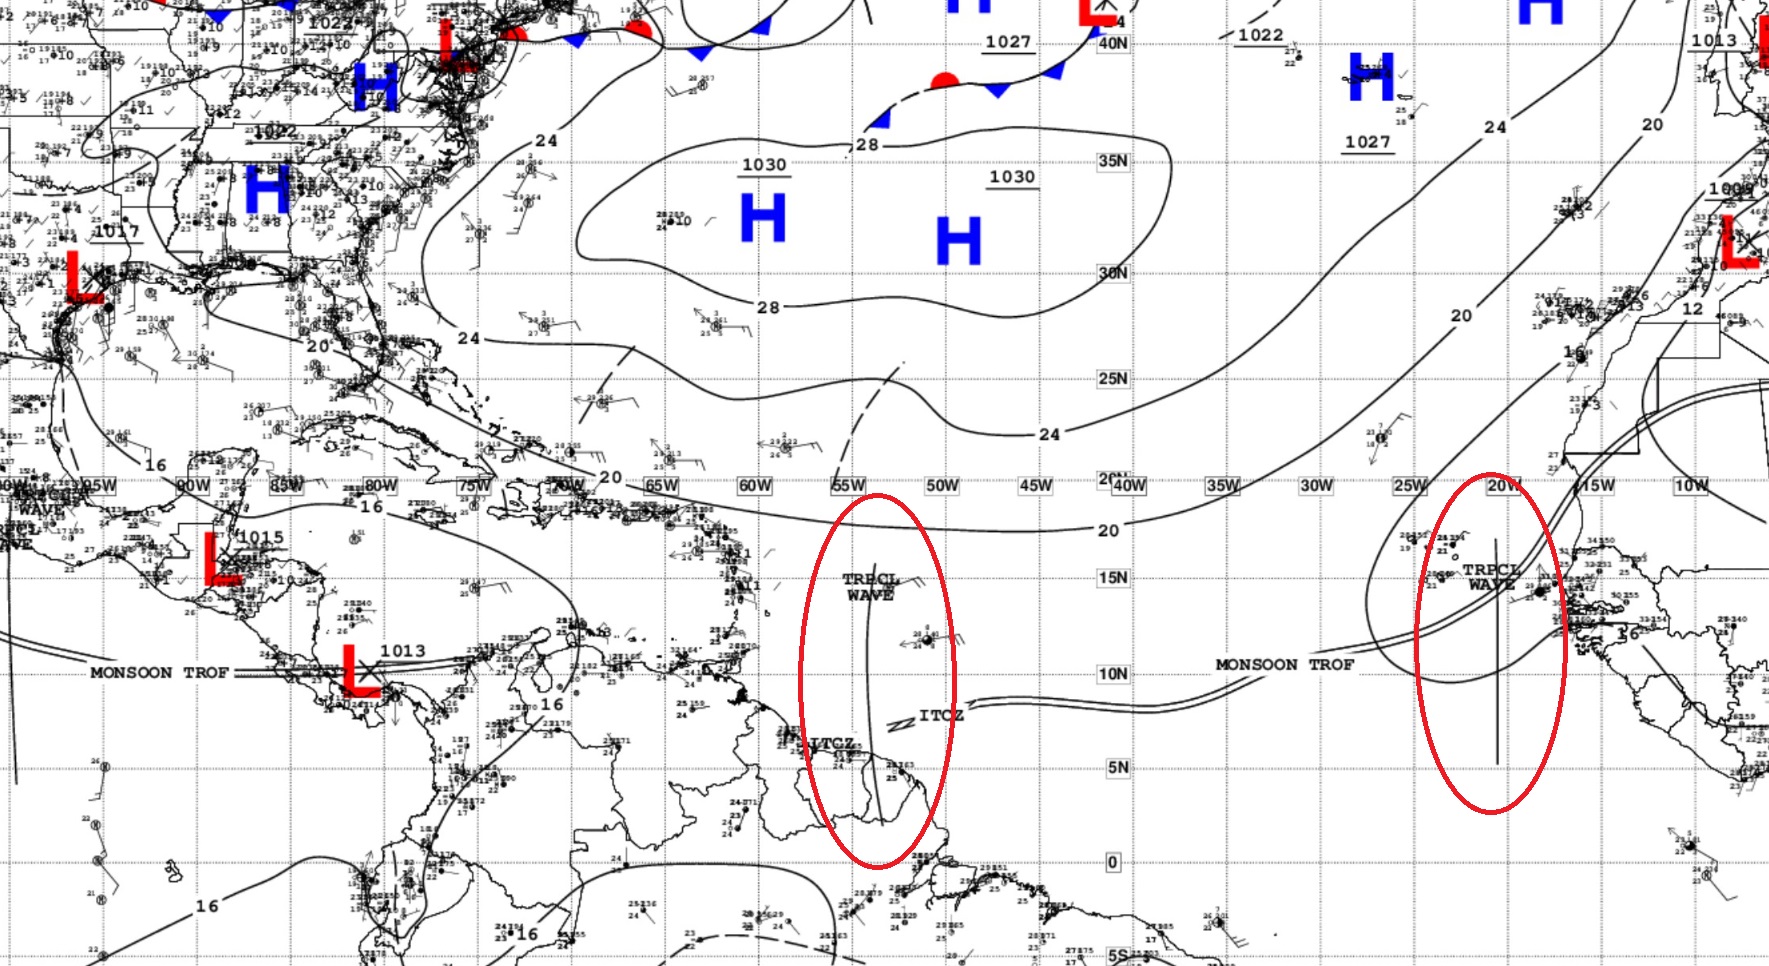
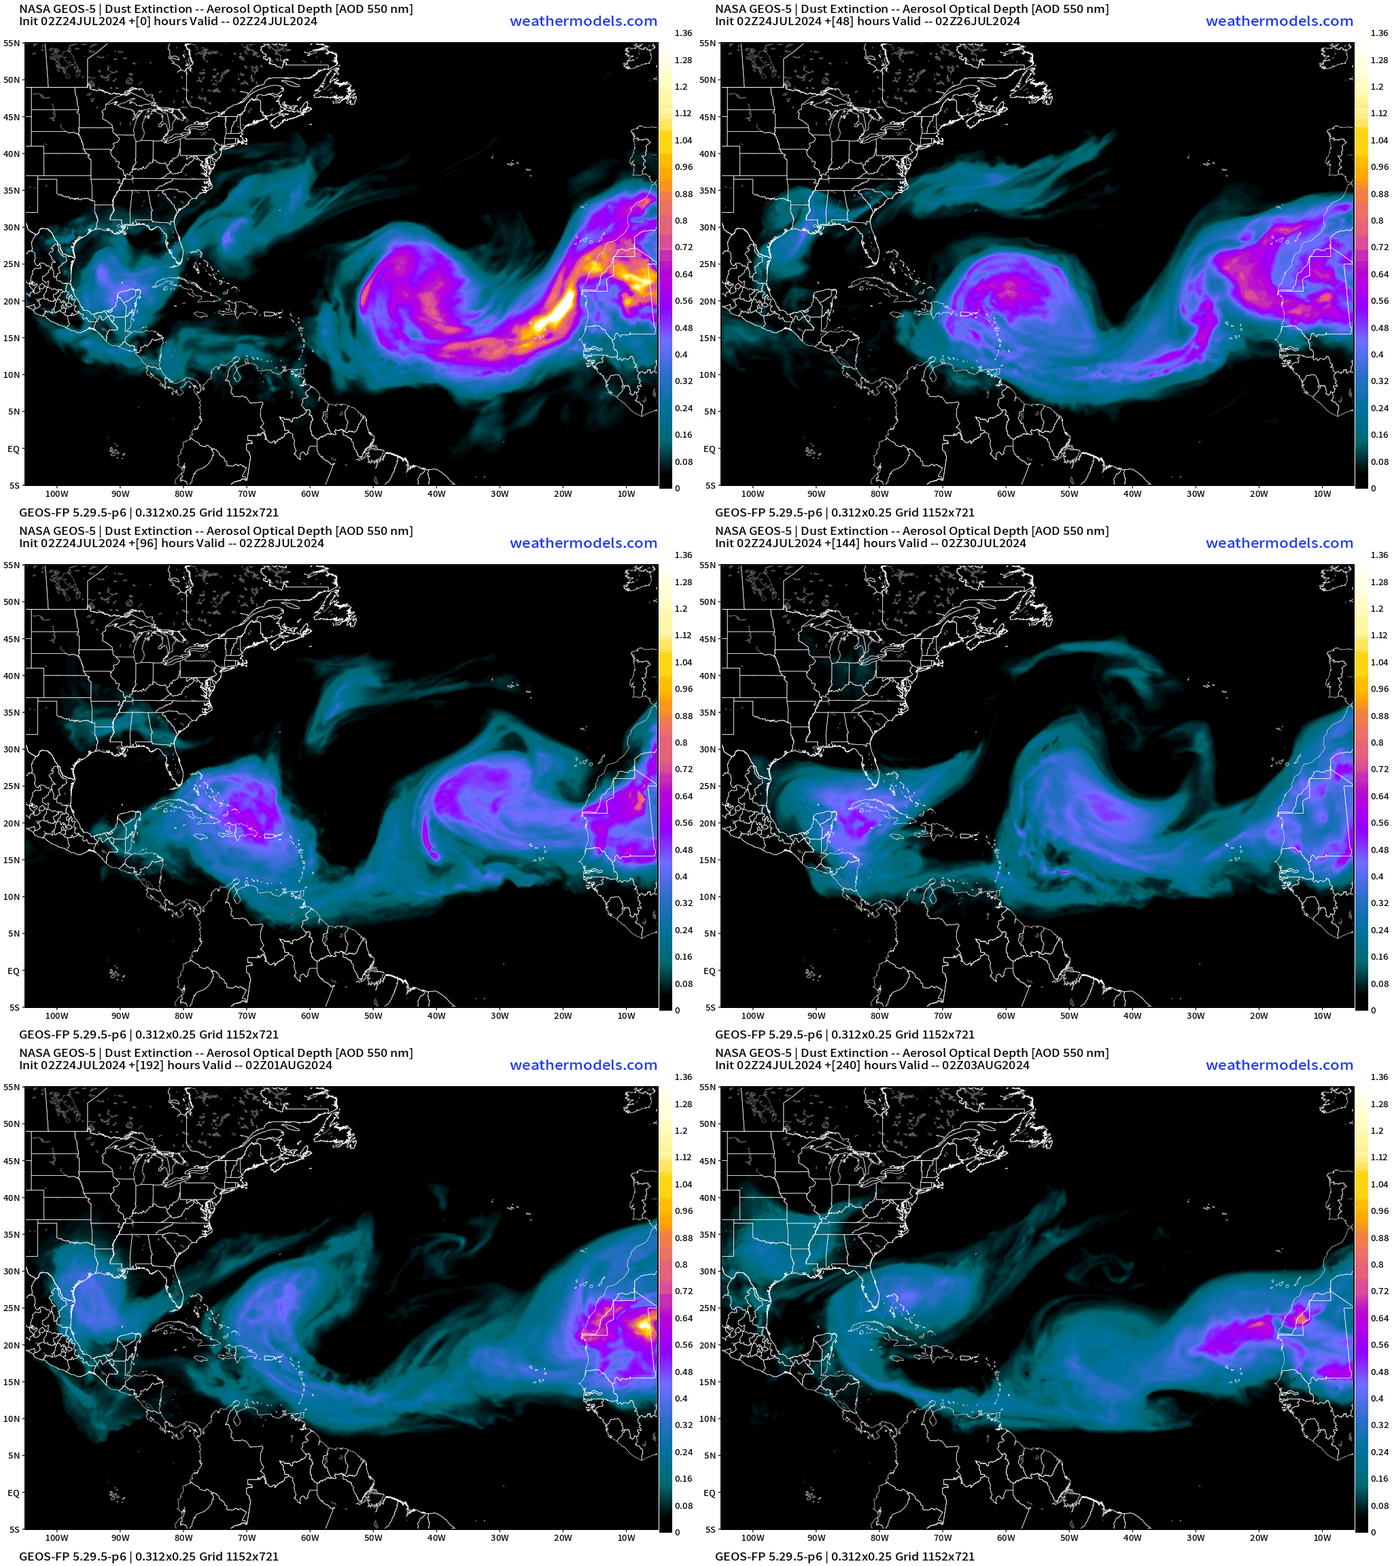
The NASA GEOS-5 modeling of the dust clouds is mesmerizing. Any tropical wave development would be in between these anti-cyclonic rotating plumes.
NWS WPC 7-Day Precipitation Forecast | Watering Needs
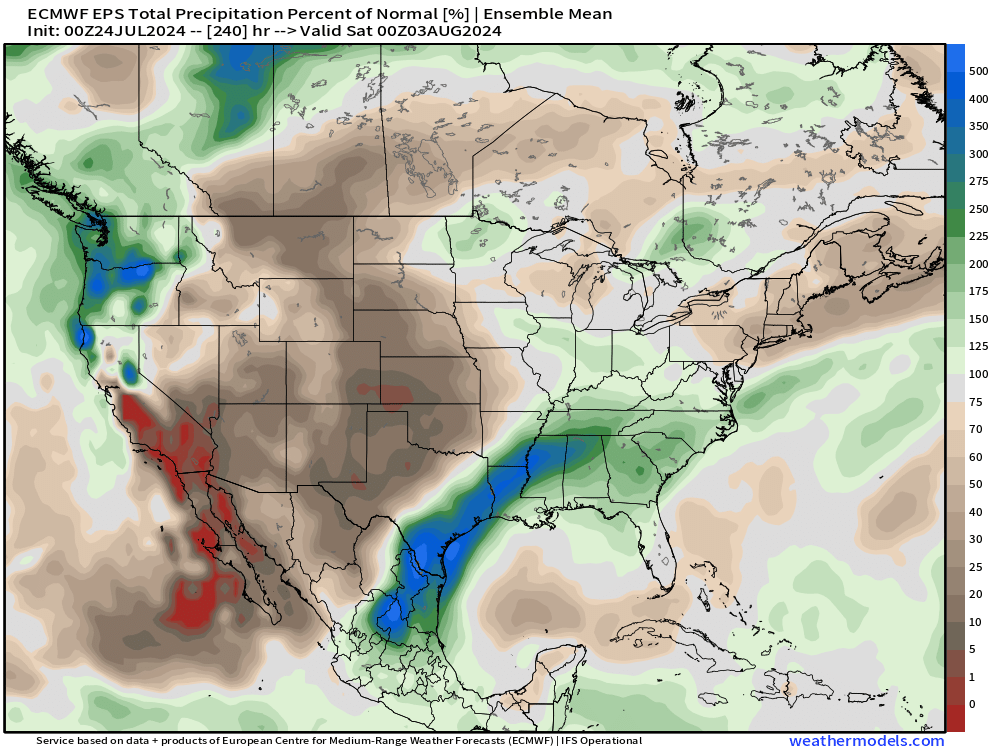
10-Day Precipitation Anomaly (%)
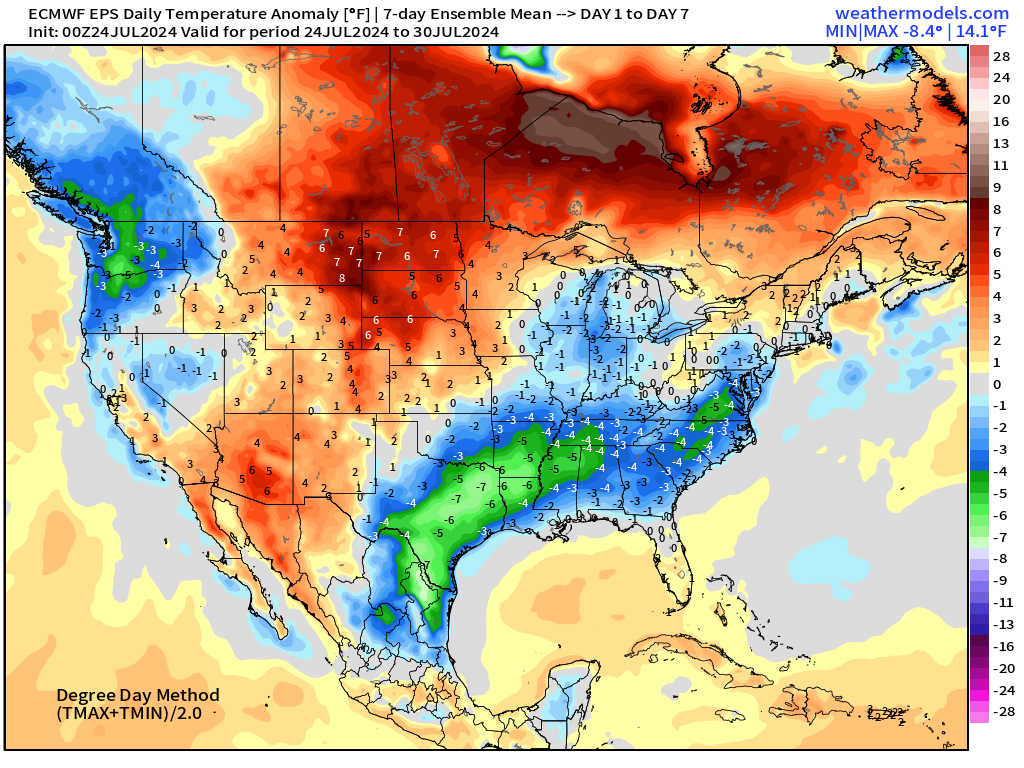
Weekly Temperature Anomaly
EPS Week 1: July 24-30, 2024
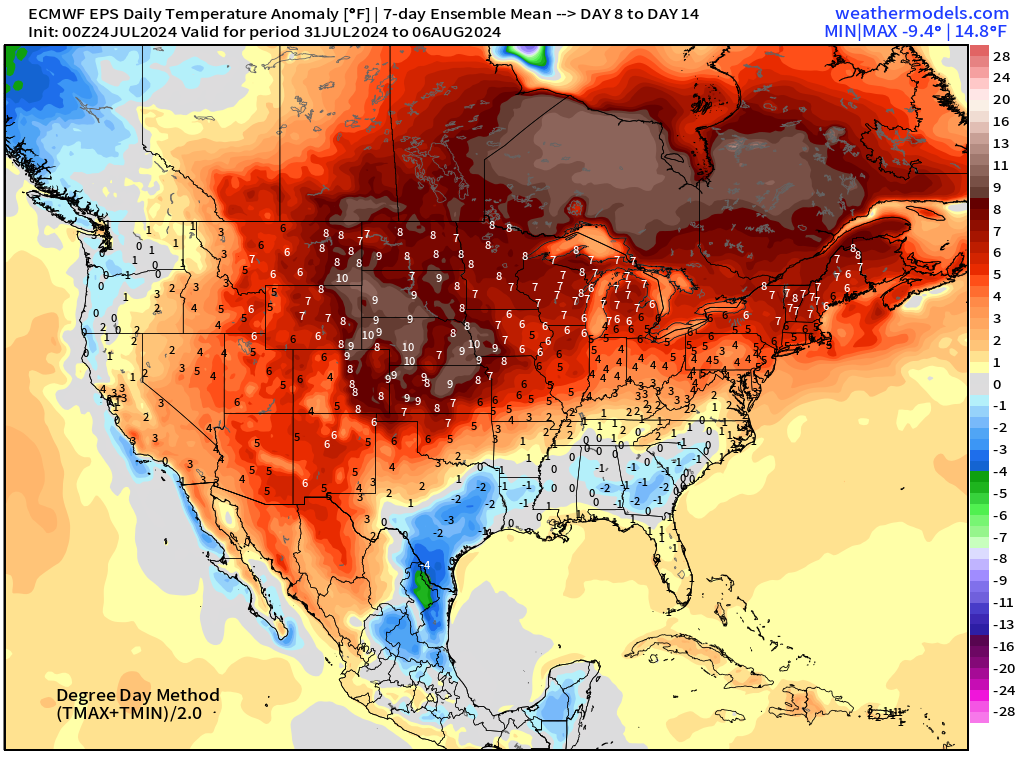
EPS Week 2: July 31-Aug 6, 2024
Thank you to Subscribers and Supporters!
Maps sourced from weathermodels.com designed and innovated by yours truly! I actually create all of my content from scratch.
- Milepost
- 349 · laid 2024-07-24T18:03:30.477000Z
- Source
- https://weather.substack.com/p/july-24-2024-wednesday-update
- Digest
- d963a3ae65e3017e1855f18ee952edc930cac102e2d498f9c2431dfde017252e
- Machine
- JSON