February 16, 2024 Friday Morning
Brief shot of Arctic air behind Clipper System
February 2024 was the 3rd-warmest February in the 132-year national record (1895–2026), at 40.8°F against a 1991–2020 normal of 35.6°F (+5.1°F).
February 2024 was the 62nd-driest February in the 132-year national record (1895–2026), at 2.0in against a 1991–2020 normal of 2.1in (-0.1in).
NOAA/NCEI Climate at a Glance, contiguous United States. This is the observed record for the month, not a score of anything said in this piece — the forecast ledger begins 2026-08-17 and cannot reach earlier posts.

Friday Morning Update
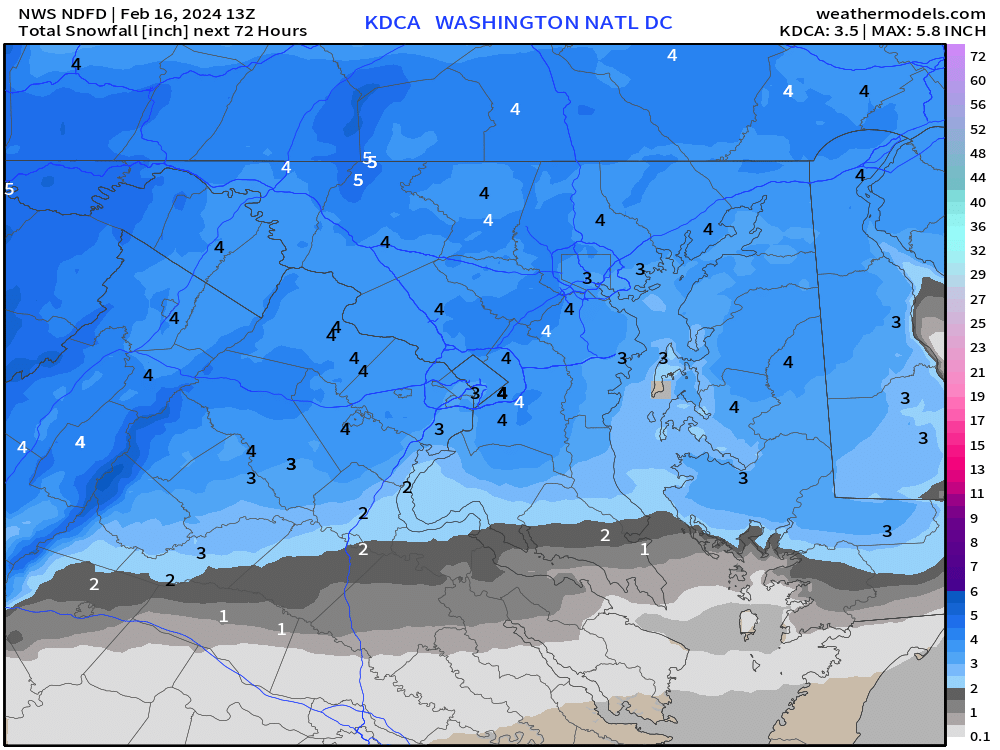
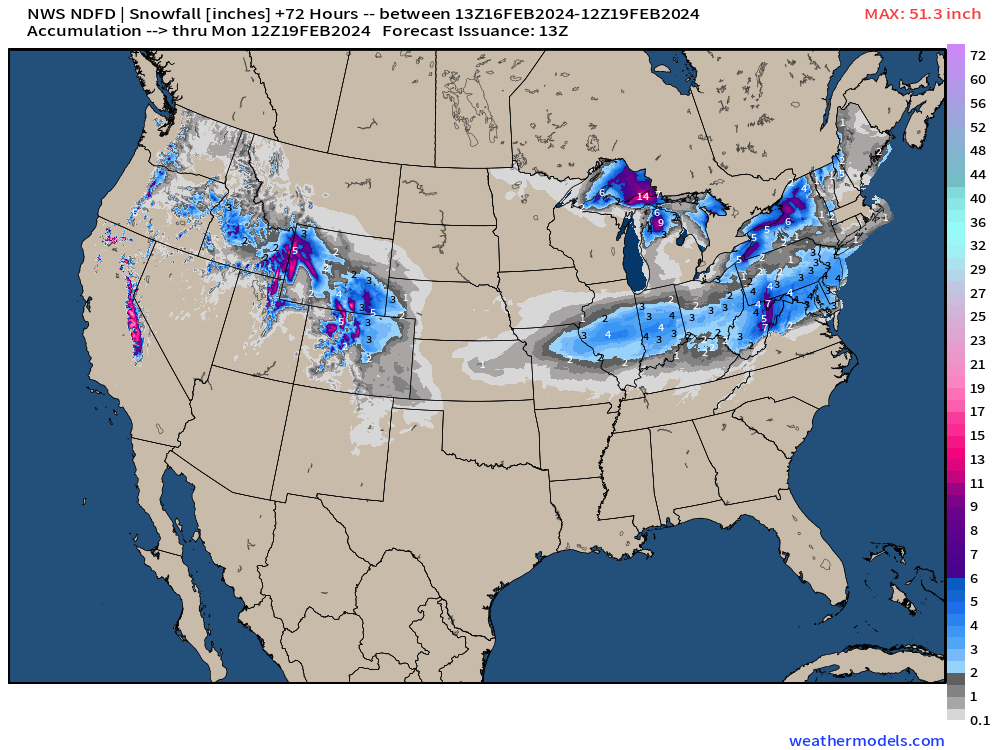
The clipper system is moving through the Ohio Valley into the Mid-Atlantic overnight leading to a blanket of 3”-4” of snowfall including Washington D.C. by Saturday morning.
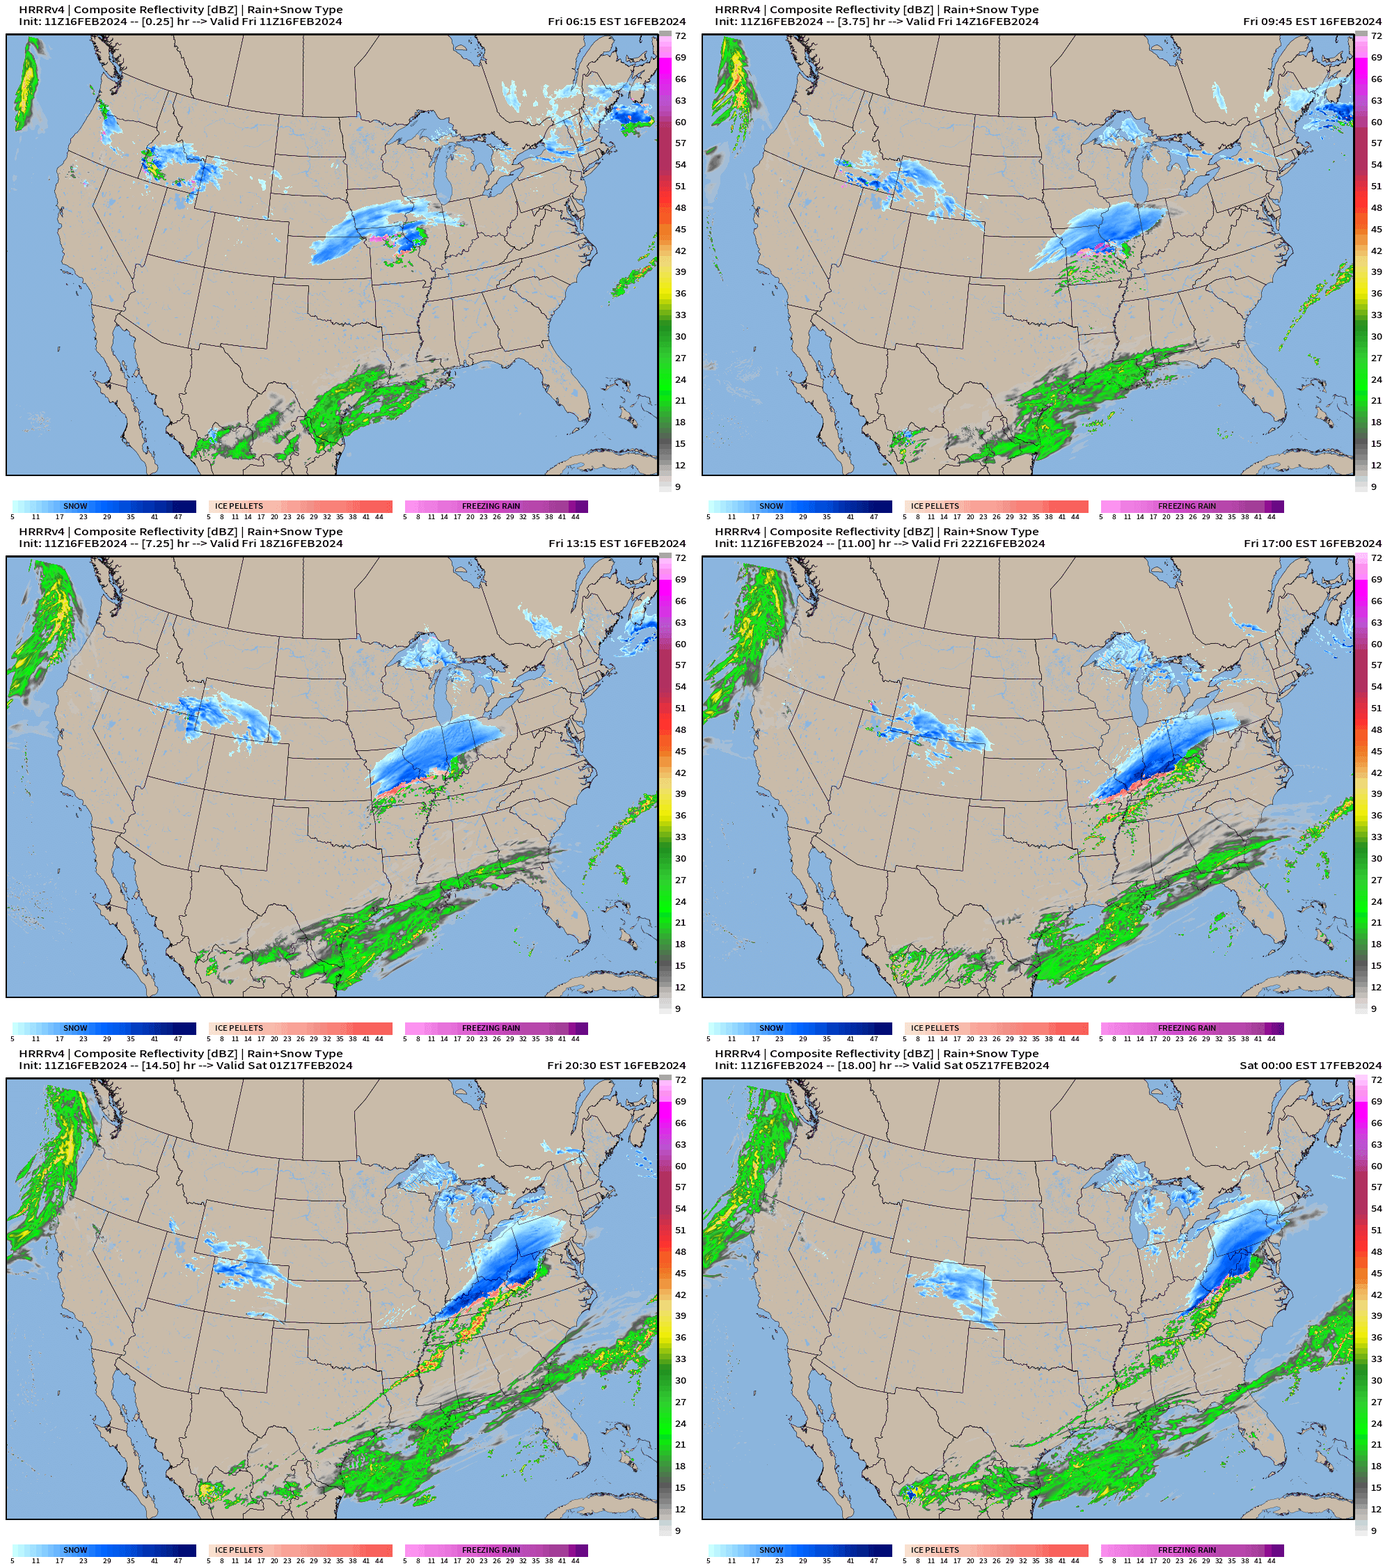
There is an Arctic air mass behind this weather system, but it is not particularly intense — as it definitely could be for mid-February, the coldest/deepest part of winter.
Day time temperatures will only rise into the teens across the upper-Midwest, and 20s in the Great Lakes. That’s plenty cold enough with Northwest directional winds to generate heavy Lake Effect snow especially in northern Lower Michigan and the eastern U.P.
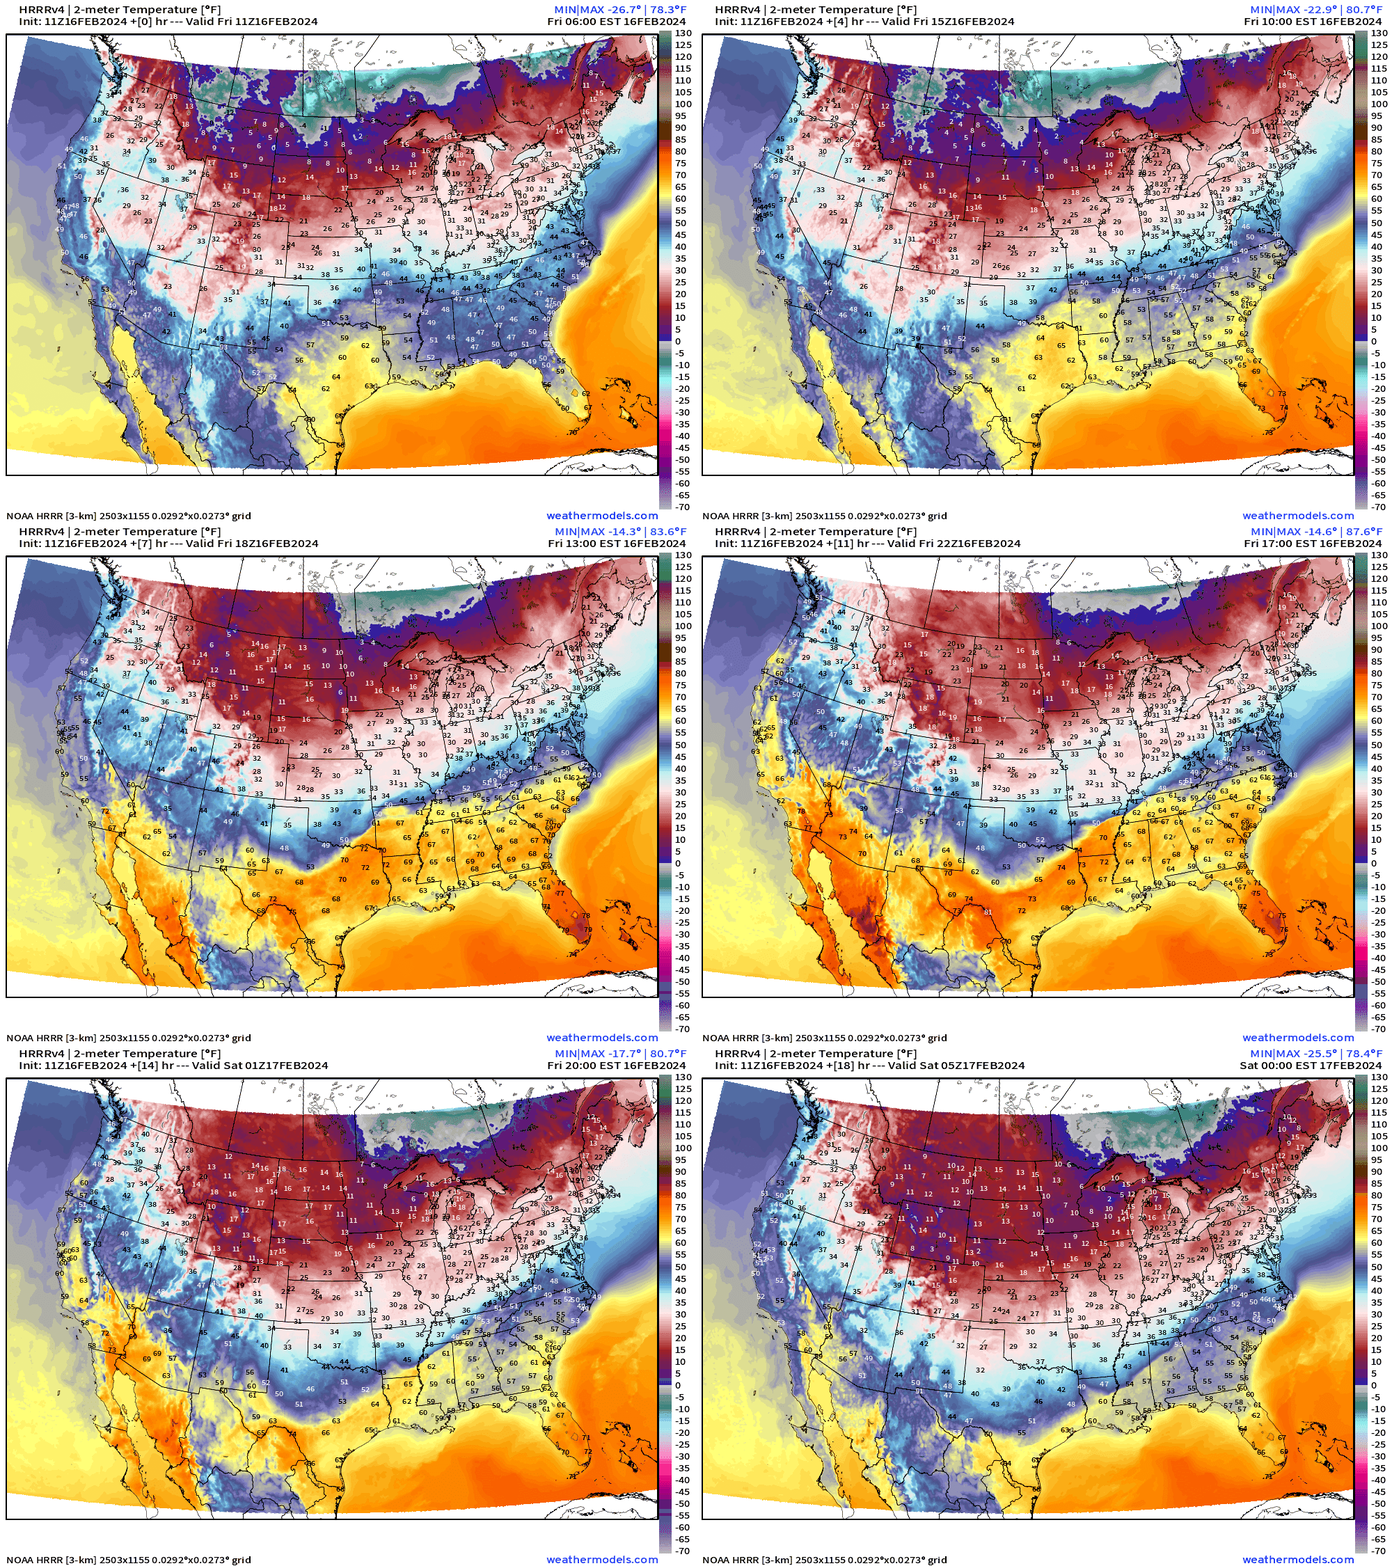
The cold front wipes away the 60s and 70s across Texas and the Southeast with highs only in the 40s — a 25-30°F cool down.
Clipper System Snowfall Totals
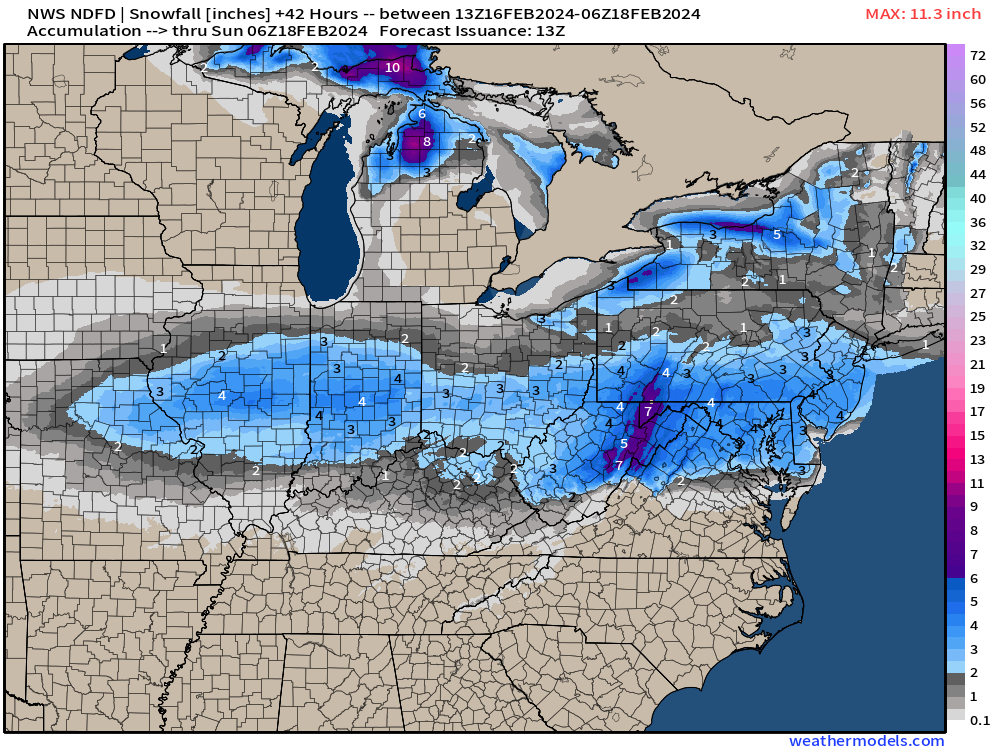
Indianapolis around 4” with the official forecast at Reagan DCA at 3.5” which might seem like 2-feet with the ongoing multi-year snow drought.
Heavy snow continues across the mountain west over the next few days and then really ramps up into the next 7-10 days.
Warming Pattern into March
Broken record. The only question is how warm the ensembles will get into March.
I do see very cool conditions across the Western U.S. which will mean more snowfall.
More Ensemble Clustering Tools at Weather Trader*
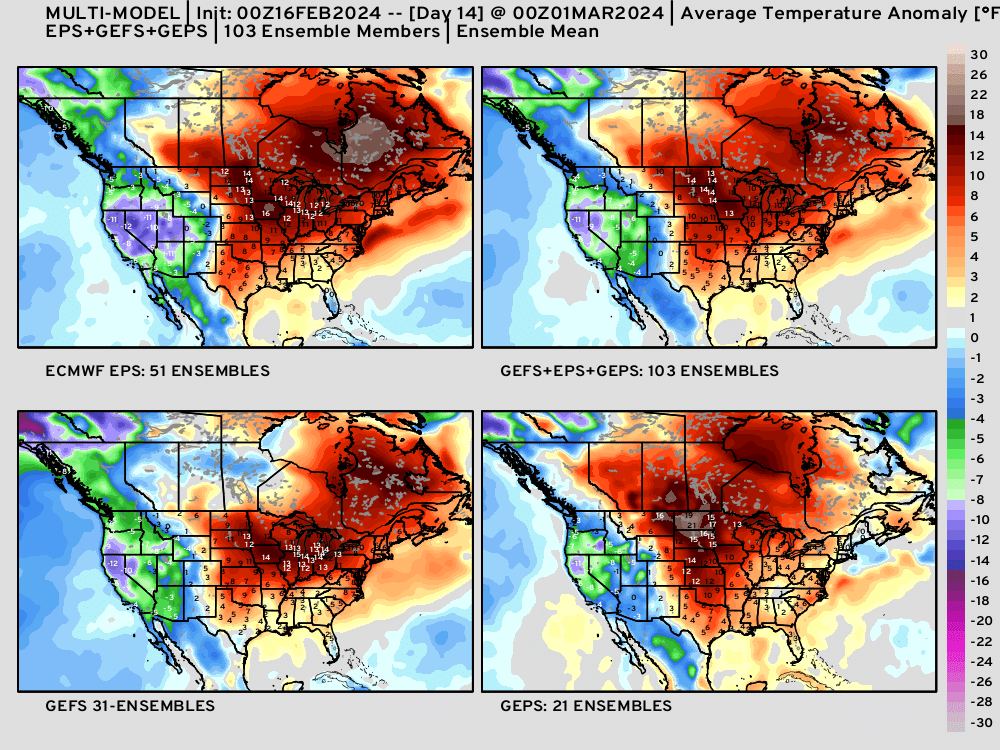
I created more Clustering Tools — as well as a 4-panel pane of the ensembles from ECMWF EPS, NOAA GEFS, and Canada GEPS + the 103 member mean in the animation above.
Rather than posting too many maps and filling your email inbox, you can see these Clustering Tools freely at WeatherTrader.com: and continue to support these products (which will earn any subscriber to this Substack a golden ticket into the Weather Trader interface as founder/supporter, and friend of Ryan)
Lower 48 Temperatures
Friday Highs and Anomaly | February 16, 2024
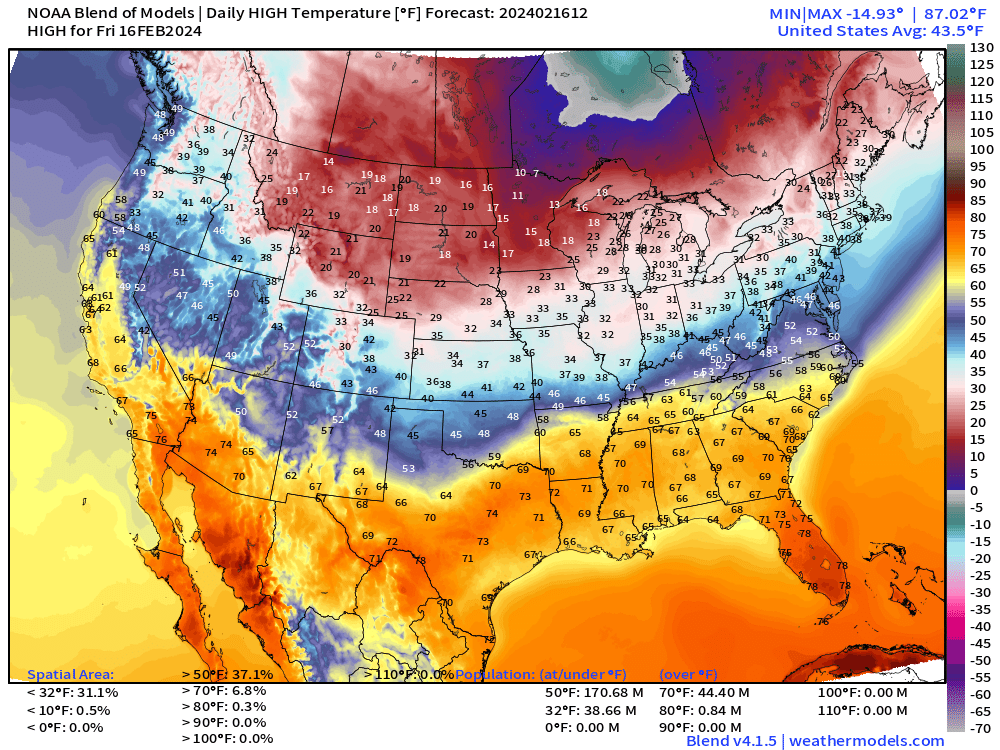
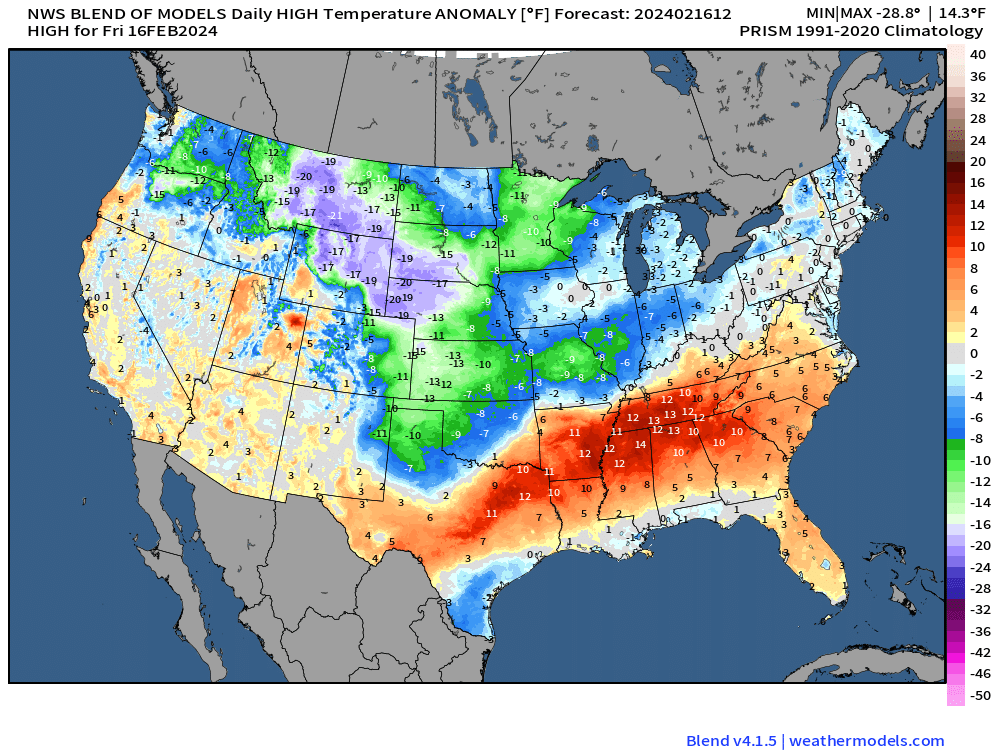
Saturday Highs and Anomaly | February 17, 2024
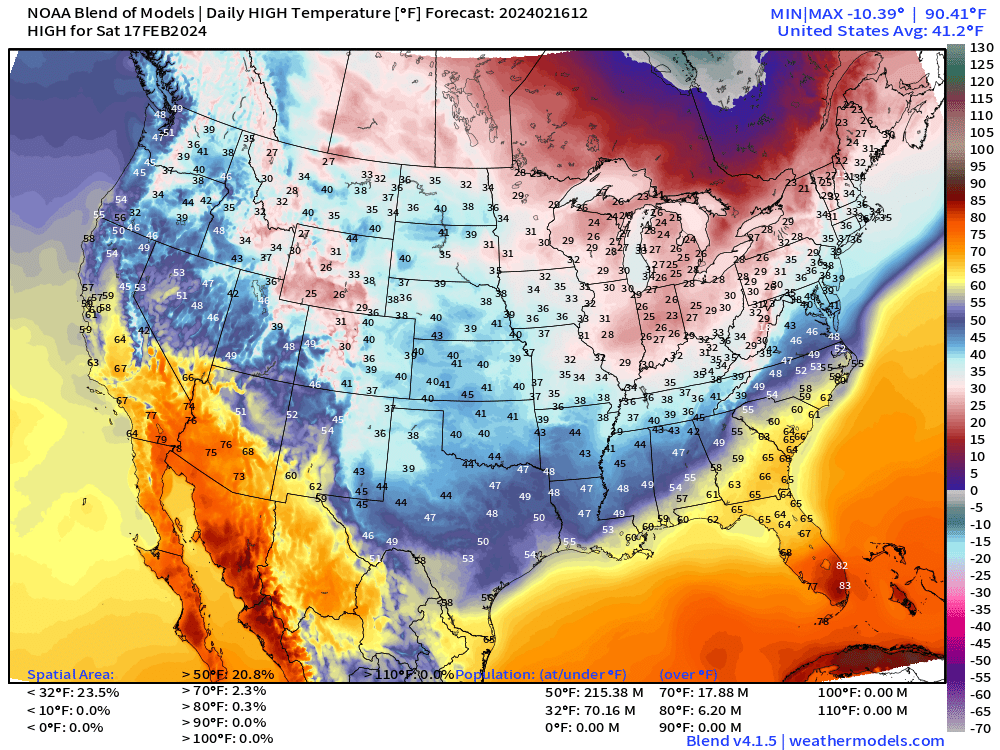
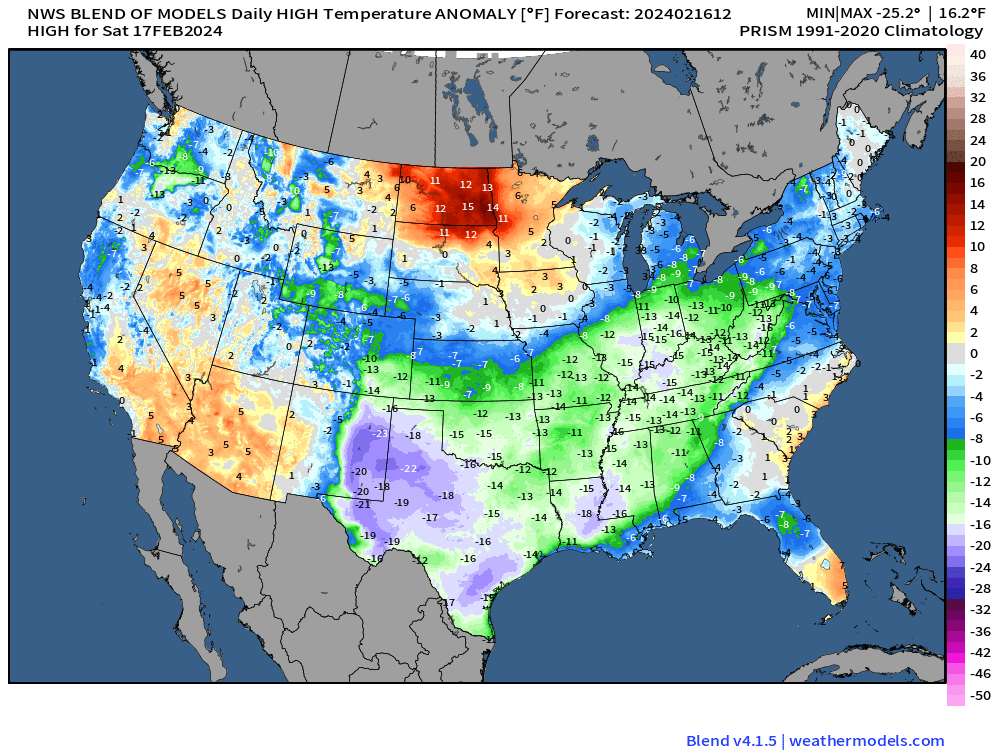
Temperatures compared to normal on Saturday are in the 15-20°F below average from West Texas to the Ohio River Valley. However, that’s short duration as warmth is already returning to the upper-Midwest with above freezing temperatures for highs in the Dakotas.
Sunday Highs | February 18, 2024
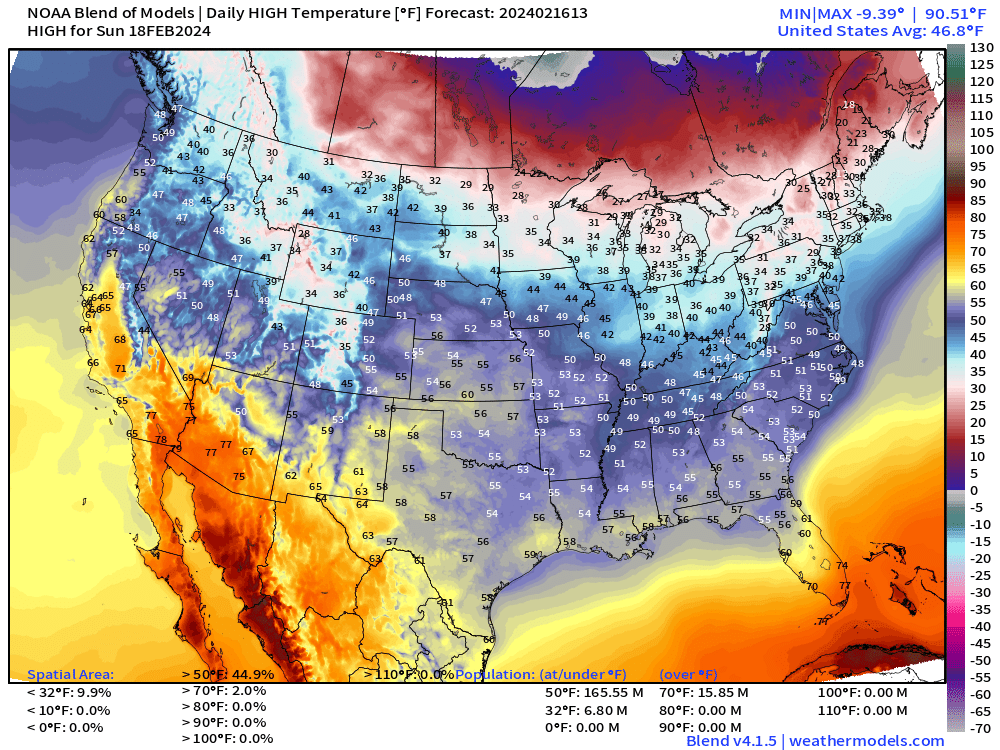
And, there we go. Temperatures moderate under warming sunshine in the 50s. A bit chilly in north Florida, but tolerable. Could be much, much worse considering the coldest day in Florida was February 13, 1899 with Tallahassee at -2°F during the “Great Arctic Outbreak of 1899.”
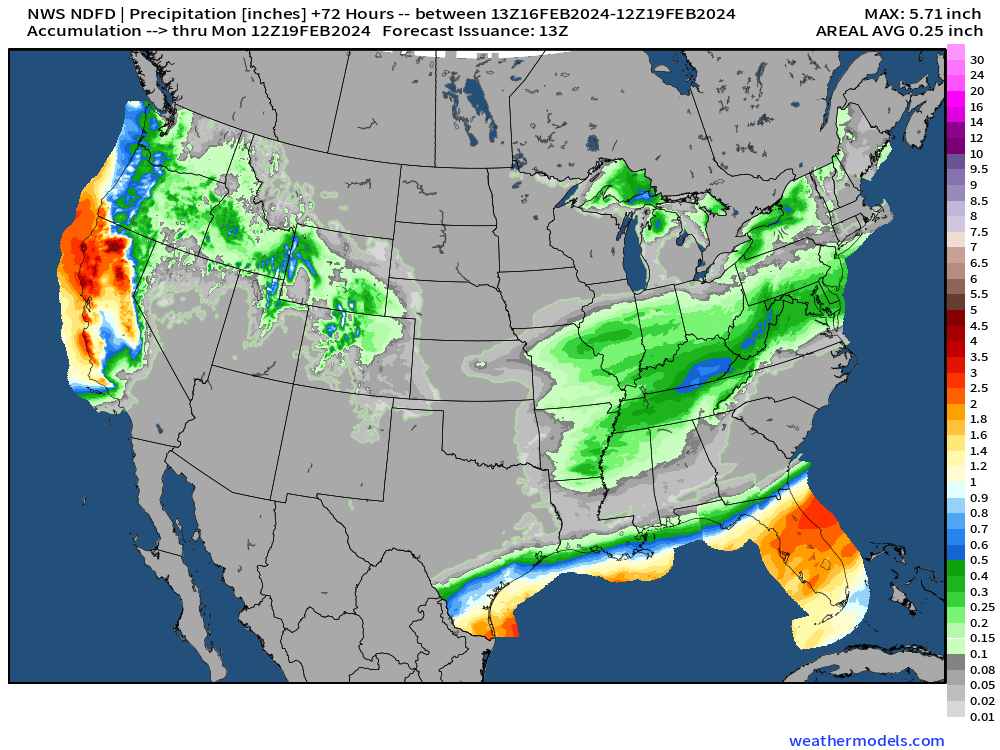
The California precipitation over the next 72-hours is just a warm-up act for a powerful atmospheric river next week.
The 1-2 inches across the Florida peninsula is welcomed with the southern stream moisture plume across the Gulf of Mexico.
(Maps from weathermodels.com and weathertrader.com)
Thank you to my paying subscribers! Consider upgrading to a Yearly Plan if you find these updates valuable and wish to support my development at Weather Trader. Here is a little discount valid until February 20th:
Also, it allows me to provide (usually) interesting and valuable commentary on scientific topics on X. Feel free to say hello and follow on X/Twitter (@RyanMaue)
*Information about Clustering Tools
As part of new development tools that you’d typically pay a ton to view, I’ve posted in real-time a large selection of clustering tools. Please overlook the table of contents presentation on the website at Weather Trader, as that’s the final task to make a functional website.
The following is 153 ensembles from the last 3 00z/12z EPS ensemble cycles valid on Day 14 or February 27. I use 4 clusters of the 500 hPa height pattern (EOFs) and then composite temperature anomaly from the various ensembles. This is a lagged ensemble clustering approach.
This version uses the most recent model cycle (12z) but 3 different ensemble systems including the ECMWF EPS, Canadian GEPS, and NOAA EFS. There are 103 members and they are binned into their respective clusters.
We can then composite other variables including precipitation (anomaly), degree days, and height patterns in order to diagnose the various possible future Day 14s. Also, this is repeated for Asia, Europe, and soon Australia and South America.
- Milepost
- 212 · laid 2024-02-16T15:01:14.161000Z
- Source
- https://weather.substack.com/p/february-16-2024-friday-morning
- Digest
- 8a0a55d8306b92da026dd595f6539e6d7f4bd4ec4c50229e801442dbd817ad79
- Machine
- JSON